 Open Access Article
Creative Commons Attribution 3.0 Unported Licence
Bimetallic NiCe/Lay catalysts facilitated co-pyrolysis of oleic acid and methanol for efficiently preparing anaerobic hydrocarbon fuels
Kai
Zhang
ab,
Xiangyi
Liu
*ab,
Jiajun
Bi
ab,
Amal
BaQais
c,
Ben Bin
Xu
 d,
Mohammed A.
Amin
e,
Ying
Hou
ab,
Xianglong
Liu
ab,
Handong
Li
df,
Hassan
Algadi
 g,
Juan
Xu
*ab and
Zhanhu
Guo
 *d
*d
aKey Laboratory of State Forestry and Grassl and Administration on Highly-Efficient Utilization of Forestry Biomass Resources in Southwest China, Southwest Forestry University, Kunming 650233, China. E-mail: liuxy11@126.com
bCollege of Materials & Chemical Engineering, Southwest Forestry University, Kunming 650224, China. E-mail: 58045846@qq.com
cDepartment of Chemistry, College of Science, Princess Nourah bint Abdulrahman University, P.O. Box 84428, Riyadh 11671, Saudi Arabia
dMechanical and Construction Engineering, Northumbria University, Newcastle Upon Tyne, NE1 8ST, UK. E-mail: zhanhu.guo@northumbria.ac.uk
eDepartment of Chemistry, College of Science, Taif University, P.O. Box 11099, Taif 21944, Saudi Arabia
fCollege of Materials Science and Engineering, Taiyuan University of Science and Technology, Taiyuan, 030024, China
gDepartment of Electrical Engineering, Faculty of Engineering, Najran University, Najran, 11001, Saudi Arabia
First published on 22nd August 2023
Abstract
Bimetallic NiCe/Lay catalysts were prepared using an impregnation method with a Lay molecular sieve as a carrier, and oleic acid (OA) as a model compound of unsaturated fatty acid for catalytic pyrolysis to prepare bio-airline fuel. Based on the reaction products, the reaction pathways of the products under the bimetallic NiCe/Lay catalyst were deduced. The bimetals were dispersed uniformly on the support Lay, and the catalyst retained the structure of the molecular sieve after loading and had good physical properties such as specific surface area and pore space. Under optimal conditions (pyrolysis/catalytic temperature = 500/500 °C, catalyst loading = 1.0 g, feedstock injection volume =0.5 mL min−1, and OA to methanol ratio = 1![[thin space (1/6-em)]](https://www.rsc.org/images/entities/char_2009.gif) :
:![[thin space (1/6-em)]](https://www.rsc.org/images/entities/char_2009.gif) 5), 100% conversion, 92.77% hydrocarbon yield, and 75.06% hydrocarbon yield in the range of 8–17 carbon atoms were obtained over the Ni–3Ce/Lay catalyst. This study provides highly efficient catalysts for upcycling oleic acid and methanol for producing fuel.
5), 100% conversion, 92.77% hydrocarbon yield, and 75.06% hydrocarbon yield in the range of 8–17 carbon atoms were obtained over the Ni–3Ce/Lay catalyst. This study provides highly efficient catalysts for upcycling oleic acid and methanol for producing fuel.
1. Introduction
The aviation industry1,2 is making a significant contribution to the economy, tourism, and ease of travel.3–5 Demand for aviation fuel is also increasing, with a projected increase of 5% per year until 2030.6–8 Therefore, it is crucial to develop an environmentally friendly fuel that does not pollute the environment9 and meets the needs of aviation. The emergence and development of biofuels10 are critical to resolving the energy crisis and environmental pollution issues, as well as attaining long-term economic and environmental development.11,12The development of biofuels has gone through three generations. The first generation of biofuels is based on the fermentation or transesterification of raw materials to produce bioethanol and biodiesel as end products. However, the first-generation biofuel production process is inapplicable to biofuel production since the products created do not fulfill conventional aviation fuel standards. The second-generation biofuel is primarily made from biomass, and the resulting product meets the fuel properties of conventional A1 fuel certification; however, the prepared biofuel typically has a high viscosity and acidity, which can cause nozzle clogging, poor atomization, and combustion, reducing jet engine life. Therefore, the preparation of biofuels needs to be further upgraded to improve the compatibility of the product with A1 fuel. To meet the quality requirements of aviation fuel, good aviation fuel is generally composed of 20% aromatics, 20% cycloalkanes and 60% alkanes with carbon chain lengths generally in the range of 8–17. Except for other applications like making films and drugs,13–16 vegetable fats and oils have been widely studied for their structural composition suitable for the production of biofuel.17–19 Currently, the main methods to prepare biofuel from fats and oils are catalytic hydrogenation, catalytic cracking, and thermal cracking. Compared with catalytic hydrogenation and thermal cracking, catalytic cracking of triglycerides has higher carbon source utilization, low oxygen content, and high cold flow characteristics, and does not require the addition of hydrogen and a high-pressure process, which is a green process.20,21
However, the catalytic pyrolysis reaction of vegetable oil still has some drawbacks, such as a low yield of liquid fuel, difficulty in controlling the product distribution, and ease in producing solid residues, CO2 and CO gas.22 However, the pyrolysis procedure is rather straightforward23,24 and comparable to the traditional petroleum cracking procedure,21,25,26 and the pyrolysis products are primarily hydrocarbon mixtures.26 Therefore, it is worthwhile to conduct additional research to enhance the yield and selectivity of vegetable oil pyrolysis for the generation of liquid fuel through catalyst modification and reaction parameter adjustment. For example, Wildschut et al.27 tested the effectiveness of various non-homogeneous noble metal catalysts (Ru/C, Ru/TiO2, Ru/Al2O3, Pt/C, and Pd/C) in catalytic hydrotreating of fast pyrolysis oils. In terms of oil yield (up to 60%) and deoxygenation level (up to 90%), the study discovered that the Ru/C catalysts beat the traditional hydrotreating catalysts. The improved product was also less acidic and watery. Oh et al.28 investigated the use of noble metal catalysts (Pd/C, Ru/C, and Pt/C) for hydrodeoxygenation (HDO) to improve the stability of bio-oil. It was shown that the stability of bio-oil was effectively improved after hydrodeoxygenation.
Precious metal catalysts are normally used showing excellent catalytic activity but are limited by the high price of precious metals for industrialization.28–39 A popular area of study is the development of non-precious metal catalysts with high catalytic effects.40–43 A popular area of study is the development of low-loading non-precious metal catalysts with significant catalytic activity.44 The most studied non-precious metal multiphase catalysts include zeolites, metal oxides, aluminosilicates, metal-loaded zeolites, metal–organic skeletons, metal–organic skeletons, etc.45,46 Jahromi et al.47 prepared and studied Ni/SiO2–Al2O3 catalysts for the hydrodeoxygenation of pyrolysis oil. The H/C and O/C atomic ratios of bio-oil changed from 1.29 and 0.29 to 2.36 and 0, respectively, after hydrogenation and upgrading, and the higher calorific value increased from 27.64 to 45.58 MJ kg−1. This greatly improved the physicochemical properties of bio-oil. Wang et al.48 investigated the process of Al-MCM-41 loaded with five elements (La, Ni, P, Ce, and Zr) on a fixed-bed reactor under an N2 atmosphere to explore the performance of oleic acid catalytic pyrolysis conversion. It was shown that the loaded elements mainly existed in the form of active oxides, among which La/Al-MCM-41 showed good anti-coking performance and P/Al-MCM-41 promoted the deoxygenation process due to its high B-acid. The products were mainly hydrocarbons such as alkanes and aromatics, and the carbon number was mainly distributed in the green diesel range of C10–C18, which showed the best deoxygenation performance.
Ni and Ce metals have been receiving more attention in the field of catalysis because of their better catalytic and physical properties.9,49–51 Ni metals are transition metals with good activity and selectivity.52–54 Ce metals have excellent redox ability and are widely used as active agents or active components of catalysts.55 The Ni–Ce/ZrO2 catalysts were prepared27 using co-precipitation, and the deoxidation experiments were carried out in oleic acid under solvent-free conditions. The results showed that when the Ni loading was 20%, the conversion of oleic acid was 98.3% and the deoxygenation rate reached 95.7% with the best deoxygenation effect and the C9–C17 selectivity was 33.9%. In the absence of a hydrogen source, Zhang et al.56 developed Ni/AC catalysts with varying loadings and examined the decarboxylation and aromatization of oleic acid. The method was demonstrated to be more affordable and safer in the absence of an extra hydrogen source, although it only generated 13.8% of aromatics compliant with aviation fuel.
Y-type molecular sieves are widely used as catalysts in catalytic cracking processes due to their high catalytic activity and good thermal and hydrothermal stability. The hydrothermal stability of molecular sieves can be improved by introducing rare earth ions to make the cell parameters of molecular sieves increase, which can inhibit structural collapse and dealumination at high temperatures. For example, Liu et al.57 studied Y-type molecular sieves modified with rare earth La ions and catalytic cracking performance, which showed that LaY molecular sieves had a large number of B acid centers and a certain amount of strong L acid centers, and the catalytic cracking performance of LaY was significantly improved after modification. However, there are fewer studies on the use of Lay for catalytic preparation of bio aviation oil, and it is important to develop Lay-loaded metal-based catalysts for grease vapor upgrading to prepare valuable hydrocarbon fuels.
In this study, the bioaviation fuel components were prepared by the co-pyrolysis of oleic acid and methanol catalyzed by the homemade bifunctional catalyst NiCe/Lay under the conditions of no exogenous H2 hydrogen. The bimetallic NiCe/Lay catalysts were prepared using a straightforward leaching method with Lay as the carrier. The effects of Ni![[thin space (1/6-em)]](https://www.rsc.org/images/entities/char_2009.gif) :
:![[thin space (1/6-em)]](https://www.rsc.org/images/entities/char_2009.gif) Ce ratio (Ni
Ce ratio (Ni![[thin space (1/6-em)]](https://www.rsc.org/images/entities/char_2009.gif) :
:![[thin space (1/6-em)]](https://www.rsc.org/images/entities/char_2009.gif) Ce = 0
Ce = 0![[thin space (1/6-em)]](https://www.rsc.org/images/entities/char_2009.gif) :
:![[thin space (1/6-em)]](https://www.rsc.org/images/entities/char_2009.gif) 1, 1
1, 1![[thin space (1/6-em)]](https://www.rsc.org/images/entities/char_2009.gif) :
:![[thin space (1/6-em)]](https://www.rsc.org/images/entities/char_2009.gif) 1, 1
1, 1![[thin space (1/6-em)]](https://www.rsc.org/images/entities/char_2009.gif) :
:![[thin space (1/6-em)]](https://www.rsc.org/images/entities/char_2009.gif) 2, 1
2, 1![[thin space (1/6-em)]](https://www.rsc.org/images/entities/char_2009.gif) :
:![[thin space (1/6-em)]](https://www.rsc.org/images/entities/char_2009.gif) 3, 1
3, 1![[thin space (1/6-em)]](https://www.rsc.org/images/entities/char_2009.gif) :
:![[thin space (1/6-em)]](https://www.rsc.org/images/entities/char_2009.gif) 5, 5
5, 5![[thin space (1/6-em)]](https://www.rsc.org/images/entities/char_2009.gif) :
:![[thin space (1/6-em)]](https://www.rsc.org/images/entities/char_2009.gif) 1, 3
1, 3![[thin space (1/6-em)]](https://www.rsc.org/images/entities/char_2009.gif) :
:![[thin space (1/6-em)]](https://www.rsc.org/images/entities/char_2009.gif) 1, 2
1, 2![[thin space (1/6-em)]](https://www.rsc.org/images/entities/char_2009.gif) :
:![[thin space (1/6-em)]](https://www.rsc.org/images/entities/char_2009.gif) 1, 1
1, 1![[thin space (1/6-em)]](https://www.rsc.org/images/entities/char_2009.gif) :
:![[thin space (1/6-em)]](https://www.rsc.org/images/entities/char_2009.gif) 0) and process parameters (i.e., pyrolysis temperature, catalytic temperature, methanol to oleic acid ratio, and catalyst dosage) on oleic acid conversion and product distribution were investigated. Furthermore, the reaction pathway and deoxygenation mechanism of catalytic cracking of oleic acid were proposed. The oleic acid catalytic cracking reaction route and deoxygenation mechanism were proposed, and the catalyst deactivation and coke formation causes were also explored. The synthesis of bio-aviation oil from fats and oils was supported theoretically and practically in this study.
0) and process parameters (i.e., pyrolysis temperature, catalytic temperature, methanol to oleic acid ratio, and catalyst dosage) on oleic acid conversion and product distribution were investigated. Furthermore, the reaction pathway and deoxygenation mechanism of catalytic cracking of oleic acid were proposed. The oleic acid catalytic cracking reaction route and deoxygenation mechanism were proposed, and the catalyst deactivation and coke formation causes were also explored. The synthesis of bio-aviation oil from fats and oils was supported theoretically and practically in this study.
2. Materials and methods
2.1. Materials
Ni(NO3)2·6H2O (GR, 99%) and CeH12N3O15 (≥99.99% metals basis) were purchased from Aladdin Company. Commercial molecular sieves Lay (Si/Al ratio ≥5) was purchased from Nankai University Catalysts Co, Ltd, Tianjin, China. Methanol (AR) was supplied by Chengdu Kolon Chemical Co. Oleic acid (AR) was provided by Guangdong Guanghua Technology Co. High purity nitrogen was supplied by Messer, Kunming, China.2.2. Preparation of catalysts
Monometallic catalysts (12% Ce/Lay and 12% Ni/Lay) and a series of bimetallic catalysts with different ratios (xNi–yCe/Lay) were prepared using the impregnation method. Briefly, solution A was formed by dissolving predicted amounts of Ni(NO3)2–6H2O, CeH12N3O15 and citric acid in anhydrous ethanol and deionized water, respectively. To make emulsion B, 3.0 g of Lay molecular sieve was weighed and added to solution A. Emulsion B was added to an oil bath and heated to 80 °C with thorough mixing and heating. After the evaporation of the solvent, the solid was dried in an oven for 12 h. The dried precipitate was crushed and placed in a crucible, which was then heated to 550 °C at 5 °C min−1 and held for 4 h.2.3. Characterizations of the catalysts
Fourier transform infrared spectroscopy (FT-IR), X-ray diffraction (XRD), transmission electron microscopy (TEM), scanning electron microscopy (SEM), NH3-TPD, thermal gravimetric analysis (TG) and N2 adsorption–desorption analysis were used to evaluate the catalysts. FT-IR analysis was done using a Germany Brooke TENSOR27 Fourier transform infrared spectrometer. The KBr pellets for the FTIR samples were prepared as follows: 1–2 mg catalyst sample and about 200 mg KBr powder were put into the agate mortar and ground. The powders were pressed into thin pellets for testing. The test was between 4000–400 cm−1 and 64 scans were performed. X-ray diffraction was performed with a Bruker D8 Advance X-ray diffractometer under the following conditions: copper K-ray source, 40 mA tube current; 2θ range 5°–80°, step size 0.02°, scan rate 2° min−1.NH3-TPD was studied using chemisorption temperature rise software (AutoChem1 II 2920). 100 mg of sample was weighed and pretreated by heating from room temperature to 300 °C at 10 °C min−1. The gas (30 mL min−1) was purged for 1 h and then cooled to 50 °C. Within 1 h, a 10% NH3/He (40 mL min−1) combination was provided until saturation, and then the He gas stream (30 mL min−1) was switched to remove the weakly physisorbed NH3 from the surface. Finally, TCD revealed that NH3 was desorbed to 700 °C under a He atmosphere at a ramp rate of 10 °C min−1.
The ASAP2020 specific surface area and pore size analyzer (Micromeritics, USA) were used to compute the specific surface area, the t-plot technique was used to calculate the microporous pore volume, and the BJH method was used to estimate the pore size distribution. The Brunauer–Emmett–Teller (BET) equation was then used to linearly regress the specific surface area.
TGA was carried out in a TG209F3 thermal analyzer to perform a thermogravimetric examination on the catalyst (NETZSCH, Germany). With a protective gas flow rate of 30 mL min−1, the heating rate was raised to 800 °C at 10 °C min−1.
The apparent morphology was examined using a JSM-5600LV type scanning electron microscope (JEOL, Japan), and the microstructure was examined using a ZEISS GeminiSEM 300 type transmission electron microscope.
2.4. Catalytic co-cracking reaction of oleic acid and methanol
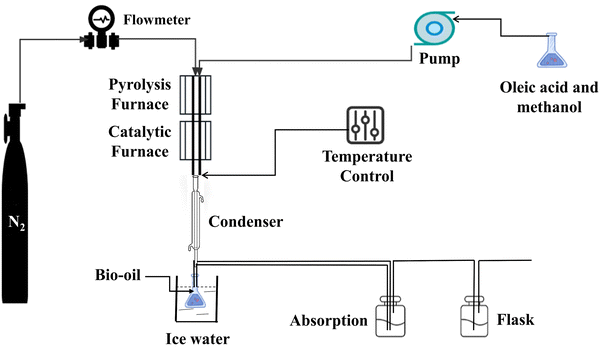
Oleic acid and methanol were co-cracked and catalytically upgraded in a separate fixed bed reactive reactor. The pyrolysis reaction section, the catalytic reaction section, and the collecting section are the three main components of the experimental setup. The RTD heats the chamber in the fixed-bed arrangement, and the temperature in the chamber is sensed by the thermocouple and displayed on the left display. Both the pyrolysis and catalytic upgrading reactions take place in the fixed bed chamber, via a stainless-steel tube that runs through the chamber's pyrolysis and catalytic pyrolysis sections. Nitrogen, oleic acid, and methanol are introduced by a tee tube from the top of the reactor, and the bottom is linked to a cooling unit (connected to the circulating condensate) and lastly to a collecting unit.First, the catalyst is secured by quartz wool in a stainless-steel tube. The gas valve is then adjusted to remove the oxygen from the device and replace it with high-purity nitrogen as a protective gas, and the heating operation is modified to bring the pyrolysis and catalytic parts of the fixed bed to the desired temperature. After reaching the desired temperature, the oleic acid is poured into the reactor, the catalytic pyrolysis process begins, and the product is recovered by cooling and evaluated by GC/MS. The fixed bed is schematically displayed in Fig. 1.
2.5. Gas chromatography–mass spectrometry (GC–MS) analysis
Gas chromatography–mass spectrometry (GC–MS) was used to evaluate the cleavage products using a capillary column HP-5MS (30 m × 0.25 mm × 0.25 mm) with an injector temperature of 280 °C and a splitting ratio of 1![[thin space (1/6-em)]](https://www.rsc.org/images/entities/char_2009.gif) :
:![[thin space (1/6-em)]](https://www.rsc.org/images/entities/char_2009.gif) 10 for high-purity helium. The ramp-up process for the column chamber was as follows: beginning temperature 50 °C and maintained for 5 minutes; ramped up to 280 °C at 5 °C min−1 and sustained for 5 minutes. The ionization method employed was EI with an ionization energy of 70 eV, the scan range electrons per second (m/z) was between 30 and 500 amu, and the ion source temperature was 230 °C. For quantitative analysis, the area normalization approach was applied. The conversion of oleic acid was calculated using eqn (1). The chromatogram area of an individual compound is considered to be proportional to its concentration. The relative selectivity of AHs was calculated according to eqn (2) and (3).
10 for high-purity helium. The ramp-up process for the column chamber was as follows: beginning temperature 50 °C and maintained for 5 minutes; ramped up to 280 °C at 5 °C min−1 and sustained for 5 minutes. The ionization method employed was EI with an ionization energy of 70 eV, the scan range electrons per second (m/z) was between 30 and 500 amu, and the ion source temperature was 230 °C. For quantitative analysis, the area normalization approach was applied. The conversion of oleic acid was calculated using eqn (1). The chromatogram area of an individual compound is considered to be proportional to its concentration. The relative selectivity of AHs was calculated according to eqn (2) and (3). | (1) |
![[thin space (1/6-em)]](https://www.rsc.org/images/entities/char_2009.gif) acid is the number of moles of oleic acid.
acid is the number of moles of oleic acid. | (2) |
 | (3) |
3. Results and discussion
3.1. Catalyst properties
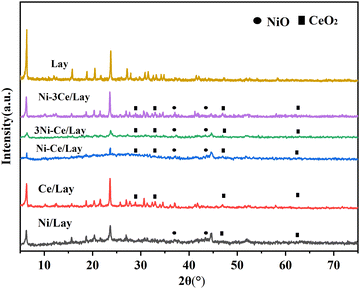
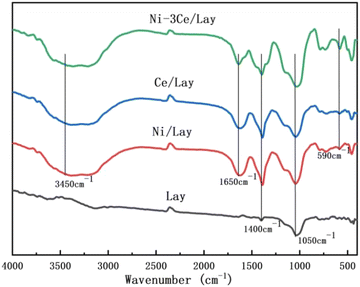
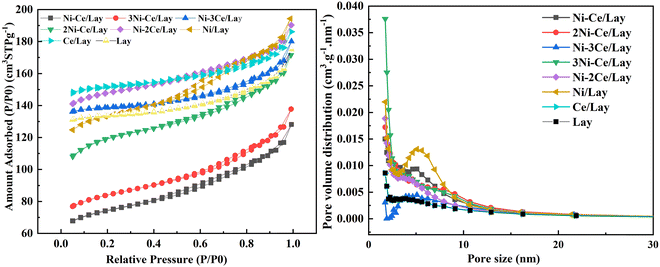
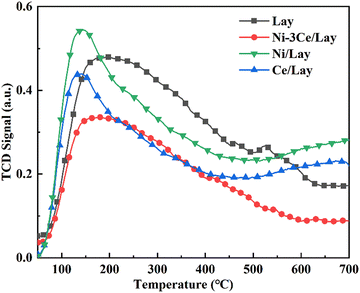
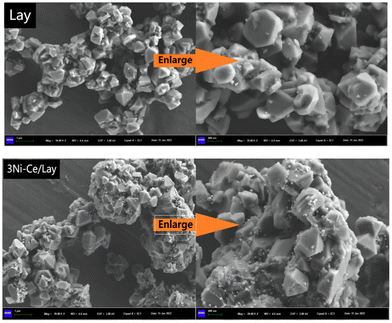
Fig. 2 shows the XRD patterns of Lay and NiCe/Lay catalysts. The FTIR spectra of the Lay carrier and the metal-loaded NiCe/Lay catalysts are depicted in Fig. 3. The N2 adsorption–desorption isotherms and pore size distribution of NiCe/Lay catalysts with different ratios are shown in Fig. 4. The TPD-NH3 profiles of the Lay carrier and the catalyst following metal loading are presented in Fig. 5. The scanning electron microscopy (SEM) images and the transmission electron microscopy (TEM) of the carrier Lay and the catalyst Ni–3Ce/Lay after loading the bimetal are presented in Fig. 6 and Fig. 7, respectively.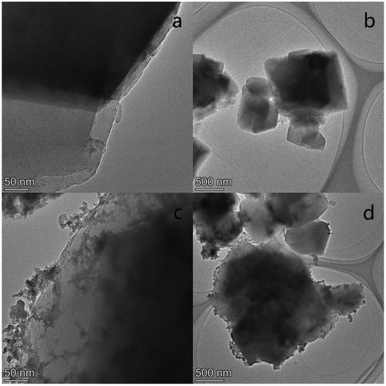 | ||
| Fig. 7 TEM microstructures of Lay and Ni–3Ce/Lay (a) and (b) Lay molecular sieve; (c) and (d) Ni–3Ce/Lay. | ||
| Sample | S BET (m2 g−1) | S Micro (m2 g−1) | S ext (m2 g−1) | V total (mL g−1) | V meso (mL g−1) | V micro (mL g−1) | D pore size (nm) |
|---|---|---|---|---|---|---|---|
| a From N2 absorption measurement (BET method). b P/P0 = 0.95, from BJH analysis. c From N2 absorption measurement (t-plot method). d By difference method. e From N2 absorption measurement (BET method). | |||||||
| Lay | 687.02 | 620.03 | 67.10 | 0.381 | 0.140 | 0.240 | 2.30 |
| Ce/Lay | 460.50 | 423.99 | 36.51 | 0.269 | 0.049 | 0.219 | 2.34 |
| Ni/Lay | 414.25 | 318.23 | 96.02 | 0.279 | 0.114 | 0.164 | 2.69 |
| Ni–3Ce/Lay | 452.15 | 378.72 | 73.42 | 0.279 | 0.082 | 0.196 | 2.43 |
| Ni–2Ce/Lay | 418.85 | 393.87 | 24.98 | 0.256 | 0.051 | 0.204 | 2.44 |
| Ni–Ce/Lay | 372.15 | 258.79 | 113.35 | 0.244 | 0.109 | 0.134 | 2.63 |
| 2Ni–Ce/Lay | 263.30 | 179.10 | 84.19 | 0.192 | 0.099 | 0.093 | 2.92 |
| 3Ni–Ce/Lay | 233.99 | 154.21 | 79.78 | 0.177 | 0.097 | 0.080 | 3.03 |
As indicated in Table 1, the catalyst's specific surface area after metal loading decreased while the pore size rose as compared to the Lay carrier. This is due to the inclusion of metals, some of which penetrate into the carrier or collect on its surface, generating a degree of obstruction and a decrease in its specific surface area. Furthermore, because the majority of the obstructed pores are micropores, the total average pore size is increased.66 In general, mesoporous catalysts with appropriate pore size, volume, and specific surface area can offer conditions for catalytic pyrolysis of bio-based macromolecules.67 The data clearly shows that Ni–3Ce/Lay has a large specific surface area and appropriate pore size to offer adequate conditions for the catalytic cracking of oleic acid.
| Catalyst | Lay | Ni/Lay | Ce/Lay | Ni–3Ce/Lay |
|---|---|---|---|---|
| Total acid quantity | 125.38 | 87.56 | 84.11 | 105.98 |
3.2. Effect of bimetallic catalysts with different loading ratios on hydrocarbon products from co-pyrolysis of oleic acid and methanol
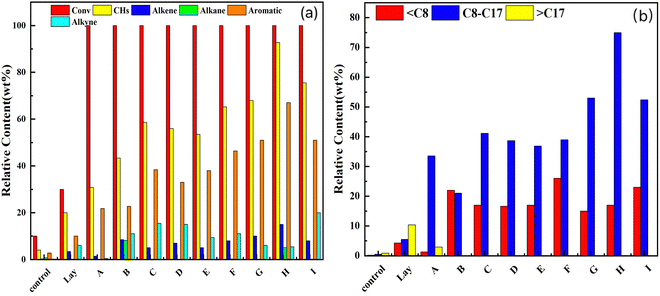
The effects of Ni/Lay, Ce/Lay, and bimetallic catalysts with different loading Ni/Ce ratios on the conversion and selectivity of oleic acid and methanol co-pyrolysis to hydrocarbon products are shown in Fig. 8. The conversion of oleic acid by the mono/bimetallic catalysts loaded with the Lay molecular sieve was more than 99.5%, as shown in the figure, indicating that the manufactured ones had a superior catalytic pyrolysis impact on oleic acid. The selectivity of the products varied greatly, which might be connected to the acidity and structure of the catalyst. When combined with the examination of NH3-TPD data, it suggests that catalysts with a higher acidity have a superior catalytic activity and may boost the deoxygenation of oleic acid more effectively, i.e. catalysts with higher Lewis and Brønsted concentrations can greatly increase the selectivity of the hydrocarbons (such as Ni–3Ce/Lay).The monometallic catalysts (Ni/Lay) showed poor hydrodeoxygenation and low C8–C17 content in the products, which indicated lower decarboxylation and decarbonylation activities of Ni/Lay.66 When the Ce metal was added to the catalyst because of the comparatively large particle size of the Ce metal, the specific surface area and pore volume increased throughout the modification process, increasing the acid content and catalytic activity of the bimetallic loaded catalyst and thereby improving hydrocarbon product selectivity. As a result, bimetallic-loaded catalysts have a greater catalytic and selective impact than monometallic catalysts and carriers.From the picture, the hydrocarbons in the product are olefins, alkanes, aromatics, and alkynes. The aromatics content is relatively high and the olefin content is relatively low. When no catalyst is added, the oleic acid only undergoes pyrolysis at high temperatures without catalytic reforming. Thus, the product contains more oxygenated compounds and less deoxygenated hydrocarbons. When a catalyst is introduced into the reaction system, with the acidic sites participating in the reaction, the oleic acid not only undergoes pyrolysis but also promotes deoxygenation. Volatile gases such as CO, CO2, H2O, CH4, and others keep oxygen out of the reaction system.68 Doping Ni and Ce bimetals increases the number of strong acid sites, and the synergistic impact of the two enhances the hydrocarbon percentage in the oleic acid-cracking products. The rise in oleic acid conversion and hydrocarbon selectivity in the product is attributable, on one hand, to an increase of strong acid sites and total acid quantity in the loaded catalyst system, and on the other hand, to a change in the specific surface area of the loaded catalyst. The BET test findings show that the specific surface area of the loaded catalyst is lowered, but it remains in the 200–500 m2 g−1 range. This allows the pyrolysis gas to enter the catalyst more easily and to be catalyzed better with the right pore size.
According to the number of carbon atoms, the hydrocarbons in cracking products can be categorized as C8, C8–C17, >C17, where hydrocarbon products with the number of carbon atoms corresponding to C8–C17 can be utilized as aviation fuel.52Fig. 8b shows the distribution of different numbers of carbon atoms. The figure shows that the number of hydrocarbon products conforming to the aviation fuel is not high without the inclusion of catalysts, however, the addition of catalysts results in a large rise in the content of aviation fuel in the products.
In order to provide the hydrocarbon content in the final product as well as the C8–C17 content in the hydrocarbons, the carrier was therefore modified using loading metals. The synergistic effect between the Lay molecular sieve and metal oxides leads to the formation of short-chain alkanes and olefins to obtain small molecule hydrocarbons due to the carbon chain breakage during the cracking process. The hydrocarbon content in the product conforming to C8–C17 is only 3.36% when no Ce element is present, while the yield of hydrocarbon conforming to C8–C17 reaches 75.06% over the Ni–3Ce/Lay catalyst. The number of carbon atoms C8–C17 hydrocarbon content increases first and then decreases with the increase of Ce elements, which is due to the aromatization of short-chain alkanes and olefins by cyclization of oleic acid under the action of the active site to form aromatic hydrocarbons.69 In conclusion, the inclusion of Ni metal efficiently improved the oleic acid conversion, and the addition of Ce metal resulted in the increased dispersion on the catalyst surface.70
Aviation oil is composed of hydrocarbons containing different fractions of alkanes, aromatics, and olefins, with an aromatic hydrocarbon content below 20% and olefin content below 2–3%, and the number of carbon atoms in the hydrocarbon components of aviation oil is 8–17.71,72 The pyrolysis product obtained in this study showed that the main product C8–C17 reached 75.06%, but the aromatics content in the product was high because a large number of alkanes were converted into aromatics during aromatization, so the product could not be directly used as jet fuel. If the cracking product is to be used as jet fuel, the product can be further hydrogenated to convert the aromatic hydrocarbons into cyclic hydrocarbons, reducing the content of aromatic hydrocarbons. It can also be mixed with commercial jet oil (Jet A-1) to meet the standards of jet oil.73
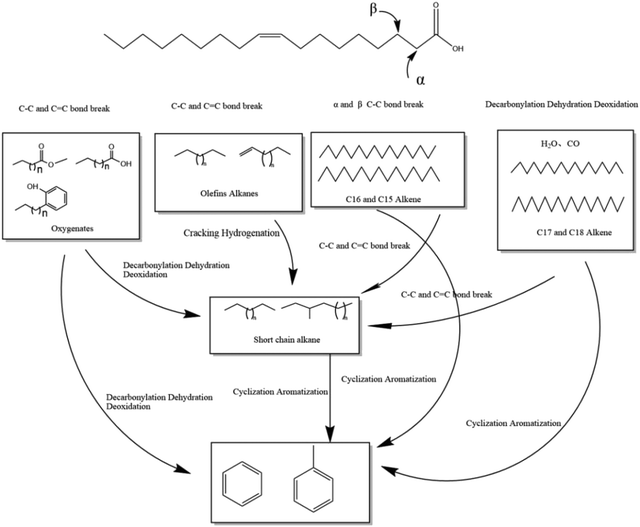
Based on the final product, this study proposes a reaction mechanism for oleic acid cracking. Under an N2 environment, oleic acid was first pyrolyzed to short-chain olefins, alkanes, and oxygenated molecules. Heptene, a saturated hydrocarbon likely formed via the decarboxylation and decarbonylation routes, was discovered in the products. The saturated alkanes with C17 and C18 are perhaps due to oleic acid decarboxylation. Furthermore, a substantial number of saturated hydrocarbons bearing C–C single bonds were discovered in the products, which might be attributed to the breakage of C–C bonds at the β-position and the generation of unsaturated radicals. Oxygenates are decarboxylated and decarbonylated in the presence of catalysts to form hydrocarbons, with oxygen atoms being removed as CO, CO2, and H2O. Methanol is dehydrated in the presence of the catalyst to produce dimethyl ether, which becomes the “hydrocarbon pool”. Methanol and dimethyl ether form C–C to produce olefins. Methanol provides a hydrogen source for the reaction product phenol hydrogenation for aromatic hydrocarbons. Olefins are aromatized by NiCe/Lay, and aromatic hydrocarbons are produced by the addition of methanol, which provides methyl groups for the reaction. Simultaneously, oleic acid and methanol were esterified to generate methyl oleate under the action of a catalyst and at high temperatures. The proposed mechanism is presented in Scheme 1 together with the following reactions.
| CH3OH → CO + 2H2 |
| CH3OH + H2O → CO2 + 3H2 |
| CO + 3H2O → CO2 + H2 |
| C17H33COOH + CH3OH → C17H33COOCH3 + H2O |
| 2CH3OH → CH3OCH3 + H2O |
| C18H34O2 + H2 → C18H38 + H2O |
| C18H34O2 + H2 → C17H36 + CO2 |
| C18H34O2 + H2 → C17H36 + CO + H2O |
3.3. Effect of process parameters on catalytic co-pyrolysis upgrading of oleic acid and the method
Using Ni–3Ce/Lay as a catalyst, the impacts of catalytic pyrolysis process parameters such as pyrolysis temperature, catalytic temperature, oleic acid to methanol ratio, and catalyst dose on the co-pyrolysis of oleic acid and methanol were examined.According to Fig. 9, as the gradual increase of temperature increases, oleic acid is almost completely transformed, but the content of hydrocarbon compounds decreases. As shown in Fig. 9, increasing the pyrolysis temperature from 500 °C to 600 °C reduced the percentage of hydrocarbon components from 92.77% to 16.05% while increasing the content of oxygenated compounds from 7.23% to 83.95%. The rise in temperature at 450–500 °C promotes the removal and decarboxylation process, resulting in the secondary breaking of long-chain molecules to create CO, CO2, and other gases.74 The increase in temperature at 500–600 °C suppresses the effect of hydrodeoxygenation, and reduces the hydrocarbons in the product. But as the pyrolysis temperature increases, the alkyne content in the hydrocarbon content rises accordingly. This is because the isomerization of gases during the pyrolysis process is a heat-absorbing reaction, yet the reaction will be impeded if the temperature is too high.
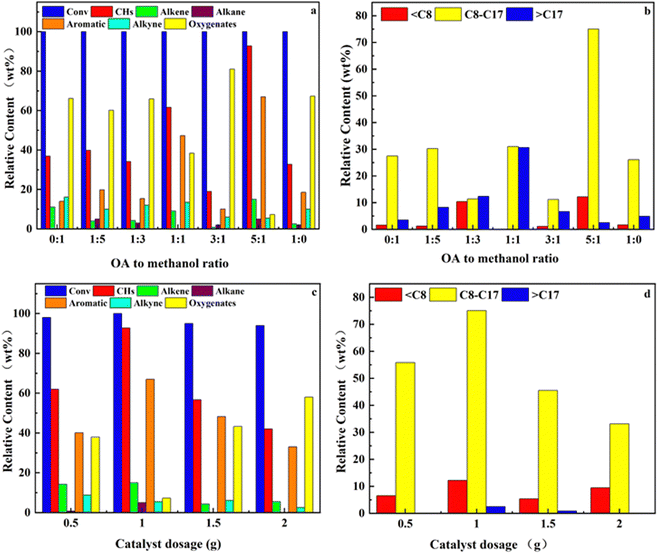
Fig. 10(a and b) depicts the impact of the alcohol–oil ratio on oleic acid conversion and product selectivity. As seen in the graph, the alcohol–oil ratio has a minimal influence on the oleic acid conversion but has a considerable effect on selectivity. The increase in the alcohol–oil ratio enhanced the selectivity of oleic acid hydrocarbon conversion, which is attributable to the hydrogen supply given by methanol for the oleic acid conversion process. The greater the alcohol–oil ratio, the more methanol is replenished and the viscosity in the reaction system is reduced.75 However, excess methanol dilutes the catalyst and affects its participation in the reaction, while a large amount of methanol prevents the interaction between the catalyst and the oleic acid by shielding the active site.76
Fig. 10(c and d) depicts the influence of catalyst dose on oleic acid conversion and product selectivity. As seen in the figure, increasing the catalyst dose from 0.5 to 1 g enhanced the selectivity of hydrocarbons in the products due to the increase in catalyst, which increased the number of active sites participating in the reaction.77 However, the hydrocarbon selectivity decreased instead with a further increase in the catalyst dosage. This may be due to the fact that some active sites were shielded due to carbon accumulation and agglomeration of catalysts at high temperatures during the catalytic process, which resulted in fewer catalysts actually participating in the catalysis and thus affecting the catalytic effect.
3.4. Stability and deactivation analysis of catalysts
The industrial usage of catalysts must include catalyst stability and recoverability. Hence, the influence of catalyst cycle number on the catalytic conversion of oleic acid and methanol co-pyrolysis was explored, and the causes of catalyst deactivation were investigated. Ni–3Ce/Lay catalysts were reused under the following conditions: pyrolysis/catalytic temperature 500/500 °C, catalyst dose 1 g, alcohol–oil ratio 1![[thin space (1/6-em)]](https://www.rsc.org/images/entities/char_2009.gif) :
:![[thin space (1/6-em)]](https://www.rsc.org/images/entities/char_2009.gif) 5, feed rate following the reaction, the spent catalyst was washed with ethanol, vacuum-dried, and then calcined in a tube furnace at 550 °C for 4 hours to remove residual organic matter, allowing the catalyst to be regenerated and utilized in the next test under the identical reaction circumstances. The conversion of oleic acid and hydrocarbon products (C8–C17) was reduced somewhat after the catalyst was reused three times, as shown in Fig. 11, but the decline was not significant, and the reuse effect was satisfactory. The conversion of oleic acid by a fresh catalyst, a single catalyst, and two catalysts was 100%, 98.5%, and 93.8%, respectively. After three applications, the catalyst's selectivity for hydrocarbons (C8–C17) and oxygen removal was reduced by 9.24% and 4.74%, respectively. It is likely that coking clogged parts of the catalyst's pores and acidic sites.67
5, feed rate following the reaction, the spent catalyst was washed with ethanol, vacuum-dried, and then calcined in a tube furnace at 550 °C for 4 hours to remove residual organic matter, allowing the catalyst to be regenerated and utilized in the next test under the identical reaction circumstances. The conversion of oleic acid and hydrocarbon products (C8–C17) was reduced somewhat after the catalyst was reused three times, as shown in Fig. 11, but the decline was not significant, and the reuse effect was satisfactory. The conversion of oleic acid by a fresh catalyst, a single catalyst, and two catalysts was 100%, 98.5%, and 93.8%, respectively. After three applications, the catalyst's selectivity for hydrocarbons (C8–C17) and oxygen removal was reduced by 9.24% and 4.74%, respectively. It is likely that coking clogged parts of the catalyst's pores and acidic sites.67
Fig. 12 and 13 show the results of TGA and SEM analysis done on the catalysts used to determine the cause of the reduction in activity.
Fig. 12 shows how the TGA/DTG measurement was used to assess the amount of coking deposition on the catalyst after usage. The material lost bulk in two distinct locations. The first mass loss was attributable to the physisorption of water (below 200 °C). The burning of organic waste and the breakdown of the deposited coke cause the second mass loss, which occurs between 400 and 600 °C. The mass loss rate of the used catalyst is higher than that of the fresh catalyst, as seen in the figure due to the coke deposition after usage.
Fig. 13 depicts the SEM of the Ni–3Ce/Lay catalyst before and after usage. As seen in the picture, the used catalyst agglomerated more than the fresh catalyst, while the produced coke roughened the surface and damaged part of the crystal structures of the used catalyst, resulting in a modest drop in the catalytic activity.
The study shows that under the condition of using methanol as an external hydrogen source, it still has a high conversion rate and product selectivity, which improves the safety of the reaction system. Secondly, the catalytic pyrolysis part of the traditional pyrolysis process is more serious, so adding methanol reduces the carbon deposition, extends the life of the catalyst, and ensures the continuity of the reaction.78
4. Conclusion
The impregnation method was utilized to create monometallic catalysts (i.e., Ni/Lay, Ce/Lay) and bimetallic xNiyCe/Lay catalysts with varying ratios using a Lay molecular sieve as the carrier. The impacts of various catalysts on oleic acid and methanol co-pyrolysis conversion were explored, as were the effects of different process parameters on the oleic acid conversion rate and product selectivity. A reaction mechanism for oleic acid and methanol co-pyrolysis was developed. Because of the synergistic effect of Ni–Ce and the superior performance of the Lay carrier, the Ni–3Ce/Lay catalyst demonstrated remarkable catalytic pyrolysis ability and great selectivity for hydrocarbon products. The addition of Ce improved the Ni dispersion and stability, as well as the pore size and specific surface area, leading to an increase in the total acid value and reactivity. At a pyrolysis temperature of 500 °C, a catalytic temperature of 500 °C, a catalyst mass of 1 g, and an alcohol-to-oil ratio of 5![[thin space (1/6-em)]](https://www.rsc.org/images/entities/char_2009.gif) :
:![[thin space (1/6-em)]](https://www.rsc.org/images/entities/char_2009.gif) 1, the oleic acid conversion was 100% and hydrocarbon selectivity was 92.77%, with 75.06% for 8–17 carbon atoms. Aviation fuel is a hydrocarbon composed of different proportions of alkanes, aromatics and olefins, in which the aromatics content is less than 20%, the olefin content is less than 2%∼3%, and the number of carbon atoms is mainly distributed in 8–17. The main product obtained in this study, C8–C17, is similar to jet fuel. However, because of the high aromatics content in the product, it cannot be directly used as jet fuel, so further hydrogenation or mixing with other jet oil is needed to meet the requirements. This study offers an alternative for the development and use of alternative biomass like fats and oils. With high specific surface areas, the produced NiCe/Lay can serve as adsorbents for environmental applications79–81 or functional polymer nanocomposites.82–85
1, the oleic acid conversion was 100% and hydrocarbon selectivity was 92.77%, with 75.06% for 8–17 carbon atoms. Aviation fuel is a hydrocarbon composed of different proportions of alkanes, aromatics and olefins, in which the aromatics content is less than 20%, the olefin content is less than 2%∼3%, and the number of carbon atoms is mainly distributed in 8–17. The main product obtained in this study, C8–C17, is similar to jet fuel. However, because of the high aromatics content in the product, it cannot be directly used as jet fuel, so further hydrogenation or mixing with other jet oil is needed to meet the requirements. This study offers an alternative for the development and use of alternative biomass like fats and oils. With high specific surface areas, the produced NiCe/Lay can serve as adsorbents for environmental applications79–81 or functional polymer nanocomposites.82–85
Conflicts of interest
There are no conflicts to declare.Acknowledgements
The authors acknowledge the financial support from the National Natural Science Foundation of China (32360362), the Innovation and Entrepreneurship Training Program for College Students in Yunnan Province (20200153012 and 20221364003), and the Major Science and Technology Project of Yunnan (202102AE090042). The authors acknowledge the financial support from Princess Nourah bint Abdulrahman University Researchers Supporting Project number (PNURSP2023R230), Princess Nourah bint Abdulrahman University, Riyadh, Saudi Arabia.References
- A. Karthik, D. S. Chiniwar, M. Das, P. P. M. P. Prabhu, P. A. Mulimani, K. Samanth and N. Naik, Eng. Sci., 2021, 16, 129–145 CAS.
- D. M. Bushnell, Eng. Sci., 2021, 16, 5–8 Search PubMed.
- G.-H. Dong, F.-L. Guo, Z. Sun, Y.-Q. Li, S.-F. Song, C.-H. Xu, P. Huang, C. Yan, N. Hu and S.-Y. Fu, Adv. Compos. Hybrid Mater., 2022, 5, 1799–1811 CrossRef CAS.
- K. Zhang, L. Zheng, M. A. Aouraghe and F. Xu, Adv. Compos. Hybrid Mater., 2022, 5, 872–883 CrossRef CAS.
- J. Min, J. Hu, C. Sun, H. Wan, P. Liao, H. Teng and J. Lin, Adv. Compos. Hybrid Mater., 2022, 5, 651–678 CrossRef CAS.
- M. Molefe, D. Nkazi and H. E. Mukaya, Energy Fuels, 2019, 33, 5918–5932 CrossRef CAS.
- L. Gibson, E. N. Wilman and W. F. Laurance, Trends Ecol. Evol., 2017, 32, 922–935 CrossRef PubMed.
- K. Routray, K. J. Barnett and G. W. Huber, Energy Technol., 2017, 5, 80–93 CrossRef CAS.
- M. Eqi, C. Shi, J. Xie, F. Kang, H. Qi, X. Tan, Z. Huang, J. Liu and J. Guo, Adv. Compos. Hybrid Mater., 2022, 6, 5 CrossRef.
- L. Mu, Y. Dong, L. Li, X. Gu and Y. Shi, ES Mater. Manuf., 2021, 11, 72–80 CAS.
- D. D. Bala and D. Chidambaram, RSC Adv., 2016, 6, 14626–14634 RSC.
- C.-H. Lin and W.-C. Wang, Renewable Sustainable Energy Rev., 2020, 132, 110109 CrossRef CAS.
- O. M. Atta, S. Manan, M. Ul-Islam, A. A. Q. Ahmed, M. W. Ullah and G. Yang, Adv. Compos. Hybrid Mater., 2022, 5, 973–990 CrossRef CAS.
- J.-L. Su, J. Wang, X.-N. Fu, L. Hou, P. Zhu, K. Zhang, H.-W. Li, Y. Hou, X.-Y. Liu and J. Xu, Adv. Compos. Hybrid Mater., 2022, 5, 1268–1279 CrossRef CAS.
- J. Yan, Y. Niu, C. Wu, Z. Shi, P. Zhao, N. Naik, X. Mai and B. Yuan, Adv. Compos. Hybrid Mater., 2021, 4, 552–561 CrossRef CAS.
- X. Fu, J. Su, L. Hou, P. Zhu, Y. Hou, K. Zhang, H. Li, X. Liu, C. Jia and J. Xu, Adv. Compos. Hybrid Mater., 2021, 4, 685–695 CrossRef CAS.
- S. Liu, Q. Zhu, Q. Guan, L. He and W. Li, Bioresour. Technol., 2015, 183, 93–100 CrossRef CAS PubMed.
- M. Anand, S. A. Farooqui, R. Kumar, R. Joshi, R. Kumar, M. G. Sibi, H. Singh and A. K. Sinha, Fuel Process. Technol., 2016, 151, 50–58 CrossRef CAS.
- C. AlGemayel, J. Zeaiter, S. Talih, N. A. Saliba and A. Shihadeh, Eng. Sci., 2023, 23, 885 CAS.
- R. Pan, M. Jia, Y. Li, X. Li and T. Dou, Chinese J. Chem. Eng., 2014, 22, 1237–1242 CrossRef CAS.
- C. AlGemayel, E. Honein, A. E. Hellani, R. Salman, N. A. Saliba, A. Shihadeh and J. Zeaiter, Eng. Sci., 2022, 20, 162–179 CAS.
- X. Hu and M. Gholizadeh, Renewable Sustainable Energy Rev., 2020, 134, 110124 CrossRef CAS.
- X. Meng, H. Yang, Z. Lu and Y. Liu, Adv. Compos. Hybrid Mater., 2022, 5, 2948–2963 CrossRef CAS.
- D. Xu, G. Huang, L. Guo, Y. Chen, C. Ding and C. Liu, Adv. Compos. Hybrid Mater., 2022, 5, 113–129 CrossRef CAS.
- D. Pan, F. Su, H. Liu, C. Liu, A. Umar, L. C. CastaÃeda, H. Algadi, C. Wang and Z. Guo, ES Mater. Manuf., 2021, 11, 3–15 CAS.
- M. V. Singh, Eng. Sci., 2022, 19, 285–291 CAS.
- J. Wildschut, F. H. Mahfud, R. H. Venderbosch and H. J. Heeres, Ind. Eng. Chem. Res., 2009, 48, 10324–10334 CrossRef CAS.
- H. Lu and J. Yao, Current Organic Chem., 2014, 10, 1365–1372 CrossRef.
- Y. Zhao, Environ. Chem. Lett., 2014, 12, 185–190 CrossRef CAS.
- D. Ping, F. Yi, G. Zhang, S. Wu, S. Fang, K. Hu, B. B. Xu, J. Ren and Z. Guo, J. Mater. Sci. Technol., 2023, 142, 1–9 CrossRef.
- X. Jiang, S. Chen, X. Zhang, L. Qu, H. Qi, B. Wang, B. Xu and Z. Huang, Adv. Compos. Hybrid Mater., 2023, 6, 9 CrossRef CAS.
- K. Xie, S. Wei, A. Alhadhrami, J. Liu, P. Zhang, A. Y. Elnaggar, F. Zhang, M. H. H. Mahmoud, V. Murugadoss, S. M. El-Bahy, F. Wang, C. Li and G. Li, Adv. Compos. Hybrid Mater., 2022, 5, 1423–1432 CrossRef CAS.
- Z. Ding, Z. Tian, X. Ji, H. Dai and C. Si, Adv. Compos. Hybrid Mater., 2022, 5, 2138–2153 CrossRef CAS.
- Z. Li, W. Xie, F. Yao, A. Du, Q. Wang, Z. Guo and H. Gu, Adv. Compos. Hybrid Mater., 2022, 5, 2092–2105 CrossRef CAS.
- S. L. Hamukwaya, Z. Zhao, H. Hao, H. M. Abo-Dief, K. M. Abualnaja, A. K. Alanazi, M. M. Mashingaidze, S. M. El-Bahy, M. Huang and Z. Guo, Adv. Compos. Hybrid Mater., 2022, 5, 2620–2630 CAS.
- L. Dai, X. Li, L. Zhang, P. Ma, J. Guan and W. Yu, Adv. Compos. Hybrid Mater., 2022, 5, 2285–2296 CrossRef CAS.
- S. Sarwar, M.-C. Lin, M. R. Ahasan, Y. Wang, R. Wang and X. Zhang, Adv. Compos. Hybrid Mater., 2022, 5, 2339–2352 CrossRef CAS.
- J. Zheng, Y. Zhang, C. Jing, H. Zhang, Q. Shao and R. Ge, Adv. Compos. Hybrid Mater., 2022, 5, 2406–2420 CrossRef CAS.
- A. B. Ali Baig, V. Rathinam and V. Ramya, Adv. Compos. Hybrid Mater., 2021, 4, 114–126 CrossRef CAS.
- T. Tian, Y. Cheng, Z. Sun, K. Huang, M. Lei and H. Tang, Adv. Compos. Hybrid Mater., 2022, 6, 7 CrossRef.
- P. L. Meena, K. Poswal, A. K. Surela and J. K. Saini, Adv. Compos. Hybrid Mater., 2022, 6, 16 CrossRef.
- C.-Y. Chen and C.-C. Tseng, Adv. Compos. Hybrid Mater., 2023, 6, 20 CrossRef CAS.
- Y. Li, L. Li, S. Luo, X. Huang, J. Shen, C. Jiang and F. Jing, Adv. Compos. Hybrid Mater., 2021, 4, 793–805 CrossRef CAS.
- P. Sun, S. Zhou, Y. Yang, S. Liu, Q. Cao, Y. Wang, T. Wågberg and G. Hu, Adv. Compos. Hybrid Mater., 2022, 5, 3158–3175 CrossRef CAS.
- O. Norouzi, S. Taghavi, P. Arku, S. Jafarian, M. Signoretto and A. Dutta, J. Anal. Appl. Pyrolysis, 2021, 158, 105280 CrossRef CAS.
- M. Thommes and K. A. Cychosz, Adsorption, 2014, 20, 233–250 CrossRef CAS.
- H. Jahromi and F. A. Agblevor, Energy, 2017, 141, 2186–2195 CrossRef CAS.
- F. Wang, F. Yu, Y. Wei, A. Li, S. Xu and X. Lu, J. Anal. Appl. Pyrolysis, 2021, 156, 105146 CrossRef CAS.
- C. Zhi, Q. Wang, B. Wang, D. Li and R. Zhang, RSC Adv., 2015, 5, 66742–66756 RSC.
- C. Zhi, R. Zhang and B. Wang, Molecular Catal., 2017, 438, 1–14 CrossRef CAS.
- S. Yang, C. Shi, K. Qu, Z. Sun, H. Li, B. Xu, Z. Huang and Z. Guo, Carbon Lett., 2023 DOI:10.1007/s42823-42023-00540-42820.
- C. Zhi and W. Yang, Computational Theoretical Chem., 2021, 1197, 113140 CrossRef CAS.
- S. Chen, X. Pan, C. Miao, H. Xie, G. Zhou, Z. Jiao and X. Zhang, J. Saudi Chem. Soc., 2018, 22, 614–627 CrossRef CAS.
- J. Ruan, Z. Chang, H. Rong, T. S. Alomar, D. Zhu, N. AlMasoud, Y. Liao, R. Zhao, X. Zhao, Y. Li, B. B. Xu, Z. Guo, Z. M. El-Bahy, H. Li, X. Zhang and S. Ge, Carbon, 2023, 213, 118208 CrossRef CAS.
- W. Liang, X. Shi, Q. Li, S. Ren and G. Yin, Catalysts, 2022, 12, 225 CrossRef CAS.
- Z. Zhang, Z. Chen, X. Gou, H. Chen, K. Chen, X. Lu, P. Ouyang and J. Fu, Ind. Eng. Chem. Res., 2018, 57, 8443–8448 CrossRef CAS.
- M. Fanfei, D. Linhui, M. Wei, D. Yuansheng and Q. Jun, Catal. Lett., 2022, 152, 745–754 CrossRef.
- Z. Zhang, H. Chen, C. Wang, K. Chen, X. Lu, P. Ouyang and J. Fu, Fuel, 2018, 230, 211–217 CrossRef CAS.
- Z. Wang, X. Cheng, Y. Xu, Z. Wang, C. Ma and X. Zhang, React. Kinet., Mech. Catal., 2021, 132, 671–694 CrossRef CAS.
- N. S. Hassan, A. A. Jalil, M. A. H. Satar, C. N. C. Hitam, F. F. A. Aziz, A. A. Fauzi, M. A. A. Aziz and H. Bahruji, Top. Catal., 2020, 63, 1005–1016 CrossRef CAS.
- A. Traitangwong, X. Guo, V. Meeyoo and C. Li, Ind. Eng. Chem. Res., 2020, 59, 13440–13449 CrossRef CAS.
- G. Allaedini, S. M. Tasirin and P. Aminayi, Chem. Pap., 2016, 70, 231–242 CAS.
- W. Cui, D. Zhu, J. Tan, N. Chen, D. Fan, J. Wang, J. Han, L. Wang, P. Tian and Z. Liu, Chin. J. Catal., 2022, 43, 1945–1954 CrossRef CAS.
- P. Lv, L. Yan, Y. Liu, M. Wang, W. Bao and F. Li, J. Energy Inst., 2020, 93, 1354–1363 CrossRef CAS.
- C. Zhou, Q. Gao, W. Luo, Q. Zhou, H. Wang, C. Yan and P. Duan, J. Taiwan Inst. Chem. Eng., 2015, 52, 147–157 CrossRef CAS.
- Z. Zhang, Q. Yang, H. Chen, K. Chen, X. Lu, P. Ouyang, J. Fu and J. G. Chen, Green Chem., 2018, 20, 197–205 RSC.
- Y. Zheng, J. Wang, C. Liu, Y. Lu, X. Lin, W. Li and Z. Zheng, Renewable Energy, 2020, 154, 797–812 CrossRef CAS.
- A. Makdee, K. C. Chanapattharapol, P. Kidkhunthod, Y. Poo-arporn and T. Ohno, RSC Adv., 2020, 10, 26952–26971 RSC.
- Y. C. Sharma and B. Singh, Fuel Process. Technol., 2010, 91, 1267–1273 CrossRef CAS.
- Y.-T. Wang, Z. Fang and F. Zhang, Catal. Today, 2019, 319, 172–181 CrossRef CAS.
- I. Yeboah, X. Feng, K. R. Rout and D. Chen, Ind. Eng. Chem. Res., 2021, 60, 15095–15105 CrossRef CAS.
- S. Popov and S. Kumar, Energy Fuels, 2015, 29, 3377–3384 CrossRef CAS.
- P. Chintakanan, T. Vitidsant, P. Reubroycharoen, P. Kuchonthara, T. Kida and N. Hinchiranan, Fuel, 2021, 293, 120472 CrossRef CAS.
- I. Y. Mohammed, Y. A. Abakr and R. Mokaya, Waste Biomass Valorization, 2020, 11, 2935–2947 CrossRef CAS.
- J. S. Santos, J. A. Dias, S. C. L. Dias, J. L. de Macedo, F. A. C. Garcia, L. S. Almeida and E. N. C. B. de Carvalho, Appl. Catal., A, 2012, 443–444, 33–39 CrossRef CAS.
- O. Ilgen, Fuel Process. Technol., 2014, 124, 134–139 CrossRef CAS.
- G. E. do Nascimento, M. Duarte and C. Barbosa, Braz. J. Chem. Eng., 2016, 33, 541–547 CrossRef CAS.
- S. A. Theofanidis, V. V. Galvita, H. Poelman, R. Batchu, L. C. Buelens, C. Detavernier and G. B. Marin, Appl. Catal., B, 2018, 239, 502–512 CrossRef CAS.
- L. Guo, Y. Zhang, J. Zheng, L. Shang, Y. Shi, Q. Wu, X. Liu, Y. Wang, L. Shi and Q. Shao, Adv. Compos. Hybrid Mater., 2021, 4, 819–829 CrossRef CAS.
- C. Yin, C. Wang and Q. Hu, Adv. Compos. Hybrid Mater., 2021, 4, 360–370 CrossRef CAS.
- C. Wang, X. Liu, T. Yang, D. Sridhar, H. Algadi, B. Bin Xu, Z. M. El-Bahy, H. Li, Y. Ma, T. Li and Z. Guo, Sep. Purif. Technol., 2023, 320, 124144 CrossRef CAS.
- H. Yan, X. Dai, K. Ruan, S. Zhang, X. Shi, Y. Guo, H. Cai and J. Gu, Adv. Compos. Hybrid Mater., 2021, 4, 36–50 CrossRef CAS.
- P. Xie, Y. Liu, M. Feng, M. Niu, C. Liu, N. Wu, K. Sui, R. R. Patil, D. Pan, Z. Guo and R. Fan, Adv. Compos. Hybrid Mater., 2021, 4, 173–185 CrossRef CAS.
- F. Ahmed, A. Umar, S. Kumar, N. M. Shaalan, N. Arshi, M. G. Alam, P. M. Z. Hasan, S. M. Ramay, R. Khan, A. Aljaafari and A. Alshoaibi, Adv. Compos. Hybrid Mater., 2022, 6, 19 CrossRef.
- Z. Lin, X. Li, H. Zhang, B. B. Xu, P. Wasnik, H. Li, M. V. Singh, Y. Ma, T. Li and Z. Guo, Inorg. Chem. Front., 2023, 18, 4358–4392 RSC.
| This journal is © The Royal Society of Chemistry and the Centre National de la Recherche Scientifique 2023 |

