An effective strategy for CO2 reduction to C1 products using Cu-embedded MoS2 electrocatalyst: DFT study†
Thamarainathan
Doulassiramane
a,
Natarajan
Arumugam
 b,
Abdulrahman I.
Almansour
b,
Sakkarapalayam M.
Mahalingam
c and
Ramanathan
Padmanaban
b,
Abdulrahman I.
Almansour
b,
Sakkarapalayam M.
Mahalingam
c and
Ramanathan
Padmanaban
 *a
*a
aDepartment of Chemistry, School of Physical Chemical and Applied Sciences, Pondicherry University, Puducherry-605 014, India. E-mail: rpn.che@pondiuni.edu.in
bDepartment of Chemistry, College of Science, King Saud University, P.O. Box 2455, Riyadh 11451, Saudi Arabia
cDepartment of Chemistry, Purdue University, 720 Clinic Drive, West Lafayette, Indiana 47907, USA
First published on 15th March 2023
Abstract
Excessive emission of CO2 has caused a critical greenhouse effect that is emerging as a major threat to the environment. Electrocatalytic reduction of CO2 is an advanced technology where chemically inert CO2 is reduced and can be used to produce value-added fuels or chemicals. In this work, the electrocatalytic performance of a single Cu atom embedded in a MoS2 monolayer with a sulfur vacancy for the electroreduction of CO2 is studied using density functional theory (DFT) with dispersion correction. The single Cu atom is stably located in the sulfur vacancy of the MoS2 monolayer. The multiple pathways explored here involve proton–electron pair transfer in the CO2 reduction reaction (CO2RR) to yield a variety of C1 products, such as HCOOH, CO, CH3OH and CH4. These pathways were examined using the corresponding free energy profiles and overpotentials. Among the different C1 products, CH4 formation is more favored via the following optimized pathway: *CO2 → *OCHO → *OCHOH → *OCH2OH → *OCH2 → *OCH3 → *OHCH3 → *OH + CH4 → H2O. The MoS2 monolayer with embedded Cu has enhanced CO2RR activity with an appreciably low overpotential compared to pristine MoS2. This study provides a deep understanding of the structure–reaction relationships and various mechanistic pathways of the CO2RR, and could aid in the design of high-performance single-atom electrocatalysts.
1 Introduction
Over the years, the increasing world population and the advancement of society have increased the stress caused by global energy consumption, which is largely met by burning fossil fuels leading to excessive emission of carbon dioxide (CO2) into the global atmosphere.1 This steady increase in CO2 concentration is causing serious environmental issues, such as global warming, climate change and an imbalance in Earth's carbon cycle.2 To mitigate these issues, various strategies have been used in the recent past. The traditional methods include underground storage,3 physical and chemical separation,4,5 photosynthesis,6 and biological conversion,7 but their technologies are expensive and they have safety issues.8 So, an alternative and effective method is required, and the electrocatalytic CO2 reduction reaction (CO2RR) allows direct conversion of CO2 into high-value added fuels or commodity chemicals, e.g., alcohols or hydrocarbons, powered by excess electricity from renewable energy sources (solar, wind and hydro-power).9 This is a promising way to solve energy-related issues and finding highly effective catalysts which can carry out this conversion has become a hot topic.In the recent past, several authors have extensively studied the electrochemical CO2RR on various metal electrodes, such as Au, Ag and Cu, which activate the inert CO2 and convert it into HCOOH, CO, CH3OH and CH4.10–12 Despite the great progress made, the CO2RR suffers from sluggish kinetics, high overpotential, low faradaic efficiency, poor selectivity and strong competition with the hydrogen evolution reaction (HER).13,14 So, it is a challenging task to find an effective low-cost electrocatalyst with low overpotential and high product selectivity. To tackle these problems, many materials were designed and explored for the synthesis of novel electrode materials including single-atom catalysts (SACs).15 SACs possess unique properties such as high selectivity, activity and atom-utilization efficiency, uniform active sites and their ability to bridge the gap between homogeneous and heterogeneous catalysts.16,17 Huge interest in SACs has been established since the successful fabrication of an iron-oxide supported Pt SAC by Zhang et al. in 2011.18 From both experimental and theoretical studies, various SACs supported on two-dimensional (2D) materials have been reported to be active for electrocatalytic conversions, including the CO2RR, with better efficiency and durability.19–22
To further improve the efficiency of SACs, appropriate selection of the supporting material is needed. Apart from metal and metal-oxide supported SACs, molybdenum disulfide (MoS2) layered materials known as transition metal dichalcogenides (TMDCs) have been receiving a lot of research attention due to their direct band gap in the monolayer regime and for being low-cost semiconductor materials. MoS2 has a 2D layered structure similar to graphene, with the individual layers stacked upon each other through weak van der Waals (vdW) forces to form the bulk. Further, MoS2 has attracted much attention in the development of sensors,23 hydrogen storage,24 battery electrodes,25 transistors,26 nanoelectronics and optoelectronics,27 due to its high surface area, thermal stability and high electrical conductivity.28,29 For the purpose of CO2 activation, only the edges of MoS2 are active, whereas the basal plane is inert.30,31 However, the basal plane has a higher surface area to volume ratio than the edges. So, it is desirable to activate the basal plane,32 which will improve the catalytic activity for the CO2RR. Theoretical studies have shown that the adsorption ability of gas molecules on MoS2 increases when depositing transition and noble metals (Ti, Ni, Co, Pd, Au, Fe, etc.,) on the basal plane.33–36 Single metal atoms supported on the MoS2 layer provide excellent performance towards various reactions.37–39 Additionally, earlier experimental and theoretical studies showed that various structural defects can be created in the monolayer.40,41 One such defect is the sulfur vacancy, which can be introduced in MoS2 in a controlled way by electron irradiation. Interestingly, Liu et al. have synthesized MoS2 with a Co atom embedded in a sulfur vacancy in the basal plane and reported excellent activity for the conversion of 4-methylphenol to toluene with high thermal stability.42
From earlier studies, it is well known that Cu as an electrocatalyst has good CO2 reducing ability.12,43,44 In 2020, Joseph et al. experimentally synthesized Cu-doped MoS2 and reported a significant enhancement in electrical conductivity compared to the pristine MoS2 (with a stable 1H phase structure).45 In spite of several reports, mechanical insights into the formation of different C1 products with a lower overpotential are still unavailable and challenging to obtain, and this has driven us to carry out the present study. Here, we provide a novel approach for the efficient reduction of CO2 through a coupled proton–electron transfer. We investigate the catalytic activity on a single Cu atom embedded in a MoS2 monolayer and optimize the electrocatalytic behavior in the basal plane of the TMDC material.
For the purpose of the CO2RR on Cu–MoS2, we employed periodic density functional theory (DFT), a well-known tool, to explain the mechanism of various electrocatalytic reactions. The stability of the Cu–MoS2 surface model, adsorption energy of intermediates, Bader charges, density of states (DOS), and reaction free energies of each elementary step have been calculated. The selectivity for CO2RR vs. HER on Cu–MoS2 and pristine MoS2 was also investigated. The reduction of CO2 on the TMDC material with embedded Cu can produce more than 14 products with different selectivities. The overpotential (η) and limiting potential (UL) calculated from potential-determining steps (PDSs) for each reduction pathway, e.g., from CO2 to HCOOH, CO, CH3OH, and CH4, were analyzed to elucidate the catalytic activity. Thus, this study attempted to predict the promise of the Cu–MoS2 SAC as an electrocatalyst for selective CO2 reduction to produce different value-added chemicals.
2 Computational details
All the spin-polarized electronic structure calculations were carried out within the DFT framework46 implemented in the Vienna ab initio Simulation Package (VASP).47 The core electrons were treated using the projector augmented-wave (PAW) pseudo-potential48 and a plane-wave basis set49 with a kinetic energy cut-off of 450 eV was used. The electron exchange–correlation effects were described by the Perdew–Burke–Ernzerhof (PBE) functional of the generalized gradient approximation (GGA).50 To include the vdW interaction, Grimme's empirical dispersion-corrected D3-functional was used.51 The Brillouin zone was sampled using Monkhorst–Pack52k-point meshes of 3 × 3 × 1 and 6 × 6 × 1 for the different geometry optimization and electronic structure calculations. The convergence criterion for geometry optimization with self-consistent field iteration was set as 10−6 eV, and the forces acting on atoms were set to 0.02 eV Å−1.The MoS2 monolayer was modeled by cleaving the bulk MoS2 structure in the (001) direction. Subsequently, a 4 × 4 supercell containing 16 Mo and 32 S atoms was generated with a vacuum space of 15 Å in the z-direction to avoid unfavorable interactions between its periodic images. A sulfur defect was introduced, i.e., one sulfur atom was replaced with a Cu atom, to obtain the MoS2 monolayer with embedded Cu. All the atoms in the supercell were allowed to relax during the optimization. By employing Bader charge analysis53,54 and charge density difference (CDD), the charge transfer and redistribution were investigated for the adsorbate–surface system.
Next, the binding energy (Eb) of Cu in MoS2 with a sulfur vacancy was calculated from the difference between the total energy of MoS2 with embedded Cu (ECu–MoS2) and the sum of the energies of the isolated Cu atom (ECu-atom) and MoS2 with a sulfur vacancy (ESvc-MoS2):
| Eb = ECu–MoS2 − (ECu-atom + ESvc-MoS2). | (1) |
| Eads = Eadsorbate/Cu–MoS2 − Eadsorbate − ECu–MoS2, | (2) |
The Gibbs free energy change (ΔG) of each elementary step was calculated by employing the Computational Hydrogen Electrode (CHE) model developed by Nørskov et al.,55 and is given by the following equation:
| ΔG = ΔE + ΔEZPE − TΔS + ΔGU + ΔGpH, | (3) |
![[thin space (1/6-em)]](https://www.rsc.org/images/entities/char_2009.gif) ln
ln![[thin space (1/6-em)]](https://www.rsc.org/images/entities/char_2009.gif) 10 × pH is the free energy contribution to the change in H+ ion concentration, where pH is set to 0 in order to maintain strongly acidic conditions. The limiting potential (UL) is the most positive free energy change (ΔGmax) among all the electrochemical steps in the chosen pathway, and it is given by a simple relation:
10 × pH is the free energy contribution to the change in H+ ion concentration, where pH is set to 0 in order to maintain strongly acidic conditions. The limiting potential (UL) is the most positive free energy change (ΔGmax) among all the electrochemical steps in the chosen pathway, and it is given by a simple relation:| UL = −ΔGmax/e. | (4) |
| η = Ueq − UL. | (5) |
3 Results and discussion
3.1 Structure and stability of CO2 on Cu–MoS2
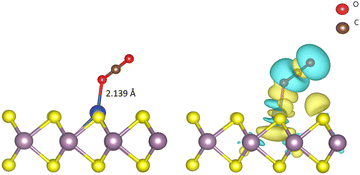
Before we study the CO2RR activity of the Cu–MoS2 system, it is very important to investigate the stability of the single Cu atom in the MoS2 monolayer with a sulfur vacancy. The DFT optimized structure of the SAC model is shown in Fig. 1(a), with an average bond length of ∼2.60 Å between the Cu and its three neighboring Mo atoms. As the Mo–Cu bond lengths are usually longer than the Mo–S bond, this makes the Cu protrude from the S-plane. The calculated binding energy (Eb) of the doped Cu atom in the MoS2 monolayer with a sulfur vacancy is about −3.38 eV, which means that Cu is held strongly in the sulfur vacancy. To validate this, we analyzed the diffusion of Cu to nearby sites on the MoS2 surface, i.e., on top of the nearest Mo atom and in a hollow site, as shown in Fig. S1 (see ESI†). By performing nudged elastic band (NEB) calculations, the energy barriers/transition states (TSs) for the top and hollow sites are found to be 1.67 and 1.59 eV, respectively. Because of these relatively large energy barriers, the Cu atom is firmly held in the sulfur vacancy of the MoS2 monolayer. In order to confirm the presence of doped-Cu species, the total density of states (TDOS) is calculated for the Cu–MoS2 SAC model and compared with the pristine MoS2 monolayer, as shown in Fig. 1(b). There is a noticeable peak with non-zero TDOS appearing at the Fermi energy level for the Cu-doped MoS2, whereas such a peak is not seen for the pristine MoS2. Further, there are two peaks near the Fermi level in the projected density of states (PDOS) of Cu–MoS2 (see Fig. S2 in ESI†), showing the localized features around the 3d orbital of the Cu atom. This is called a metal-induced gap state, composed of Cu-3d and Mo-4d orbitals. From the isosurface of the charge density difference (shown as an inset in Fig. 1(b)), we can see charge redistribution localized around the Cu–Mo bond, which confirms the electron overlap between the embedded Cu and nearby Mo atoms. This result agrees well with other theoretical findings.56 So, we confirm that the Cu embedded in MoS2 is stable, as is the case with other doped metals, such as Ni, Mn, Fe and Co, in MoS2.38,57,58The initial activation step, CO2 adsorption on the catalyst (CO2 → *CO2), is a very important step that determines the activity of the CO2RR. The change in the fundamental geometrical parameters of CO2 reveals the CO2RR activity of the SAC. In order to gain insights into the CO2 adsorption on Cu–MoS2, the adsorption energy, density of states (DOS), charge density difference and Bader charges are calculated. The optimized structure of CO2 adsorbed on the Cu–MoS2 surface is shown in Fig. 2, along with its isosurface structure. As mentioned, the Cu atom on the basal plane of the Cu–MoS2 surface is the active center for the CO2RR. It can be seen from Fig. 2 that the CO2 is adsorbed vertically on the Cu atom via an O atom rather than carbon, with an adsorption distance (dO–Cu) of ∼2.139 Å and adsorption energy Eads of −0.474 eV. The negative Eads shows that the CO2 adsorption process is favorable in view of thermodynamic stability. According to Bader charge analysis, there is a small partial negative charge that is transferred from Cu to the antibonding (2π) orbital of CO2, which extends one C–O1 bond length to ∼1.186 Å, from the 1.17 Å of free CO2. From the isosurface of the charge density difference (see Fig. 2, right-hand side), it is found that charge redistribution mainly occurs between CO2 and the embedded Cu atom. Similarly, the PDOS plot shown in Fig. S2 (ESI†) also shows distinct hybridization peaks between the Cu-3d orbital and the O-2p orbital of CO2, mainly in the range of −5.0 eV. This confirms the strong interaction between the dopant (Cu) and CO2 molecule. So, the bond formation occurs through the overlap of electron density from Cu-3d and O-2p, and thereby CO2 is likely to be chemisorbed on the Cu–MoS2 monolayer.
3.2 Electrochemical reduction of CO2 on the Cu–MoS2 SAC
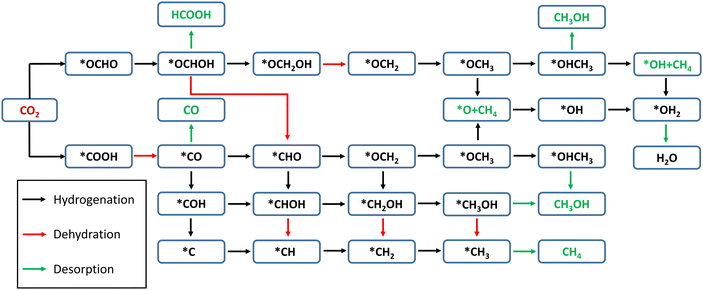
In the present Cu–MoS2 SAC model, the CO2 reduction process is carried out by a proton–electron pair (PEP: H+ + e−) transfer in each reaction step. The schematic representation of all possible pathways for the electrocatalytic reduction of CO2 to C1 products is shown in Scheme 1, combining the conclusions from previous reports.59,60 DFT-D3 calculations were performed to obtain the optimized structures and free energies of all possible intermediates and products, and to determine the preferable pathway for CO2RR. The first hydrogenation (PEP transfer) of *CO2 leads to the two different intermediates, i.e., *COOH and *OCHO, where * denotes surface-adsorbed species. The lowest energy pathway, i.e., that with the lowest positive free energy change between any two steps, is determined for the C1 products, namely HCOOH, CO, CH3OH and CH4. It is worth pointing out that the direct attack of *H on the Cu atom is also possible, but the free energy of interactions between them is very small, as will be discussed in the following subsection.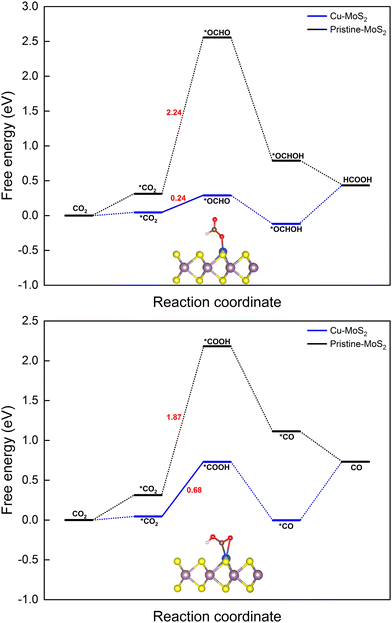 | ||
| Fig. 3 Gibbs free energy diagrams for the CO2RR towards the products HCOOH (top) and CO (bottom) on the MoS2 monolayer with embedded Cu at 0 V vs. the RHE. | ||
As mentioned above, the first step of the CO2RR is CO2 hydrogenation via PEP transfer with two possible intermediates:
(i) H+ attacks the O atom: * + CO2 + H+ + e− → *COOH (carboxyl), ΔG = 0.68 eV, and
(ii) H+ attacks the C atom: * + CO2 + H+ + e− → *OCHO (formate), ΔG = 0.24 eV,
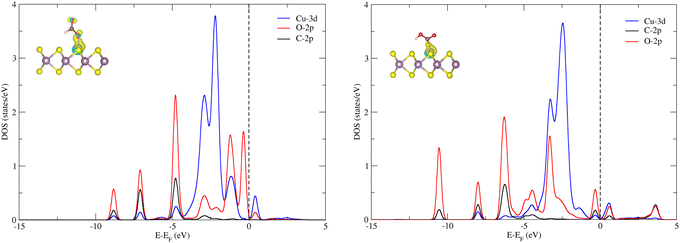
The next hydrogenation step leads to the formation of CO (with dehydration) and HCOOH products, respectively. In the case of pristine MoS2, this hydrogenation process is unfavorable due to a high ΔG (2.24 and 1.87 eV for *OCHO and *COOH intermediates), and therefore we employed the doping strategy here to reduce the limiting potential (UL). It is known that the catalytic activity of electrocatalysts can be effectively characterized by evaluating the limiting potential. The free energy change for the said intermediates formed on Cu–MoS2 is significantly reduced, and the corresponding UL values are −0.68 V (3 times lower than that of the pristine monolayer) and −0.24 V (10 times lower than that of the pristine monolayer), respectively. Further, the *CO2 is preferentially hydrogenated to *OCHO on the Cu–MoS2 electrocatalyst by forming a Cu–O bond. This trend is explained by analyzing the PDOS of the intermediates *OCHO and *COOH, as shown in Fig. 4. This clearly shows that the overlap between Cu-3d and O-2p of OCHO is higher than that with C-2p of COOH. In order to verify the selectivity of the CO2RR over the HER, the free energy change and adsorption energies for the direct (first) hydrogenation on the Cu-doped and pristine MoS2 monolayers are also calculated, and the results are presented in Fig. S3 (ESI†). The calculated adsorption energies (including dispersion correction), bond distances of adsorbed species from the active site (Cu atom) and the Bader charges of all possible intermediates are given in Table 1. It can be seen from Fig. 3, Fig. S3 (ESI†) and Table 1 that *OCHO (CO2RR) is more easily formed on Cu–MoS2 than *COOH (CO2RR) and *H (HER), due to the stronger electron interaction in the first hydrogenation step. Further, the free energy change for the HER on Cu–MoS2 is 0.58 eV and that for CO2RR is only 0.24 eV. To clarify this, the Eads values of *OCHO, *COOH and H* on Cu–MoS2 are found to be −2.749, −1.938 and 0.419 eV, respectively (see Table 1). This indicates that *OCHO and *COOH strongly adsorb on the surface and undergo hydrogenation effectively, whereas the HER process is inhibited as the adsorption between *H and the Cu active center is weaker. Furthermore, when the active centre of the catalyst is occupied by the *OCHO/*COOH species, the formation of *H is difficult, which causes the suppression of the HER in the present study.
| Intermediates | E ads (eV) | d Cu–C (Å) | d Cu–O (Å) | Q Cu (e) | Q C (e) | Q O (e) |
|---|---|---|---|---|---|---|
| *CO2 | −0.474 | — | 2.13 | 0.20 | 2.12 | −1.10 |
| *H | 0.419 | — | — | 0.13 | — | — |
| *COOH | −1.938 | 1.91 | — | 0.21 | 1.30 | −1.04 |
| *OCHO | −2.749 | — | 1.83 | 0.30 | 1.53 | −1.11 |
| *OCHOH | −1.028 | — | 1.99 | 0.23 | 1.46 | −1.14 |
| *CO | −1.274 | 1.86 | — | 0.21 | 0.97 | −1.03 |
| *OCH2OH | −2.470 | — | 1.73 | 0.30 | 0.97 | −1.05 |
| *CHO | −1.515 | 1.96 | — | 0.15 | 0.72 | −0.99 |
| *COH | −1.932 | 1.79 | — | 0.17 | 0.52 | −1.14 |
| *OCH2 | −0.858 | — | 1.94 | 0.24 | 0.74 | −1.06 |
| *CHOH | −2.418 | 1.88 | — | 0.16 | 0.40 | −1.07 |
| *C | −2.503 | 1.79 | — | 0.16 | −0.27 | — |
| *OCH3 | −2.765 | — | 1.78 | 0.31 | 0.45 | −1.02 |
| *CH | −3.135 | 1.79 | — | 0.22 | −0.38 | — |
| *CH2OH | −1.643 | 1.94 | — | 0.18 | 0.23 | −1.08 |
| *CH2 | −2.530 | 1.85 | — | 0.20 | −0.35 | — |
| *OHCH3 | −1.135 | — | 2.02 | 0.22 | 0.33 | −1.13 |
| *O + CH4 | −0.417 | — | 1.75 | 0.33 | — | −0.62 |
| *OH + CH4 | −3.430 | — | 1.79 | 0.30 | — | −1.10 |
| *CH3 | −1.740 | 1.94 | — | 0.20 | −0.38 | — |
| *OH | −3.279 | — | 1.79 | 0.31 | — | −1.12 |
| *CH4 | −0.494 | 2.35 | — | 0.15 | −0.20 | — |
| *OH2 | −0.963 | — | 2.06 | 0.21 | — | −1.16 |
With the above findings, we proceed with the next hydrogenation step, which leads to the simple C1 products *CO and *HCOOH (see Scheme 1). In the two-electron pathway, the second hydrogenation steps are *OCHO + H+ + e− → *OCHOH → * + HCOOH, and *COOH + H+ + e− → *CO + H2O → * + CO, respectively. Note that simple protonation is involved in the former path, whereas the protonation is followed by dehydration in the latter path. It is further noticed that both reactions, forming formic acid (*HCOOH) and carbon monoxide (*CO) on the Cu–MoS2 monolayer, are slightly exothermic (∼−0.11 eV). Cu–MoS2 is more active towards CO2 reduction to HCOOH with a limiting potential of −0.24 V, which is better than those of the pristine MoS2 and other reported SACs for CO2 reduction to HCOOH.61–63 From the ΔG of desorption for the two-electron C1 products using the SAC, it is seen that HCOOH (0.55 eV) can be more easily desorbed than CO (0.75 eV). However, theoretical studies have demonstrated that the relative adsorption energies of *OCHOH and *CO determine whether HCOOH and CO are the main products or reaction intermediates. Conversely, the adsorption energies of *OCHOH (−1.03 eV) and *CO (−1.27 eV) show that they are possible reaction intermediates for further hydrogenation.
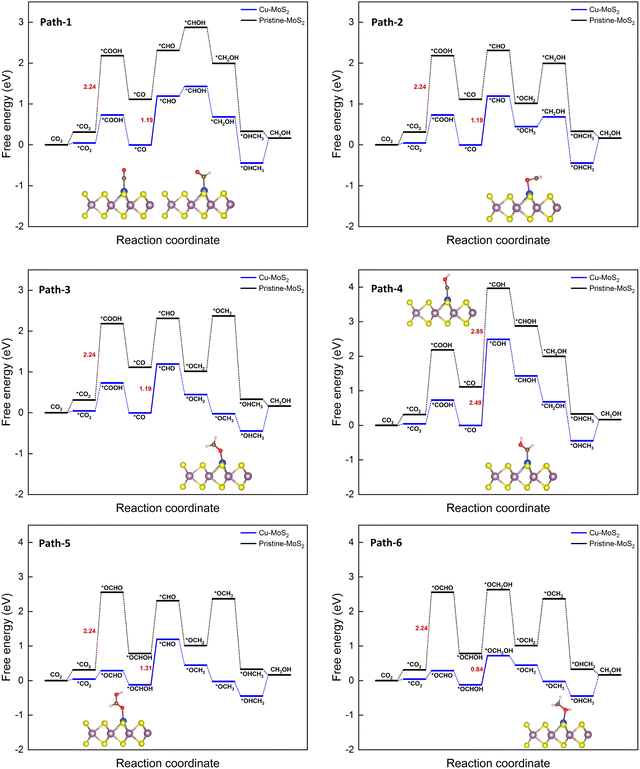 | ||
| Fig. 5 Gibbs free energy diagrams for six different pathways of the CO2RR towards CH3OH on the MoS2 monolayer with embedded Cu at 0 V vs. the RHE. | ||
It is found that *CO is a key intermediate formed via protonation followed by dehydration for proposed paths 1 to 4, whereas *OCHOH is formed via only protonation for paths 5 and 6. Thus, the corresponding hydrogenation reaction step is the potential-determining step (PDS), i.e., while the *CO hydrogenation to *CHO(*COH) is the PDS for path 1–3(4), conversion of *OCHOH to *CHO and *OCHOH to *OCH2OH is the PDS for the paths 5 and 6, respectively, for the Cu–MoS2 SAC. In the case of pristine MoS2, the first hydrogenation step itself (*CO2 to *COOH) becomes the PDS with a large free energy change of 2.24 eV. The catalyst performance is determined by calculating the overpotential (η). As the negative limiting potential increases, the overpotential decreases, i.e., the energy that needs to be supplied externally via an applied potential (U) is reduced. The calculated limiting potential and overpotential for the PDS of each path for the CO2RR to CH3OH on Cu–MoS2 are given in Table 2.
| CO2RR | PDS | U L (V) | η (V) |
|---|---|---|---|
| Path 1 | *CO → *CHO | −1.19 | 1.21 |
| Path 2 | *CO → *CHO | −1.19 | 1.21 |
| Path 3 | *CO → *CHO | −1.19 | 1.21 |
| Path 4 | *CO → *COH | −2.49 | 2.51 |
| Path 5 | *OCHOH → *CHO | −1.31 | 1.33 |
| Path 6 | *OCHOH → *OCH2OH | −0.84 | 0.86 |
An overpotential of only 0.86 V is required for this electrochemical conversion on Cu–MoS2via path 6, compared to the values of 2.26 V and 1.01 V on pristine MoS2 and Cu (111) surfaces.64 The overpotential for paths 1 to 3 is 1.21 V, and for path 5 is 1.33 V. Path 4 has the highest overpotential of 2.51 V, whilst also having the most negative limiting potential of −2.49 V. Therefore, path 6 is found to be the more probable pathway for Cu–MoS2 due to its lower overpotential. From the free energy diagram (Fig. 5), it is obvious that hydrogenation of *OCHOH to form the *OCH2OH intermediate (via path 6) has a comparatively smaller ΔG than that for forming the *CHO intermediate (via path 5) on the catalyst surface. Further, the subsequent hydrogenation of *OCH2OH to form *OCH2 is exothermic, and the *OCH2 species also shows a strong adsorption on the SAC surface (Eads = −0.858 eV, cf.Table 1). Therefore, it will be further reduced to *CH2OH (if *H attacks the O atom) or *OCH3 (if *H attacks the C atom) and yield another important C1 product, *OHCH3, which is again an exothermic process overall. In contrast, path 2 shown in Fig. 5 is endothermic for the reduction step of *OCH2 to *CH2OH and then proceeds to the formation of *OHCH3. So, it is worth noting that the formation of *OCH3 from *OCH2 is an another crucial step that is thermodynamically favorable. To summarize, Cu–MoS2 has better catalytic performance for reducing CO2 to CH3OH with a lower overpotential than the pristine MoS2, and the optimized reaction pathway (involving 6e− transfer) is path 6: CO2 → *OCHO → *OCHOH → *OCH2OH → *OCH2 → *OCH3 → *OHCH3.
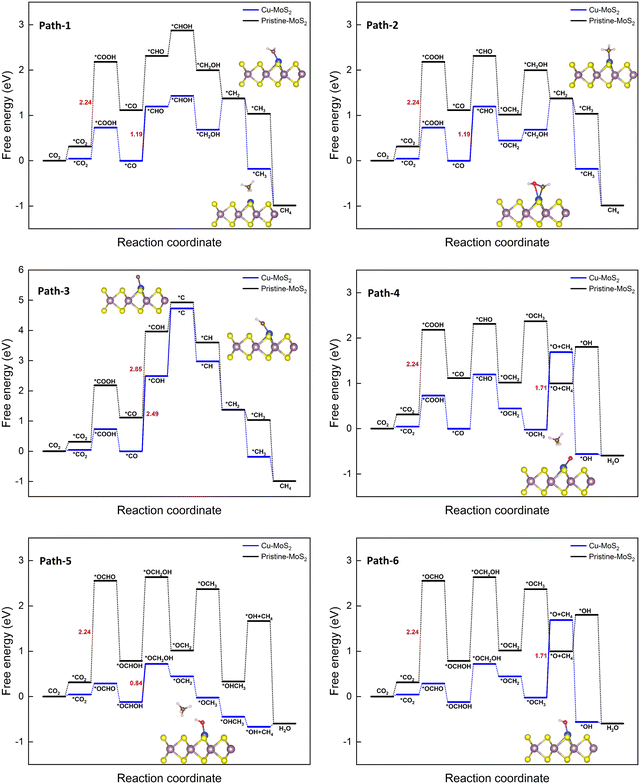 | ||
| Fig. 6 Gibbs free energy diagrams for six different pathways of the CO2RR towards CH4 on the MoS2 monolayer with embedded Cu at 0 V vs. the RHE. | ||
It can be seen from all the paths in Fig. 6 that doping with Cu leads to better catalytic performance than that of the pristine MoS2 monolayer. As we know, the overall catalytic behavior relies on the individual pathways; the presence of a large barrier in the case of the pristine monolayer hinders the further reduction process. As observed in the 6e− transfer, the PDS is determined here by the stable intermediates *CO (path 1 to 4) and *OCHOH (path 5 and 6). The corresponding hydrogenation step yields a few feasible metastable intermediates: *CHO (path 1, 2, and 4), *COH (path 3), and *OCH2OH (path 5 and 6) with the limiting potentials of −1.19, −2.49, and −0.84 V, respectively. It is worth pointing out here that in path 3, the protonation of *COH (where *H attacks the O atom) forms the highly unstable *C via dehydration, and it is considered to be the largest positive free energy change (overall) among the different paths, whilst also being highly endothermic. Similarly, the *H attack on the O atom of the *CHO intermediate to form *CHOH in path 1 also proceeds endothermically. In the case of the other paths (2, 4, 5 and 6, in which *H attacks the C atom), the catalytic conversion steps of *CHO → *OCH2 (protonation) and *OCH2OH → *OCH2 (protonation followed by the dehydration) are exothermic processes. As the electrochemical reduction proceeds, the *OCH3 intermediate can be easily formed, as seen in path 4, 5 and 6. The reduction reaction of *OCH3 to *O + CH4 (paths 4 and 6) is endothermic with a large ΔG (1.71 eV) and later it becomes the PDS for these paths, whereas the conversion of *OCH3 to *HOCH3 in path 5 is clearly exothermic. Therefore, path 5 is preferred, finally desorbing the CH4 molecule successfully from the Cu–MoS2 SAC surface. It can be concluded that path 5 could be a preferable (optimized) reduction pathway for CO2 to CH4 on Cu–MoS2, proceeding via *OCH2 → *OCH3 → *OHCH3 → *OH + CH4 → H2O.
Further, the calculated overpotentials and limiting potentials for the potential-determining steps of the different pathways for the CO2RR to CH4 on MoS2 with embedded Cu are summarized in Table 3.
| CO2RR | PDS | U L (V) | η (V) |
|---|---|---|---|
| Path 1 | *CO → *CHO | −1.19 | 1.36 |
| Path 2 | *CO → *CHO | −1.19 | 1.36 |
| Path 3 | *CO → *COH | −2.49 | 2.66 |
| Path 4 | *OCH3 → *O + CH4 | −1.71 | 1.88 |
| Path 5 | *OCHOH → *OCH2OH | −0.84 | 1.01 |
| Path 6 | *OCH3 → *O + CH4 | −1.71 | 1.88 |
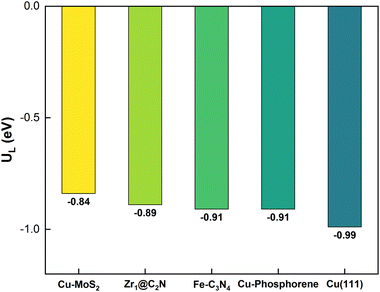
The lowest overpotential (η = 1.01 V) is obtained for the PDS of path 5, whereas the highest η (2.66 V) is obtained for path 3, with moderate values of η (1.36 and 1.88 V) for the rest of the paths. Note that the PDS for the preferred path 5 is the third hydrogenation step, but that for the other competing paths (4 and 6) is found to be the sixth hydrogenation step with a limiting potential (1.71 V) that is more than two-fold that of the preferred path 5. To assess the efficiency of Cu-doped MoS2, the overpotential of the pristine MoS2 monolayer is also estimated for the PDS of *CO2 → *COOH); here η = 2.41 V, which is almost three-times higher than that of the preferred path on Cu–MoS2. So, it is verified that the MoS2 SAC with embedded Cu shows an excellent catalytic activity for the reduction of CO2 to CH4 (via optimized path 5) compared to the pristine MoS2. In order to highlight our result, we have shown a comparison of our limiting potential with that of other reported CO2RR catalysts, such as Fe–C3N4,61 Zr@C2N,65 Cu (111) and Cu–phosphorene,64 in Fig. 7.
3.3 Impact of applied potential on the CO2RR on MoS2 with embedded Cu
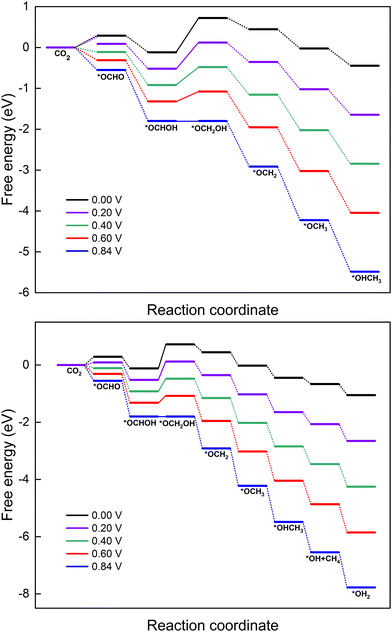
In this section, the reaction mechanism for the electrocatalytic reduction of CO2 to methanol or methane on MoS2 with embedded Cu is explored under different applied potentials (U). The optimized reduction pathways for producing CH3OH (path 6 from Fig. 5) and CH4 (path 5 from Fig. 6) have been selected based on the aforementioned discussion. The effect of applied potential on these optimized paths (6 and 5) is presented in the free energy diagrams shown in Fig. 8. Both the six- and eight-electron reaction pathways for the formation of products CH3OH and CH4 are sensitive to the applied potential, which neutralizes the barrier of the PDS and makes all the elementary reactions exothermic processes. The ΔGmax for producing CH3OH and CH4 decreases when increasing the applied potential from 0 to 0.84 V, which indeed speeds up the CO2RR process. As mentioned, the PDS of the CO2RR on Cu–MoS2 is the formation of *OCH2OH and the uphill energy step becomes exothermic at the applied potential of 0.84 V. The required external applied potential (U) can be determined from the lowest limiting potential (UL) value of the PDS for the specific reduction pathway. Since the PDS for formation of both products CH3OH and CH4 exhibits a UL of ∼0.84 V, we required the same magnitude of U to trigger the CO2RR on the Cu–MoS2 SAC.4 Conclusions
In this work, we have studied the catalytic activity of the electrochemical reduction of CO2 to C1 products on a Cu–MoS2 monolayer single-atom catalyst by performing DFT calculations. The computational results reveal that Cu embedded in a sulfur vacancy in the MoS2 monolayer effectively increases the catalytic activity of CO2RR relative to that of the pristine MoS2. The different pathways, involving several elementary reactions via coupled proton–electron transfers, were explored, namely 2e−, 6e−, and 8e− pathways. The reaction mechanisms of all pathways and their PDSs are discussed in terms of free energy diagrams and adsorption energies. The strong electronic interactions between the Cu-3d orbital and those of the intermediates formed during the hydrogenation steps are confirmed by PDOS and charge density difference analysis. The main conclusions drawn from the present study are summarized as follows:• The CO2 shows a strong adsorption on the MoS2 monolayer with embedded Cu, with Eads = −0.474 eV.
• In view of the CO2RR vs. HER, the Cu–MoS2 SAC effectively suppresses the HER by setting a large energy barrier to the HER, and as a result, the adsorption of *H (Eads = 0.419 eV) is unfavourable.
• Six different paths involving 6e− and 8e− transfer were explored for the CO2RR, and it was noticed that the formation of both CH3OH and CH4 follows the same reduction pathway, with the lowest limiting potential of ∼0.84 V.
• During the hydrogenation process, which decides the PDS for the CO2RR, the proton–electron pair (H+ + e−) mostly prefers to attack the C atom rather than the O atom of the adsorbed CO2 on the Cu–MoS2 SAC.
• The PDSs of the optimized pathways for the electrocatalytic reduction of CO2 to HCOOH and CH4 are CO2 → *OCHO and *OCHOH → *OCH2OH.
• Some notable intermediates, *CO, *C and *OCH2, are formed via protonation followed by dehydration during the course of catalytic reduction of CO2.
• The lowest overpotentials of 0.86 and 1.01 V were achieved for formation of methanol and methane, respectively, which play a significant role in the CO2RR.
• As a result, the formation of methane (involving 8e− transfer) is found to be most favored among the C1 products, i.e., CO, HCOOH, CH3OH, and CH4, and the overall process is exothermic.
• From the free energy diagram, the most optimized pathway for the efficient catalytic reduction of CO2 to CH4 is path 5, which is given as: CO2 → *OCHO → *OCHOH → *OCH2OH → *OCH2 → *OCH3 → *OHCH3 → *OH + CH4 → H2O.
With the above findings, we conclude that the MoS2 monolayer with embedded Cu is a more promising electrocatalyst for an efficient CO2RR process than the pristine MoS2.
Conflicts of interest
There are no conflicts of interest to declare.Acknowledgements
The first author (TD) thanks Pondicherry University for the research fellowship. The computational facilities provided by the UGC-SAP under the Department of Special Assistance (DSA-I), New Delhi, are gratefully acknowledged. The project was supported by the Researchers Supporting Project number (RSP2023R143), King Saud University, Riyadh, Saudi Arabia.References
- D. Lüthi, M. Le Floch, B. Bereiter, T. Blunier, J.-M. Barnola, U. Siegenthaler, D. Raynaud, J. Jouzel, H. Fischer and K. Kawamura, et al. , Nature, 2008, 453, 379–382 CrossRef PubMed.
- S. J. Davis, K. Caldeira and H. D. Matthews, Science, 2010, 329, 1330–1333 CrossRef CAS PubMed.
- H. Class, A. Ebigbo, R. Helmig, H. K. Dahle, J. M. Nordbotten, M. A. Celia, P. Audigane, M. Darcis, J. Ennis-King and Y. Fan, et al. , Comput. Geosci., 2009, 13, 409–434 CrossRef.
- L. Giordano, D. Roizard and E. Favre, Int. J. Greenhouse Gas Control, 2018, 68, 146–163 CrossRef CAS.
- S. Liu, H. Ling, J. Lv, H. Gao, Y. Na and Z. Liang, Ind. Eng. Chem. Res., 2019, 58, 20461–20471 CrossRef CAS.
- B. O. Demars, G. M. Gslason, J. S. Ólafsson, J. R. Manson, N. Friberg, J. M. Hood, J. J. Thompson and T. E. Freitag, Nat. Geosci., 2016, 9, 758–761 CrossRef CAS.
- J. Shi, Y. Jiang, Z. Jiang, X. Wang, X. Wang, S. Zhang, P. Han and C. Yang, Chem. Soc. Rev., 2015, 44, 5981–6000 RSC.
- P. Usubharatana, D. McMartin, A. Veawab and P. Tontiwachwuthikul, Ind. Eng. Chem. Res., 2006, 45, 2558–2568 CrossRef CAS.
- W. Zhang, Y. Hu, L. Ma, G. Zhu, Y. Wang, X. Xue, R. Chen, S. Yang and Z. Jin, Adv. Sci., 2018, 5, 1700275 CrossRef PubMed.
- Y. Chen, C. W. Li and M. W. Kanan, J. Am. Chem. Soc., 2012, 134, 19969–19972 CrossRef CAS PubMed.
- D. Sun, X. Xu, Y. Qin, S. P. Jiang and Z. Shao, ChemSusChem, 2020, 13, 39–58 CrossRef CAS PubMed.
- W. J. Durand, A. A. Peterson, F. Studt, F. Abild-Pedersen and J. K. Nørskov, Surf. Sci., 2011, 605, 1354–1359 CrossRef CAS.
- S. Liu, H. Yang, X. Su, J. Ding, Q. Mao, Y. Huang, T. Zhang and B. Liu, J. Energy Chem., 2019, 36, 95–105 CrossRef.
- S. Nitopi, E. Bertheussen, S. B. Scott, X. Liu, A. K. Engstfeld, S. Horch, B. Seger, I. E. Stephens, K. Chan and C. Hahn, et al. , Chem. Rev., 2019, 119, 7610–7672 CrossRef CAS PubMed.
- X.-F. Yang, A. Wang, B. Qiao, J. Li, J. Liu and T. Zhang, Acc. Chem. Res., 2013, 46, 1740–1748 CrossRef CAS PubMed.
- R. Qin, K. Liu, Q. Wu and N. Zheng, Chem. Rev., 2020, 120, 11810–11899 CrossRef CAS PubMed.
- L. Zhang, K. Doyle-Davis and X. Sun, Energy Environ. Sci., 2019, 12, 492–517 RSC.
- B. Qiao, A. Wang, X. Yang, L. F. Allard, Z. Jiang, Y. Cui, J. Liu, J. Li and T. Zhang, Nat. Chem., 2011, 3, 634–641 CrossRef CAS PubMed.
- J. H. Liu, L.-M. Yang and E. Ganz, ACS Sustainable Chem. Eng., 2018, 6, 15494–15502 CrossRef CAS.
- H. Yang, Q. Lin, C. Zhang, X. Yu, Z. Cheng, G. Li, Q. Hu, X. Ren, Q. Zhang and J. Liu, et al. , Nat. Commun., 2020, 11, 1 CrossRef PubMed.
- N. Han, Y. Wang, L. Ma, J. Wen, J. Li, H. Zheng, K. Nie, X. Wang, F. Zhao and Y. Li, et al. , Chem, 2017, 3, 652–664 CAS.
- Z. Wang, J. Zhao and Q. Cai, Phys. Chem. Chem. Phys., 2017, 19, 23113–23121 RSC.
- M. Donarelli, S. Prezioso, F. Perrozzi, F. Bisti, M. Nardone, L. Giancaterini, C. Cantalini and L. Ottaviano, Sens. Actuators, B, 2015, 207, 602–613 CrossRef CAS.
- D. B. Putungan, S.-H. Lin, C.-M. Wei and J.-L. Kuo, Phys. Chem. Chem. Phys., 2015, 17, 11367–11374 RSC.
- H. Hwang, H. Kim and J. Cho, Nano Lett., 2011, 11, 4826–4830 CrossRef CAS PubMed.
- B. Radisavljevic, A. Radenovic, J. Brivio, V. Giacometti and A. Kis, Nat. Nanotechnol., 2011, 6, 147–150 CrossRef CAS PubMed.
- O. Lopez-Sanchez, D. Lembke, M. Kayci, A. Radenovic and A. Kis, Nat. Nanotechnol., 2013, 8, 497–501 CrossRef CAS PubMed.
- K. F. Mak, C. Lee, J. Hone, J. Shan and T. F. Heinz, Phys. Rev. Lett., 2010, 105, 136805 CrossRef PubMed.
- A. Splendiani, L. Sun, Y. Zhang, T. Li, J. Kim, C.-Y. Chim, G. Galli and F. Wang, Nano Lett., 2010, 10, 1271–1275 CrossRef CAS PubMed.
- S. Zhao, J. Xue and W. Kang, Chem. Phys. Lett., 2014, 595–596, 35–42 CrossRef CAS.
- L. S. Byskov, J. K. Nørskov, B. S. Clausen and H. Topsøe, Catal. Lett., 2000, 64, 95–99 CrossRef CAS.
- D. Voiry, R. Fullon, J. Yang, C. de Carvalho Castro e Silva, R. Kappera, I. Bozkurt, D. Kaplan, M. J. Lagos, P. E. Batson and G. Gupta, et al. , Nat. Mater., 2016, 15, 1003–1009 CrossRef CAS PubMed.
- H. Luo, Y. Cao, J. Zhou, J. Feng, J. Cao and H. Guo, Chem. Phys. Lett., 2016, 643, 27–33 CrossRef CAS.
- D. Chen, X. Zhang, J. Tang, H. Cui and Y. Li, Appl. Phys. A: Mater. Sci. Process., 2018, 124, 194 CrossRef CAS.
- Y. H. Zhang, J. L. Chen, L. J. Yue, H. L. Zhang and F. Li, Comput. Theor. Chem., 2017, 1104, 12–17 CrossRef CAS.
- D. Ma, W. Ju, T. Li, X. Zhang, C. He, B. Ma, Z. Lu and Z. Yang, Appl. Surf. Sci., 2016, 383, 98–105 CrossRef CAS.
- J. Zhao, J. Zhao and Q. Cai, Phys. Chem. Chem. Phys., 2018, 20, 9248–9255 RSC.
- D. Ma, Y. Tang, G. Yang, J. Zeng, C. He and Z. Lu, Appl. Surf. Sci., 2015, 328, 71–77 CrossRef CAS.
- T. Jitwatanasirikul, T. Roongcharoen, C. Chitpakdee, S. Jungsuttiwong, P. Poldorn, K. Takahashi and S. Namuangruk, New J. Chem., 2021, 45, 17407–17417 RSC.
- H. P. Komsa and A. V. Krasheninnikov, Phys. Rev. B: Condens. Matter Mater. Phys., 2015, 91, 125304 CrossRef.
- H. Nan, Z. Wang, W. Wang, Z. Liang, Y. Lu, Q. Chen, D. He, P. Tan, F. Miao and X. Wang, et al. , ACS Nano, 2014, 8, 5738–5745 CrossRef CAS PubMed.
- G. Liu, A. W. Robertson, M. M.-J. Li, W. C. Kuo, M. T. Darby, M. H. Muhieddine, Y.-C. Lin, K. Suenaga, M. Stamatakis and J. H. Warner, et al. , Nat. Chem., 2017, 9, 810–816 CrossRef CAS PubMed.
- Y. Hori, A. Murata and R. Takahashi, J. Chem. Soc., Faraday Trans. 1, 1989, 85, 2309–2326 RSC.
- Y. Hori, H. Wakebe, T. Tsukamoto and O. Koga, Electrochim. Acta, 1994, 39, 1833–1839 CrossRef CAS.
- D. Joseph, M. Navaneethan, R. Abinaya, S. Harish, J. Archana, S. Ponnusamy, K. Hara and Y. Hayakawa, Appl. Surf. Sci., 2020, 505, 144066 CrossRef CAS.
- W. Kohn and L. J. Sham, Phys. Rev., 1965, 140, A1133–A1138 CrossRef.
- G. Kresse and D. Joubert, Phys. Rev. B: Condens. Matter Mater. Phys., 1999, 59, 1758–1775 CrossRef CAS.
- P. E. Blöchl, Phys. Rev. B: Condens. Matter Mater. Phys., 1994, 50, 17953–17979 CrossRef PubMed.
- G. Kresse and J. Furthmüller, Phys. Rev. B: Condens. Matter Mater. Phys., 1996, 54, 11169–11186 CrossRef CAS PubMed.
- J. P. Perdew, K. Burke and M. Ernzerhof, Phys. Rev. Lett., 1996, 77, 3865–3868 CrossRef CAS PubMed.
- S. Grimme, J. Antony, S. Ehrlich and H. Krieg, J. Chem. Phys., 2010, 132, 154104 CrossRef PubMed.
- H. J. Monkhorst and J. D. Pack, Phys. Rev. B: Solid State, 1976, 13, 5188–5192 CrossRef.
- G. Henkelman, A. Arnaldsson and H. Jónsson, Comput. Mater. Sci., 2006, 36, 354–360 CrossRef.
- E. Sanville, S. D. Kenny, R. Smith and G. Henkelman, J. Comput. Chem., 2007, 28, 899–908 CrossRef CAS PubMed.
- J. K. Nørskov, J. Rossmeisl, A. Logadottir, L. Lindqvist, J. R. Kitchin, T. Bligaard and H. Jonsson, J. Phys. Chem. B, 2004, 108, 17886–17892 CrossRef.
- B. Zhao, C. Li, L. Liu, B. Zhou, Q. Zhang, Z. Chen and Z. Tang, Appl. Surf. Sci., 2016, 382, 280–287 CrossRef CAS.
- B. Xiao, P. Zhang, L. Han and Z. Wen, Appl. Surf. Sci., 2015, 354, 221–228 CrossRef CAS.
- W. Cong, Z. Tang, X. Zhao and J. Chu, Sci. Rep., 2015, 5, 9361 CrossRef CAS PubMed.
- A. A. Peterson, F. Abild-Pedersen, F. Studt, J. Rossmeisl and J. K. Nørskov, Energy Environ. Sci., 2010, 3, 1311–1315 RSC.
- Y. Li, S. H. Chan and Q. Sun, Nanoscale, 2015, 7, 8663–8683 RSC.
- C. Guo, T. Zhang, X. Deng, X. Liang, W. Guo, X. Lu and C.-M. L. Wu, ChemSusChem, 2019, 12, 5126–5132 CrossRef CAS PubMed.
- G. Ren, J. Sun, S. Zhai, L. Yang, T. Yu, L. Sun and W. Deng, Cell Rep. Phys. Sci., 2022, 3, 100705 CrossRef CAS.
- S. Zhao, S. Li, T. Guo, S. Zhang, J. Wang, Y. Wu and Y. Chen, Nano-Micro Lett., 2019, 11, 1–19 CrossRef PubMed.
- H. P. Zhang, R. Zhang, C. Sun, Y. Jiao and Y. Zhang, Nanoscale, 2021, 13, 20541–20549 RSC.
- A. Hassan, I. Anis, S. Shafi, A. Assad, A. Rasool, R. Khanam, G. A. Bhat, S. Krishnamurty and M. A. Dar, ACS Appl. Nano Mater., 2022, 5, 15409–15417 CrossRef CAS.
Footnote |
| † Electronic supplementary information (ESI) available. See DOI: https://doi.org/10.1039/d3nj00716b |
| This journal is © The Royal Society of Chemistry and the Centre National de la Recherche Scientifique 2023 |


