 Open Access Article
On the physicochemical properties, setting chemical reaction, and in vitro bioactivity of aragonite–chitosan composite cement as a bone substitute†
E.
Toufik
 abc,
H.
Noukrati
 d,
C.
Rey
c,
O.
Marsan
c,
C.
Charvillat
c,
S.
Cazalbou
e,
H.
Ben Youcef
 a,
A.
Barroug
 *bd and
C.
Combes
 *c
*c
aMohammed VI Polytechnic University, HTMR-Lab, 43150, Benguerir, Morocco
bCadi Ayyad University, Faculty of Sciences Semlalia, SCIMATOP-PIB, 40000, Marrakech, Morocco. E-mail: a.barroug@uca.ac.ma
cCIRIMAT, Université de Toulouse, CNRS, ENSIACET, 4 allée EmileMonso, 31030 Toulouse Cedex 4, France. E-mail: christele.combes@ensiacet.fr
dMohammed VI Polytechnic University, ISSB-P, 43150, Benguerir, Morocco
eCIRIMAT, Université de Toulouse, CNRS, Université Toulouse 3 - Paul Sabatier, 31062, Toulouse, France
First published on 13th January 2023
Abstract
In the field of bone substitution, calcium carbonate cements have been proposed as bioactive mineral cements complementary to calcium phosphate cements for applications requiring a faster resorption rate. We investigated for the first time the setting chemical reaction, physicochemical properties and the in vitro evolution in a simulated body fluid (SBF) of calcium carbonate composite cements including chitosan (1.5 wt%, 2.5 wt%, 3.5 wt%, and 4 wt%) in view of bone applications. We implemented a methodology based on the X-ray diffraction data for the quantitative analysis of the four calcium carbonate phases (aragonite, vaterite, calcite and amorphous calcium carbonate) involved in the composite cement setting which allowed determining the setting chemical mechanism and the underlying effect of chitosan. Interestingly, aragonite was the main phase in all the set composite cements. Whatever the chitosan amount, we showed that the initial Mg-stabilised amorphous calcium carbonate crystallised rapidly into a small amount of magnesium-doped calcite (<21 wt%). However, the vaterite recrystallisation into aragonite was slowed down by the presence of chitosan in a dose-dependent manner. The composite cement formulation including 3.5 wt% of chitosan presented the optimal properties such as a good paste injectability (85%), a reduced initial setting time (45 min), a compressive strength (6.5 MPa) analogous to that of spongy bone, and ductile behaviour. In vitro evolution in the SBF showed that chitosan enhanced the bioactivity of the composite cement which promoted the formation of a biomimetic apatite on its surface after 28 days of immersion. This composite cement is a potential candidate for further investigation as a new injectable and resorbable bone substitute material and could also support a new direction for building material applications.
1. Introduction
Calcium carbonate cements (CCC) have been suggested as bioactive mineral cements complementary to calcium phosphate cements (CPCs), particularly when a faster resorption rate is needed for some non-load-bearing orthopaedic applications.1–3 Indeed, the presence of a calcium carbonate (CaCO3) metastable phase such as aragonite and/or vaterite in the end-product should confer a higher in vivo biodegradation rate than that of the CPC. In addition, some recent studies showed that CaCO3 cements can provide processing and performance decisive advantages such as the use of CO2 as a precursor of CaCO3 compounds for sustainable and carbon-negative building material applications over conventional inorganic binders.4,5Among calcium carbonate (CaCO3) polymorphs, calcite is the most stable under physiological conditions and is also present as otoliths in human ears. However, it is rather an undesired phase in bioactive bone substitutes due to its slow resorption rate in vivo6 and poor nucleation ability of apatite on its surface.7 Aragonite, vaterite, and amorphous calcium carbonate (ACC) exhibit higher solubility than calcite and good in vitro bioactivity.6
Combes et al.1 reported on the first bone cement based only on calcium carbonates involving a biphasic mixture of calcium carbonate powders, Mg-stabilised ACC and vaterite; the dominant phase found after the cement setting consists of aragonite which is a metastable phase under physiological conditions. More recently, Myszka et al.2 examined a calcium carbonate cement based on vaterite as a main phase and its mechanical reinforcement using poly-hydroxyethyl-methacrylate to produce a high-strength bone cement. Sanchez et al.3 reported a calcium carbonate cement by combining Mg-free ACC and vaterite leading to calcite as a major component of the cement. Nevertheless, in the aforementioned studies, the setting mechanism of calcium carbonate cements and the control of their composition were not fully elucidated. Moreover, the setting time of the cements, a crucial parameter in bone filling applications, and its injectability were rarely considered. Therefore, calcium carbonate cements still need major developments and optimisation in terms of setting time, rheological properties and mechanical properties to meet the clinical requirements for bone filling applications.1
In the broader field of calcium phosphate cements, several studies examined the incorporation of biopolymers to elaborate composite cements with adequate setting time,8 improved injectability,9 and mechanical properties.10 Among polysaccharides, chitosan is one of the most studied biopolymers in the biomedical field owing to its biocompatibility, good biodegradation and revascularisation properties which can consequently promote bone growth.11–13 In addition, chitosan is one of the fewest biopolymers that present an antibacterial activity14 and is also known for improving the mechanical strength of composite materials.15 To the best of our knowledge, chitosan has not been associated with the calcium carbonate cement for the design of composite cements with adapted composition and properties. Interestingly, this combination is found in the biomineralisation area: the well-known example of nacre, a natural biological composite material combining aragonite and chitin (95 v/v% aragonite and 5 v/v% chitin), which exhibits good in vivo biocompatibility, biodegradability, and osteogenic potential higher than that of sintered bioceramics such as hydroxyapatite.16 Inspired by the composition of this biological material and its above-mentioned features, we investigated for the first time the physicochemical properties, setting mechanism, and the in vitro bioactivity in a simulated body fluid of a composite cement based on calcium carbonates and chitosan in view of bone substitute applications.
2. Materials and methods
2.1. Materials
Sodium carbonate decahydrate (Na2CO3·10H2O ≥ 98%), sodium bicarbonate (NaHCO3, ≥ 98%), calcium chloride dihydrate (CaCl2·2H2O ≥ 98%), magnesium chloride hexahydrate (MgCl2·6H2O ≥ 98%), calcite (CaCO3 ≥ 98%), sodium chloride (NaCl ≥ 98%), potassium chloride (KCl ≥ 98%), potassium hydrogen phosphate trihydrate (K2HPO4·3H2O ≥ 99%), sodium sulfate (Na2SO4 ≥ 98%), tris(hydroxyl-methyl) aminomethane (NH2C(CH2OH)3 ≥ 99%) and hydrochloric acid (HCl: 36.5– 38%) were purchased from VWR. Low molecular weight chitosan (50![[thin space (1/6-em)]](https://www.rsc.org/images/entities/char_2009.gif) 000–190
000–190![[thin space (1/6-em)]](https://www.rsc.org/images/entities/char_2009.gif) 000 Da) with a degree of deacetylation DDA of ≥ 75% and glacial acetic acid (CH3COOH, ≥99%) were obtained from Sigma-Aldrich. All the reactants were of analytical grade and were used as received.
000 Da) with a degree of deacetylation DDA of ≥ 75% and glacial acetic acid (CH3COOH, ≥99%) were obtained from Sigma-Aldrich. All the reactants were of analytical grade and were used as received.
2.2. Calcium carbonate phases and apatite synthesis
Amorphous calcium carbonate (ACC) was synthesised using a precipitation method at room temperature as reported previously by Combes et al.1 but with an additional step of precipitate washing. Briefly, a solution containing CaCl2·2H2O (0.3 M) and MgCl2·6H2O (0.15 M) (the concentrations were chosen to obtain an atomic ratio of Mg2+/Ca2+ = 0.5) was poured rapidly into a solution of NaHCO3 (0.3 M) under stirring; the pH value of the carbonate solution was previously adjusted to 11 using ammonia solution (20%). The obtained precipitate was immediately filtered, washed with 200 mL of deionised water to remove unreacted counter ions and then freeze-dried at −80 °C for 24 h. It is worth mentioning that ACC is very reactive and a small delay in the synthesis protocol, i.e., beyond 5 min (from the solutions mixing until the start of the freeze–drying process), could lead to its partial crystallisation into calcite.Vaterite was synthesised at room temperature using a precipitation method as previously published.17 Thus, a solution of CaCl2·2H2O (2 M) was added at a controlled flow rate (12 mL min−1) via a peristaltic pump in a solution of Na2CO3·10H2O (1 M) under stirring. The product was filtered and washed with 1.5 L of deionised water and then freeze-dried for 48 h. Aragonite was prepared at almost 100 °C using an already published procedure.18 Briefly, the CaCl2·2H2O solution (0.1 M) was added manually into the Na2CO3·10 H2O solution (0.1 M) containing SrCO3·(1 mM). The obtained precipitate was then filtered, washed with 1 L of deionised water, freeze-dried for 24 h, and stored in a freezer until further use. The aragonite powder (Fig. S1, ESI†) was used as a standard for the quantitative analysis of the cement chemical setting and hardening by X-ray diffraction (see 2.5 Section).
The poorly crystalline phosphocalcic apatite was prepared as previously published19 and used as a standard for comparison with the XRD pattern and FTIR spectrum of the cements after their in vitro evolution study in the SBF.
2.3. Reference and composite cement formulation
The cement was prepared by admixing the ACC and vaterite powders (in a 1![[thin space (1/6-em)]](https://www.rsc.org/images/entities/char_2009.gif) :
:![[thin space (1/6-em)]](https://www.rsc.org/images/entities/char_2009.gif) 2 weight ratio, respectively) with deionised water as the liquid phase (a liquid-to-powder weight ratio (L/P) of 0.72) for the reference mineral cement (CR). Composite cements (CCs) were obtained using the same procedure with a liquid phase containing different amounts of chitosan (1.5, 2.5, 3.5 and 4 wt% with respect to the solid phase). The chitosan powder was dissolved in 1% (v/v) water-diluted acetic acid solution. The prepared composite cements were referred to as CCs1.5, CCs2.5, CCs3.5, and CCs4. Additionally, a cement was also prepared with the acetic acid solution 1% v/v but without chitosan to depict the potential effect of either the acidic medium or the chitosan on the cement's characteristics and properties. Then, the as-prepared pastes were added into a cylindric silicone mould (diameter: 10 mm and height: 6 mm) and placed into a plastic container saturated with water in an oven at 37 °C to set and harden for two days. Finally, the cements were unmoulded and left to dry for two more days at 37 °C.
2 weight ratio, respectively) with deionised water as the liquid phase (a liquid-to-powder weight ratio (L/P) of 0.72) for the reference mineral cement (CR). Composite cements (CCs) were obtained using the same procedure with a liquid phase containing different amounts of chitosan (1.5, 2.5, 3.5 and 4 wt% with respect to the solid phase). The chitosan powder was dissolved in 1% (v/v) water-diluted acetic acid solution. The prepared composite cements were referred to as CCs1.5, CCs2.5, CCs3.5, and CCs4. Additionally, a cement was also prepared with the acetic acid solution 1% v/v but without chitosan to depict the potential effect of either the acidic medium or the chitosan on the cement's characteristics and properties. Then, the as-prepared pastes were added into a cylindric silicone mould (diameter: 10 mm and height: 6 mm) and placed into a plastic container saturated with water in an oven at 37 °C to set and harden for two days. Finally, the cements were unmoulded and left to dry for two more days at 37 °C.
2.4. Physicochemical characterisation of the synthesised powders and the set cements
The phase identification and purity of the synthesised materials were assessed by X-ray diffraction (XRD) using a D8 Advance diffractometer (Bruker) with a Cu Kα anticathode as the radiation source, a 2θ range of 20–60°, and a step size of 0.02°. The phase identification was performed using the ‘Match!’ software (Crystal Impact, Germany). Fourier transform infrared (FTIR) spectroscopy was carried out on a Nicolet iS50 spectrometer (Thermo Scientific) in transmission mode using the KBr pellet method. The spectra were recorded in the range of 400–4000 cm−1 with a resolution of 4 cm−1 and 64 scans accumulation. In the ACC phase including structural water, spectra were also recorded in attenuated total reflection mode (ATR diamond, 64 scans, and a resolution of 4 cm−1) in the same range of wavenumbers to avoid the use of hygroscopic KBr and thus more clearly distinguish ACC water bands if present in the cement.The Raman spectroscopy analysis was performed using a confocal RAMAN Labram HR 800 Horiba Yvon Jobin microscope. The sample was exposed to continuous laser radiation supplied by an argon laser at 532 nm with a power of 12 mW. The sample was placed under an Olympus BX 41 microscope and focused using a x50 objective with a numerical aperture of 0.75 which gave the system a lateral and axial resolution of 0.72 μm and 2.61 μm, respectively. The spectrum of each point was acquired using a 600 tr mm−1 grating with a spectral resolution of 1 cm−1 and collected with a quantum detector cooled at −60 °C by the double Pelletier effect (CCD Synapse). Each spectrum of the maps was acquired with a 40 s time and 3 accumulations. The maps were obtained using an XYZ motorised table with an accuracy of 0.1 μm and a measurement step of 1 μm. The use of autofocus in which the amplitude range was optimised with the roughness of the area studied allowed us to adjust the focus of the laser. Data were processed using the Labspec 6 curve-fitting software and the surface mapping showing the distribution of the two main components as a chitosan/aragonite ratio was plotted based on the bands’ ratio νC–H/ν4CO3.
Thermogravimetric analysis (TGA) was carried out under argon in the range of 25–700 °C with a heating rate of 10 °C min−1 to determine the water content in the synthesised ACC sample.
Scanning electron microscopy (SEM) was performed on a Bruker TESCAN VEGA3 microscope on carbon-coated samples. EDX (EDAX analyser, TESCAN VEGA 3) was calibrated using the stoichiometric apatite and dicalcium phosphate samples to evaluate the Ca/P ratio of samples after immersion in the SBF.
2.5. Setting reaction follow-up
A substantial amount of CR and CCsX pastes were prepared and divided into four smaller samples placed at 37 °C for setting and hardening as described in the 2.3 Section. One sample of each paste formulation studied was removed from the container after different maturation time periods (2 h, 6 h, 24 h, and 48 h) and immediately freeze-dried to remove water from the paste and thus stop the chemical setting reaction. The setting reaction of the cements was followed up by characterising each freeze-dried sample using FTIR spectroscopy and XRD analysis.The XRD quantitative analysis and the crystallite size of each calcium carbonate crystalline phase within the cements were assessed using the software package TOPAS v.4.2 (Bruker AXS). Crystallite sizes, microstrains, and lattice parameters were refined for all the samples from the data obtained in the range of 2θ = [20°–60°] taking a triphasic mixture of commercial calcite, synthesised vaterite and aragonite in a 1![[thin space (1/6-em)]](https://www.rsc.org/images/entities/char_2009.gif) :
:![[thin space (1/6-em)]](https://www.rsc.org/images/entities/char_2009.gif) 1
1![[thin space (1/6-em)]](https://www.rsc.org/images/entities/char_2009.gif) :
:![[thin space (1/6-em)]](https://www.rsc.org/images/entities/char_2009.gif) 1 ratio as a reference sample. The chosen space groups were R
1 ratio as a reference sample. The chosen space groups were R![[3 with combining macron]](https://www.rsc.org/images/entities/char_0033_0304.gif) c,20Pmcn,21 and Ama222 for calcite, aragonite, and vaterite, respectively. No preferred orientation was fixed in the calculations. The PONKCS method (partial or no known crystal structures) was used to determine the ACC content within the prepared cements.23 Briefly, the peak phase of ACC was added using a pseudo space group (P4) with the nano-ranged crystallite size characteristic of the amorphous or poorly crystalline cluster (e.g., 3.5 nm) which was refined. This peak phase was used to fit the background of ACC and determine its amount in the elaborated cements. This method was repeated and verified on several prepared mixtures of powders taken as standards (e.g., calcite
c,20Pmcn,21 and Ama222 for calcite, aragonite, and vaterite, respectively. No preferred orientation was fixed in the calculations. The PONKCS method (partial or no known crystal structures) was used to determine the ACC content within the prepared cements.23 Briefly, the peak phase of ACC was added using a pseudo space group (P4) with the nano-ranged crystallite size characteristic of the amorphous or poorly crystalline cluster (e.g., 3.5 nm) which was refined. This peak phase was used to fit the background of ACC and determine its amount in the elaborated cements. This method was repeated and verified on several prepared mixtures of powders taken as standards (e.g., calcite![[thin space (1/6-em)]](https://www.rsc.org/images/entities/char_2009.gif) :
:![[thin space (1/6-em)]](https://www.rsc.org/images/entities/char_2009.gif) vaterite
vaterite![[thin space (1/6-em)]](https://www.rsc.org/images/entities/char_2009.gif) :
:![[thin space (1/6-em)]](https://www.rsc.org/images/entities/char_2009.gif) aragonite
aragonite![[thin space (1/6-em)]](https://www.rsc.org/images/entities/char_2009.gif) :
:![[thin space (1/6-em)]](https://www.rsc.org/images/entities/char_2009.gif) ACC = 1
ACC = 1![[thin space (1/6-em)]](https://www.rsc.org/images/entities/char_2009.gif) :
:![[thin space (1/6-em)]](https://www.rsc.org/images/entities/char_2009.gif) 1
1![[thin space (1/6-em)]](https://www.rsc.org/images/entities/char_2009.gif) :
:![[thin space (1/6-em)]](https://www.rsc.org/images/entities/char_2009.gif) 1
1![[thin space (1/6-em)]](https://www.rsc.org/images/entities/char_2009.gif) :
:![[thin space (1/6-em)]](https://www.rsc.org/images/entities/char_2009.gif) 1) with an error of ±2%. The PONCKS procedure implemented for the ACC phase quantitative analysis is detailed in Supplementary Note A (see the ESI†).
1) with an error of ±2%. The PONCKS procedure implemented for the ACC phase quantitative analysis is detailed in Supplementary Note A (see the ESI†).
2.6. Setting time and injectability evaluation
The initial and final setting times of each studied cement composition were evaluated at 37 °C according to a protocol adapted from the ASTM C266-03 and ISO 9917-1:2007 standards using a Gillmore needle standard apparatus (HM-310, Gilson Inc.). All measurements were performed in triplicates.The injectability of the cement pastes was evaluated after 3 min of handling (t = 0 corresponding to the beginning of powder and liquid mixing): the cement paste was placed directly into a 5 mL syringe (inner diameter of the syringe body was 1.5 cm and the opening/exit diameter 2 mm) without a needle. The plunger was pushed gently to evacuate the residual air in the paste and the total weight of the paste “tw” was measured. Then, the injectability of the cement paste samples was evaluated by manually pushing the syringe plunger up to the end of the syringe body and the extruded weight of the paste “ew” was measured and the injectability was calculated following eqn (1):
 | (1) |
2.7. Porosity and compressive strength measurements
The cement paste prepared as described in Section 2.3 was added into cylindrical moulds (diameter = 20 mm and height = 10 mm), packed, and shaken to get rid of residual air bubbles that could later affect the mechanical behaviour of the cement blocks. It was then placed in plastic containers including air saturated with water at 37 °C for setting and hardening. After 48 hours, the hardened cements were withdrawn from their moulds and left to dry for 7 days at 37 °C. Each reference and composite cement formulation was prepared in triplicate. The compressive strength of the cylindrical cement blocks was then evaluated using a Hounsfield Series S apparatus with a crosshead speed of 0.3 mm min−1. The porosity measurements of the hardened cements were carried out using a mercury intrusion porosimeter (AutoPore III, Micromeritics, USA), which allows the detection of pores in the range of 360–0.003 μm. The percentage of the total porosity (Ptot) was calculated by the following eqn (2):| Ptot = ρapp × VHg × 100 | (2) |
2.8. In vitro evolution of the reference and composite cements in the SBF
Cement pellets of CR and CCs2.5 (denoted as CCs in the in vitro study) were prepared as described in Section 2.3 and the SBF solution was prepared following the procedure reported by Kokubo et al.24 and the ISO standard [ISO 23317:2014] with some modifications.25 The main difference is that cationic and anionic solutions were prepared separately, and carbonate was added just before starting the SBF test. Briefly, the cationic solution was obtained by dissolving NaCl (137.4 mM), KCl (6 mM), MgCl2·6H2O (3 mM), and CaCl2·2H2O (5 mM) in deionised water. The anionic solution was obtained by dissolving NaCl (137.4 mM), K2HPO4·3H2O (2 mM), and Na2SO4 (1 mM) in deionised water. Then, each solution pH was adjusted to the physiological value (7.40) by the addition of 39 mL of HCl (1 M) and then buffered by tris(hydroxyl-methyl) aminomethane (45 mM). Before starting the test, both cationic and anionic solutions were mixed in equivalent volumes. Then, NaHCO3 (4.2 mM) was added to the prepared mixture just before the immersion of the cement blocks in the as-prepared SBF solution to avoid as much as possible the solution decarbonation which may occur during its storage.Each cement pellet was immersed into 100 mL of SBF solution at 37 °C for different periods of time (6 hours, 3 days, 7 days, 14 days, and 28 days). The SBF solution was renewed every 3 days and the samples were manually shaken every day. At the end of each immersion time, the cement blocks were collected and rinsed using 100 mL of deionised water. This washing operation was repeated three times, and the blocks were dried at 37 °C for 24 h. All the studied specimens were weighed before and after their immersion in the SBF and characterised by XRD and SEM-EDX on cement pellets and FTIR spectroscopy on cement particles obtained after scratching the cement surface. The pH of the SBF solution was also measured after each time point.
3. Results and discussion
3.1. Physicochemical characterisation of the synthesised powders and set cements
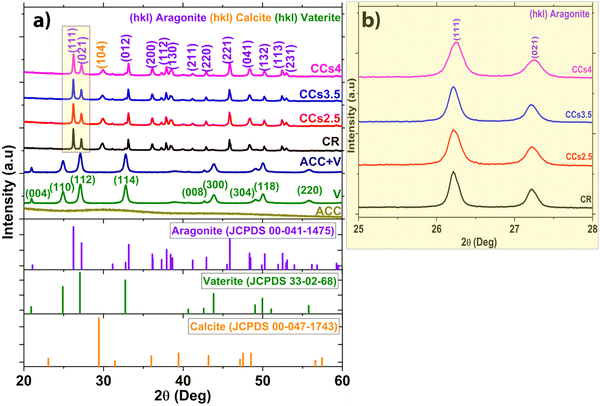
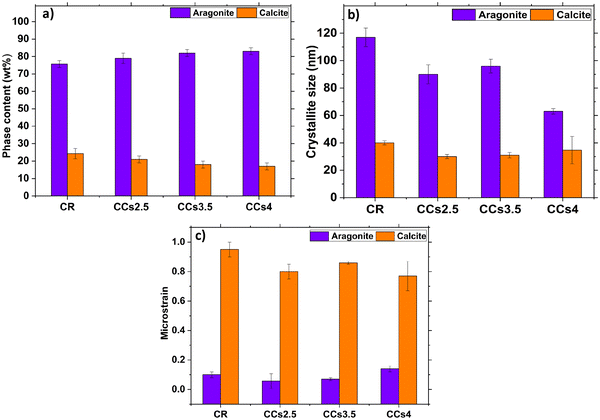
The XRD patterns of the synthesised ACC and vaterite powders are shown in Fig. 1a. The prepared ACC exhibits diffuse halos at 2θ = 30.26° and 46.18° on the XRD pattern corresponding to pure ACC. The pattern of the synthesised vaterite was in agreement with the JCPDS 33-02-68 vaterite reference file with no detection of any other crystalline phases.26The XRD patterns of the set cements (Fig. 1a) showed the formation of aragonite (JCPDS 00-041-1475) as the main phase and a low amount of calcite (JCPDS 00-047-1743) revealed by the peak at 2θ = 29.8° assigned to the (104) diffraction plane of calcite, known to correspond to the calcite most intense diffraction peak. Due to their lower relative intensity, the other peaks of calcite were not visible as they overlapped with intense aragonite peaks. It is noteworthy that no residual vaterite was detected after the cement hardening period (48 h); the peak at 27.2° was assigned to the (021) peak of aragonite (Fig. 1a and b). The calcite (104) peak was slightly shifted towards a higher 2θ value (29.8° vs. 29.4°) probably due to magnesium incorporation into the calcite lattice as reported in previous studies.2,27 The incorporation of magnesium in the crystal lattice of calcite corroborated with the refinement results of the lattice parameters of calcite (Fig. S2, ESI†). Both the a and c parameters of the calcite formed within the cements were smaller than those of pure calcite. This could be explained by the smaller ionic radius of Mg2+ compared to that of Ca2+, 0.72 Å vs. 1 Å, respectively.28 No significant change in the lattice parameters of aragonite was noticed which correlated well with a previously reported work.29 The XRD patterns of the composite cements indicated that the use of chitosan gel (2.5–4 wt%) as the liquid phase did not affect significantly the final cement phase composition. Nevertheless, a broadening of the diffraction peaks of aragonite was observed for the CCs4 composite cement indicating a potential effect of the presence of the chitosan hydrogel on the aragonite crystals’ size and/or strains (Fig. 1b). The quantitative XRD analysis of the crystalline phase content (Fig. 2a) revealed that the aragonite weight content within the cements slightly increased at the expense of calcite in the composite set cements: 76 ± 2% (CR), 79 ± 3% (CCs2.5), 82 ± 2% (CCs3.5) and 83 ± 2% (CCs4). In addition, the apparent size of the formed aragonite crystallites in CR, CCs2.5, CCs3.5, and CCs4 (Fig. 2b) decreased as a function of the amount of chitosan introduced in the cement formulation: 117 ± 6 nm, 90 ± 6 nm, 96 ± 5 nm, and 63 ± 2 nm, respectively. A strong impact was observed for the composite prepared with the highest chitosan loading (4 wt% of chitosan): 63 nm for CCs4 vs. 96 nm for CCs3.5. In the case of calcite, a slight decrease of the apparent crystallite size was observed from 40 ± 3 nm in CR to 27 ± 2 nm, 28 ± 4 nm, and 34 ± 10 nm for CCs2.5, CCs3.5 and CCs4, respectively. The microstrain values remained higher for calcite crystals whatever the cement formulation (Fig. 2c). In correlation with the decrease in the unit-cell dimensions of the calcite formed within the cement, the incorporation of magnesium may also be responsible for the high residual microstrains observed in calcite crystals.
The formation of aragonite-based composite cements is of interest to provide a resorbable bone substitute material. Indeed, aragonite is metastable under physiological conditions compared to calcite which is known to be a poorly resorbable phase in vivo. Nevertheless, Mg-doped calcite is supposed to be more soluble than calcite (in some cases comparable to aragonite at 10 mol% of magnesium29,30); so its presence might not be considered detrimental to the overall biodegradation rate of these composite cements.
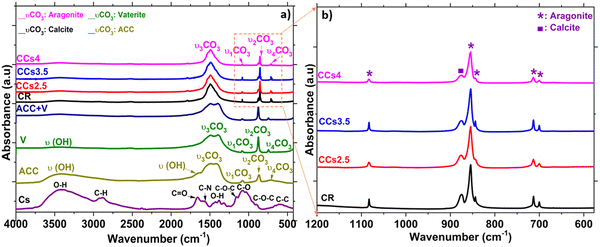
FTIR spectroscopy analysis was carried out to examine the cement compositions at the molecular level (Fig. 3). The FTIR spectrum of the synthesised ACC and vaterite showed some similarities: both are characterised by the υ1CO3 band at 1080 cm−1 and the υ2CO3 band at 870 cm−1 that are commonly found in the other crystalline forms of CaCO3. Moreover, they are characterised by a broad O–H stretching band between 2700 and 3600 cm−1 as well as the presence of an additional band at 1450 cm−1 on the main asymmetric stretching υ3CO3 band. ACC is discerned by a shoulder band at 1650 cm−1 corresponding to structural water and by the broad in-plane deformation of the υ4CO3 band in the range of 700–725 cm−1. This band is more resolved in the crystalline calcium carbonate phases.31 Overall, ACC bands appeared broader than the crystalline CaCO3 band which was reported to be due to the lower coordination of the carbonate anions within ACC.32 According to Gebauer et al.,33 the ACC used in this study is a protocalcite type and it is identified by a unique symmetric υ1 band in the FTIR spectrum at 1076 cm−1 (Fig. 3a). The FTIR spectra of the elaborated cements displayed the symmetric stretching of carbonate υ1CO3 at 1083 cm−1 and out-of-plane bending vibration υ2CO3 at 855 cm−1 characteristic of aragonite. The out-of-plane stretching υ2CO3 of calcite at 875 cm−1 was observed in all the cements (Fig. 3b). υ3CO3 was also observed at 1500 cm−1 and the in-plane bending pair υ4CO3 at the 700–705 cm−1 characteristic of the aragonite phase (Fig. 3). These FTIR data confirmed the XRD results and indicated more specifically the absence of both vaterite and ACC in the set cements. It should be noted that the chitosan characteristic bands (i.e., C![[double bond, length as m-dash]](https://www.rsc.org/images/entities/char_e001.gif) O stretching at 1660 cm−1, N–H deformation in amino groups at 1532 cm−1, C–O stretching at 1030 cm−1, C–O–C asymmetric stretching at 1151 cm−1, and O–H deformation of –CH2–OH and –CH–OH groups at 1377 cm−1 and 1322 cm−1, respectively34) were not observed in the composite cements due to the rather low amount of chitosan introduced in the composite cement formulation (<4 wt%).
O stretching at 1660 cm−1, N–H deformation in amino groups at 1532 cm−1, C–O stretching at 1030 cm−1, C–O–C asymmetric stretching at 1151 cm−1, and O–H deformation of –CH2–OH and –CH–OH groups at 1377 cm−1 and 1322 cm−1, respectively34) were not observed in the composite cements due to the rather low amount of chitosan introduced in the composite cement formulation (<4 wt%).
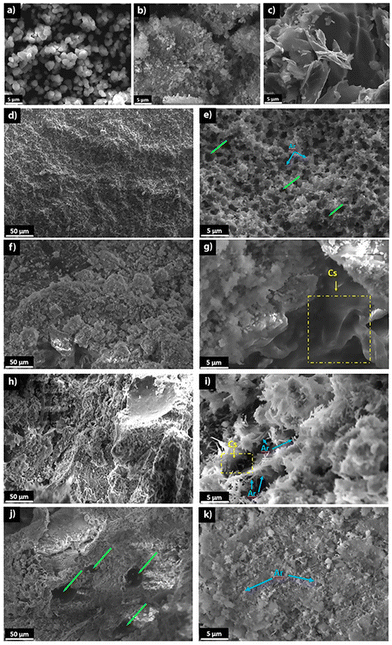
The SEM micrographs of the synthesised vaterite indicated spherical shape microparticles of approximately 3 μm in diameter (Fig. 4a), while the ACC sample appeared as agglomerates of smaller spherical particles (Fig. 4b). Chitosan exhibited the sheet-like particle characteristic of biopolymer matter (Fig. 4c). The hardened CR (Fig. 4d and e) displayed an entangled network of small aragonite needle-like crystals creating a porous microstructure. The SEM micrographs of the composite cements revealed that chitosan embedded the aragonite needle-like crystals leading to a distinct microstructure with the apparently disrupted aragonite crystal network more densely packed than that in CR (Fig. 4f–k). Moreover, agglomeration of chitosan was observed in the composite cements (clearly observable in the drawn yellow square in Fig. 4g) indicating probably that some polymer chain entanglements occurred during the setting of the cement. These microstructure modifications may be due to the dissolution of ACC and vaterite powders and the related pH increase leading to the deprotonation of the amine groups and the gelation of the chitosan moiety.35 The RAMAN mapping of CCs2.5 evidencing several chitosan-rich zones due to chitosan chain entanglement within the composite cement (Fig. S3c, ESI†) supports this hypothesis. The large spherical macropores in the CCs4 cement can be related to the CO2 bubbles formed and trapped within the paste and then in the hardened cement due to the highly viscous composite cement paste (see the green arrows in Fig. 4j).
3.2. Setting reaction follow-up by XRD analysis
Fig. 5 shows the X-ray diffractograms of the elaborated cements after 2 h, 6 h, 24 h, and 48 h of maturation at 37 °C under a wet atmosphere. A remarkable difference in the relative intensity of the peak of aragonite at 2θ = 26.2° was noticed after 6 h of maturation of the composite cements compared to CR (Fig. 5b). Moreover, the peak of vaterite at 2θ = 24.9° was still observed in the CCs3.5 and CCs4 formulations while it was not noticed in the CR and CCs2.5 formulations. These results were further confirmed using FTIR spectroscopy (Fig. S4, ESI†). These observations allowed us to deepen our investigations of the setting reaction of the cements through a quantitative approach to both amorphous and crystalline calcium carbonate phases involved in the chemical setting of the mineral and composite cements.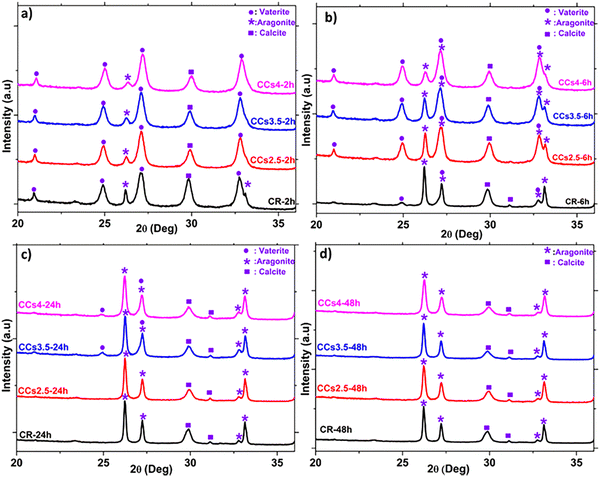 | ||
| Fig. 5 Reference (CR) and composite (CCsX) cement compositions follow-up using XRD after 2 h (a), 6 h (b), 24 h (c), and 48 h (d) of cement paste maturation at 37 °C. | ||
The difficulty of characterising ACC using conventional XRD data treatment or FTIR spectroscopy is due to (i) its diffuse halo which is no more detectable with the XRD analysis once mixed with another crystalline phase (see the (ACC + V) pattern in Fig. 1a) and (ii) the superposition of its characteristic FTIR bands compared with those of the other calcium carbonate phases (see the (ACC + V) spectrum in Fig. 3a) present within the cement makes it challenging to follow up its evolution in such a complex system.
This directed us to use more advanced methods: the PONKCS method. It allows discerning amorphous structures in a complex mixture with other crystalline phases through the modelling and fitting of the background of the amorphous phase from the XRD data.23 This method evidenced that no amorphous phase was present in the cements whatever their studied maturation times (Fig. 6). It is worth mentioning that ACC is extremely reactive even with the use of magnesium as a stabiliser. The FTIR-ATR spectrum of the cement paste at 2 h showed no characteristic water bands of ACC confirming the quantitative XRD study results (Fig. S5, ESI†).
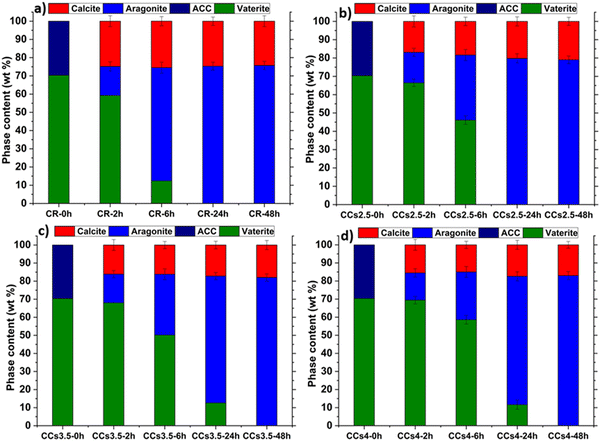
We then focused our investigations on the evolution of the other reactive powder, i.e., vaterite, and the formed crystalline phases during setting. The quantitative results using the refinement of the XRD data (Fig. 6) indicated that the incorporation of chitosan slowed down the vaterite consumption (dissolution) and the subsequent formation of the aragonite phase with a dose-dependent effect: at 2 h, no significant difference was observed, as the aragonite content formed within CR was 16 ± 2 wt%, whereas these were 17 ± 3 wt%, 16 ± 2 wt% and 15 ± 2 wt% in CCs2.5, CCs3.5 and CCs4 composite cements, respectively. It is at 6 h that remarkable differences were observed: the proportion of aragonite formed in CR was 62 ± 2wt%, whereas these were 35 ± 2 wt%, 33 ± 3 wt% and 25 ± 3 wt% in CCs2.5, CCs3.5 and CCs4 composite cements, respectively. Also, the remaining vaterite was present in a fewer proportion in the CR in contrast to the composite cements (i.e., 12 ± 3 wt% in the CR vs. 46 ± 2 wt%, 50 ± 2 wt%, and 59 ± 3 wt% in CCs2.5, CCs3.5 and CCs4, respectively). The quasi-constant amount of the formed calcite independent of the maturation time in the different formulations can support our statement that the calcite was formed from a direct and fast crystallisation of ACC in the early stage (<2 h) of the cement setting. The amount of magnesium-doped calcite formed was lower than the initial amount of ACC due to the role of magnesium (from ACC), which inhibited calcite and favoured aragonite formation. At 24 h of maturation, CR and CCs2.5 reached already their final composition (no more vaterite), while 11 ± 3 wt% and 12 ± 3 wt% of remaining vaterite were still detected in the CCs3.5 and CCs4 composite cements, respectively. Nevertheless, all the elaborated cements reached their final composition after 48 h of maturation as no vaterite nor ACC was detected. The fact that the amount of the formed calcite decreased with the increasing chitosan amount within the cements at 48 h (24 wt% of calcite in CR vs. 21 wt%, 18 wt% and 17 wt% in CCs2.5, CCs3.5 and CCs4, respectively) could suggest that chitosan gel also partly inhibited the crystallisation of calcite in the cement.
Despite the few studies published on calcium carbonate cements, the chemical setting mechanism was not totally understood. The main phenomenon involved in the calcium carbonate cement setting is a dissolution–reprecipitation into more stable crystalline phase(s). It may be affected by the physico-chemical reactivity of the starting powders, in particular ACC and its magnesium and water content,36,37 and by the presence of additives (i.e., magnesium and chitosan) in the cement formulation.
The elemental analysis of the synthesised ACC powder exhibited a Mg2+/Ca2+ ratio of 15.4 at%, which is much lower than the ratio used in the mother solution (Mg2+/Ca2+ of 50 at%). Its water content determined using the TGA was 10 wt% (Fig. S6, ESI†). In fact, water molecules are known to stabilise ACC with hydrogen bonds preventing carbonate ion re-organisation and dehydration.37,38 In addition, it has been shown that the presence of magnesium in ACC fulfils two main roles: (1) stabilising ACC,39 and (2) orienting the recrystallisation process into the resorbable aragonite phase.40 It was also reported that magnesium inhibits calcite crystal growth.41 That is why the lack of magnesium and the presence of calcite impurities in ACC synthesised by Sanchez et al.3 led to the CCC end-product containing calcite as the dominant phase with some unreacted vaterite. Myszka et al.2 used a mixture of vaterite and Mg-stabilised ACC and SBF solution to prepare CCC mainly comprising vaterite with small amounts of aragonite, calcite, and unreacted ACC after setting. This complex final composition could result from the use of SBF including several anions and cations that may affect ACC crystallisation and aragonite formation. In our study, the significant amount of magnesium in the synthesised ACC (Mg2+/Ca2+ = 15.4 at%) plays a pivotal role in the cement final composition (mainly composed of aragonite and Mg-doped calcite) and resorbability due to the higher solubility of Mg-doped calcite compared with calcite. Such a composition was observed in biomimetic calcium carbonates especially aragonite in seawater (e.g., nacre) that was stabilised with magnesium ions and organic matter and hence did not crystallise into calcite.41
The addition of viscous chitosan gel (Fig. S7, ESI†) to the cement paste hindered the calcium and carbonate ion diffusion and subsequent recrystallisation. Moreover, the affinity of chitosan towards calcium ions42,43 can also limit the availability of these ions for recrystallisation, hence delaying both the dissolution of the reactive powders and the formation of the reaction products. A paradox is that viscous media are often used to grow large crystals44 but our experiments indicated an opposite trend: the aragonite crystals obtained in the presence of chitosan appeared smaller compared to those formed in CR when water was used as the liquid phase. However, cement pastes are radically different from the processes used to grow crystals from sparingly soluble salts. Three main steps can be identified in the cements: (i) the dissolution of the most soluble phase, limited in our case by the dissolution equilibrium of vaterite (KspV = 10−8), (ii) the nucleation of a more stable phase in our case aragonite, and (iii) the crystal growth of the newly formed aragonite nuclei. Nucleation and crystal growth are competitive processes determined by the local supersaturation index (SI) defined by the following equation:
| SI = Log(IAP) − Log(Ks) | (3) |
3.3. Setting time and injectability
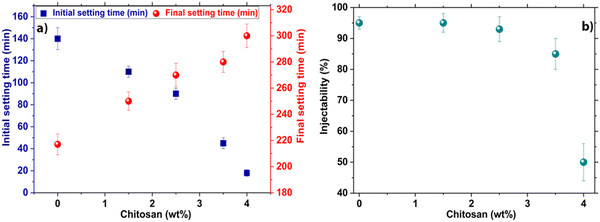
As can be seen (Fig. 7a), the addition of chitosan at rates of 1.5 wt%, 2.5 wt%, 3.5 wt%, and 4 wt% reduced the initial setting time from 140 ± 8 min for CR down to 110 ± 5 min, 90 ± 5 min, 45 ± 4 min and 18 ± 3 min for the composite cements, respectively.The initial setting time showed a gradual decline correlated with the increase of the amount of chitosan in the composite cement formulation (from 140 ± 8 min for CR to 18 ± 3 min for CCs4) (Fig. 7a). In contrast, the final setting time of the cements indicated a progressive increase with an increased amount of chitosan from 217 ± 7 min for CR, to 300 ± 10 min for CCs4. It is noteworthy that the use of acetic acid only (without chitosan) as the liquid phase did not significantly affect both the initial and the final setting times of the cement (140 ± 8 min and 217 ± 7 min for CR vs. 150 ± 6 min and 225 ± 8 min with a 1% v/v acetic acid solution). Therefore, the evolution of the setting time of the cement appeared to be directly correlated with the presence of chitosan gel and in a dose-dependent manner. These results were consistent with previous studies, where the addition of chitosan to calcium phosphate cements decreased the initial setting time of the composites8,46 and increased the final one.9 On the one hand, the chemical reaction follow-up (Fig. 6) indicated that the initial setting time of the composite cement was not directly dependent on the termination of the chemical reaction involved in the setting and hardening of the cement paste (aragonite formation). On the other hand, the final setting time was indeed correlated with the setting reaction since it was delayed by the increasing amount of chitosan in the cement formulations. Such a behaviour has been reported typically in α-tricalcium phosphate (α-TCP)-based cements with or without additives.47 In the present study, the faster initial setting rate could be explained by the increase of the pH of the acidic chitosan gel from a value of 4 to neutral. Moreover, the admixing and dissolution of basic calcium carbonate reactive powders induced the deprotonation of the chitosan amine groups, leading to an entanglement of chitosan chains and an increase of the viscosity of the paste.46 This allowed the initial setting and hardening of the cement before the formation of a significant amount of aragonite responsible for the final setting time. In fact, the chitosan chains are separated when dissolved in an acetic acid solution due to the repulsion of positively charged amino groups. However, due to the presence of anionic carbonate ions causing screening of the repulsions between amino groups and the increase of the pH, chitosan then undergoes gelation when the pH is over 6. Additionally, a physical crosslinking between polymer chains through calcium ions coordination with the amine groups of chitosan is also possible.48 This would result in a pH-sensitive physical reaction49 responsible for the initial setting/hardening of the composite cements. It should be noted that other polysaccharides were tested (e.g., alginate, cellulose and starch, data not presented); yet only chitosan exhibited a remarkable decrease in the initial setting time of the cement.
The injectability of CCC was found to be high (95 ± 3%) for the CR paste owing to its inherent thixotropic behaviour and shear thinning properties as reported in a previous study.50 It exhibits very good injectability unlike what is generally noticed for most of the calcium phosphate cements.51 The addition of 1.5 wt%, 2.5 wt%, and 3.5 wt% of chitosan did not significantly affect the paste injectability which remained very high: 95 ± 5%, 93 ± 4%, and 85 ± 5% respectively (Fig. 7b). However, a marked decrease in injectability was noticed for the paste including 4 wt% of chitosan which can be correlated with the remarkable reduction of its initial setting time (18 min). Indeed, the beneficial role of chitosan in a faster mechanical setting competed with cement paste injectability. For the composite paste prepared with 4 wt% of chitosan, the faster mechanical setting and hardening process started within the very first minutes (3 minutes) of paste preparation and maturation; it was the predominant factor kinetically. It is worth mentioning that the results of the cement including a chitosan-loading higher than 4 wt% were not presented as it was not possible to obtain a paste.
3.4. Porosity and compressive strength evaluation
The total porosity of the elaborated cements was not significantly affected by the use of chitosan hydrogel: 60%, 54%, 56% and 59% for CR, CCs2.5, CCs3.5 and CCs4, respectively. However, the pore size distribution (Fig. 8) showed that the composite cements exhibited a smaller pore size with respect to the CR one: the average pore size decreased from 310 nm for CR to 66 nm, 110 nm and 89 nm for CCs2.5, CCs3.5 and CCs4, respectively. Moreover, the composite cement CCs4 displayed additional larger pores at 670 nm, 1.2 μm and 2.1 μm (Fig. 8d). The decrease in the pore size of the composite cements could be due to the partial filling of the cement pores with chitosan gel; the lowest concentration tested (2.5 wt%) leading to the less viscous chitosan gel (liquid phase) with the highest ability to diffuse and fill the pores (CCs2.5 showed the lowest average pore size: 66 nm). The creation of macropores in the CCs4 formulation could be related to the entrapment of air/CO2 bubbles due to the higher viscosity of the chitosan gel used to prepare this cement. Interestingly, the porosity of the elaborated cements would enhance their bioresorption ability52 and could make them a potential drug delivery system for the local treatment of bone infections and/or diseases.53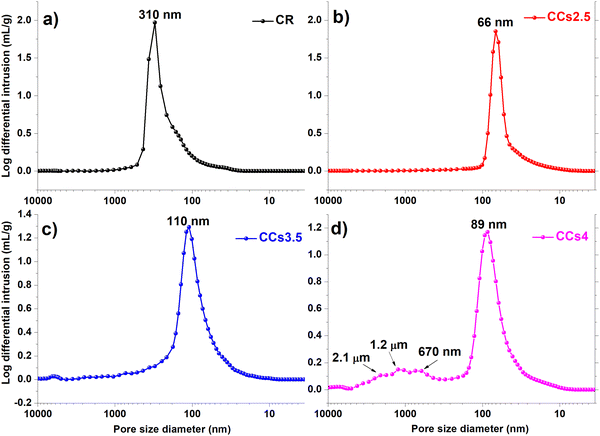 | ||
| Fig. 8 Pore size distribution within the hardened cements: (a) CR, (b) CCs2.5, (c) CCs3.5 and (d) CCs4. | ||
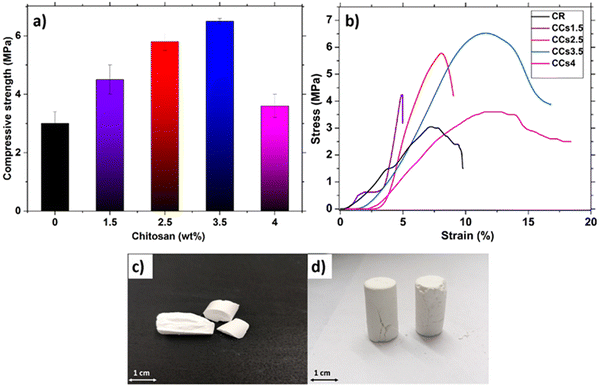
The evolution of the hardened cement compressive strength as a function of the amount of chitosan is shown in Fig. 9a. CR exhibited the lowest value (3.0 ± 0.4 MPa) compared to the composite cements. The increase in the amount of chitosan introduced in the cement formulation from 1.5 wt% to 3.5 wt% induced an increase of the compressive strength from 4.5 ± 0.5 MPa to 6.5 ± 0.1 MPa (Fig. 9a). However, it decreased to 3.6 ± 0.4 MPa with the use of 4 wt% of chitosan. Furthermore, the stress–strain curves (Fig. 9b) revealed that CR exhibited brittle behaviour while a plastic deformation before the break was observed for the composite cements CCs3.5 and CCs4. Interestingly, at 3.5 wt%, chitosan conferred some ductility to the composite cement in addition to an increase in its compressive strength.
The increase in the compressive strength was due to the known reinforcement effect of polysaccharides in general and chitosan in particular, as reported previously for calcium phosphate cements.54 Our findings could be explained by the competition of three mechanisms: (1) the binding effect of chitosan acting as a reinforcing agent of the brittle mineral cement and the pores filling with chitosan gel; (2) CO2 bubble significant entrapping within the composite cement matrix weakening the hardened cement, especially for the highest concentration of chitosan tested; (3) the aragonite crystal growth inhibition with high chitosan amount. Up to 3.5 wt% of chitosan, the mechanical behaviour of composite cements was mainly governed by mechanism 1 whereas mechanisms 2 and 3 should be prevalent for the CCs4 cement. Indeed for the latter, the chitosan acidic solution presented a high viscosity preventing air/CO2 evacuation resulting in larger pores/defects (Fig. 4j and 8d) and limiting ion diffusion and thus aragonite crystal growth (Fig. 2b), which in turn limited the reinforcing ability of chitosan. Therefore, the use of chitosan amount higher than 3.5 wt% or lower than 1.5 wt% (brittle behaviour, data not shown) could be detrimental to the composite cement mechanical and rheological properties, evidencing that a minimum amount of chitosan is required to take advantage of the benefits of chitosan. Our findings are consistent with previously reported studies on the effect of polysaccharides in other mineral bone cements pointing out that the heterogeneity of the organic/inorganic component mixture is one of the most reported issue challenging the elaboration of composite materials with satisfactory mechanical properties.15 In addition, the composite cements including 3.5 wt% or 4 wt% of chitosan presented a good toughness as the samples maintained their forms after the compression tests (Fig. 9d) compared to that of CR which was broken (Fig. 9c). This behaviour can be of interest in clinical applications as the samples can withstand mechanical stresses that exceed their maximum strength without losing their structural integrity before bone neoformation. This result could be encouraging to investigate the mechanical properties of these composites under conditions closer to the physiological ones (wet conditions and presence of biological fluids). Overall, the obtained compressive strength of the elaborated cements was in a range corresponding to that of the spongy bone (2–11 MPa) and could be used for non-load-bearing applications in orthopaedics.55
3.5. In vitro assessment of cement evolution in the SBF solution
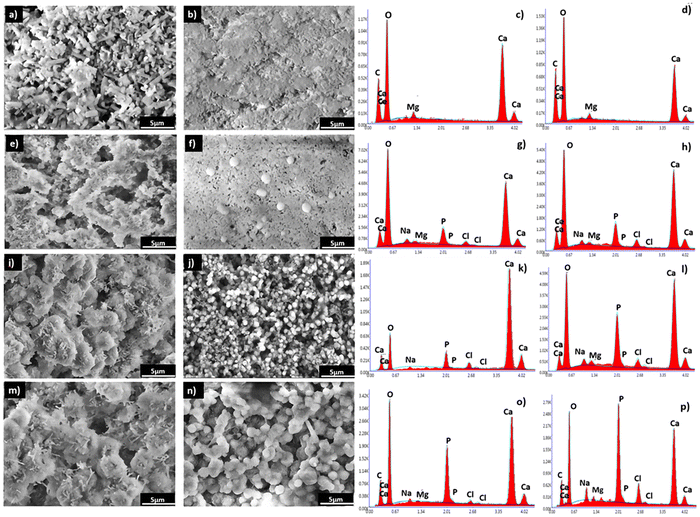
The EDX analysis denoted the presence of calcium, carbon, and oxygen in both the CR (Fig. 11c) and CCs (Fig. 11d) cements. After immersion of these materials in the SBF, an additional phosphorus signal appeared from 7 days and its relative intensity increased with the time of immersion and was, at each time point, higher for CCs than that for CR. These EDX results corroborated with the formation of the apatite deposits observed on the surface of CR (Fig. 11g, k and o) and CCs (Fig. 11h, l and p).
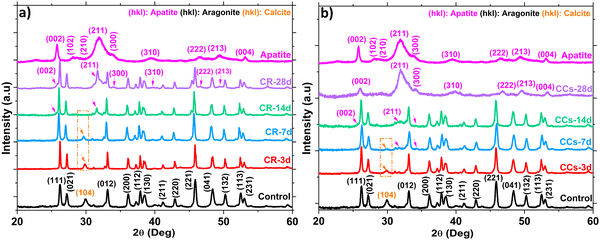
We evaluated the Ca/P ratio from the EDX analysis to check any evolution related to apatite formation on the cement surface. The results indicate a progressive decrease of the calculated Ca/P ratio in both the CR and CCs cements (Table 1) as a function of the immersion time. The Ca/P ratio for CR at 28 days (3.6) was very high with respect to that of stoichiometric hydroxyapatite (1.67) due to the coexistence of both aragonite and apatite in the end product. The Ca/P ratio of CCs at 28 days (1.8) was lower than that for CR but remained slightly higher compared to the stoichiometric hydroxyapatite; this result supports: (i) the identification of the CCs surface mainly constituted of apatite at 28 days (Fig. 10b), (ii) the observation of a more homogeneous covering of the CCs surface by apatite (Fig. 11n) and (iii) the substitution of phosphate with carbonate ions in the apatite formed on the CCs cement.
| Ca/P (±0.1) of cements after their immersion in the SBF | |||
|---|---|---|---|
| 7 days | 14 days | 28 days | |
| CR | 7.7 | 7.3 | 3.6 |
| CCs | 6.9 | 3.5 | 1.8 |
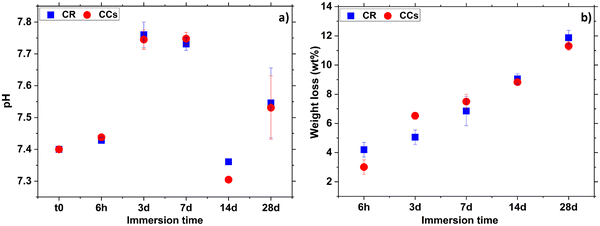 | ||
| Fig. 12 Evolution of the (a) pH of the solution and (b) weight loss in CR and CCs cements as a function of their immersion time in the SBF solution. | ||
The increase of the pH in the early immersion times (up to 7 days) could be due to the release of alkaline carbonate ions in the solution indicating the start of the magnesium-doped–calcite resorption process. Then, the significant pH decrease at 14 days of immersion is due to the precipitation of apatite on both the CR and CCs cement surfaces.
As already shown by XRD and FTIR spectroscopy (Fig. 2 and 3), CR and CCs cements have the same mineral phase composition (mainly aragonite and some calcite) and Fig. 12b shows that they have undergone quite similar weight loss evolution up to 28 days. These results (positive weight losses up to 11–12 wt% at 28 days) showed that the degradation rate remained superior to that of apatite formation, allowing progressive resorption as a function of immersion time in the SBF for both the CR and CCs cements.
Table 2 shows the weight loss of the developed calcium carbonate cements compared with that of the apatitic cement in solution as reported in the literature.56 As expected, the weight losses of calcium carbonate cements prepared in the present work were superior to those of apatitic materials56,57 after their immersion in the SBF solution.
The higher apatite forming ability of the composite cement could be explained by multiple factors: (i) the higher initial amount of aragonite within this composite cement in contrast to the reference cement (76 wt% in CR vs. 79 wt% in CCs, see Fig. 2), (ii) the lower crystallite size of both aragonite (90 nm for CCs vs. 117 nm for CR, see Fig. 2) and Mg–calcite (40 nm for CR vs. 27 nm for CCs, see Fig. 2) formed in the composite cement, and (iii) the presence of chitosan on its surface. The higher resorption rate of aragonite and faster resorption of Mg-doped calcite (Fig. 10) within the composite cement could favor a higher apatite precipitation in the composite. Furthermore, the lower crystallite size of aragonite formed in the presence of chitosan gel could explain a higher reactivity and solubility58 of this phase in CCs. In addition, chitosan appeared to favour nucleation over crystal growth allowing an increased nucleation rate of aragonite on the composite cement surface creating an increased number of active sites serving as apatite seeds. Furthermore, the chitosan affinity to calcium as well as the interaction between amino groups of chitosan and the phosphate ions provided by the SBF solution could accelerate the nucleation of apatite.47
The apatite formation ability of natural calcium carbonates has been used as a promising approach not only to produce bioactive compounds but also to exploit the complex hierarchical structures of these materials.16 In this context, Wang et al.59 showed the ability of a seashell “Saxidomus purpuratus” which is a natural aragonite-based ceramic to form apatite after immersion in the SBF. Although a pre-incubation step in a phosphate buffer solution (PBS) was used to accelerate the apatite formation, it seemed that the immersed shells in the SBF for 4 weeks were still containing aragonite. These results suggest that the developed composite cement in our work seems to be comparable with the natural aragonite-containing materials and superior to synthetic aragonite ceramic in terms of both the resorption rate and apatite mineralisation ability.6 This result indicated that the aragonite cement which is a confined environment allowed the growth of more resorbable aragonite probably due to a smaller crystallite size than that of typical synthetic well-crystallised aragonite, hence the difference in reactivity and resorption rate.
The low crystallinity of the formed apatite on the composite is of interest due to its similarity to the bone mineral and its expected higher resorption rate.60 In addition, several groups16,61 reported that natural aragonite (nacre), composed of aragonite and chitin (acetylated chitosan), exhibited high biocompatibility, biodegradation as well as osteoconductivity and high osteogenic potential.
The cytocompatibility and non-toxicity of the calcium carbonate cement has been already demonstrated.1 Moreover, chitosan is a biocompatible and biosourced polymer reported to induce cell attachment and proliferation with osteogenic differentiation.62 Hence, the elaborated CCs composite cement is expected to be biocompatible and non-cytotoxic. It led to the deposition of a biomimetic apatite after 4 weeks of immersion in the SBF which can be considered a promising approach also to obtaining in situ biomimetic carbonated apatite-based bioactive ceramics for bone substitution.
4. Conclusion
An injectable composite cement based mainly on aragonite and chitosan hydrogel was developed and fully characterised. This study was devoted to understand the role of chitosan in the composition, microstructure, setting, injectability, mechanical properties and the in vitro evolution in the SBF. We showed that the presence of chitosan decreased the setting time and, up to 3.5 wt% of chitosan, it did not significantly affect neither the composite final composition nor the paste injectability which remained very high (>85 ± 5%). The composite cement presenting the best compromise in terms of setting time, injectability and mechanical properties (analogous to those of spongy bone) was the one including 3.5 wt% of chitosan. The setting chemical reaction follow-up based on the X-ray diffraction data treatment revealed the dose-dependent effect of chitosan on vaterite dissolution and aragonite crystallisation which were significantly delayed during the first hours of setting in the presence of chitosan. However, after 48 h of setting and hardening, the composition of the four composite cements studied was almost the same, comprising less than 20 wt% of Mg-doped calcite and more than 80 wt% of aragonite. The in vitro evolution of the reference and composite cements in the SBF solution at 37 °C showed an improved apatite forming ability and a moderate resorption rate of the composite cement leading mainly to the deposition of a biomimetic carbonated apatite after 4 weeks of immersion in the SBF. Future efforts will aim to investigate the in vitro cellular and in vivo behaviour and properties of the composite cements. This study paves the way for the development of novel injectable bone substitute composite materials and supports a new direction for building material applications based on CaCO3 cements which may involve a lower carbon footprint than conventional inorganic binders.Author contributions
ET carried out the synthesis and most of the characterisation of all cements studied. Among the complementary characterisation, OM carried out Raman microspectroscopy mapping, CCH carried out the XRD data treatment for the quantitative analysis, SC carried out the porosity measurements and CR contributed to the vibrational spectroscopy data interpretation. CC supervised ET research work in France and AB, HN and HB in Morocco. ET mainly wrote the initial draft of the manuscript, and all the authors contributed to the final version of the article.Conflicts of interest
There are no conflicts of interest to declare.Acknowledgements
The authors would like to thank Mohammed VI Polytechnic University and Toulouse INP for their financial support. The authors are also thankful to the centre of analysis and characterisation studies (CAC) of Cadi Ayyad University in Marrakech (Morocco).References
- C. Combes, B. Miao, R. Bareille and C. Rey, Biomaterials, 2006, 27, 1945–1954 CrossRef CAS PubMed.
- B. Myszka, K. Hurle, K. Zheng, S. E. Wolf and A. R. Boccaccini, J. Mater. Chem. B, 2019, 7, 3403–3411 RSC.
- J. Rodriguez Sánchez, D. K. Dysthe and A. R. Boccaccini, J. Am. Ceram. Soc., 2019, 102, 6980–6990 CrossRef.
- C. W. Hargis, I. A. Chen, M. Devenney, M. J. Fernandez, R. J. Gilliam and R. P. Thatcher, Materials, 2021, 14, 1–12 CrossRef PubMed.
- J. Rodríguez Sánchez, T. Liberto, C. Barentin and D. K. Dysthe, Materials, 2018, 13, 1–15 Search PubMed.
- B. Myszka, M. Schüßler, K. Hurle, B. Demmert, R. Detsch, A. R. Boccaccini and S. E. Wolf, RSC Adv., 2019, 9, 18232–18244 RSC.
- Y. Fujita, T. Yamamuro, T. Nakamura, S. Kotani, C. Ohtsuki and T. Kokubo, J. Biomed. Mater. Res., 1991, 25, 991–1003 CrossRef CAS PubMed.
- L. Sun, H. H. K. Xu, S. Takagi and C. Laurence, J. Biomater. Appl., 2007, 21, 300–315 CrossRef PubMed.
- L. Yu, K. Xia, C. Gong, J. Chen, W. Li, Y. Zhao, W. Guo and H. Dai, Int. J. Biol. Macromol., 2020, 160, 101–111 CrossRef CAS PubMed.
- R. A. Perez, H. Kim and M. Ginebra, J. Tissue Eng., 2012, 3, 1–18 Search PubMed.
- L. Yang, Q. Wang, L. Peng, H. Yue and Z. Zhang, Mol. Med. Rep., 2015, 12, 2343–2347 CrossRef CAS PubMed.
- R. Logithkumar, A. Keshavnarayan, S. Dhivya, A. Chawla, S. Saravanan and N. Selvamurugan, Carbohydr. Polym., 2016, 151, 172–188 CrossRef CAS PubMed.
- T. Kean and M. Thanou, Adv. Drug Delivery Rev., 2010, 62, 3–11 CrossRef CAS PubMed.
- M. D’Almeida, N. Attik and J. Amalric, PLoS One, 2017, 12, 1–11 Search PubMed.
- A. Zima, Spectrochim. Acta, Part A, 2018, 193, 175–184 CrossRef CAS PubMed.
- E. M. Gerhard, W. Wang, C. Li, J. Guo, I. T. Ozbolat, K. M. Rahn, A. D. Armstrong, J. Xia, G. Qian and J. Yang, Acta Biomater., 2017, 54, 21–34 CrossRef CAS PubMed.
- S. Jacquart, R. Siadous, C. Henocq-Pigasse, R. Bareille, C. Roques, C. Rey and C. Combes, J. Mater. Sci.: Mater. Med., 2013, 24, 2665–2675 CrossRef CAS PubMed.
- S. Tadier, S. Rokidi, C. Rey, C. Combes and P. G. Koutsoukos, J. Cryst. Growth, 2017, 458, 44–52 CrossRef CAS.
- C. Rey, H. Kim, M. Gerstenfeld and M. Glimcher, J. Bone Miner. Res., 1995, 10, 1577–1588 CrossRef CAS PubMed.
- J. R. Smyth and T. J. Ahrens, Geophys. Res. Lett., 1997, 24, 1595–1598 CrossRef CAS.
- A. D. Negro and L. Ungaretti, Am. Mineral., 1971, 56, 43–44 Search PubMed.
- A. Le Bail, S. Ouhenia and D. Chateigner, Powder Diffr., 2011, 26, 16–21 CrossRef CAS.
- I. C. Madsen, N. V. Y. Scarlett and A. Kern, Z. Kristallogr., 2011, 226, 944–955 CrossRef CAS.
- T. Kokubo, H. Kushitani, S. Sakka, T. Kitsugi and T. Yamamum, J. Biomed. Mater. Res., 1990, 24, 721–734 CrossRef CAS PubMed.
- M. Desbord, J. Soulié, C. Rey and C. Combes, ACS Biomater. Sci. Eng., 2021, 8, 2363–2374 CrossRef PubMed.
- D. B. Trushina, T. V. Bukreeva, M. V. Kovalchuk and M. N. Antipina, Mater. Sci. Eng., C, 2014, 45, 644–658 CrossRef CAS PubMed.
- M. C. Nash, B. N. Opdyke, Z. Wu, H. Xu and J. M. Trafford, J. Sediment. Res., 2013, 83, 1084–1098 CrossRef.
- B. Shannon, Acta Crystallogr., Sect. A: Cryst. Phys., Diffr., Theor. Gen. Crystallogr., 1976, 32, 751–767 CrossRef.
- S. Raz, S. Weiner and L. Addadi, Adv. Mater., 2000, 12, 38–42 CrossRef CAS.
- A. J. Andersson, F. T. Mackenzie and N. R. Bates, Mar. Ecol.: Prog. Ser., 2008, 373, 265–273 CrossRef CAS.
- J. D. Rodriguez-Blanco, S. Shaw and L. G. Benning, Nanoscale, 2011, 3, 265–271 RSC.
- P. Opitz, L. Besch, M. Panthöfer, A. Kabelitz, R. E. Unger, F. Emmerling, M. Mondeshki and W. Tremel, Adv. Funct. Mater., 2021, 31, 1–15 CrossRef.
- D. Gebauer, P. N. Gunawidjaja, J. Y. P. Ko, Z. Bacsik, B. Aziz, L. Liu, Y. Hu, L. Bergström, C. Tai, T. Sham, M. Edøn and N. Hedin, Angew. Chem., Int. Ed., 2010, 49, 8889–8891 CrossRef CAS PubMed.
- K. Wang and Q. Liu, Colloids Surf., A, 2013, 436, 656–663 CrossRef CAS.
- S. Jacquart, D. Poquillon, G. Dechambre, S. Cazalbou, C. Rey and C. Combes, J. Mater. Sci., 2016, 51, 4296–4305 CrossRef CAS.
- F. Sebastiani, S. L. P. Wolf, B. Born, T. Q. Luong, H. Cölfen, D. Gebauer and M. Havenith, Angew. Chem., Int. Ed., 2017, 56, 490–495 CrossRef CAS PubMed.
- S. Sen, D. C. Kaseman, B. Colas, D. E. Jacob and S. M. Clark, Phys. Chem. Chem. Phys., 2016, 18, 20330–20337 RSC.
- H. Du and E. Amstad, Angew. Chem., Int. Ed., 2020, 59, 1798–1816 CrossRef CAS PubMed.
- E. Loste, R. M. Wilson, R. Seshadri and F. C. Meldrum, J. Cryst. Growth, 2003, 254, 206–218 CrossRef CAS.
- Z. Zhang, Y. Xie, X. Xu, H. Pan and R. Tang, J. Cryst. Growth, 2012, 343, 62–67 CrossRef CAS.
- M. Boon, W. D. A. Rickard, A. L. Rohl and F. Jones, Cryst. Growth Des., 2020, 20, 5006–5017 CrossRef CAS.
- T. H. K. Nawarathna, K. Nakashima and S. Kawasaki, Int. J. Biol. Macromol., 2019, 133, 867–874 CrossRef CAS PubMed.
- J. Nie, Z. Wang and Q. Hu, Sci. Rep., 2016, 6, 1–8 CrossRef PubMed.
- J. K. Sun, Y. I. Sobolev, W. Zhang, Q. Zhuang and B. A. Grzybowski, Nature, 2020, 579, 73–79 CrossRef CAS PubMed.
- M. A. Hood, K. Landfester and R. Muñoz-Espí, Colloids Surf., A, 2018, 540, 48–52 CrossRef CAS.
- L. Leroux, Z. Hatim, M. Fre and J. L. Lacout, Bone, 1999, 25, 31S–34S CrossRef CAS PubMed.
- J. Czechowska, A. Zima, Z. Paszkiewicz, J. Lis and A. Ślósarczyk, Ceram. Int., 2014, 40, 5523–5532 CrossRef CAS.
- J. Venkatesan and S. K. Kim, Mar. Drugs, 2010, 8, 2252–2266 CrossRef CAS PubMed.
- J. Cho, M. C. Heuzey, A. Bégin and P. J. Carreau, Biomacromolecules, 2005, 6, 3267–3275 CrossRef CAS PubMed.
- C. Combes, S. Tadier, H. Galliard, S. Girod-fullana, C. Charvillat, C. Rey, R. Auzély-velty and N. El Kissi, Acta Biomater., 2010, 6, 920–927 CrossRef CAS PubMed.
- R. O. Neill, H. O. Mccarthy, E. B. Montufar, M. Ginebra, D. I. Wilson, A. Lennon and N. Dunne, Acta Biomater., 2017, 50, 1–19 CrossRef PubMed.
- A. Diez-Escudero, M. Espanol, S. Beats and M. P. Ginebra, Acta Biomater., 2017, 60, 81–92 CrossRef CAS PubMed.
- M. Ginebra, C. Canal, D. Pastorino and E. B. Montufar, Adv. Drug Delivery Rev., 2012, 64, 1090–1110 CrossRef CAS PubMed.
- Z. Shi, K. G. Neoh, E. T. Kang and W. Wang, Biomaterials, 2006, 27, 2440–2449 CrossRef CAS PubMed.
- W. Suchanek and M. Yoshimura, J. Mater. Res., 1998, 13, 94–117 CrossRef CAS.
- L. Yu, Y. Li, K. Zhao, Y. Tang, Z. Cheng, J. Chen, Y. Zang, J. Wu, L. Kong, S. Liu, W. Lei and Z. Wu, PLoS One, 2013, 8, e62570 CrossRef CAS PubMed.
- M. Safarzadeh, C. Fei and S. Ramesh, Ceram. Int., 2022, 48, 18174–18179 CrossRef CAS.
- R. Tang, C. A. Orme and G. H. Nancollas, Chem. Phys. Chem., 2004, 5, 688–696 CrossRef CAS PubMed.
- X. Wang, H. M. Ji and X. W. Li, Mater. Des., 2018, 139, 512–520 CrossRef CAS.
- M. T. Fulmer, I. C. Ison, C. R. Hankermayer, B. R. Constantz and J. Ross, Biomaterials, 2002, 23, 751–755 CrossRef CAS PubMed.
- H. Liao, H. Mutvei, M. Sjöström, L. Hammarström and J. Li, Biomaterials, 2000, 21, 457–468 CrossRef CAS PubMed.
- I. Y. Kim, S. J. Seo, H. S. Moon, M. K. Yoo, I. Y. Park, B. C. Kim and C. S. Cho, Biotechnol. Adv., 2008, 26, 1–21 CrossRef CAS PubMed.
Footnote |
| † Electronic supplementary information (ESI) available. See DOI: https://doi.org/10.1039/d2nj05515e |
| This journal is © The Royal Society of Chemistry and the Centre National de la Recherche Scientifique 2023 |

