
Defect engineering enhances plasmonic-hot electrons exploitation for CO2 reduction over polymeric catalysts†
Hang
Yin‡
 ab,
Zhehao
Sun‡
a,
Kaili
Liu‡
a,
Ary Anggara
Wibowo
c,
Julien
Langley
a,
Chao
Zhang
d,
Sandra E.
Saji
a,
Felipe
Kremer
e,
Dmitri
Golberg
d,
Hieu T.
Nguyen
c,
Nicholas
Cox
a and
Zongyou
Yin
*ab
ab,
Zhehao
Sun‡
a,
Kaili
Liu‡
a,
Ary Anggara
Wibowo
c,
Julien
Langley
a,
Chao
Zhang
d,
Sandra E.
Saji
a,
Felipe
Kremer
e,
Dmitri
Golberg
d,
Hieu T.
Nguyen
c,
Nicholas
Cox
a and
Zongyou
Yin
*ab
aResearch School of Chemistry, Australian National University, ACT 2601, Australia. E-mail: zongyou.yin@anu.edu.au
bInstitute for Climate, Energy & Disaster Solutions, Australian National University, ACT 2601, Australia
cSchool of Engineering, Australian National University, Canberra, Australian Capital Territory 2601, Australia
dCentre for Materials Science and School of Chemistry and Physics, Faculty of Science, Queensland University of Technology (QUT), 2 George Street, Brisbane, Queensland 4000, Australia
eCentre for Advanced Microscopy, Australian National University, Canberra, ACT 2601, Australia
First published on 5th September 2023
Abstract
Defect sites present on the surface of catalysts serve a crucial role in different catalytic processes. Herein, we have investigated defect engineering within a hybrid system composed of “soft” polymer catalysts and “hard” metal nanoparticles, employing the disparity in their thermal expansions. Electron paramagnetic resonance, X-ray photoelectron spectroscopy, and mechanistic studies together reveal the formation of new abundant defects and their synergistic integrability with plasmonic enhancement within the hybrid catalyst. These active defects, co-localized with plasmonic Ag nanoparticles, promote the utilization efficiency of hot electrons generated by local plasmons, thereby enhancing the CO2 photoreduction activity while maintaining the high catalytic selectivity.
New conceptsDefect engineering is one of the key strategies to enhance the catalytic activity of heterogeneous catalysts for different applications. Since defects usually act as catalytic centers, the abundance of defects directly influences catalytic performance. Herein, we discovered a strategy to introduce active defects into polymeric photocatalyst g-C3N4 through the facile annealing process in the presence of metallic Ag nanoparticles. The newly introduced defects, co-localized with Ag nanoparticles, facilitate the exploitation of Ag's plasmonic-hot electrons to further enhance the photocatalytic activity, while maintaining the catalyst's high selectivity. This strategy holds potential for extension to various systems based on polymers, hard materials and hybrid materials, thereby benefiting a diverse range of applications that leverage the functionalities of defects. |
Introduction
Anthropogenic climate change, a result of CO2 emissions since the industrial revolution, represents a key challenge for humanity in the 21st century. In order to mitigate CO2 emissions, new technologies need to be developed that can harvest or recycle CO2 into new materials, simultaneously protecting the environment and supplying new sustainably produced products.1 Among all these new technologies, photocatalysis2,3 has attracted particular attention as it facilitates spontaneous catalysis processes without additional driven force other than light.4 A complete photocatalytic process contains multiple steps including: (i) reactant adsorption; (ii) photon absorption; (iii) exciton separation, (iv) carrier transport; (v) the catalytic reaction; and (vi) product desorption.5 As such, many strategies have been explored,6–8 to optimise every step related to photocatalysis process, in order to realise enhanced photocatalytic performance.Defects play important roles in heterogeneous catalysis. The presence of defects can optimise catalytic processes by modulating adsorption properties, regulating electronic structure, tuning selectivity and enhancing activity (lowering the activation barrier) of the catalyst.9 Accumulated evidence has shown that defect density correlates with the catalytic activity of solid catalysts, as more defects introduce more coordination sites, leading to a better reactant absorption.10,11 In addition, as the defect is usually the active sites for catalysis, the increased density of defects increases the overall reaction rate.12,13 Therefore, defects engineering is now considered an important strategy in optimizing catalytic performance.14,15
The efficient utilisation of defects for photocatalysis however needs a sufficient electron flux. In conventional photocatalysis, these come from photoirradiation of a semiconductor substrate, which places a limitation of the rate of electron injection to active sites. An attractive alternative is to exploit the plasmonic effect, which can provide additional hot electrons to promote the photocatalytic reaction.16
In this study, we have used a defect abundant g-C3N4, a polymer catalyst,17 as the semiconducting substrate, loaded with Ag nanoparticles (NPs) as the plasmonic source to construct g-C3N4-Ag catalyst. The g-C3N4-Ag catalyst showed enhanced CO2 photoreduction activity with its high product selectivity to CO preserved. We could demonstrate that original defects on g-C3N4 surface were partially occupied by the grown Ag NPs. Additional defects could be introduced during annealing g-C3N4-Ag, resulting in a plethora of active sites that are beneficial for photocatalysis. The newly formed defects were co-located with the Ag NPs, enhancing the utilising efficiency of hot electrons ejected from Ag NPs, thus further enhancing activity without compromising the catalytic selectivity.
Results and discussion
The pristine g-C3N4 material showed a good CO2 reduction reaction (CO2RR) selectivity of near 100% CO production (Fig. 1a and b) without observing other carbon products or hydrogen. Unfortunately though, its limited production rate (Fig. 1a) makes this material not suitable for industrial applications. We speculate this limited efficiency derives from inefficient harvesting of incident light or insufficient electron injection from the semiconductor substrate.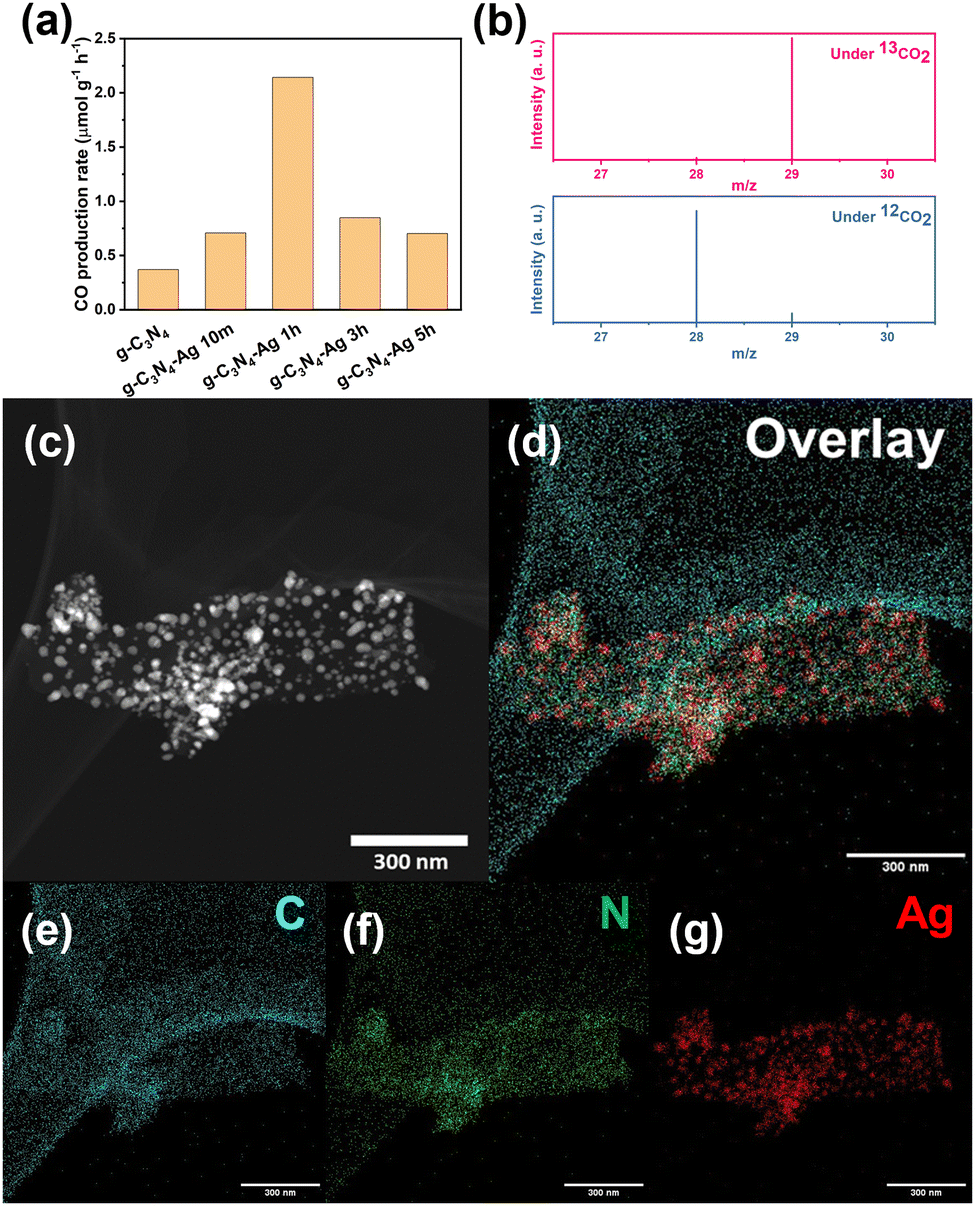 | ||
| Fig. 1 (a) CO production rate based on various catalysts. (b) Isotope labelling experiments tested under 13CO2 and 12CO2, respectively. The mass spectrometry (MS) signals at m/z = 28 and m/z = 29 are 12CO and 13CO, respectively. (c) STEM dark field image and (d)–(g) elemental mapping of g-C3N4-Ag 1h catalyst. Scale bar: 300 nm. | ||
To test this hypothesis, we introduced Ag NP to the g-C3N4 as plasmonic source via photodeposition method,18 aiming to enhance the CO production rate. The photodeposition process was conducted for 10 min, 1 h, 3 h, and 5 h, respectively, and the material subsequently annealed for 2 hours. The four catalyst batches are labelled in terms of the photodeposition time: g-C3N4-Ag 10m, g-C3N4-Ag 1h, g-C3N4-Ag 3h, and g-C3N4-Ag 5h. The g-C3N4-Ag 10m showed an enhanced absorbance peak at ∼420 nm while the pristine g-C3N4 showed the corresponding peak at ∼400 nm. With the longer photodeposition time, the maximum absorbance peak of catalysts showed a bathochromic shift. In addition, a wider band absorbance appeared indicative of Ag NPs with a broad size distribution. The size distribution leads to a distribution in band gap and thus allows the harvesting of visible-to-near infrared (Vis-to-NIR) solar photons (Fig. S1 and Table S1, ESI†). XRD spectra (Fig. S2, ESI†) showed that the amount of Ag loaded in the catalyst increases with longer photodeposition time. Scanning electron microscopy (SEM) images support the XRD data, showing enhanced density of Ag NPs on the surface of g-C3N4 (Fig. S3, ESI†), and EDS mapping results allow the Ag loading amount to be estimated (Fig. S4 and Table S2, ESI†). Transmission electron microscopy (TEM, Fig. S5 and S6, ESI†) along with scanning transmission electron microscopy (STEM) and elemental mapping (Fig. 1c–g) provided more detailed information of morphologies and elemental distribution of g-C3N4-Ag based catalysts. In particular, it was seen that much larger Ag NPs were formed by the fusion of small Ag NPs upon longer photodeposition time, which explained the bathochromic shift seen in UV-vis spectra of the g-C3N4.19
The catalytic activity of the g-C3N4-Ag based catalysts was dependent on the photodeposition time. The g-C3N4-Ag 1h (Fig. 1a) catalyst showed the best performance. Since the catalytic sites and selectivity are provided by the g-C3N4 substrate, which can be confirmed by the catalytic activity of pure g-C3N4, the role of Ag NP is considered to be that of a plasmonic source. As the peak performance appeared at g-C3N4-Ag 1h rather than the samples with more Ag NPs loaded, we hypothesized that long photodeposition times lead to a decrease in active sites on g-C3N4 surface due to more Ag NPs coverage, thus cancelling out increasing electron injection. This however is not the case. Instead, additional defect sites were introduced via a different mechanism upon Ag loading with post annealing process.
The electron paramagnetic resonance (EPR) technique can be employed to estimate the number of defect sites in the series of g-C3N4-Ag composites. Defects appear as a derivative signal in CW EPR with the resonance field (crossing point) providing information of the nature of the defect. Fig. 2 (and Fig. S7, ESI†) shows the relative concentration of defects as a function of photodeposition time, and correlates with CO2 reduction rates. Importantly, these data clearly show that the number of defects significantly increases by up to an order of magnitude upon Ag photodeposition, and as such, the enhanced catalytic activity of the Ag loaded composition should be ascribed to these new defect sites.
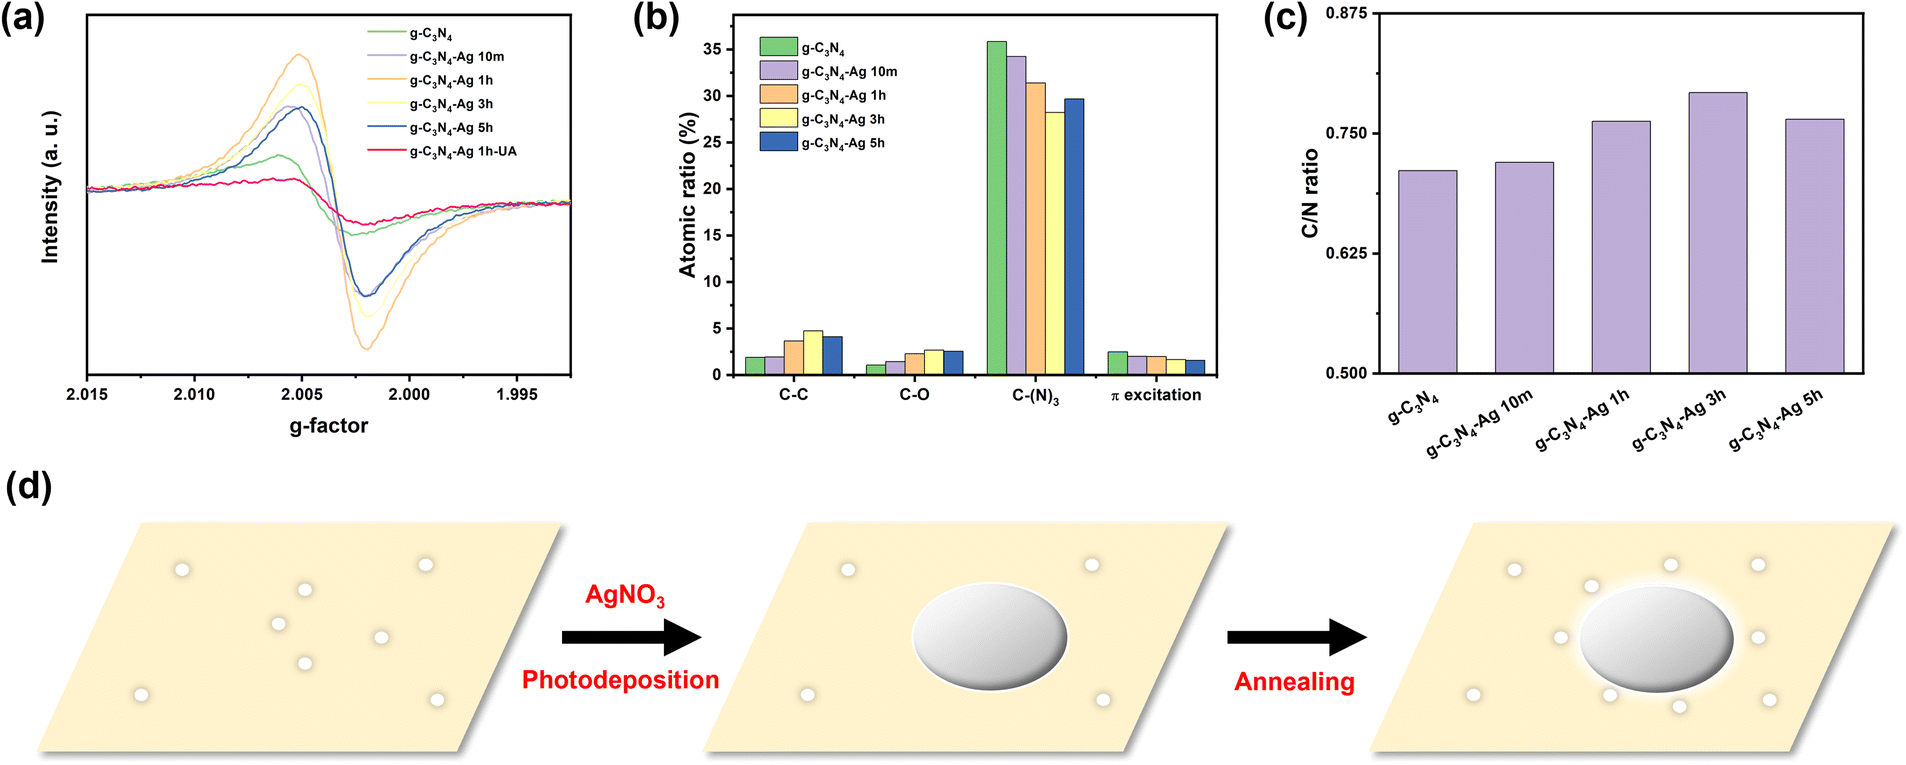 | ||
| Fig. 2 (a) EPR spectra of the set of g-C3N4-Ag composites monitored at 15 dB. All g-C3N4-Ag composites with post annealing process display a larger number of defects than pristine g-C3N4. The position of the EPR signal (g-factor) of new defects introduced by Ag photodeposition and annealing is also different from that of defects found in pristine g-C3N4 indicating these new defect sites are not formed within bulk g-C3N4 but instead coloacted with the introduced Ag NPs. (b) Atomic ratio of C1s and (c) C/N ratio of different catalysts yielded from XPS. (d) Proposed mechanism of defect reconstruction. | ||
It is also important to note that the crossing point of the EPR defect signal (g-factor) is different for these new defect sites. The g-factor of pristine g-C3N4 was 2.0044. In contrast, the g-factor of all g-C3N4 loaded with Ag NPs was systematically smaller (Fig. 2a and Fig. S7, Table S3, ESI†), closer to the free electron value. The change in g-factor likely signifies that these newly formed defects within the g-C3N4-Ag composite material are situated in close proximity to the incorporated Ag NPs.
Sample annealing is also critical to the formation of new defect sites. This is shown for the g-C3N4-Ag 1h composite, which had the largest number of defects (Fig. 2). In the absence of an annealing step, the number of defects is smaller than that of pristine g-C3N4, while the type of defect (as judged by its g-factor) is very similar to that of pristine g-C3N4. It is only following both photodeposition of Ag NPs and subsequent annealing that new defects are formed. It is this newly emerged population of defects that is correlated with the enhanced activity.
X-ray photoelectron spectroscopy (XPS) was then employed to confirm the elemental changes of materials. XPS can monitor the change of micro chemical environment of each element on the surface of the catalyst. These data showed no obvious shifts for each XPS peak indicating that the chemical environment of each atom type has not significantly changed (Fig. S8 and S9, ESI†). In addition to peak shift, the peak intensity can also estimate the amount of atoms corresponding to a particular chemical environment. According to the C1s spectra (Fig. 2b), the amount ratio of C–(N)3 and corresponding π excitation decreased with the increasing photodeposition time of Ag, and reached the minimum at g-C3N4-Ag 3h sample, while the amount ratio of C–C and C–O increased with the increasing photodeposition time of Ag,20 and reached the maximum at g-C3N4-Ag 3h sample.
This trend indicates the formation of more N-vacancy defects, and is probably best described in terms of the C/N ratio (Table S4, ESI†) of exposed surface. For ideal g-C3N4, the C/N ratio should be 0.75, whereas the C/N ratio of our synthesized g-C3N4 is only 0.723, which indicates the more N atoms than C atoms exposed on the surface of g-C3N4. The C/N ratio then increases for the g-C3N4-Ag 10m (0.736), C3N4-Ag 1h (0.769) and g-C3N4-Ag 3h (0.788) (Fig. 2c) demonstrating the decreased amount of N atoms on the surface of g-C3N4.21 The loss of N atoms at the surface indicates the formation of N-vacancy defects, leading to the formation of C–C and C–O bonds.
Based on the EPR and XPS results, a mechanism of defect engineering scenario can be proposed (Fig. 2d). As aforementioned, the Ag NPs were initially grown on the surface of g-C3N4via photodeposition method. Due to the electron-rich environment of the point defect on g-C3N4, the Ag+ ions tend to selectively grow on the defective positions of g-C3N4.18 After the annealing process, the strain force induced by the different thermal expansion rate between metal and polymer22 lead to new defects in the g-C3N4 substrate to form around the Ag NPs. This is supported by EPR data which shows that new defects in the g-C3N4-substrate are formed following Ag impregnation, which have a different g-factor as compared to pristine g-C3N4.
Once the basic structure of the g-C3N4-Ag material was resolved, we turned toward characterizing the properties of the Ag NPs, specifically their photon-to-charge (PTC) conversion. PTC conversion as a function of photodeposition time was determined by estimating the photo-current transfer efficiency, as shown in Fig. 3a. With the introduction of Ag NPs, PTC conversion under solar light is significantly enhanced, which is ascribed to the dramatic enhancement of the composite's UV-Vis absorbance, extending to the Vis-to-NIR range owing to the plasmonic properties of Ag NPs. The trend of PTC conversion ability of different samples under solar illumination is consistent with their catalytic activities, implying that the plasmonic hot electrons make the dominant contribution to the catalysis.
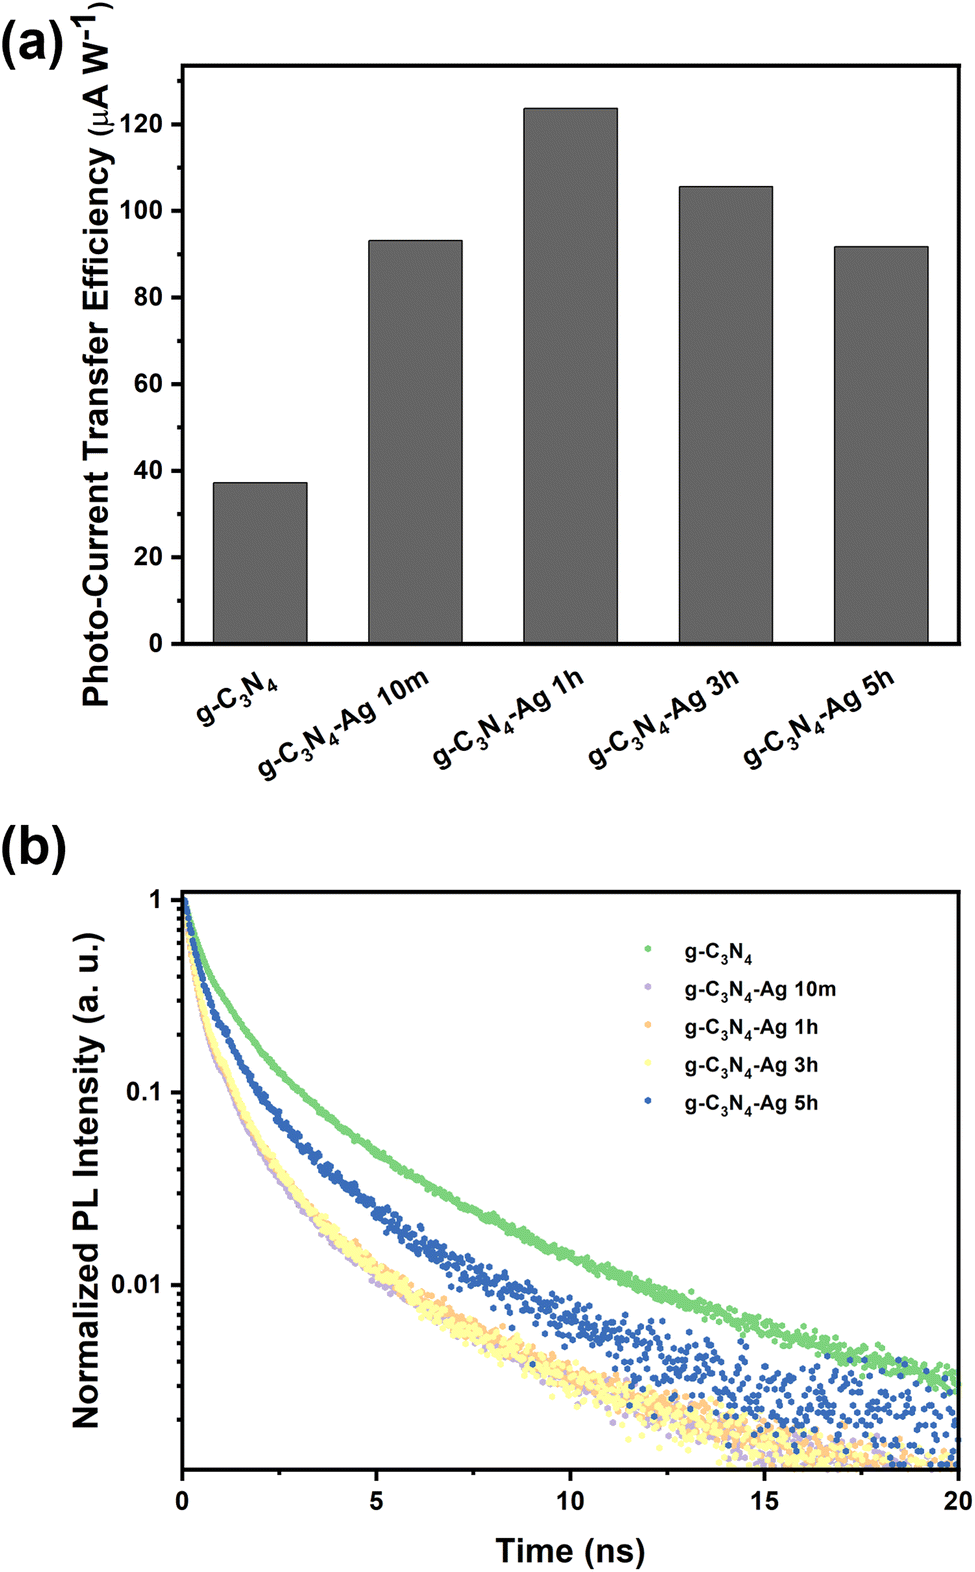 | ||
| Fig. 3 (a) Photo to current transfer efficiency and (b) TRPL spectra of various catalysts (excited at 375 nm and recorded at 420 nm). | ||
In addition to PTC conversion, charge separation lifetimes, which can be determined by time-resolved photoluminescence (TRPL), also plays a key role in the photocatalysis process. A bi-exponential function was used to fit the TRPL data (Fig. 3b and Fig. S10, ESI†), in which the short lifetime refers to the nonradiative transition rates while the long lifetime refers to radiative transition rates.23 Pristine g-C3N4 showed an average lifetime of 1.425 ns, which is significantly longer than the Ag modified g-C3N4 catalysts, indicating the poor charge separation before Ag loading (Table S5, ESI†); charge separation rates in all composites g-C3N4-Ag 10m, 1h, 3h and 5h samples to show shorter lifetimes.
Based on the combined TEM and XPS results, three catalyst models were constructed, pristine g-C3N4, g-C3N4 with N vacancies, and N vacancies g-C3N4 with additional surface O sites (Fig. 4a and b). The Gibbs free energy diagram for CO2 reduction to CO and ΔG values were calculated based on DFT calculations. Fig. 4a and b illustrate the optimized structures which allow *COOH and *CO adsorption at the C defect/N vacancy. The results show that the isolated C defect should be considered the active site of catalyst. The rate-limiting step of CO2 reduction has been reported to be the activation of CO2 molecules via a single-electron transfer pathway to form COOH* intermediate.24,25 We observe the same result for g-C3N4 and g-C3N4 with N vacancies in Fig. 4c. The ΔG value of the rate-limiting step for g-C3N4 with N vacancies (0.60 eV) is lower than that for g-C3N4 (1.54 eV), which indicates that the N vacancies contribute to enhancing the activity. For N vacancies g-C3N4 with addition surface O sites, the ΔG value to form *COOH is negative, indicating that O occupation of vacancies is thermodynamically favorable for forming *COOH intermediates. The reduction of COOH* intermediates to CO* species by reacting with protons and releasing H2O molecules is considered a rate-limiting step for O-enriched g-C3N4. The ΔG values of *COOH and *H to form *CO and H2O at the C defect active sites was 0.96 eV, which determined the reaction rate.
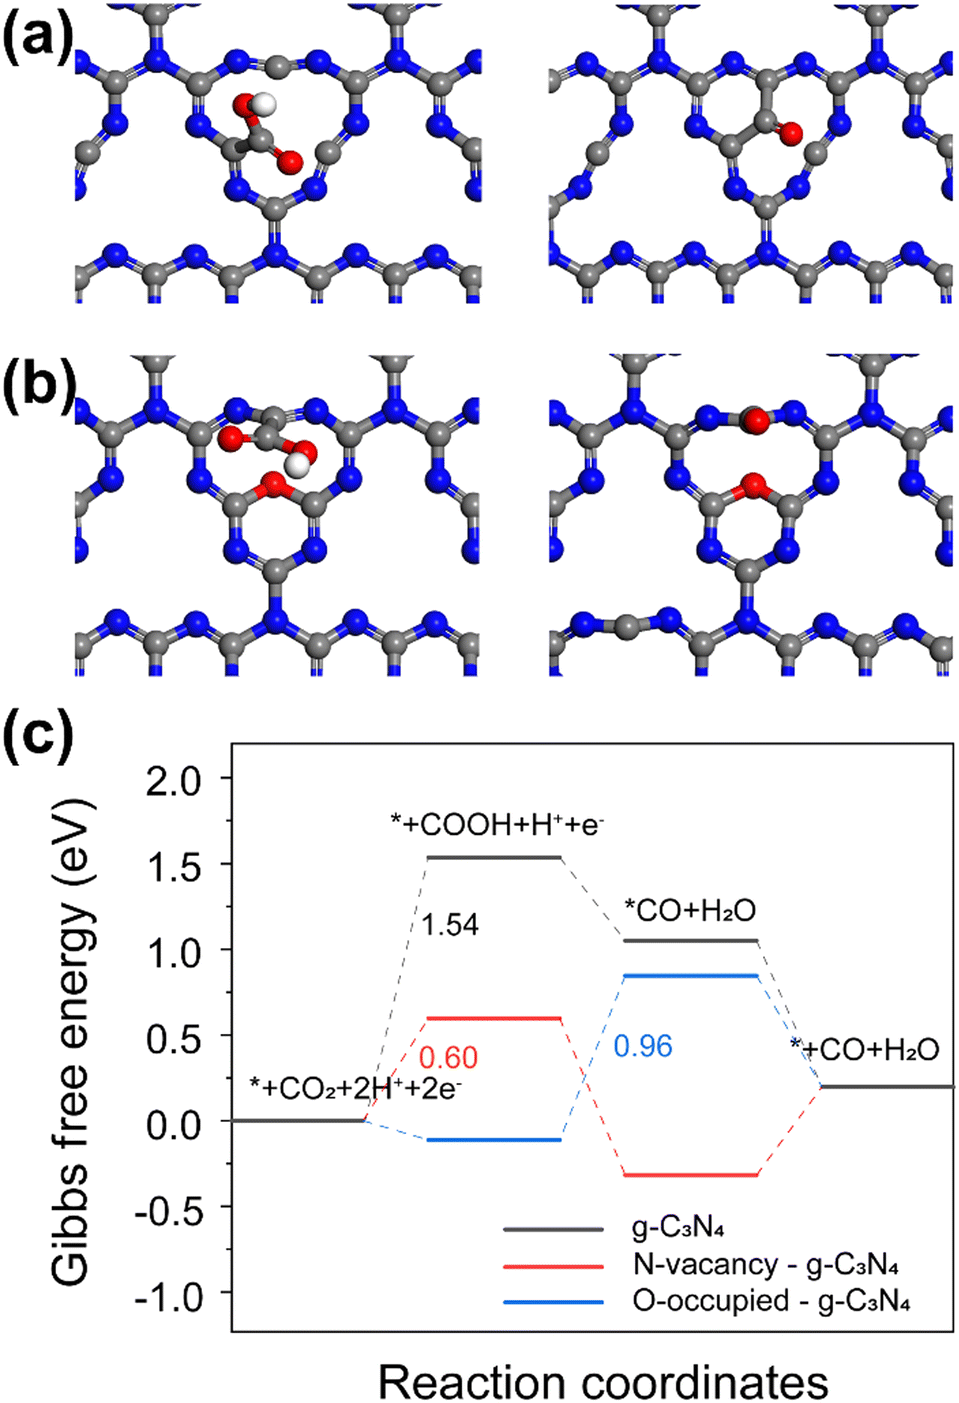 | ||
| Fig. 4 DFT calculation and reaction scheme. Optimized configurations of reaction intermediates *COOH and *CO on the C atom and N vacancy active sites of (a) g-C3N4 with N vacancy and (b) O-occupied g-C3N4. (Red: O; white: H; gray: C; blue: N.) (c) Gibbs free energy diagrams for photocatalytic CO2 reduction to CO on g-C3N4, g-C3N4 with N vacancy and O-occupied g-C3N4. | ||
The photo-induced electric field enhancement was simulated by FDTD for different sizes of Ag particles (Fig. S11–S13, ESI†). The maximum electric field was then introduced into our DFT calculations. This led to only small and negligible changes in ΔG (Fig. S14–S16 and Table S6, ESI†), indicating that the reaction energy barrier of such a system was not affected by the electric field. From this, we deduced that the main contribution from Ag plasmon is the hot electron injection to the active defects of g-C3N4 as discussed above. The current DFT calculations show that the defective g-C3N4 should display enhanced CO2 reduction to CO activity owing to the presence of C defect/N vacancy active sites.
Conclusions
In conclusion, we show that active defects can be integrated into polymeric g-C3N4 photocatalysts in close proximity to the plasmon centers of Ag nanoparticles. This strategic placement optimises the utilisation efficiency of plasmonic hot electrons, which in turn enhances CO2 photoreduction efficiency, without compromising product selectivity. The method potentially paves the way for a novel approach to catalyst modification, whereby employing a combination of facile defect engineering and plasmon manipulation leads to significant enhancements in photocatalytic performance.Author contributions
The manuscript was written through contributions of all authors.Conflicts of interest
There are no conflicts to declare.Acknowledgements
We gratefully acknowledge financial support from the Australian Research Council (DP190100295) and the ANU Futures Scheme (Q4601024). This research was also undertaken with the assistance of resources provided by the National Computational Infrastructure (NCI) facility at the Australian National University, allocated through the National Computational Merit Allocation Scheme supported by the Australian Government. The authors also thank the Joint Mass Spectroscopy Facilities (JMSF) at the Australian National University for providing access to the facilities. A. A. W. and H. T. N. acknowledge supports from the Australian Centre for Advanced Photovoltaics’ Infrastructure Fund. F. K. acknowledges the support from the Australian Microscopy and Microanalysis Research Facility at the Centre for Advanced Microscopy, the Australian National University. C. Z. and D. G. are grateful to the Australian Research Council (ARC) for a support in the frame of an ARC Laureate Project FL160100089.Notes and references
- L. Wang, W. Chen, D. Zhang, Y. Du, R. Amal, S. Qiao, J. Wu and Z. Yin, Chem. Soc. Rev., 2019, 48, 5310–5349 RSC.
- Y. Zhang, X. Zhi, J. R. Harmer, H. Xu, K. Davey, J. Ran and S.-Z. Qiao, Angew. Chem., Int. Ed., 2022, 61, e202212355 CrossRef CAS PubMed.
- Y. Zhang, B. Johannessen, P. Zhang, J. Gong, J. Ran and S.-Z. Qiao, Adv. Mater., 2023 DOI:10.1002/adma.202306923.
- J. L. White, M. F. Baruch, J. E. Pander, Y. Hu, I. C. Fortmeyer, J. E. Park, T. Zhang, K. Liao, J. Gu, Y. Yan, T. W. Shaw, E. Abelev and A. B. Bocarsly, Chem. Rev., 2015, 115, 12888–12935 CrossRef CAS PubMed.
- K. Takanabe, ACS Catal., 2017, 7, 8006–8022 CrossRef CAS.
- Y. Zhu, L. Peng, Z. Fang, C. Yan, X. Zhang and G. Yu, Adv. Mater., 2018, 30, 1706347 CrossRef PubMed.
- H. Yin, K. Xing, Y. Zhang, D. M. A. S. Dissanayake, Z. Lu, H. Zhao, Z. Zeng, J.-H. Yun, D.-C. Qi and Z. Yin, Chem. Soc. Rev., 2021, 50, 6423–6482 RSC.
- H. Lu, J. Tournet, K. Dastafkan, Y. Liu, Y. H. Ng, S. K. Karuturi, C. Zhao and Z. Yin, Chem. Rev., 2021, 121, 10271–10366 CrossRef CAS PubMed.
- C. Xie, D. Yan, H. Li, S. Du, W. Chen, Y. Wang, Y. Zou, R. Chen and S. Wang, ACS Catal., 2020, 10, 11082–11098 CrossRef CAS.
- J. Jia, C. Qian, Y. Dong, Y. F. Li, H. Wang, M. Ghoussoub, K. T. Butler, A. Walsh and G. A. Ozin, Chem. Soc. Rev., 2017, 46, 4631–4644 RSC.
- B. Liu, C. Li, G. Zhang, X. Yao, S. S. C. Chuang and Z. Li, ACS Catal., 2018, 8, 10446–10456 CrossRef CAS.
- X. Wang, Y. Zhang, H. Si, Q. Zhang, J. Wu, L. Gao, X. Wei, Y. Sun, Q. Liao, Z. Zhang, K. Ammarah, L. Gu, Z. Kang and Y. Zhang, J. Am. Chem. Soc., 2020, 142, 4298–4308 CrossRef CAS PubMed.
- D. Yang, C. A. Gaggioli, D. Ray, M. Babucci, L. Gagliardi and B. C. Gates, J. Am. Chem. Soc., 2020, 142, 8044–8056 CrossRef CAS PubMed.
- R. Shi, Y. Zhao, G. I. N. Waterhouse, S. Zhang and T. Zhang, ACS Catal., 2019, 9, 9739–9750 CrossRef CAS.
- X. Sun, X. Luo, X. Zhang, J. Xie, S. Jin, H. Wang, X. Zheng, X. Wu and Y. Xie, J. Am. Chem. Soc., 2019, 141, 3797–3801 CrossRef CAS PubMed.
- E. Cortés, R. Grzeschik, S. A. Maier and S. Schlücker, Nat. Rev. Chem., 2022, 6, 259–274 CrossRef PubMed.
- Y. Wang, X. Wang and M. Antonietti, Angew. Chem., Int. Ed., 2012, 51, 68–89 CrossRef CAS PubMed.
- K. Wenderich and G. Mul, Chem. Rev., 2016, 116, 14587–14619 CrossRef CAS PubMed.
- D. Paramelle, A. Sadovoy, S. Gorelik, P. Free, J. Hobley and D. G. Fernig, Analyst, 2014, 139, 4855–4861 RSC.
- D. J. Martin, K. Qiu, S. A. Shevlin, A. D. Handoko, X. Chen, Z. Guo and J. Tang, Angew. Chem., Int. Ed., 2014, 53, 9240–9245 CrossRef CAS PubMed.
- Q. Ruan, T. Miao, H. Wang and J. Tang, J. Am. Chem. Soc., 2020, 142, 2795–2802 CrossRef CAS PubMed.
- Y. Rao and T. N. Blanton, Macromolecules, 2008, 41, 935–941 CrossRef CAS.
- Z. Gan, Y. Shan, J. Chen, Q. Gui, Q. Zhang, S. Nie and X. Wu, Nano Res., 2016, 9, 1801–1812 CrossRef CAS.
- M. Karamad, H. A. Hansen, J. Rossmeisl and J. K. Nørskov, ACS Catal., 2015, 5, 4075–4081 CrossRef CAS.
- Y. Wang, Y. Tian, L. Yan and Z. Su, J. Phys. Chem. C, 2018, 122, 7712–7719 CrossRef CAS.
Footnotes |
| † Electronic supplementary information (ESI) available: Materials and methods, Fig. S1–S14 and Tables S1–S5. See DOI: https://doi.org/10.1039/d3nh00348e |
| ‡ These authors contributed equally. |
| This journal is © The Royal Society of Chemistry 2023 |