 Open Access Article
Two-gap topological superconductor LaB2 with high Tc = 30 K†
Chin-Hsuan
Chen‡
a,
Ye-Shun
Lan‡
a,
Angus
Huang
a and
Horng-Tay
Jeng
 *abc
*abc
aDepartment of Physics, National Tsing Hua University, Hsinchu 30013, Taiwan
bPhysics Division, National Center for Theoretical Sciences, Taipei 10617, Taiwan
cInstitute of Physics, Academia Sinica, Taipei 11529, Taiwan. E-mail: jeng@phys.nthu.edu.tw
First published on 8th November 2023
Abstract
Since two gap superconductivity was discovered in MgB2, research on multigap superconductors has attracted increasing attention because of its intriguing fundamental physics. In MgB2, the Mg atom donates two electrons to the borophene layer, resulting in a stronger gap from the σ band and a weaker gap from the π bond. First-principles calculations demonstrate that the two gap anisotropic superconductivity strongly enhances the transition temperature of MgB2 in comparison with that given by the isotropic model. In this work, we report a three-band (B-σ, B-π, and La-d) two-gap superconductor LaB2 with very high Tc = 30 K by solving the fully anisotropic Migdal–Eliashberg equation. Because of the σ and π–d hybridization on the Fermi surface, the electron–phonon coupling constant λ = 1.5 is significantly larger than the λ = 0.7 of MgB2. Our work paves a new route to enhance the electron–phonon coupling strength of multigap superconductors with d orbitals. On the other hand, our  analysis reveals that LaB2 belongs to the weak topological semimetal category, leading to a possible topological superconductor with the highest Tc to date. Moreover, upon applying pressure and/or doping, the topology is tunable between weak and strong with Tc varying from 15 to 30 K, opening up a flexible platform for manipulating topological superconductors.
New conceptsTo date, available topological superconductors such as PbTaSe2, PdBi, RhPb2, as well as WS2 and SnPbTe/Pb heterostructures all belong to S-wave single-gap BCS superconductors. In our work, we present a two-gap topological superconductor LaB2, which is a totally new concept to this field. Therefore, the impact to the topological superconductor, Majorana fermion, and quantum computing research fields will be strong. So far, available candidates such as PbTaSe2, PdBi, RhPb2, as well as WS2 and SnPbTe/Pb heterostructures published in high-impact journals in recent years all have Tc below 10 K. Such a low Tc causes tremendous difficulties for accurately measuring the possible Majorana fermions experimentally. Thus, it is of great importance to discover high-Tc topological superconductors. In this work, we report a record-breaking high Tc of 30 K in the topological superconductor LaB2, comparing highly favorably over all the available candidates. |
Introduction
Superconductivity is one of the most important and mysterious research fields not only because of the intriguing fundamental physics behind it but also because of its high potential for future industry. Yet the critical temperature Tc of superconductors is generally too low for practical applications. Thus enhancing the Tc of superconductors is an essential issue in condensed matter physics. One successful approach to raise Tc is by applying pressure. In recent years, nearly room temperature Tc have been found in hydrogen-rich hydrides under high pressure such as H3S,1 LaH10,2 and NaH6.3,4 The other approach to enhance the Tc of superconductors is through the anisotropic pairing or multigap mechanism such as in conventional superconductor magnesium diboride MgB2.5,6 In particular, the anisotropic pairing of unconventional superconductors, with the Cooper pairing different from the conventional s-wave pairing, has attracted extensive attention because of the many-body interactions among d-electrons in cuprate7–10 and iron-based superconductors.11,12 On the other hand, topological superconductors with p-wave pairing have also been predicted in Sr2RuO4.13MgB2, known as a classic example of an anisotropic pairing superconductor, has shown great promise for enhancing Tc through two-gap phonon-mediated superconductivity. The Fermi surfaces (FSs) of MgB2 comprise σ bonds (s + px,y orbitals of B atoms) and π bonds (pz orbitals of B atoms).5,14–19 The two separated FSs in reciprocal space lead to two superconducting (SC) gaps Δσ ≈ 7 meV and Δπ ≈ 2–3 meV at 0 K20–23 with the gaps closed at the transition temperature Tc = 39 K.20–23 Theoretical investigations demonstrate that the anisotropic effect increases the superconducting temperature of MgB2 from 19 K to 55 K in the harmonic approximation. Additionally, the anharmonicity increases the phonon energy of the E2g mode at the Gamma point from 62.7 meV to 75.9 meV and decreases the total EPC strength from λ = 0.73 to λ = 0.61. Consequently, Tc decreases from 55 K to 39 K,6 being in good consistence with the experimental Tc. The two-gap behavior exhibits exotic properties such as giant-paramagnetic response,24 skyrmionic states,25,26 hidden criticality,27,28 and time-reversal symmetry breaking.29,30
In addition to bulk MgB2, several systems have been proposed to exhibit multigap superconductivity. For example, two to three SC gaps with the transition-temperatures Tc = 20 K, 70 K, and 34.5 K were reported in monolayer of MgB2, CaB2, and ScB2.31,32 The trilayers of CaB4, GaB4, BeB4 and LiB4 films have multigaps with Tc of 64 K, 51 K, 39 K and 32 K, respectively.32,33 Four SC gaps with a Tc = 52 K were predicted in trilayer system MgB4 above bulk MgB2.33 Other than the magnesium boride family, multiband superconductivity has also been predicted in the hole doped LiBC with Tc = 100 K,34 bulk AlB2 with Tc = 9 K,16,35 and thin film AlB2 with Tc = 17–26.5 K.16,35 These predictions show that the honeycomb layer structure with sp2 hybridized orbitals is essential for finding multigap superconductivity. To date, bulk MgB2 has been confirmed as a two-gap superconductor,36 while the other predicted multigap phonon-mediated systems are yet to be confirmed in future experiments.
In this work, we investigate the superconductivity in the LaB2 compound in the same crystal structure as MgB2 through first-principles calculations. The superconducting critical temperature TMcMillanc = 22 K is obtained for LaB2via the Allen–Dynes modified McMillan formula, while two-gap superconductivity with a notably higher Tanisoc = 30 K is obtained through solving the fully anisotropic Migdal–Eliashberg equations. In addition, our  analysis reveals LaB2 to be a weak topological superconductor with the highest Tc in comparison with available candidates. The topology is tunable between weak and strong with superconducting Tc varying from 15 to 30 K upon applying pressure and/or doping, serving as a flexible candidate for topological superconductors.
Results and discussion
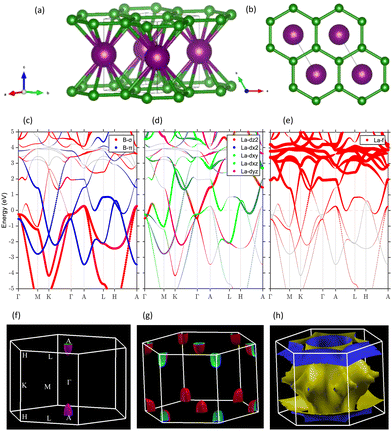
It is well known that magnesium diboride MgB2 exhibits two-gap superconductivity with the highest ambient-pressure Tc to date. By substituting the magnesium atom with transition-metal elements, we systematically investigated the superconductivity of the transition-metal diboride XB2. Among them, we found that LaB2 can be stabilized in the same crystal structure as MgB2 under ambient pressure, while it also shows two-gap superconductivity with a fairly high Tc of 30 K. LaB2 is composed of alternate honeycomb boron and metallic lanthanum layers. The crystal structure with space group P6/mmm is shown in Fig. 1(a) and (b). The optimized lattice parameters a = 3.32 Å and c/a = 1.30 are obtained from geometry relaxation calculations based on density functional theory (DFT).The atom-orbital-decomposed band structures depicted in Fig. 1(c)–(e) show the detailed characters of each electronic band. Near the Fermi level (EF), the doubly degenerate boron-σ bands cross EF from Γ to A, forming a small hole pocket around A (Fig. 1(c)). Similar to MgB2, this slowly rising flat B-σ (sp2) band along Γ–A reflects weak interlayer interactions in LaB2 with a slightly higher EF due to the relatively higher ionicity of La. One boron-π (pz) band also crosses EF and forms a hole pocket around H (Fig. 1(c)). On the other hand, the contributions of lanthanum (La) to the electronic bands plotted in Fig. 1(d and e) demonstrate that three La-d orbitals: dz2, dx2–y2, and dxy contribute notably to the bands near the Γ- and H-points, and along the H–A paths around EF. Particularly, the La dxy orbital takes part in the B-π hole pocket around H, while most of the La-f bands move from 2 to 5 eV above the Fermi level (Fig. 1(e)) with nontrivial hybridizations with the B-σ hole pocket around A near EF.
The above mentioned electronic bands form three Fermi surfaces as illustrated in Fig. 1(f)–(h). They are respectively the small hole pockets around A constructed mainly by the B-σ orbital with partially the La-f orbital, the paraboloid hole pockets around H mostly comprised by the B-π with some La dxy, and the star-shaped cylinder Fermi surface surrounding Γ composed of the La d orbitals. With the above band character analysis, we have adopted the sp2, pz orbital of B atoms and dz2, dx2–y2, dxy, f orbital of La atoms as the Wannier basis to build the tight-binding Hamiltonian and generate the Wannier band structure using Wannier90 code. This Wannier basis set can well reproduce the DFT band structures from −10 eV to 2 eV with high quality, and is used for the topological analysis as will be discussed later.
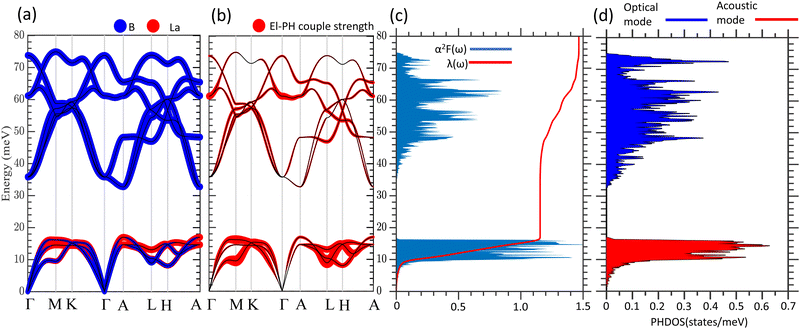
The superconductivity of LaB2 is explored through the phonon dispersion and electron–phonon coupling (EPC) calculations based on density function perturbation theory (DFPT). Fig. 2(a) shows the phonon band structures with the atomic contributions resolved. The acoustic phonon modes in the low frequency region less than 16 meV are mainly derived from the vibrations of heavy La atoms coupled with light B atoms, while the light B atoms oscillate quickly and dominate the high frequency region above 32 meV. In between, there is a notable phonon band gap, indicating a low scattering rate between acoustic and optical phonons. The phonon density of states (DOSs) depicted in Fig. 2(d) shows the overall narrow bandwidth with high intensity for acoustic phonon bands, and wide bandwidth with low intensity for optical phonon bands. Fig. 2(b) shows the phonon-dependent EPC strength λqν of LaB2. For the acoustic branches, there exist three Kohn anomalies around the M, L, and H points with the phonon energy significantly lowered to ∼10 meV. These three Kohn anomalies are associated with strong EPC strengths up to λM = 1.68, λL = 2.01, and λH = 0.6, respectively. For the optical branches, the phonon modes (point group E2g) with significant EPC locate at ∼60 meV from Γ- to A-point. The maximum EPC strength λq = 0.46 here is much smaller than that of the Kohn anomalies in the acoustic branches. The Eliashberg spectral function presented in Fig. 2(c) demonstrates a strong peak from 10 to 16 meV with the Kohn anomalies dominating the lower part and with the relatively flat phonon bands dominating the higher part of the acoustic phonon bands. This strong acoustic phonon Eliashberg spectral function is closely related to the heavy atom La as can be seen from the atom-resolved phonon band structure in Fig. 2(a). As for the optical phonon modes, the Eliashberg spectral function is generally smaller than the acoustic counterparts. The integrated Eliashberg function over the low-frequency acoustic modes λA(ω) = 1.15 (Fig. 2(c)) is relatively strong because the Eliashberg spectral function is divided by the phonon frequency in the integral of eqn (5). Owing to the same reason, the integrated Eliashberg function over the high-frequency optical modes λO(ω) = 0.32 is lower than the acoustic counterpart, despite the wider bandwidth. Furthermore, the total EPC strength λ = 1.47 is calculated by integrating the Eliashberg spectral function over all phonon modes, in which the acoustic phonons contribute nearly 80% of the total λ.
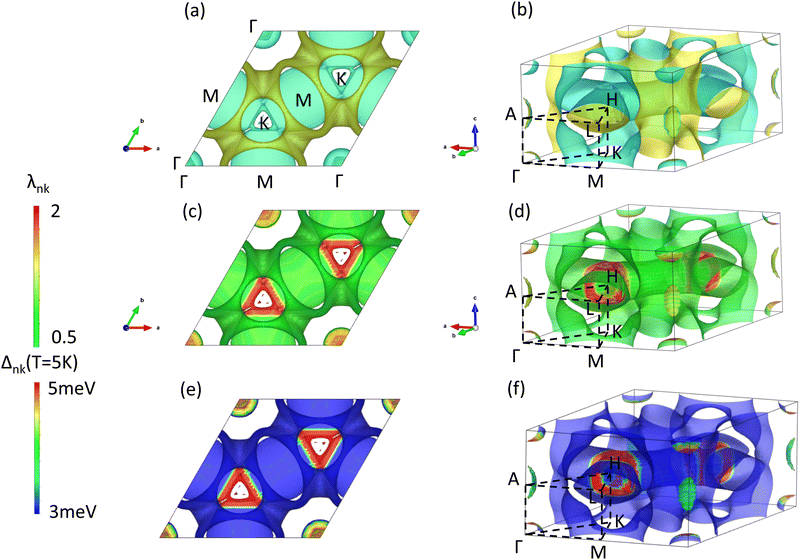
To explore possible anisotropy and multigap superconductivity in LaB2, we further solve the anisotropic Migdal–Eliashberg equations and analyze the contributions and anisotropic properties of EPC strength λnk for the electronic states forming the Fermi surfaces as depicted in Fig. 3. Because it has the same crystal structure as MgB2, the Fermi surface (FS) of LaB2 is similar to that of MgB2 as can be seen in Fig. 3(a and b). The pipe-like FS forms a honeycomb-shape 2-dimensional network over the kx–ky plane with small Fermi pockets located within the honeycomb holes. Fig. 3(c and d) show that the strongest EPC (red) is distributed around the hexagon corners of the honeycomb network at the H-point. While the second strongest EPC (yellow and orange) distributes over the small Fermi pockets around the Γ- and A-points. The other regions over FS (green) show weak EPC strength only. These EPC maps demonstrate two distinct EPC features: the strongest red and the 2nd strongest yellow/orange regions depending on the k-points and the comprised atomic orbitals, evidencing the multigap superconductivity in LaB2.
The corresponding EPC-induced superconducting gaps in the Fermi surfaces over the BZ are presented in Fig. 3(e and f). Good correspondence with the EPC maps in Fig. 3(c and d) can be clearly seen, showing that the electronic states on the Fermi surface with higher EPC contribute strongly to the superconducting gaps. Overall, one can see two main features in the superconducting gap distributions: (I) the large gap (Δnk ≃ 5 meV) regions around the zone center and H-point at kz ≃ 0.4 indicated by red color; (II) the middle gap (Δnk ≃ 4 meV) areas denoted by yellow and orange colors around Γ and A points. Combining these two main features in the superconducting-gap maps (Fig. 3(e and f)) with the strongest and second strongest EPC distributions (Fig. 3(c and d)), we demonstrate clearly the two-gap superconductivity in LaB2 similar to MgB2.
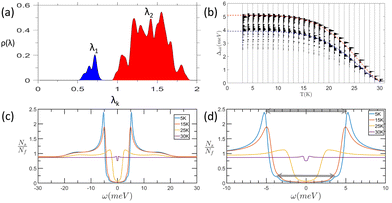
To quantify the EPC distribution over the BZ presented in Fig. 3(c and d), the EPC distribution ρnk as a function of the EPC strength λnk is integrated through
 | (1) |
Fig. 4(b) shows the calculated superconductivity gap energy distribution versus temperature from 3 to 30 K. Overall, the two-gap features can be clearly seen. Close to the zero temperature limit, the two gap values are ∼3.9 and ∼5.1 meV for Δ1 and Δ2, respectively. While above T = 20 K, both the gap values decrease to zero. By using the BCS-like gap equation non-linear fit for the calculated superconducting gap functions, we obtain two curves for Δ1 and Δ2 as functions of temperature. The two gap curves converge to 0 at T = 30 K. Fig. 4(c and d) shows the superconductivity density of states at T = 5, 15, 25, 30 K. At T = 5 K, one can clearly see the two peaks at ±3.9 meV and ±5.1 meV. At T = 30 K, both the high and low energy SC gaps are nearly vanishing owing to the approaching superconducting transition temperature. Based on our fitting gap functions in Fig. 4(b) and superconductivity DOS in Fig. 4(c) and (d), we conclude the two-gap superconducting Tc = 30 K.
Another important research area in borophene–metal systems is topological superconduction. The Dirac nodal line and topological surface state have been discovered in MgB2 owing to the spatial inversion symmetry and time-reversal symmetry (PT symmetry).37 MgB2 is topologically nontrivial not only electronically, but also phononically. The phononic Weyl nodal line and phononic surface arc states have been reported in MgB2.38 In addition, with Mg being replaced by other metal atoms, TiB2 and ZrB2 have also been theoretically reported to show PT symmetry protected electronic Dirac nodal lines.39 The topological surface state and Dirac nodal line in ZrB2 have further been detected by angle-resolved photoemission spectroscopy (ARPES).40 On the one hand, these interesting electronic topological results are cornerstones for hosting Majorana fermions. On the other hand, the phononic topological results can support phonon-related phenomena such as electrical resistance, heat conduction, and phonon waveguides.38
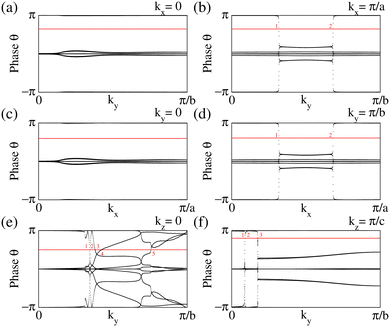
To explore the topological properties in LaB2, we performed topological calculations including the Wilson loop, topological index, inverted band structure, Greens function, and surface states. Here we demonstrate the main conclusion in the topological aspect given from the Wilson loop calculations for the topological index  . The other calculated results are presented in the ESI.† As can be seen in Fig. 5(a)–(d), the Berry phase of the Wannier center shows even winding numbers along kx and ky in BZ. On the contrary, the corresponding winding numbers are odd in both the kz = 0 and kz = 0.5 planes (see red lines and numbers in Fig. 5(e) and (f)). Consequently, LaB2 belongs to the weak topological insulator category41,42 with the
  index
index  . This
  index also implies that except for the (0001) surface, the topological surface states exist in the other surfaces of LaB2. Detailed topological surface states of LaB2 can be found in the ESI.† Moreover, this topological index could be tuned from a weak to strong topological insulator by applying strain or doping, as will be discussed later.
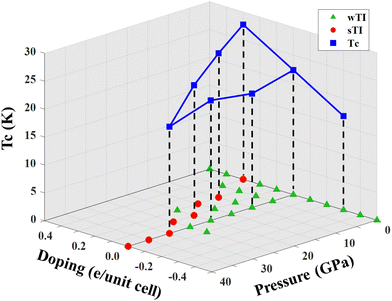
To date, the superconducting Tc of the available topological superconductors such as PbTaSe2,43,44 PdBi,45,46 RhPb2,47 and WS248 are all below 10 K. Such low superconducting temperatures cause tremendous difficulties for accurately measuring the possible Majorana fermions experimentally.43,49 Thus our predicted high-Tc of 30 K in topological superconductor LaB2 is of great importance. By applying external pressures and doping levels, we carry out the three-phase diagram calculations and present the results in Fig. 6. The superconducting temperature calculated using the Allen–Dynes modified McMillan formula varies from ∼15 K to ∼30 K, indicating Tc can be further enhanced under certain conditions. Besides, the topological behavior analyzed by the  topological numbers is also tunable from weak to strong topology. Both the tunable Tc and topology demonstrate that LaB2 is a rarely found convincing candidate in the topological superconductor research field.
Conclusion
In summary, we have shown that LaB2 is a three-band two-gap topological superconductor with Tanisoc = 30 K by using DFPT calculations and solving the fully anisotropic Migdal–Eliashberg equations. First-principles DFPT calculations show that LaB2 is dynamically stable with TMcMillanc = 22 K from the Allen–Dynes modified McMillan formula. By including the anisotropic effect in the Migdal–Eliashberg equations, the Tanisoc of LaB2 can be significantly raised up to 30 K. The calculated SC gap Δσ(T = 0 K) and Δπ(T = 0 K) are 5.1 meV and 3.9 meV, respectively. In comparison with MgB2, the enhanced λ in LaB2 is most likely due to the hybridization between the La-d orbitals and borophene π bonds. The topological index indicates that LaB2 belongs to the weak TI category. We suggest to adopt the d orbitals as an extra factor to enhance the electron–phonon coupling strength for multigap superconductors. Furthermore, we also show that under given pressure and doping conditions, the topology and Tc in LaB2 are both tunable from weak to strong and from ∼15 K to ∼30 K, respectively. Our work thus paves a new platform for manipulating topological superconductors.
Methods
Electronic property calculations are performed using the Vienna ab initio simulation package (VASP)50–53 adopting the projector-augmented plane wave (PAW)54,55 pseudopotential with the Perdew–Burke–Ernzerhof (PBE)64 functional based on density functional theory (DFT). A k-mesh of 18 × 18 × 18 and kinetic energy cutoff of 400 eV are adopted in the electronic calculations. Ab initio phonon calculations are preformed using the Quantum Espresso code56 based on density functional theory (DFT). Pseudopotentials with the Perdew–Burke–Ernzerhof (PBE) exchange–correlation functional are generated by the Optimized Norm-Conserving Vanderbilt Pseudopotential (ONCVPSP) code.57 The plane wave basis with the cutoff kinetic energy of 80 Ry are used. 24 × 24 × 24 k-mesh and 6 × 6 × 6 q-mesh with Methfessel–Paxton smearing of 0.04 Ry58 are adopted in the self-consistent electron and phonon calculations based on density function perturbation theory (DFPT). Superconducting critical temperatures Tc are calculated not only by using the Allen–Dynes modified McMillan formula59 in eqn (2)–(5) but also by solving the anisotropic Migdal–Eliashberg equations on the imaginary-axis20 in eqn (6) and (7). | (2) |
 | (3) |
 | (4) |
 | (5) |
 | (6) |
 | (7) |
 and convergence threshold less 10−4 eV are used in solving the Eliashberg equations. To study topological properties, iterative surface Green's function and Wilson loop simulations are carried out via the WannierTools package63 with the same tight-binding Wannier Hamiltonian.
Data availability
The data that support the findings of this study are available from the authors upon reasonable request.Author contributions
H. T. J. conceived the project. C. H. C. and Y. S. L. carried out the DFPT calculations and topological analysis, respectively. A. H. supervised the calculations. All authors contributed to discussions and the final manuscript.Conflicts of interest
The authors declare no competing financial or non-financial interests.Acknowledgements
This work was supported by the Ministry of Science and Technology, Taiwan. H.-T. J. also thanks support from NCHC, CINC-NTU, AS-iMATE-109-13, and CQT-NTHU-MOE, Taiwan.References
- A. P. Drozdov, M. I. Eremets, I. A. Troyan, V. Ksenofontov and S. I. Shylin, Nature, 2015, 525, 73 CrossRef CAS PubMed.
- A. P. Drozdov, P. P. Kong, V. S. Minkov, S. P. Besedin, M. A. Kuzovnikov, S. Mozaffari, L. Balicas, F. F. Balakirev, D. E. Graf and V. B. Prakapenka, et al. , Nature, 2019, 569, 528 CrossRef CAS PubMed.
- A. M. Shipley, M. J. Hutcheon, R. J. Needs and C. J. Pickard, Phys. Rev. B, 2021, 104, 054501, DOI:10.1103/PhysRevB.104.054501.
- C.-H. Chen, A. Huang, C. C. Tsuei and H.-T. Jeng, New J. Phys., 2021, 23, 093007 CrossRef CAS.
- J. Nagamatsu, N. Nakagawa, T. Muranaka, Y. Zenitani and J. Akimitsu, Nature, 2001, 410, 63 CrossRef CAS PubMed.
- H. J. Choi, D. Roundy, H. Sun, M. L. Cohen and S. G. Louie, Phys. Rev. B: Solid State, 2002, 66, 020513 CrossRef.
- K. Jin, N. P. Butch, K. Kirshenbaum, J. Paglione and R. L. Greene, Nature, 2011, 476, 73 CrossRef CAS PubMed.
- P. A. Lee, N. Nagaosa and X.-G. Wen, Rev. Mod. Phys., 2006, 78, 17, DOI:10.1103/RevModPhys.78.17.
- J. P. Carbotte, E. Schachinger and D. N. Basov, Nature, 1999, 401, 354 CrossRef CAS PubMed.
- T. Dahm, et al. , Nat. Phys., 2009, 5, 217 Search PubMed.
- D. H. Lu, M. Yi, S.-K. Mo, A. S. Erickson, J. Analytis, J.-H. Chu, D. J. Singh, Z. Hussain, T. H. Geballe and I. R. Fisher, et al. , Nature, 2008, 455, 81 CrossRef CAS PubMed.
- F. Wang and D.-H. Lee, Science, 2011, 332, 200 CrossRef CAS PubMed.
- C. Kallin, Rep. Prog. Phys., 2012, 75, 042501 CrossRef PubMed.
- J. M. An and W. E. Pickett, Phys. Rev. Lett., 2001, 86, 4366 CrossRef CAS PubMed.
- J. Kortus, I. I. Mazin, K. D. Belashchenko, V. P. Antropov and L. L. Boyer, Phys. Rev. Lett., 2001, 86, 4656 CrossRef CAS PubMed.
- K.-P. Bohnen, R. Heid and B. Renker, Phys. Rev. Lett., 2001, 86, 5771 CrossRef CAS PubMed.
- T. Yildirim, O. Gulseren, J. W. Lynn, C. M. Brown, T. J. Udovic, Q. Huang, N. Rogado, K. A. Regan, M. A. Hayward and J. S. Slusky, et al. , Phys. Rev. Lett., 2001, 87, 037001 CrossRef CAS PubMed.
- Y. Kong, O. V. Dolgov, O. Jepsen and O. K. Andersen, Phys. Rev. B: Condens. Matter Mater. Phys., 2001, 64, 020501 CrossRef.
- H. J. Choi, D. Roundy, H. Sun, M. L. Cohen and S. G. Louie, Nature, 2002, 418, 758 CrossRef CAS PubMed.
- E. R. Margine and F. Giustino, Phys. Rev. B: Condens. Matter Mater. Phys., 2013, 87, 024505 CrossRef.
- M. Iavarone, G. Karapetrov, A. E. Koshelev, W. K. Kwok, G. W. Crabtree, D. G. Hinks, W. N. Kang, E.-M. Choi, H. J. Kim and H.-J. Kim, et al. , Phys. Rev. Lett., 2002, 89, 187002 CrossRef CAS PubMed.
- P. Szabo, P. Samuely, J. Kacmarcik, T. Klein, J. Marcus, D. Fruchart, S. Miraglia, C. Marcenat and A. G. M. Jansen, Phys. Rev. Lett., 2001, 87, 137005 CrossRef CAS PubMed.
- R. S. Gonnelli, D. Daghero, G. A. Ummarino, V. A. Stepanov, J. Jun, S. M. Kazakov and J. Karpinski, Phys. Rev. Lett., 2002, 89, 247004 CrossRef CAS PubMed.
- R. M. da Silva, M. V. Miloševic, A. A. Shanenko, F. M. Peeters and J. A. Aguiar, Sci. Rep., 2015, 5, 1 Search PubMed.
- J. Garaud, J. Carlstrm and E. Babaev, Phys. Rev. Lett., 2011, 107, 197001 CrossRef PubMed.
- E. Babaev, Phys. Rev. Lett., 2002, 89, 067001 CrossRef PubMed.
- L. Komendov, Y. Chen, A. A. Shanenko, M. V. Miloševic and F. M. Peeters, Phys. Rev. Lett., 2012, 108, 207002 CrossRef PubMed.
- M. Silaev and E. Babaev, Phys. Rev. B: Condens. Matter Mater. Phys., 2012, 85, 134514 CrossRef.
- N. V. Orlova, A. A. Shanenko, M. V. Miloševic, F. M. Peeters, A. V. Vagov and V. M. Axt, Phys. Rev. B: Condens. Matter Mater. Phys., 2013, 87, 134510 CrossRef.
- V. Stanev and Z. Tešanović, Phys. Rev. B: Condens. Matter Mater. Phys., 2010, 81, 134522 CrossRef.
- J. Bekaert, A. Aperis, B. Partoens, P. M. Oppeneer and M. V. Miloševic, Phys. Rev. B, 2017, 96, 094510 CrossRef.
- C. Sevik, J. Bekaert, M. Petrov and M. V. Milošević, Phys. Rev. Mater., 2022, 6, 024803, DOI:10.1103/PhysRevMaterials.6.024803.
- Y. Zhao, C. Lian, S. Zeng, Z. Dai, S. Meng and J. Ni, Phys. Rev. B, 2020, 101, 104507 CrossRef CAS.
- H. Rosner, A. Kitaigorodsky and W. E. Pickett, Phys. Rev. Lett., 2002, 88, 127001 CrossRef CAS PubMed.
- Y. Zhao, C. Lian, S. Zeng, Z. Dai, S. Meng and J. Ni, Phys. Rev. B, 2019, 100, 094516 CrossRef CAS.
- S. Souma, Y. Machida, T. Sato, T. Takahashi, H. Matsui, S.-C. Wang, H. Ding, A. Kaminski, J. C. Campuzano and S. Sasaki, et al. , Nature, 2003, 423, 65 CrossRef CAS PubMed.
- K.-H. Jin, H. Huang, J.-W. Mei, Z. Liu, L.-K. Lim and F. Liu, npj Comput. Mater., 2019, 5, 1 CrossRef CAS.
- J. Li, Q. Xie, J. Liu, R. Li, M. Liu, L. Wang, D. Li, Y. Li and X.-Q. Chen, Phys. Rev. B, 2020, 101, 024301 CrossRef CAS.
- X. Feng, C. Yue, Z. Song, Q. Wu and B. Wen, Phys. Rev. Mater., 2018, 2, 014202 CrossRef CAS.
- R. Lou, P. Guo, M. Li, Q. Wang, Z. Liu, S. Sun, C. Li, X. Wu, Z. Wang and Z. Sun, et al. , npj Quantum Mater., 2018, 3, 1 CrossRef CAS.
- L. Fu, C. L. Kane and E. J. Mele, Phys. Rev. Lett., 2007, 98, 106803 CrossRef PubMed.
- R. Yu, X. L. Qi, A. Bernevig, Z. Fang and X. Dai, Phys. Rev. B: Condens. Matter Mater. Phys., 2011, 84, 075119 CrossRef.
- S.-Y. Guan, P.-J. Chen, M.-W. Chu, R. Sankar, F. Chou, H.-T. Jeng, C.-S. Chang and T.-M. Chuang, Sci. Adv., 2016, 2, e1600894 CrossRef PubMed.
- T.-R. Chang, P.-J. Chen, G. Bian, S.-M. Huang, H. Zheng, T. Neupert, R. Sankar, S.-Y. Xu, I. Belopolski and G. Chang, et al. , Phys. Rev. B, 2016, 93, 245130 CrossRef.
- P. K. Biswas, D. G. Mazzone, R. Sibille, E. Pomjakushina, K. Conder, H. Luetkens, C. Baines, J. L. Gavilano, M. Kenzelmann and A. Amato, et al. , Phys. Rev. B, 2016, 93, 220504 CrossRef.
- K. Dimitri, M. M. Hosen, G. Dhakal, H. Choi, F. Kabir, C. Sims, D. Kaczorowski, T. Durakiewicz, J.-X. Zhu and M. Neupane, Phys. Rev. B, 2018, 97, 144514 CrossRef CAS.
- J.-F. Zhang, P.-J. Guo, M. Gao, K. Liu and Z.-Y. Lu, Phys. Rev. B, 2019, 99, 045110 CrossRef.
- Y. Fang, J. Pan, D. Zhang, D. Wang, H. T. Hirose, T. Terashima, S. Uji, Y. Yuan, W. Li and Z. Tian, et al. , Adv. Mater., 2019, 31, 1901942 CrossRef PubMed.
- G. Bian, T.-R. Chang, R. Sankar, S.-Y. Xu, H. Zheng, T. Neupert, C.-K. Chiu, S.-M. Huang, G. Chang and I. Belopolski, et al. , Nat. Commun., 2016, 7, 1 Search PubMed.
- G. Kresse and J. Hafner, Phys. Rev. B: Condens. Matter Mater. Phys., 1993, 47, 558 CrossRef CAS PubMed.
- G. Kresse and J. Hafner, Phys. Rev. B: Condens. Matter Mater. Phys., 1994, 49, 14251 CrossRef CAS PubMed.
- G. Kresse and J. Furthmüller, Comput. Mater. Sci., 1996, 6, 15 CrossRef CAS.
- G. Kresse and J. Furthmüller, Phys. Rev. B: Condens. Matter Mater. Phys., 1996, 54, 11169 CrossRef CAS PubMed.
- P. E. Blöchl, Phys. Rev. B: Condens. Matter Mater. Phys., 1994, 50, 17953 CrossRef PubMed.
- G. Kresse and D. Joubert, Phys. Rev. B: Condens. Matter Mater. Phys., 1999, 59, 1758 CrossRef CAS.
- P. Giannozzi, S. Baroni, N. Bonini, M. Calandra, R. Car, C. Cavazzoni, D. Ceresoli, G. L. Chiarotti, M. Cococcioni and I. Dabo, et al. , J. Phys.: Condens. Matter, 2009, 21, 395502 CrossRef PubMed.
- D. R. Hamann, Phys. Rev. B: Condens. Matter Mater. Phys., 2013, 88, 085117 CrossRef.
- M. Methfessel and A. T. Paxton, Phys. Rev. B: Condens. Matter Mater. Phys., 1989, 40, 3616 CrossRef CAS PubMed.
- P. B. Allen and R. C. Dynes, Phys. Rev. B: Solid State, 1975, 12, 905 CrossRef CAS.
- S. Poncé, E. Margine, C. Verdi and F. Giustino, Comput. Phys. Commun., 2016, 209, 116 CrossRef.
- F. Giustino, M. L. Cohen and S. G. Louie, Phys. Rev. B: Condens. Matter Mater. Phys., 2007, 76, 165108 CrossRef.
- G. Pizzi, V. Vitale, R. Arita, S. Blügel, F. Freimuth, G. Géranton, M. Gibertini, D. Gresch, C. Johnson and T. Koretsune, et al. , J. Phys.: Condens. Matter, 2020, 32, 165902 CrossRef CAS PubMed.
- Q. Wu, S. Zhang, H.-F. Song, M. Troyer and A. A. Soluyanov, Comput. Phys. Commun., 2018, 224, 405 CrossRef CAS.
- J. P. Perdew, K. Burke and M. Ernzerhof, Phys. Rev. Lett., 1996, 77, 3865 CrossRef CAS PubMed.
Footnotes |
| † Electronic supplementary information (ESI) available. See DOI: https://doi.org/10.1039/d3nh00249g |
| ‡ These authors contributed equally to this work. |
| This journal is © The Royal Society of Chemistry 2024 |

