Understanding silicon monoxide gas evolution from mixed silicon and silica powders†
Kevin M.
O’Connor
 ,
Abbie
Rubletz
,
Jonathan
Trach
,
Cole
Butler
and
Jonathan G. C.
Veinot
,
Abbie
Rubletz
,
Jonathan
Trach
,
Cole
Butler
and
Jonathan G. C.
Veinot
 *
*
Department of Chemistry, University of Alberta, Chemistry, Edmonton, Canada. E-mail: jveinot@ualberta.ca
First published on 28th April 2023
Abstract
Silicon on silica materials are ubiquitous in 21st century technology. From nanoparticles to integrated circuits, these systems are integral for modern semiconductor fabrication. While the Si–SiO2 interface is often (incorrectly) presumed to be stable, the direct reduction of silica by silicon is possible at high temperatures, resulting in the evolution of silicon monoxide (SiO) gas. Under appropriate conditions, this somewhat unexpected reaction can complicate solid state nanomaterial syntheses by etching away the desired products. This report describes an investigation into the SiO evolution reaction by interrogation of powdered Si–SiO2 mixtures before and after thermal treatment. The impacts of processing temperature, time, and sample composition are examined and discussed. Of particular importance, this investigation reveals the underappreciated role of silica crystallinity (cristobalite) in this solid-state reaction under comparatively low temperature conditions (ca. 1200 °C). With an improved understanding of SiO evolution, we hope to inspire new creative pathways for Si–SiO2 interface manipulation.
New conceptsFor decades, researchers have prepared silicon nanoparticles by subjecting silicon-rich oxides to high temperatures. This thermal treatment encourages the nucleation, growth and/or annealing of crystalline Si nano-domains embedded within a matrix of SiO2. While it is often assumed that the resulting Si–SiO2 interface is unreactive, sufficiently high temperatures can promote the reduction of SiO2 by Si to produce SiO gas. SiO prepared in this way has been used as a precursor for silicon nanowires synthesis. Surprisingly, there is no systematic examination of the reaction parameters necessary to evolve SiO. Our report explores SiO evolution using predefined mixtures of elemental silicon and silica powders. We focus our study on the examination of the powdered mixtures before and after heating, while defining the reaction conditions necessary to effect detectable changes to the material arising from SiO(g) production. This contribution offers invaluable insights for researchers hoping to avoid high-temperature Si–SiO2 interface destruction, as well as those intending to produce silicon monoxide gas and silicon nanomaterials from it. |
Introduction
Silicon nanomaterials are routinely prepared via high temperature processing of Si and SiO2 mixtures obtained from sol–gel precursors (i.e., hydrogen silsesquioxane),1–4 commercial sources (i.e., “SiOx”),4–7 plasma-enhanced chemical vapor deposition,8–10 and ion implantation.11–13 Similar mixtures of Si and SiO2 can also provide silicon monoxide gas (SiO) which is a prominent molecular precursor for silicon and silica nanowire synthesis.14–17 As such, an understanding of the factors influencing the high temperature reaction between Si and SiO2 as well as the corresponding SiO evolution is essential to the advancement of these attractive metal-free nanomaterials.Early interest in SiO began with researchers pursuing an inorganic analogue of carbon monoxide. The direct reduction of SiO2 with Si was first attempted by Winkler in 1890, however it was not successfully demonstrated until 1907 by Potter with the advent of new furnace technologies.18–20 SiO gas is evolved in this way by heating mixtures of solid silicon and silica following reaction (1).
In his report, Potter describes SiO as an isolated solid. After subjecting silicon/silica mixtures to thermal treatment at ca. 1700 °C, the resulting SiO(g) was cooled and deposited along the furnace walls as a brown, voluminous powder.20 When heated, the powder appeared to fully disproportionate to yield Si and SiO2 (eqn (2)).
The exact chemical composition of solid “silicon monoxide” has since been a subject of academic disagreement. While some claim SiO(s) can exist as a unique material, others argue its disproportionation is unavoidable.23–27 Regardless, controlling the evolution of SiO(g)via reaction (1) has provided a reliable synthetic route to producing silicon nanowires.14–17 In a typical experiment, authors flow inert gas over heated silicon/silica mixtures, carrying the resulting SiO(g) to cooler regions where it deposits into nanowire structures. While many of these studies focus on nanowire doping or mechanisms of nucleation and growth, the reaction conditions used to promote SiO(g) evolution differ significantly between publications and are seldom discussed.14–17,28–32 These differences include precursor composition (e.g., Si–SiO2, SiC–SiO2, “SiO(s)/SiOx”), processing atmosphere (e.g., vacuum, reducing, inert), peak processing temperatures, and heating (i.e., dwell) times.
The Si–SiO2 system and the interaction between Si, SiO, SiOx and SiO2 during thermal treatment has been investigated computationally and experimentally.13,33–36 Heating silica on silicon films under vacuum is known to remove large sections of SiO2 from the Si surface. While the evolution of SiO(g) is ultimately responsible for this phenomenon, the role of oxygen vacancies and interstitials have been identified as mediators for SiO diffusion through the buried Si–SiO2 interface.13 Similarly, a SiO-mediated mechanism for Si atom transport during thermal disproportionation of SiOx has been proposed computationally.34 Interestingly, commercial solid “silicon monoxide” has seen use as a precursor material for SiO(g) evolution and silicon nanoparticle synthesis under comparable reaction conditions.4–7,15–17 It is difficult to reconcile the simultaneous growth of silicon nanodomains by “SiO(s)” disproportionation and the reaction of silicon domains with the surrounding silica matrix.
Herein, we present an insightful study of the conditions necessary to drive reaction (1) by characterizing silicon/silica mixtures before and after thermal treatment. The effects of temperature, dwell time, and sample composition are examined.
Results and discussion
Predefined mixtures of crystalline silicon and silica powder are loaded into a zirconia boat and subjected to thermal treatment in a standard tube furnace under flowing argon (Scheme 1).After thermal processing, samples are cooled to room temperature, removed from the reaction tube, weighed, and mechanically ground to a uniform powder with a mortar and pestle for analyses using powder X-ray diffraction (XRD), X-ray photoelectron spectroscopy (XPS) and electron microscopy. Qualitative inspection reveals that, prior to heating, all Si–SiO2 mixtures are free-flowing, uniform grey powders. Following thermal processing, the product powders vary from grey to white, depending upon the amount of elemental silicon remaining in the sample. As Si(0) is consumed, the high SiO2 bandgap dominates the sample colour, resulting in a white powder.
To gain more detailed insight into the nature of these powers, we employed powder X-ray diffraction (pXRD). It is a key analytical method for the present study because it provides a rapid and effective identification of the crystalline silica and silicon components. By comparing the intensity of cubic silicon reflections across diffraction patterns, it is possible to survey the loss of crystalline Si(s) under specific reaction conditions. These analyses are complemented by additional characterization techniques (vide supra) to circumvent the inherent limitations of pXRD when probing amorphous and non-crystalline materials. While these characterization techniques only provide indirect evidence for silicon monoxide evolution, the deposition of silicon nanowires (Fig. S1, ESI†) on the cooler regions of the alumina furnace tube provide support for its production. Additionally, the evolution of SiO(g) from mixtures of Si and SiO2 results in a decreased sample mass following thermal processing; in contrast, experiments in which Si(s) and SiO2(s) powders are heated independently yield no change in sample mass or crystallinity (Fig. S2, ESI†). Taken together, these results allow us to confidently assert that reaction (1) is responsible for loss of silicon from the reaction mixtures. The direct identification of SiO as the primary vaporizing species has also been previously achieved by heating similar Si–SiO2 mixtures in a Knudsen cell and mass spectrometer assembly.37
Our investigation begins with identifying the thermal energy required to initiate this reaction. Unfortunately, the intense reflection at 28.5° is shared by silicon and crystalline silicon dioxide (cristobalite), making the peaks difficult to resolve and rendering it less diagnostic of reaction progress. Hence, we have chosen to compare the diffraction patterns of the Si–SiO2 mixture before and after thermal treatment by focusing on the silicon 220 and 311 reflections at 47.3° and 56.2°, respectively (Fig. 2). Heating at 1100 °C produces no obvious change in the pXRD pattern, however, increasing the processing temperature to 1200 °C effects a significant decline in the intensity in all three silicon reflections. An additional increase in processing temperature to 1300 °C sees the complete disappearance of all characteristic silicon reflections from the pattern, suggesting reaction (1) has reached completion. The loss of silicon peaks is consistent with the noted decline in sample mass after thermal processing as well as in energy dispersive X-ray analysis and X-ray photoelectron spectroscopy (vide infra). At a SiO2 to Si mass ratio of 20![[thin space (1/6-em)]](https://www.rsc.org/images/entities/char_2009.gif) :
:![[thin space (1/6-em)]](https://www.rsc.org/images/entities/char_2009.gif) 1, the theoretical mass conversion/loss to SiO(g) is 15%. The 11% mass loss noted at 1300 °C falls short of this mark and is reasonably attributed to some SiO(g) depositing onto the sample and sample boat as amorphous SiO2/Si and Si nanowires (Fig. S3, ESI†), rather than being carried away by the flowing argon.
1, the theoretical mass conversion/loss to SiO(g) is 15%. The 11% mass loss noted at 1300 °C falls short of this mark and is reasonably attributed to some SiO(g) depositing onto the sample and sample boat as amorphous SiO2/Si and Si nanowires (Fig. S3, ESI†), rather than being carried away by the flowing argon.
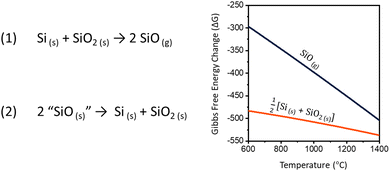 | ||
| Fig. 1 Reaction equations for the (1) production and (2) decomposition of silicon monoxide. Graph of the high-temperature Gibbs free energy change for reactions (1) and (2).21,22 | ||
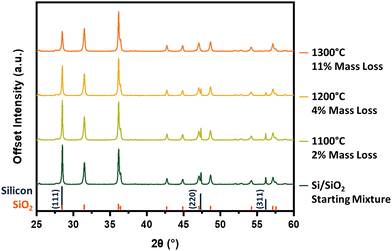 | ||
| Fig. 2 Powder X-ray diffraction of silica/silicon mixture before and after thermal treatment for 5 h under flowing argon. Literature reference peaks are given below the patterns for silicon38 and cristobalite.39 | ||
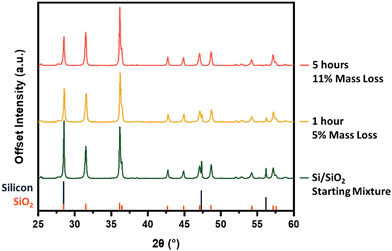
We now turn our attention to the influence of furnace dwell time (reaction time). Fixing the peak processing temperature at 1300 °C, the products obtained from dwell times of 1 and 5 h were compared (Fig. 3). Tracking the intensity of the silicon reflections, particularly those at 47.3° and 56.2°, demonstrates that prolonged exposure to appropriately high temperatures pushes the SiO-producing reaction toward completion. Again, the trend in sample mass loss aligns with additional SiO(g) leaving the sample boat during the longer dwell time.
To compliment pXRD we employed electron microscopy to visualize the loss of silicon. Fig. 4 shows scanning electron microscope (SEM) secondary electron (SE) images overlaid with energy dispersive X-ray spectroscopy (EDX) colour mapping of silicon, oxygen, and carbon. Before heating we observe an abundance of silicon-rich regions (red) with dimensions of approximately 1–5 μm that we attribute to elemental silicon domains. These Si domains are dispersed throughout larger oxygen rich fragments that we attribute to SiO2 (Fig. 4a). After heating at 1300 °C in an inert argon atmosphere for 5 h there is no evidence of the silicon-rich domains (Fig. 4b). The absence of Si particles after thermal treatment agrees with our observation that peaks associated with crystalline silicon are absent from the pXRD (Fig. 1). Additional characterization of the oxidation states of silicon in the samples was performed with X-ray photoelectron spectroscopy (XPS). Again, the elemental silicon present in the sample before thermal treatment is absent afterwards (Fig. S5, ESI†).
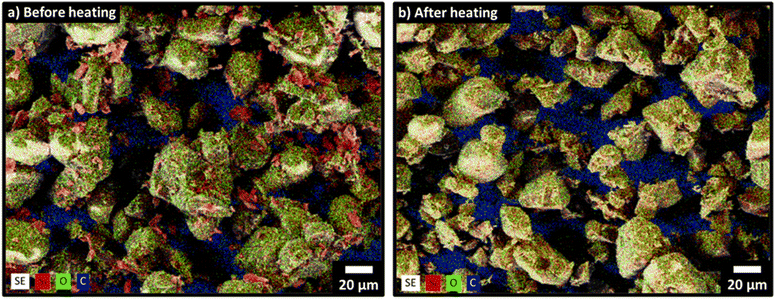 | ||
| Fig. 4 Secondary electron SEM images overlaid with EDX mapping of silicon (red), oxygen (green), and carbon (blue). (a) Silicon + silica mixtures before thermal treatment; (b) after thermal treatment at 1300 °C for 5 h. For higher-resolution SE images without elemental mapping, see Fig. S4 (ESI†). | ||
The trend toward completion of reaction (1) with higher temperatures and longer reaction times is expected. While the formation of SiO(g) is entropically favorable (211.58 J·mol−1·K−1),40 the strong Si–O bonds necessitate high reaction temperatures. Put simply, the greater number of Si–O bonds present in SiO2 compared to SiO makes silicon monoxide evolution enthalpically unfavorable. In our study, evidence for Si transport by SiO(g) begins at 1200 °C, and providing additional energy furthers SiO production by breaking more Si–O bonds. A more thorough discussion of the thermodynamics and partial pressure of SiO(g), including temperatures below 1200 °C, are found in ref. 21, 22 and41–44.
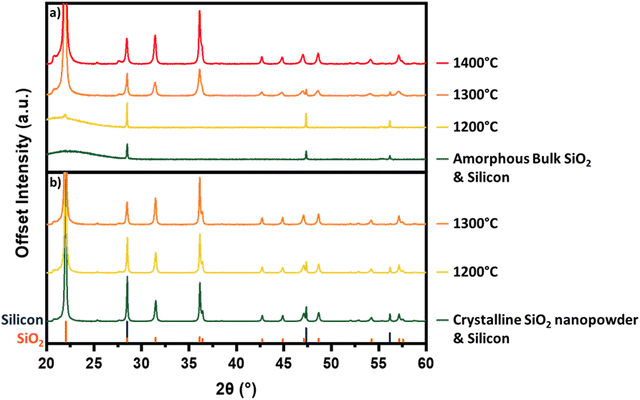
To allow straightforward comparisons of pXRD patterns, reaction mixtures in Fig. 1 and 2 comprise crystalline SiO2 and Si. Initial experiments using amorphous silica showed the emergence of overlapping peaks from crystalline SiO2 at temperatures coinciding with the decrease in intensity of Si related features. This overlap made correlation of changes in the pXRD pattern with reaction (1) progress challenging. To circumvent this interference, we chose to crystallize the SiO2 before mixing with Si as this minimized any temperature-induced change in SiO2 peak intensity and allows for a more direct analysis of the silicon 111, 220, and 311 reflections. We wondered then if the use of crystalline SiO2 in our reaction mixtures influenced Si–SiO2 reactivity. To investigate the role of crystallinity we compared the reactivities of amorphous and crystalline SiO2. Fig. 5a shows that heating amorphous SiO2 to 1200 °C sees the appearance of a small peak corresponding to the crystalline SiO2 at 28.5°. Heating to 1300 °C results in the appearance and increased intensity of peaks characteristic of crystalline SiO2. Interestingly, it is only after the formation of crystalline SiO2 that the intensity of the silicon reflections begin to decrease. We also note that the elimination of the silicon peaks requires temperatures 100 °C higher than for corresponding samples prepared using crystalline SiO2 (Fig. 1). The crystalline and amorphous SiO2 sources were imaged using SEM and no significant morphological differences are apparent (Fig. 6c and d).
 | ||
| Fig. 6 SEM images of various silica source material. (a) amorphous silica nanopowder; (b) silica nanopowder after crystallization; (c) amorphous bulk silica; (d) bulk silica after crystallization. | ||
Additionally, we hypothesized that increasing the SiO2 surface area available for reaction would promote SiO(g) evolution. To test this, we used a SiO2 nanopowder (d∼5–10 nm) in the starting mixture. When amorphous nanopowder is used, no detectable reduction in the crystalline Si domains is observed until 1400 °C (Fig. S6, ESI†). This result is notable given the higher reactivity associated with powder edge sites and provides further support for the importance of crystalline SiO2 domains to reaction (1). Crystallization of the nanopowder before introducing it to the reaction mixture resulted in reaction (1) proceeding (e.g., weight loss, evolution of pXRD). This is demonstrated in Fig. 5b which shows a complete elimination of silicon related peaks upon heating to 1300 °C for reaction mixtures containing crystalline silica nanopowder. To our surprise, these results are nearly identical to the behavior of reaction mixtures containing bulk crystalline SiO2 particles (Fig. 1). One possible explanation for this similarity in reactivity is found in the electron microscopy and pXRD of the crystalized nanopowder. When the voluminous, amorphous SiO2 nanopowder is crystallized, its particle size increases dramatically to ∼20 μm and the material becomes morphologically similar to bulk crystalline SiO2 (Fig. 6). This particle growth is also reflected in the pXRD analysis that shows narrow reflections indicative of bulk crystalline material. The repeated observation of disappearing Si reflections coinciding with the rise in SiO2 reflections suggests that the presence of crystalline SiO2 plays a critical role in reaction (1).
The reactants’ surface area was also adjusted using Si–SiO2 mixtures with relatively smaller silicon particles (<100 nm). In this experiment, silicon nanoparticles were mixed with crystalline silica and subject to 1300 °C for 1 h (Fig. S8, ESI†). Unlike the relatively larger Si powder, which only partially converted into SiO(g) (Fig. 1), these conditions fully consumed the silicon nanoparticles.
Defining the relative amounts of silicon and silica in the reaction mixture also impacts the nature of the resulting material obtained from thermal treatment. SiO2 plays a unique role; it acts as both a reagent and diluent. At lower SiO2:Si ratios, the temperatures required to promote reaction (1) induce sintering of the Si particles. This decreases the surface area and forms large silicon domains. The growing intensity of the silicon pXRD peaks at temperatures below 1300 °C suggests sintering is occurring for a SiO2:Si mass ratio of 8![[thin space (1/6-em)]](https://www.rsc.org/images/entities/char_2009.gif) :
:![[thin space (1/6-em)]](https://www.rsc.org/images/entities/char_2009.gif) 1 (Fig. 7). Evidence for sintering is also observed in optical microscopy images where heating a SiO2
1 (Fig. 7). Evidence for sintering is also observed in optical microscopy images where heating a SiO2![[thin space (1/6-em)]](https://www.rsc.org/images/entities/char_2009.gif) :
:![[thin space (1/6-em)]](https://www.rsc.org/images/entities/char_2009.gif) Si mixture (mass ratio 4
Si mixture (mass ratio 4![[thin space (1/6-em)]](https://www.rsc.org/images/entities/char_2009.gif) :
:![[thin space (1/6-em)]](https://www.rsc.org/images/entities/char_2009.gif) 1) to 1400 °C produces necked bulbus particles of silicon metal (Fig. S7, ESI†). Increasing the temperature or extending dwell times causes reaction (1) to proceed producing SiO while overwhelming the influences of silicon particle sintering and eliminating the crystalline Si peaks in the pXRD (Fig. 7 orange and red traces).
1) to 1400 °C produces necked bulbus particles of silicon metal (Fig. S7, ESI†). Increasing the temperature or extending dwell times causes reaction (1) to proceed producing SiO while overwhelming the influences of silicon particle sintering and eliminating the crystalline Si peaks in the pXRD (Fig. 7 orange and red traces).
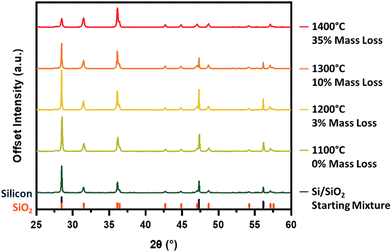 | ||
Fig. 7 Powder X-ray diffraction patterns of a Si–SiO2 mixture with a SiO2![[thin space (1/6-em)]](https://www.rsc.org/images/entities/char_2009.gif) : :![[thin space (1/6-em)]](https://www.rsc.org/images/entities/char_2009.gif) Si mass ratio 8 Si mass ratio 8![[thin space (1/6-em)]](https://www.rsc.org/images/entities/char_2009.gif) : :![[thin space (1/6-em)]](https://www.rsc.org/images/entities/char_2009.gif) 1 suggest sintering of silicon particles after 5 h of thermal treatment. 1 suggest sintering of silicon particles after 5 h of thermal treatment. | ||
It should be noted that much of the present discussion aims to identify the reaction conditions necessary to noticeably affect silicon domains in the powdered reaction mixtures while preventing Si particle sintering. This prerequisite required reaction mixtures containing excess SiO2. If, however, maximizing silicon monoxide evolution is the desired outcome, the SiO2:Si mass ratio should approach stoichiometric amounts (i.e., ca. 2![[thin space (1/6-em)]](https://www.rsc.org/images/entities/char_2009.gif) :
:![[thin space (1/6-em)]](https://www.rsc.org/images/entities/char_2009.gif) 1 by mass).
1 by mass).
Conclusions
By characterizing mixtures of silicon and silica powders after thermal treatment, we outline the reaction parameters necessary for the evolution of silicon monoxide via the direct reduction of silica by silicon. The loss of silicon domains was observable at 1200 °C, but this result was highly contingent on the composition of the samples. Specifically, the crystallinity of the silica plays a dominant role in promoting sample reactivity. The use of silica as both a reagent and diluent also exposes the possibility of Si particle sintering in the reaction mixtures. Efforts to increase surface area of the silica to better interactions with silicon domains were met with mixed results as amorphous nanopowdered silica formed larger micro-sized particles upon crystallization.Materials and methods
Silicon powder (325 mesh, 99% trace metals basis), silicon nanopowder (<100 nm, trace metals basis), silicon dioxide (high-purity SiO2 gel, 200–425 mesh size), and SiO2 nanopowder (10–20 nm particle size, 99.5% trace metals basis) were purchased from Sigma Aldrich and used as received. The SiO2 gel is denoted as “bulk” silica to differentiate it from the silica nanopowder. The Si nanopowder is referred to as “silicon nanoparticles” in the discussion.Preparation of crystalline SiO2
While some experiments used amorphous silica in the mixed powder starting material, others used crystalline silica. The preparation of crystalline silicon dioxide (cristobalite) starting materials required a thermal treatment prior to mixing with the silicon precursor. For these experiments, high-purity amorphous SiO2 gel (“bulk silica”, 6.0 g) was placed in a ZrO2 boat and transferred to a SentroTech Corporation STT-1700-2-12 high-temperature tube furnace equipped with a 2.5′′ diameter Al2O3 tube. The tube was heated in air to a peak temperature of 1500 °C at 5 °C min−1 where it remained for 5 h. The tube furnace was allowed to cool naturally to room temperature. If the amorphous SiO2 nanopowder was used in place of the high-purity SiO2 gel, 1.0 g of nanopowder was crystallized at 1400 °C at a heating rate of 5 °C min−1 for 5 before cooling naturally to room temperature. Heating of SiO2, irrespective of the precursor, provided a white, chalky solid that was subsequently ground in an agate mortar and pestle to yield a uniform white powder. The crystallinity of the product was evaluated using powder X-ray diffraction. All manipulations of the SiO2 precursors and the products obtained from thermal processing were performed in a fumehood. In addition to standard laboratory personal protective equipment personnel also wore N95 masks to minimize inhalation risks.Preparation of silica/silicon powder mixtures
Four different silica materials were used to prepare the silica–silicon mixtures: amorphous bulk silica, crystalline bulk silica, amorphous nanopowder silica and crystalline nanopowder silica. In all cases, 4 g of the selected silica source and 0.2 g of 325 mesh silicon powders were dispensed in a 20![[thin space (1/6-em)]](https://www.rsc.org/images/entities/char_2009.gif) :
:![[thin space (1/6-em)]](https://www.rsc.org/images/entities/char_2009.gif) 1 mass ratio into a round bottom flask equipped with a stir bar. Absolute ethanol (10 mL) was then added, the flask stoppered, and the mixture was stirred rapidly with a Teflon stir bar to disperse the powders. After approximately 5 minutes an additional 40 mL of ethanol was added to produce a viscous suspension that was stirred for an additional 1 h. Following removal of the ethanol using a rotary evaporator, the resulting Si–SiO2 mixture was recovered as a homogenously mixed free-flowing grey powder. Further drying was achieved via submersion in an oil bath set to 100 °C for 1 h under flowing nitrogen gas.
1 mass ratio into a round bottom flask equipped with a stir bar. Absolute ethanol (10 mL) was then added, the flask stoppered, and the mixture was stirred rapidly with a Teflon stir bar to disperse the powders. After approximately 5 minutes an additional 40 mL of ethanol was added to produce a viscous suspension that was stirred for an additional 1 h. Following removal of the ethanol using a rotary evaporator, the resulting Si–SiO2 mixture was recovered as a homogenously mixed free-flowing grey powder. Further drying was achieved via submersion in an oil bath set to 100 °C for 1 h under flowing nitrogen gas.
Thermal processing of silica/silicon mixed powders
In a typical experiment, Si–SiO2 powder mixtures (ca. 0.25 g) were weighed and loaded into a ZrO2 boat and transferred to the SentroTech Corporation STT-1700-2-12 high-temperature tube furnace equipped with a 2.5′′ diameter Al2O3 tube. The tube is charged with flowing argon gas (10 cm3 s−1) and the furnace ramped to the predefined processing temperature (i.e., 1100–1400 °C) at a rate of 5 °C min−1. After holding at the peak temperature for the predefined dwell time (i.e, 1–5 h), the furnace cooled naturally to room temperature (ca. 16 h) before the samples were collected, weighed, and transferred to vials for storage.Powder X-ray diffraction
Powder X-ray diffraction was performed using a Bruker D8 Advance powder diffractometer. The instrument is equipped with a SSD160 detector and a Cu radiation source (Kα1 = 1.54056 Å) operating at 40 kV and 40 mA. All samples were finely ground using a mortar and pestle before analysis on a zero-background silicon substrate. The amount of powder loaded onto the diffraction plate was consistent between samples and the resulting diffraction patterns were not normalized.Scanning electron microscopy and energy dispersive X-ray spectroscopy
Scanning electron microscopy was performed on a Zeiss Sigma 300 VP-FESEM. The instrument is equipped with a Bruker energy dispersive X-ray spectroscopy system with dual silicon drift detectors each with an area of 60 mm2 and a resolution of 123 eV. Imaging was collected using a secondary electron detector at accelerating voltages varying between 5 and 15 kV. Samples are prepared by adhering powder to an aluminum stub using double sided carbon tape.Optical microscopy
Optical images are taken using a Leica MZ9.5 stereo microscope equipped with a 48 MP camera (LG LM-G900UM) mounted using a Celestron NexYZ 3-Axis Universal Smartphone Adapter. Powdered samples were pressed between two glass slides to achieve a flat surface. The top slide was removed before imaging.X-ray photoelectron spectroscopy
X-ray photoelectron spectra were collected using a Kratos Axis 165 Ultra X-ray Photoelectron Spectrometer equipped with a monochromatic Al Kα radiation source (1486.6 eV) operating at 210 W. High-resolution spectra were measured using an analyzer pass energy of 20 eV and a step of 0.1 eV. For survey spectra, a pass energy of 160 eV and a step of 0.5 eV were used. Spectra were calibrated to C 1s 284.8 eV using adventitious carbon. Powdered samples adhere to double sided scotch tape on a metal loading bar.Conflicts of interest
There are no conflicts to declare.Acknowledgements
The authors recognize the continued generous funding from the Natural Science and Engineering Research Council (NSERC Discovery Grant program; RGPIN-2020-04045), Alberta Innovates, the ATUMS training program supported by NSERC CREATE (CREATE-463990-2015) as well as the University of Alberta Faculties of Science and Graduate Studies.References
- J. Zhou, J. Huang, H. Chen, A. Samanta, J. Linnros, Z. Yang and I. Sychugov, Low-Cost Synthesis of Silicon Quantum Dots with Near-Unity Internal Quantum Efficiency, J. Phys. Chem. Lett., 2021, 12, 8909–8916 CrossRef CAS PubMed
.
- S. Terada, Y. Xin and K. I. Saitow, Cost-Effective Synthesis of Silicon Quantum Dots, Chem. Mater., 2020, 32, 8382–8392 CrossRef CAS
.
- A. N. Thiessen, L. Zhang, A. O. Oliynyk, H. Yu, K. M. O’Connor, A. Meldrum and J. G. C. Veinot, A tale of seemingly “Identical” silicon quantum dot families: structural insight into silicon quantum dot photoluminescence, Chem. Mater., 2020, 32, 6838–6846 CrossRef CAS
.
- S. Milliken, A. N. Thiessen, I. T. Cheong, K. M. O'Connor, Z. Li, R. W. Hooper, C. J. T. Robidillo and J. G. C. Veinot, “Turning the dials”: controlling synthesis, structure, composition, and surface chemistry to tailor silicon nanoparticle properties, Nanoscale, 2021, 13, 16365–16820 RSC
.
- H. Sugimoto, T. Okazaki and M. Fujii, Mie Resonator Color Inks of Monodispersed and Perfectly Spherical Crystalline Silicon Nanoparticles, Adv. Opt. Mater., 2020, 8, 2000033 CrossRef CAS
.
- M. Mamiyaa, H. Takeia, M. Kikuchib and C. Uyedaa, Preparation of fine silicon particles from amorphous silicon monoxide by the disproportionation reaction, J. Cryst. Growth, 2001, 229, 457–461 CrossRef
.
- W. Sun, C. Qian, X. S. Cui, L. Wang, M. Wei, G. Casillas, A. S. Helmyb and G. A. Ozin, Silicon monoxide – a convenient precursor for large scale synthesis of near infrared emitting monodisperse silicon nanocrystals, Nanoscale, 2016, 8, 3678–3684 RSC
.
- J. Valenta, M. Greben, S. A. Dyakov, N. A. Gippius, D. Hiller, S. Gutsch and M. Zacharias, Nearly perfect near-infrared luminescence efficiency of Si nanocrystals: A comprehensive quantum yield study employing the Purcell effect, Sci. Rep., 2019, 9, 11214 CrossRef CAS PubMed
.
- T. Chlouba, F. Trojánek, V. Kopecký Jr., J. López-Vidrier, S. Hernandéz, D. Hiller, S. Gutsch, M. Zacharias and P. Malý, Pathways of carrier recombination in Si/SiO2 nanocrystal superlattices, J. Appl. Phys., 2019, 126, 163101 CrossRef
.
- D. Hiller, D. König, P. Nagel, M. Merz, S. Schuppler and S. C. Smith, On the Location of Boron in SiO2-Embedded Si Nanocrystals—An X-ray Absorption Spectroscopy and Density Functional Theory Study, Phys. Status Solidi B, 2021, 258, 2000623 CrossRef CAS
.
- S. Guha, M. D. Pace, D. N. Dunn and I. L. Singer, Visible light emission from Si nanocrystals grown by ion implantation and subsequent annealing, Appl. Phys. Lett., 1997, 70, 1207–1209 CrossRef
.
- R. Zhang, Y. Yuan, J. Zhang, W. Zuo, Y. Zhou, X. Gao, W. Wang, Z. Qin, Q. Zhang, F. Chen, Z. Du and J. Li, A light-influenced memristor based on Si nanocrystals by ion implantation technique, J. Mater. Sci., 2021, 56, 2323–2331 CrossRef CAS
.
- V. Beyer, J. von Borany and K. H. Heinig, Dissociation of Si+ ion implanted and as-grown thin SiO2 layers during annealing in ultra-pure neutral ambient by emanation of SiO, J. Appl. Phys., 2007, 101, 053516 CrossRef
.
- N. Wang, Y. H. Tang, Y. F. Zhang, C. S. Lee, I. Bello and S. T. Lee, Si Nanowires grown from silicon oxide, Chem. Phys. Lett., 1999, 299, 237–242 CrossRef CAS
.
- W. S. Shi, H. Y. Peng, Y. F. Zheng, N. Wang, N. G. Shang, Z. W. Pan, C. S. Lee and S. T. Lee, Synthesis of large areas of highly oriented, very long silicon nanowires, Adv. Mater., 2000, 12, 1343–1345 CrossRef CAS
.
- B. C. Zhang, H. Wang, L. He, C. J. Zheng, J. S. Jie, Y. Lifshitz, S. T. Lee and X. H. Zhang, Centimeter-Long Single-Crystalline Si Nanowires, Nano Lett., 2017, 17, 7323 CrossRef CAS PubMed
.
- S. K. Srivastava, P. K. Singh, V. N. Singh, K. N. Sood, D. Haranath and V. Kumar, Large-scale synthesis, characterization and photoluminescence properties of amorphous silica nanowires by thermal evaporation of silicon monoxide, Phys. E, 2009, 41, 1545–1549 CrossRef CAS
.
- C. Winkler, Ueber die Reduction von Sauerstoffverbindungen durch Magnesium, Ber., 1890, 23, 2642–2668 CrossRef
.
- H. N. Potter, Silicon monoxide, Trans. Am. Electrochem. Soc., 1908, 12, 191–214 CAS
.
-
E. F. Roeber and H. C. Parmelee, Electrochemical and Metallurgical Industry, Electrochemical Publishing Company, London, 1907 Search PubMed
.
- O. Kubascheeski and T. G. Chart, Silicon monoxide pressures due to the reaction between solid silicon and silica, J. Chem. Thermodyn., 1974, 6, 467 CrossRef
.
- S. M. Schnurre, J. Grobner and R. Schmid-Fetzer, Thermodynamics and phase stability in the Si–O system, J. Non-Cryst. Solids, 2004, 336, 1 CrossRef CAS
.
- J. Benyon, Silicon Monoxide: Fact or Fiction, Vacuum, 1970, 20, 293–294 CrossRef CAS
.
- J. A. Yasaitis and R. Kaplow, Structure of amorphous silicon monoxide, J. Appl. Phys., 1972, 43, 995–1000 CrossRef CAS
.
- A. Hohl, T. Wieder, P. A. van Aken, T. E. Weirich, G. Denninger, M. Vidal, S. Ostwald, C. Deneke, J. Mayer and H. Fuess, An interface clusters mixture model for the structure of amorphous silicon monoxide (SiO), J. Non-Cryst. Solids, 2003, 320, 255–280 CrossRef CAS
.
- K. Schulmeister and W. Mader, TEM investigation on the structure of amorphous silicon monoxide, J. Non-Cryst. Solids, 2003, 320, 143–150 CrossRef CAS
.
- A. Hirata, S. Kohara, T. Asada, M. Arao, C. Yogi, H. Imai, Y. Tan, T. Fujita and M. Chen, Atomic-scale disproportionation in amorphous silicon monoxide, Nat. Commun., 2016, 7, 11591 CrossRef CAS PubMed
.
- F. Li, Y. Huang, S. Wang and S. Zhang, Critical review: Growth mechanisms of the self-assembling of silicon wires, J. Vac. Sci. Technol., A, 2020, 38, 010802 CrossRef CAS
.
- F. J. Li, S. Zhang and J. W. Lee, Rethinking on the silicon nanowire growth mechanism during thermal evaporation of Si-containing powders, Thin Solid Films, 2014, 558, 75–85 CrossRef CAS
.
- E. Vogli, J. Mukerji, C. Hoffman, R. Kladny, H. Sieber and P. Greil, Conversion of oak to cellular silicon carbide ceramic by gas-phase reaction with silicon monoxide, J. Am. Ceram. Soc., 2001, 84, 1236–1240 CrossRef CAS
.
- T. S. Aarnæs, E. Ringdalen and M. Tangstad, Silicon carbide formation from methane and silicon monoxide, Sci. Rep., 2020, 10, 21831 CrossRef PubMed
.
- X. Chen, D. Zhang, X. Zhang, Y. Liu, X. Li and G. Xiang, Synthesis and growth mechanism of Mn-doped nanodot embedded silica nanowires, Physica B, 2019, 571, 10–17 CrossRef CAS
.
- K. AlKaabi, D. L. V. K. Prasad, P. Kroll, N. W. Ashcroft and R. Hoffmann, Silicon Monoxide at 1 atm and Elevated Pressures: Crystalline or Amorphous?, J. Am. Chem. Soc., 2014, 136, 3410 CrossRef CAS PubMed
.
-
I. G. Neizvestny and N. L. Shwartz, in Advances in Semiconductor Nanostructures, Monte Carlo Simulation of Semiconductor Nanostructure Growth, ed. A. V. Latyshev, A.
V. Dvurechenskii, and A. L. Aseev, Elsevier, 2017, ch. 14, pp. 345–364 Search PubMed
.
- F. T. Ferguson and J. A. Nuth, III, Vapor Pressure and Evaporation Coefficient of Silicon Monoxide over a Mixture of Silicon and Silica, J. Chem. Eng. Data, 2012, 57, 721 CrossRef CAS
.
- A. Broggi, M. Tangstad and E. Ringdalen, Characterization of a Si-SiO2 Mixture Generated from SiO(g) and CO(g), Metall. Mater. Trans. B, 2019, 50, 2667 CrossRef CAS
.
- R. F. Porter, W. A. Chupka and M. G. Ingiiram, Mass Spectrometric Study of Gaseous Species in the Si-SiO2 System, J. Chem. Phys., 1995, 23, 216 CrossRef
.
- T. Hom, W. Kiszenick and B. Post, Accurate lattice constants from multiple reflection mesurements II. Lattice constants of germanium, silicon and diamond, J. Appl. Crystallogr., 1975, 8, 457–458 CrossRef
.
- R. T. Downs and D. C. Palmer, The pressure behavior of alpha cristobalite, Am. Mineral., 1994, 79, 9–14 CAS
.
-
M. W. Chase, NIST-JANAF Themochemical Tables, Journal of physical and chemical reference data, Monograph 9, 4th edn, 1998, pp. 1–1951 Search PubMed
.
- M. Nagamori, J. A. Boivin and A. Claveau, Gibbs free energies of formation of amorphous Si2O3, SiO and Si2O, J. Non-Cryst. Solids, 1995, 189, 270 CrossRef CAS
.
- A. Sarikov and M. Zacharias, Gibbs free energy and equilibrium states in the Si/Si oxide systems, J. Phys.: Condens. Matter, 2012, 24, 385403 CrossRef PubMed
.
- A. Sarikova and D. Zhigunov, Thermodynamic mechanism of the intermixing of multilayered structures in the SiOx/SiO2 superlattices with nanometer thick layers, Mater. Today Commun., 2017, 13, 163 CrossRef
.
-
S. Pizzini, Physical Chemistry of Semiconductor Materials and Processes, Wiley, United Kingdom, 2015 Search PubMed
.
Footnote |
| † Electronic supplementary information (ESI) available. See DOI: https://doi.org/10.1039/d3nh00076a |
| This journal is © The Royal Society of Chemistry 2023 |


