DOI:
10.1039/D3NA00597F
(Paper)
Nanoscale Adv., 2023,
5, 5907-5922
Impact of nitrogen doping on triazole-based graphitic carbon Nitride-TiO2 (P25) S-scheme heterojunction for improved photocatalytic hydrogen production†
Received
4th August 2023
, Accepted 22nd September 2023
First published on 22nd September 2023
Abstract
Establishing an S-scheme heterojunction is a promising method for increasing the photocatalytic activity of synthetic materials. In this study, nitrogen-doped g-C3N5/TiO2 S-scheme photocatalysts have been synthesized and examined for photocatalytic hydrogen production using thermal decomposition methods. Nitrogen-doped g-C3N5/TiO2 composites performed better than pure nitrogen-doped g-C3N5 and TiO2 alone. Using experiments and density functional theory (DFT) calculations, nitrogen (N) doping was identified as being introduced by replacing the carbon (C) atoms in the matrix of g-C3N5. In addition to its narrow band gap, N-doped g-C3N5 showed efficient carrier separation and charge transfer, resulting in the enhanced absorption of visible light and photocatalytic activity. DFT, XPS, optical property characteristics, and PL spectra confirmed these findings, which were attributed to the successful nitrogen doping, and the composite was proven to be a potential candidate for photocatalytic hydrogen generation under light irradiation. The quantity of H2 produced from the nitrogen-doped g-C3N5/TiO2 composite for 3 hours (3515.1 μmol g−1) was about three times that of N-doped g-C3N5. The H2 production percentage of the nitrogen-doped g-C3N5/TiO2 catalyst with Pt as the cocatalyst was improved by nearly ten times as compared to N-doped g-C3N5/TiO2 without a cocatalyst. Herein, we report the successful preparation of the N-doped g-C3N5/TiO2 S-scheme heterojunction and highlight a simple and efficient catalyst for energy storage requirements and environmental monitoring.
1. Introduction
Researchers are interested in graphitic carbon nitride (CN) due to its exclusive properties, such as its non-metallic nature, thermal stability, chemical stability, governable semiconducting properties with the band gap energy of approximately 2.72 eV, small charge, ease of research, and eco-friendliness.1,2 CN materials with C/N ratios ranging from 0.4 to 3 have been designated as C3N7, C3N6, C3N5, C3N4, C3N3, C3N2, C3N, and so on. C3Nx (x = 1–7) materials with various C/N ratios have been reported, with g-C3N4 being the most researched form of CN and receiving much attention over the past 20 years.3,4 As a lone pair electron donor, N can enhance charge transfer and thus activate the photocatalytic performance; the sp2-hybridized C and N for the triazine rings of g-C3N4 and the production of its C/N ratio play a vital role in the photocatalytic activity.5 To the best of our knowledge, adding nitrogen to the carbon matrix of CNs results in a narrow band gap. It improves the field emission, photocatalysis, fundamental catalysis, carbon capture, electrical characteristics, and hydrogen production.6,7 The primary focus of current research on CNs is the synthesis and description of their polymorphs. Unfortunately, these shapeless CN materials have limited long-term applications despite their exceptional nonporousness and small surface area.8 In general, the H2 generation rate during photocatalysis is insufficient for the light absorption capacity and poor quantum efficiency imposed by the charge carrier lifetime and low surface area.9,10 As a result, enormous efforts were made to develop more reasonable model schemes suitable for visible-light photocatalysis.11 Recently, several photocatalysts with various shapes and structures have been considered and synthesized. Due to its appropriate band size, physicochemical consistency, and other properties, the metal oxide semiconductor has attracted significant attention for photocatalytic hydrogen production.12 Recently, alternate N-rich precursors, such as melamine, thiourea and urea have been used to expand the photocatalytic performance of CN materials. It is, therefore, critical to investigate N-rich CN materials with a unique low band gap and structure to improve photocatalytic performance. Varied forbidden gap energies and rapid recombination ratios of visible-light photo-induced (e−/h+) during photoexcitation have limited the photoactivity of generally considered photocatalyst materials such as SnO2, WO3, ZnO, and TiO2.13,14
Recently, a high (N ratio) polymer CN material of C3N5 was reported for its excellent photocatalytic H2 and organic pollutant degradation with a shorter band gap (2.20 eV) and larger conductive band CB potential (1.47 V) than the popular g-C3N4. However, as with other semiconductors, the consumption of photo-generated carriers by internal recombination limits its applications. Intriguingly, the band gap of g-C3N5 can be tuned between 1.7 and 2.0 eV to increase the visible-light reactive photocatalytic energies, which are smaller than that of g-C3N4 (2.7 eV).15–17 Regarding structural engineering, many studies have found that g-C3N4 and g-C3N5, mesoporous construction, rod, and nanosheet-like formations have photocatalytic potential. The new material with a high N content has an extensive band gap range.18 Though the prepared g-C3N5 outperforms some previously reported g-C3N4, the heavy templating process for preparing g-C3N5 is expensive and time-consuming. CeTi2O6,19 a titanate photocatalyst material with a short band gap value of 2.73 eV, has been demonstrated to be advantageous in aggressive ionic conductors and semiconductor photocatalysts.20,21 TiO2 is the most commonly used photocatalyst in photocatalytic processes, and the application study shows its efficacy in photocatalytic hydrogen production. Essential aspects of this phenomenon include its low activity and broad band gap (3.24 eV) and its recyclability under light due to the high probability of photo-induced (e−/h+) recombination.
To prepare N-doped g-C3N5/TiO2 S-scheme heterojunction catalysts, we used a one-step polymerization route with citric acid, 3-amino-1,2,4-triazole (3-AT), and TiO2 (P25) as initial products this work.22,23 Compared to g-C3N5 and TiO2 (P25), a photocatalyst with a direct S-scheme heterojunction and an improved structure in N-doped g-C3N5/TiO2, they exhibited increased interaction and toughness in visible light photocatalytic hydrogen production. Through three carboxyl groups, citric acid, a weak organic acid, remains among the most used predecessors in dehydration and carbonization reactions.24,25 Because of its excellent properties and significant assets,26 nitrogen N doping has attracted increasing interest. Advantages of N-doping include: (1) g-C3N5 electronic band structure regulation, (2) avoiding the drawbacks of foreign atom introduction, (3) g-C3N5 aromatic pi-conjugated system extended and delocalized,27,28 (4) causing bordering carbon atoms to act equally as electron acceptors and electron donors. Nevertheless, N-doping of C3N5 is rarely used in photocatalytic hydrogen production applications.29–31 This paper investigates the photocatalytic activity of N-doped g-C3N5/TiO2 for hydrogen production. The chemical structure, optical absorption, shape, doping structure, and charge division have all been thoroughly investigated.32 Because of the introduction of the N element, N-doped g-C3N5 has a slight band gap and efficient charge separation.33 Under visible light, the obtained composites demonstrated significantly improved photocatalytic efficiency for hydrogen evolution by H2O splitting.34,35
To the best of our knowledge, no extensive study has been directed toward preparing N-doped g-C3N5/TiO2 S-scheme heterojunction composites and their application in photocatalytic hydrogen production. The photocatalytic appearances of the NCN/TiO2 obtained were significantly improved. This study's N-doped triazole-based g-C3N5 opens the door to the growth of a novel CN-based material for photocatalytic hydrogen production with a wide range of applications. In this study, N-doped g-C3N5 (NCN) with nitrogen doping demonstrated significantly higher photocatalytic activity than new g-C3N5. When elemental nitrogen was added to g-C3N5, its increasing light absorption capacity resulted in many more photosensitive charge carriers. Additionally, surface impurities aided in the separation of (e−/h+) pairs. Exciting new materials could be achieved with n-doping and S-scheme heterojunctions to produce NCN/TiO2 photocatalysts. As a result, developing an N-doped g-C3N5 sheet structure using a single-pot method was significant. We hope that the novel class of N-doped g-C3N5/TiO2 composite nanomaterials are among the best candidates in hydrogen production applications.
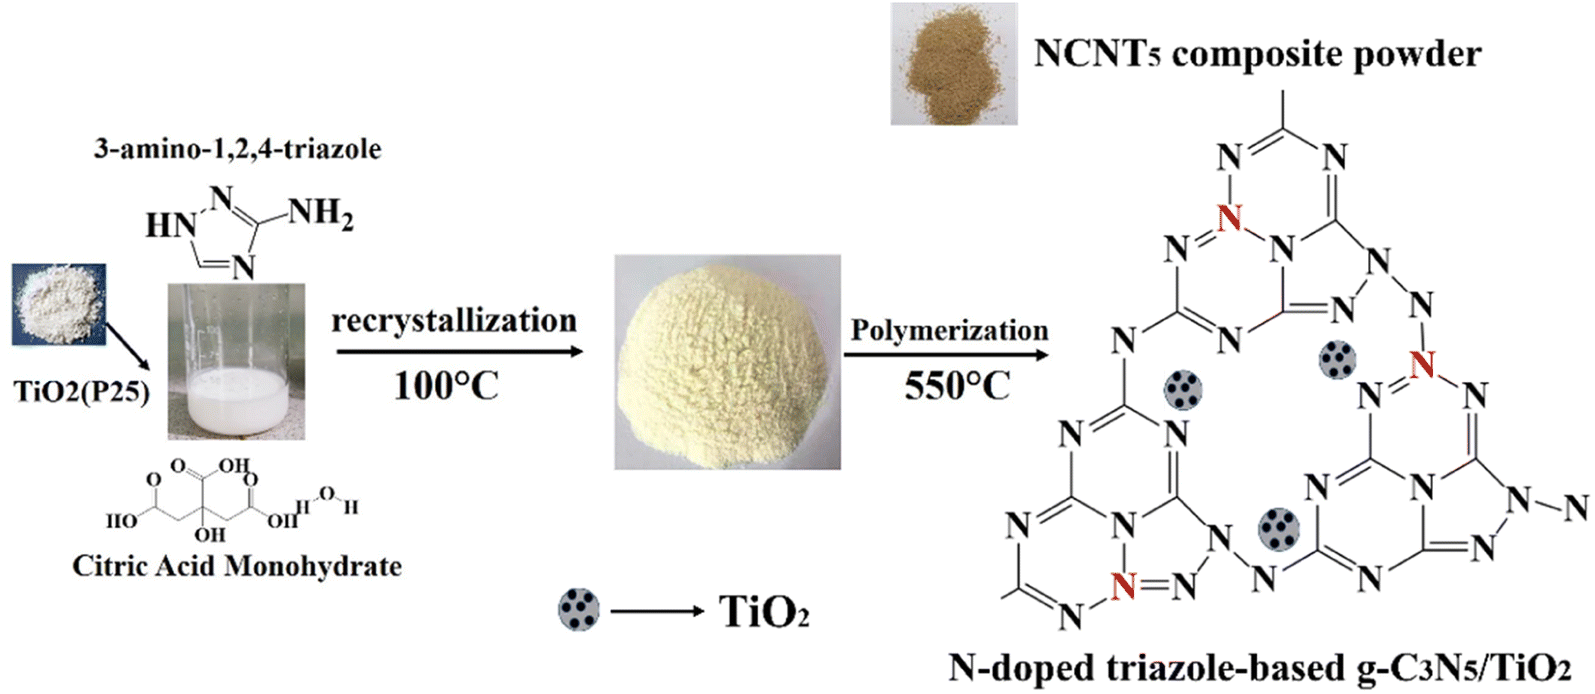
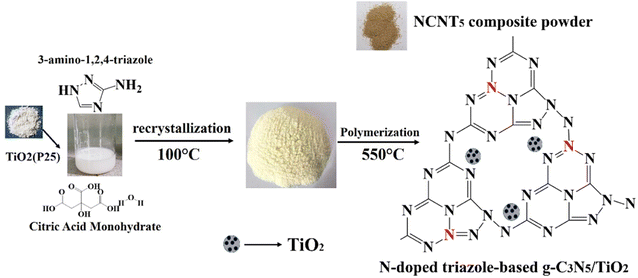
Herein, we synthesized N-doped g-C3N5/TiO2 nanocomposites using a citric acid monohydrate and 3-amino-1,2,4-triazole (3-AT) to prepare a series of g-C3N5/TiO2 photocatalysts with N doping and evaluated the performance of photocatalytic H2 production. 3-AT decomposed at high temperatures to yield cyanamide and hydrazoic acid, which also reacted with citric acid to produce a carbon nitride monomer containing two triazines and one triazole unit. Then, the N-doped triazole-based g-C3N5/TiO2 was synthesized via a polycondensation reaction with the elimination of NH3 at 550 °C. Scheme 1 represents the formation of an N-doped triazole-based g-C3N5/TiO2 S-scheme heterojunction using citric acid monohydrate, TiO2 (P25), and 3-AT as precursors.
 |
| | Scheme 1 The construction of the NCNTx S-scheme heterojunction photocatalyst. | |
2. Experimental section
2.1. Synthesis of bulk g-C3N5
The bulk g-C3N5 nanosheet was derived as follows: 5 grams of 3-amino-1,2,4-triazole was ground and then heated to (550 °C) for 3 hours at a ramp rate of 5 °C per minute. After subsequent cooling, the product was obtained and ground for characterization and applications. Comparatively, g-C3N4 was prepared through two sessions of calcination at 550 °C for three hours with intermediate grinding using melamine as the starting material. The triazole-based g-C3N5 produced only by 3-AT was designated as g-CN.
2.2. Synthesis of nitrogen-doped g-C3N5
A mixture of 5 grams of 3-amino-1,2,4-triazole (3-AT) powder and 5 mg of citric acid monohydrate was ground, then heated to 550 °C for 3 hours at a ramp rate of 5 °C min−1. After cooling, the N-doped g-C3N5 was washed several times with deionized water and ethanol before being used for further experiments. NCN denotes the nitrogen-doped g-C3N5 produced by 3-AT and citric acid alone.
2.3. Preparation of nitrogen-doped g-C3N5/TiO2 heterostructures
The following is a description of the NCN/TiO2 formation process. The S-scheme heterojunction photocatalysts were prepared by dissolving variable amounts of 3-amino-1,2,4-triazole (3-AT) precursor (1, 2, 3, 4, and 5 g) and 5 mg of citric acid monohydrate in 50 mL of (DI) water to form a solution. A suspension was then formed by adding 0.2 g of TiO2 (P25) to the solution with stirring. The suspensions were stirred for 2 hours before being dried by evaporation at 100 °C. To obtain the final NCN/TiO2 composites, the samples were calcined at 550 °C for 3 hours at 5 °C min−1. The products designated NCNT1, NCNT2, NCNT3, NCNT4, and NCNT5.
2.4. Photocatalytic H2-production
The photocatalytic H2 production reaction was conducted in direct sunlight on the terrace of the SRM IST main block in the Kattankulathur Campus, Tamil Nadu, India. Here, 5 milligrams of composite catalyst was added to 50 mL of 5 volumes of aqueous triethanolamine solution in a 100 mL Pyrex reactor. Next, 3 wt% Pt as a precursor was added to the photocatalysis solution. By purging the reaction solution with nitrogen gas for 30 minutes, the dissolved O2 was eliminated. The combined reactants were exposed to light, and the resulting hydrogen gas evolution was detected using gas chromatography (Shimadzu, GC-2014, Molecular Sieve/5 Å column) equipped with a TCD detector. The reactions were achieved between 10:50 a.m. and 1:50 p.m. to ensure the integrity of all experiments carried out in direct sunlight (IST). Solar light density was measured and recorded using a lux meter (TES1332A), and the typical light intensity was measured to be 1358.8 W m−2 in the summer and 790 W m−2 in the wintertime.
2.5. Photoelectrochemical analysis
The arranged photocatalysts' photoelectrochemical properties were investigated using a counter electrode (Pt), a reference electrode (Ag/AgCl), and a working electrode covered with the appropriate photocatalyst. In the procedure, 5 milligrams of catalyst were ultrasonically dispersed in a 1![[thin space (1/6-em)]](https://www.rsc.org/images/entities/char_2009.gif) :1 water and ethanol mixture with 0.005 mL of Nafion. The mixture was added dropwise to the glassy carbon (GC) electrode, and the electrochemical study was carried out with the help of an electrochemical workstation (Biologic SP150). The electrolyte was maintained as a 0.1 M sodium sulfate solution. A solar simulator (1.5 AM) was used as the light source (SSEM, 300 W, Photo Emission Tech, USA).
:1 water and ethanol mixture with 0.005 mL of Nafion. The mixture was added dropwise to the glassy carbon (GC) electrode, and the electrochemical study was carried out with the help of an electrochemical workstation (Biologic SP150). The electrolyte was maintained as a 0.1 M sodium sulfate solution. A solar simulator (1.5 AM) was used as the light source (SSEM, 300 W, Photo Emission Tech, USA).
2.6. Characterization studies
Using XRD (X-ray diffraction analysis) and Cu Kα radiation (=1.5406 A), the crystalline phase and crystallinity of the sample used to prepare the photocatalyst were ascertained. The PHI Versa Probe III XPS was used to perform the X-ray photoelectron spectroscopy (XPS). Testing was performed using a Shimadzu IRTracer-100 FT-IR spectrometer. Scanning electron microscopy (SEM, TFC, Apreo S) and Transmission electron microscopy were used to examine the sizes and shapes of the nanocomposites (TEM, JEOL Japan, and JEM-2100 Plus). The specific surface area and Barrett–Joyner–Halenda (BJH) pore size distribution were calculated using the Autosorb IQ from Brunauer–Emmett–Teller's (BET) Quantachrome Instruments. A UV-vis spectrophotometer was used to record UV-vis diffuse reflectance (UV-DRS) spectra (Shimadzu, UV-3600i Plus). The PL and (TRPL) spectra were analyzed with a fluorescence spectrophotometer (Horiba, Fluorolog-QM).
3. Results and discussion
3.1. Structure analysis
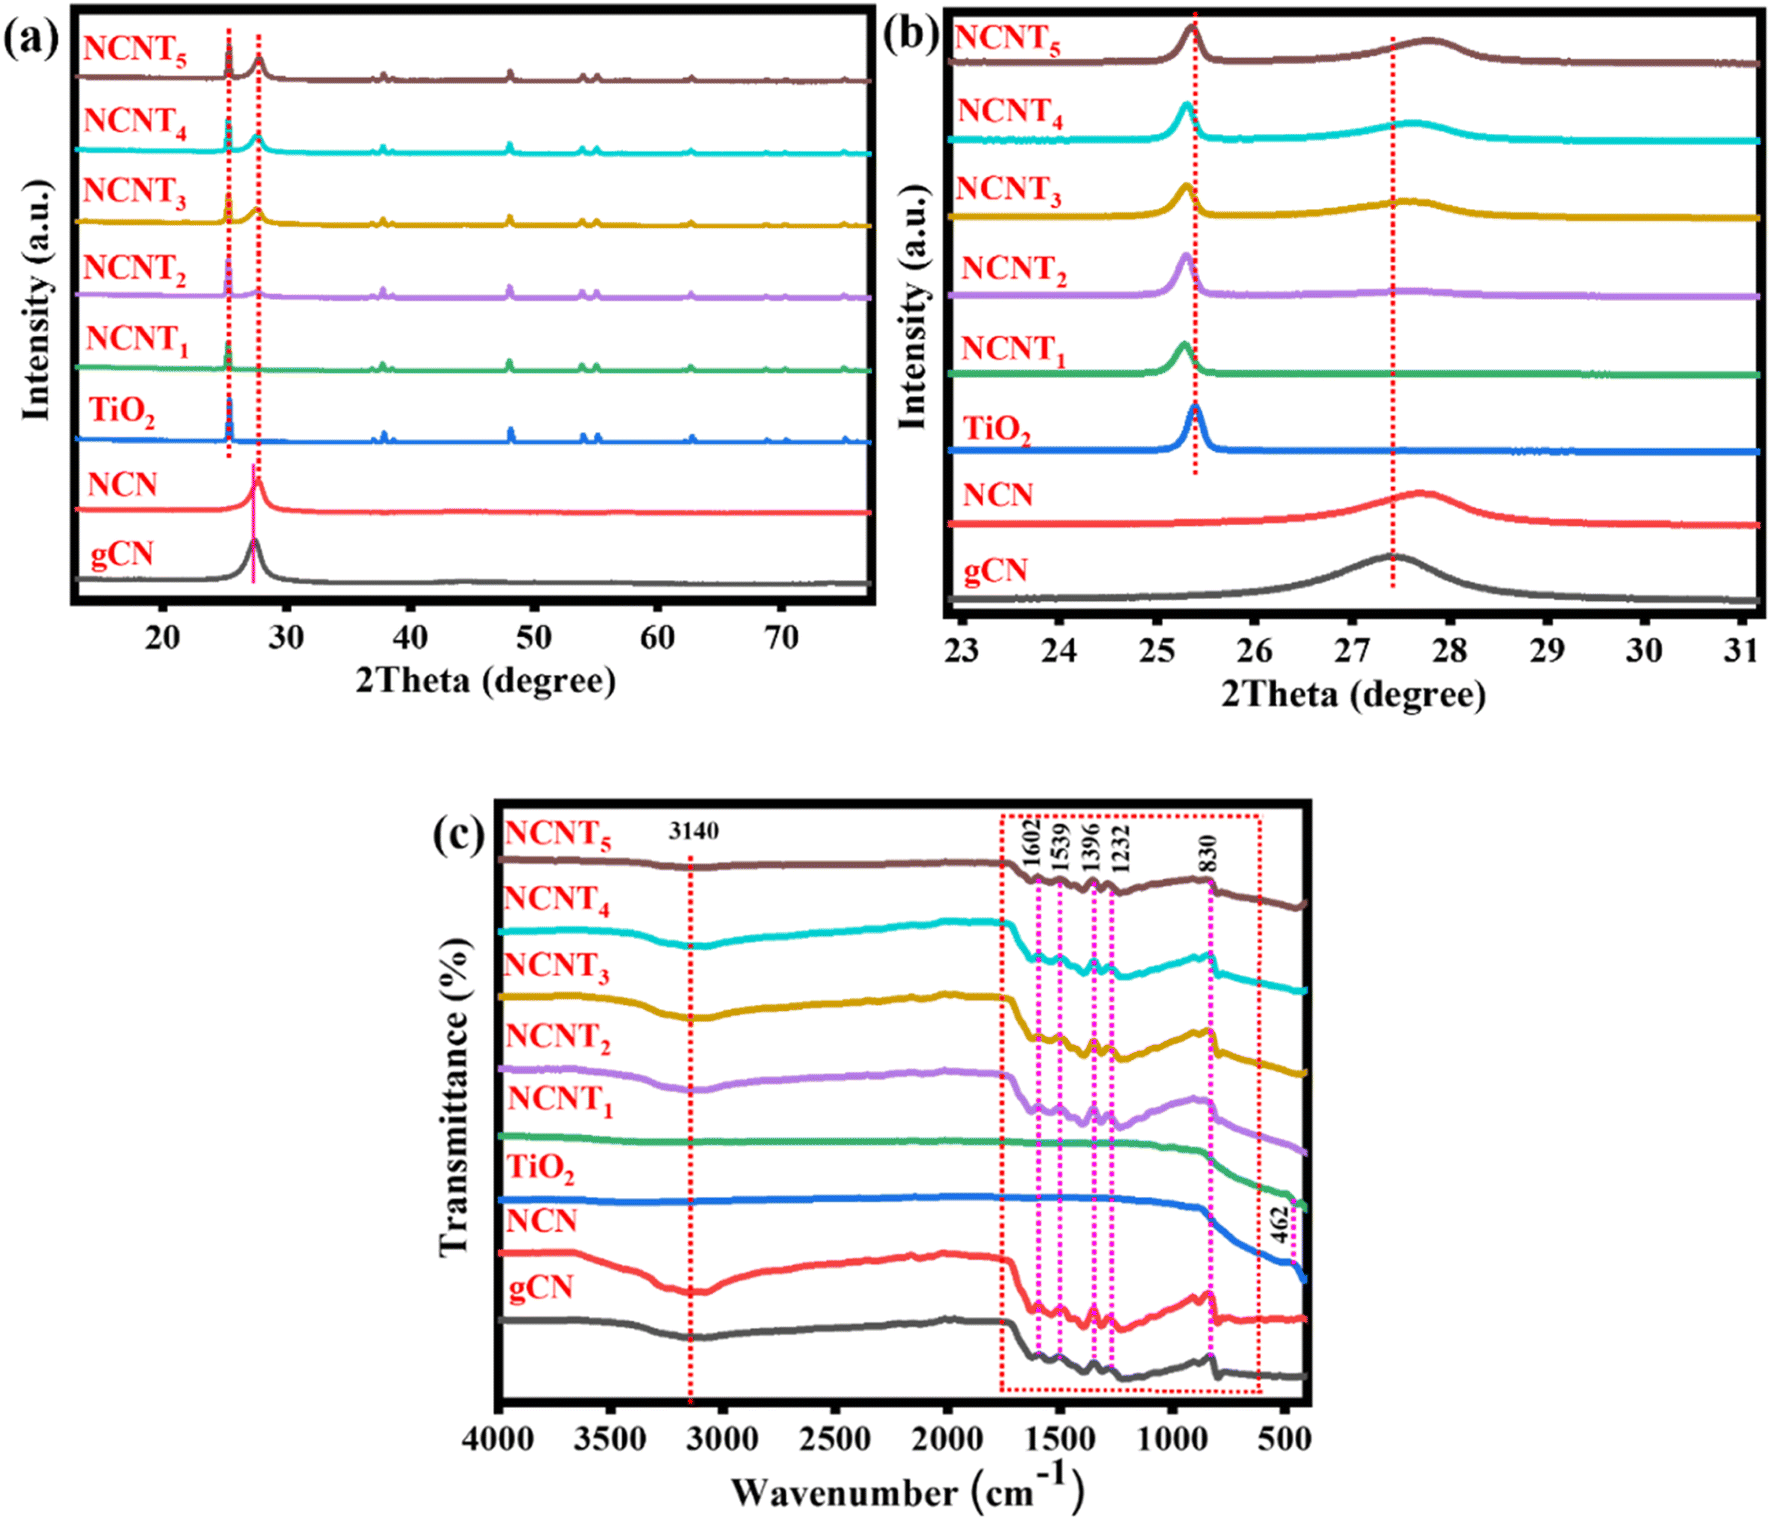
In this study, we prepared N-doped triazole-based g-C3N5/TiO2 S-scheme photocatalysts using 3-AT, citric acid, and TiO2 as raw materials. Using 3-AT resulted in the formation of a particular N-rich CN pattern of triazole units, a substitute chemical for synthesizing CN with a larger N-content and low band energy.36,37Fig. 1a depicts the XRD patterns of NCNTx samples, showing all the significant diffraction peaks of produced TiO2. TiO2 (P25) diffraction peaks at 25.3, 36.9, 37.9, 38.5, 48.1, 53.9, 55.3, 62.5, 68.7, 70.5, and 75.2 correspond to plane values (1 0 1), (1 0 3), (0 0 4), (1 1 2), (2 0 0), (1 0 5), (2 1 1), (2 1 3), (1 1 6), (2 2 0), and (1 0 7), respectively. Fig. S1a† shows mainly two peaks at approximately 13° and 27°, corresponding to the graphitic carbon nitride planes (100) and (002). The peak allocated to the (002) plane of NCN has a greater 2θ value than that of the g-C3N4 spectrum, which is consistent with an earlier report38 and confirms the formation of the NCN structure. The two triazine and triazole rings in the g-CN unit could be responsible for twisting the sheet structure and reducing the interlayer space in the (002) direction. The XRD patterns of NCNTx samples contain all of the NCN and TiO2 peaks in Fig. 1a, which concurs with the findings from HRTEM images. Fig. 1b demonstrates that compared with bare g-CN, the XRD pattern of NCN showed no noticeable change, indicating that NCN retained its molecular structure. The peak frequencies of NCNTx were slightly shifted from TiO2 (for example, on the (004) plane of anatase TiO2 and the (110) plane of rutile TiO2) due to the strong intrinsic interactions between TiO2 and NCNx. A close connection facilitated the transfer of charge carriers induced by photocatalysis.39,40 This can be credited to the effective intrinsic interface between TiO2 and NCN. The XRD patterns of g-C3N4, g-CN (g-C3N5), and NCN (N-doped g-C3N5) are shown in Fig. S1a.† The slight shift in the location of the NCN peaks from 27° to 27.6° indicated that the N element had been successfully doped into g-CN. This finding suggests that using too much citric acid may cause the production of undesired impurities during the synthesis of N-doped g-C3N5.
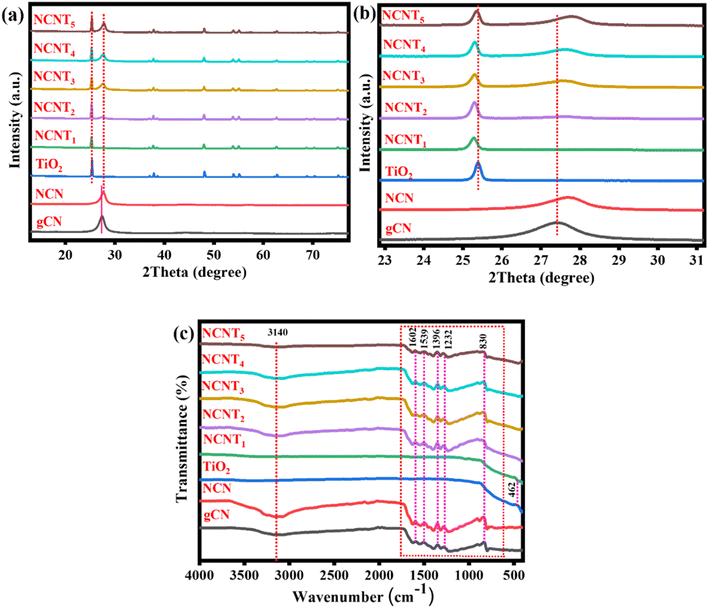 |
| | Fig. 1 XRD patterns (a and b) and FT-IR spectra of the (g-CN, NCN, TiO2, and NCNTx) (c). | |
FTIR analysis was used to examine the fundamental components of NCNTx samples. Except for a few minor differences, the FTIR spectra of NCNTx samples revealed similar results in Fig. 1c. The absorption band at 466 cm−1 in the pristine TiO2 spectrum is caused by the stretching vibrations of Ti–O–Ti and Ti–O in anatase crystals. According to FTIR analysis of the surface functional groups of these samples, the primary spectrum in the range of (1200–1600 cm−1) could be attributed to the C–N/C![[double bond, length as m-dash]](https://www.rsc.org/images/entities/char_e001.gif) N heterocycles of the carbon nitride unit. Another peak was detected at 824 cm−1 for the triazine unit breathing vibration.41 These peaks were observed to be attributed to N–N stretching (1270 cm−1) in triazole-based moieties, and C–N (1334 cm−1) and CN (1594 cm−1) in triazine units, including both. The peak at 3100 cm−1 was caused by the observed stretching vibrations increase of –NH2 and –OH of adsorbed H2O molecules.42 Again, the H bond-like connection that gently shifted to a smaller wavenumber and extended peak as compared to NCN at around 1500 cm−1 could indicate the formation of protonated graphitic nanosheets.43 Furthermore, the H2 bond between –NH–/–NH2 was broken after protonation, as proved by the expansion of the adsorption peaks of –NH– or –NH2 groups in the FT-IR spectra at 3500 cm−1 to 3000 cm−1.44 Despite this, the XRD and FTIR results indicated that these samples were successfully formed and maintained the N-doped g-C3N5/TiO2 structure. The FT-IR spectra of g-C3N4, g-CN, and NCN are shown in Fig. S1b.† It was discovered that there was no discernible difference between the FT-IR spectra of g-C3N4 and g-CN, NCN, indicating that NCN retained the molecular structure of g-CN. Nevertheless, XRD and FTIR findings indicated that the g-C3N5 structure was successfully formed and well preserved after N-doping in these samples.
N heterocycles of the carbon nitride unit. Another peak was detected at 824 cm−1 for the triazine unit breathing vibration.41 These peaks were observed to be attributed to N–N stretching (1270 cm−1) in triazole-based moieties, and C–N (1334 cm−1) and CN (1594 cm−1) in triazine units, including both. The peak at 3100 cm−1 was caused by the observed stretching vibrations increase of –NH2 and –OH of adsorbed H2O molecules.42 Again, the H bond-like connection that gently shifted to a smaller wavenumber and extended peak as compared to NCN at around 1500 cm−1 could indicate the formation of protonated graphitic nanosheets.43 Furthermore, the H2 bond between –NH–/–NH2 was broken after protonation, as proved by the expansion of the adsorption peaks of –NH– or –NH2 groups in the FT-IR spectra at 3500 cm−1 to 3000 cm−1.44 Despite this, the XRD and FTIR results indicated that these samples were successfully formed and maintained the N-doped g-C3N5/TiO2 structure. The FT-IR spectra of g-C3N4, g-CN, and NCN are shown in Fig. S1b.† It was discovered that there was no discernible difference between the FT-IR spectra of g-C3N4 and g-CN, NCN, indicating that NCN retained the molecular structure of g-CN. Nevertheless, XRD and FTIR findings indicated that the g-C3N5 structure was successfully formed and well preserved after N-doping in these samples.
3.2. Morphological characteristics
Fig. 2a–c depict SEM images of the structures and morphologies of bare g-CN, NCN, TiO2, and NCNTx composites. Fig. S2a† clearly shows the rough carbon nitride g-CN sheet layered structure with irregular thickness.45Fig. 2a depicts the sheet-like structure of the nitrogen-doped carbon nitride NCN with a distinct thickness. In Fig. 2b, the TiO2 sample displays polydisperse spherical morphologies with sizes ranging from 500 to 800 nm. The NCNT5 composite, produced by heating a combination of 3-AT and TiO2, retained the forms of TiO2, as depicted in Fig. 2c. Surprisingly, the thermal polymerization SEM of 3-AT (NCN) exhibited a sheet-like appearance on the surface of the TiO2, which was closely and uniformly coated. The EDX results of NCN and NCNT5 in Table S1† show that the weight percentage of nitrogen increased, respectively. Table 2 shows EDX and XPS analysis results, which confirmed nitrogen enrichment in NCN and NCNT5.
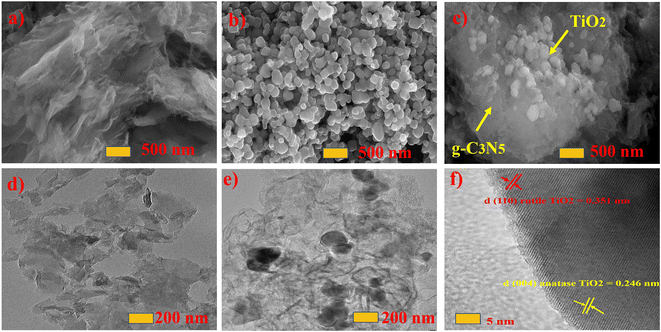 |
| | Fig. 2 SEM of the NCN, TiO2, and NCNT5 (a–c), and TEM of the NCN, NCNT5, and fast Fourier transform FFT (d–f). | |
The surface morphology and structures of the g-CN, NCN, TiO2, and NCNTx samples were studied using TEM images. As seen in Fig. 2d–f, all the pieces were made up of sheet-like spherical structures. Thermal decomposition and copolymerization can form g-CN (g-C3N5) nanosheets, as shown in Fig. S2c,† which are shorter and lighter than g-C3N4 nanosheets. Fig. S2d† reveals polydisperse spherical morphologies in the 200 nm region in the TiO2 sample. By the edge of the sheet shape with N-doping content in Fig. 2d, a few nanosheets smaller than 200 nm were generated, resulting in a clear surface area of the g-CN sample. Even though the pieces were sonicated for 45 minutes prior to the TEM measurement, NCN was attached to TiO2 in a spherical sheet-like manner Fig. 2e. Lattice folds with d-spacings of 0.351 nm and 0.246 nm, respectively, confirmed the (110) and (004) planes of the hexagonal structure seen in NCNT5 in Fig. 2f. A distinct grain edge indicated that an S-scheme heterojunction layout was formed in the NCNTx composites. This further validated the structural stability of the NCNT5 composite. Lattice spacings of 0.351 and 0.246 nm correspond to the (110, 004) planes of the rutile and anatase phases of TiO2.46,47
3.3. Sample pore size analysis
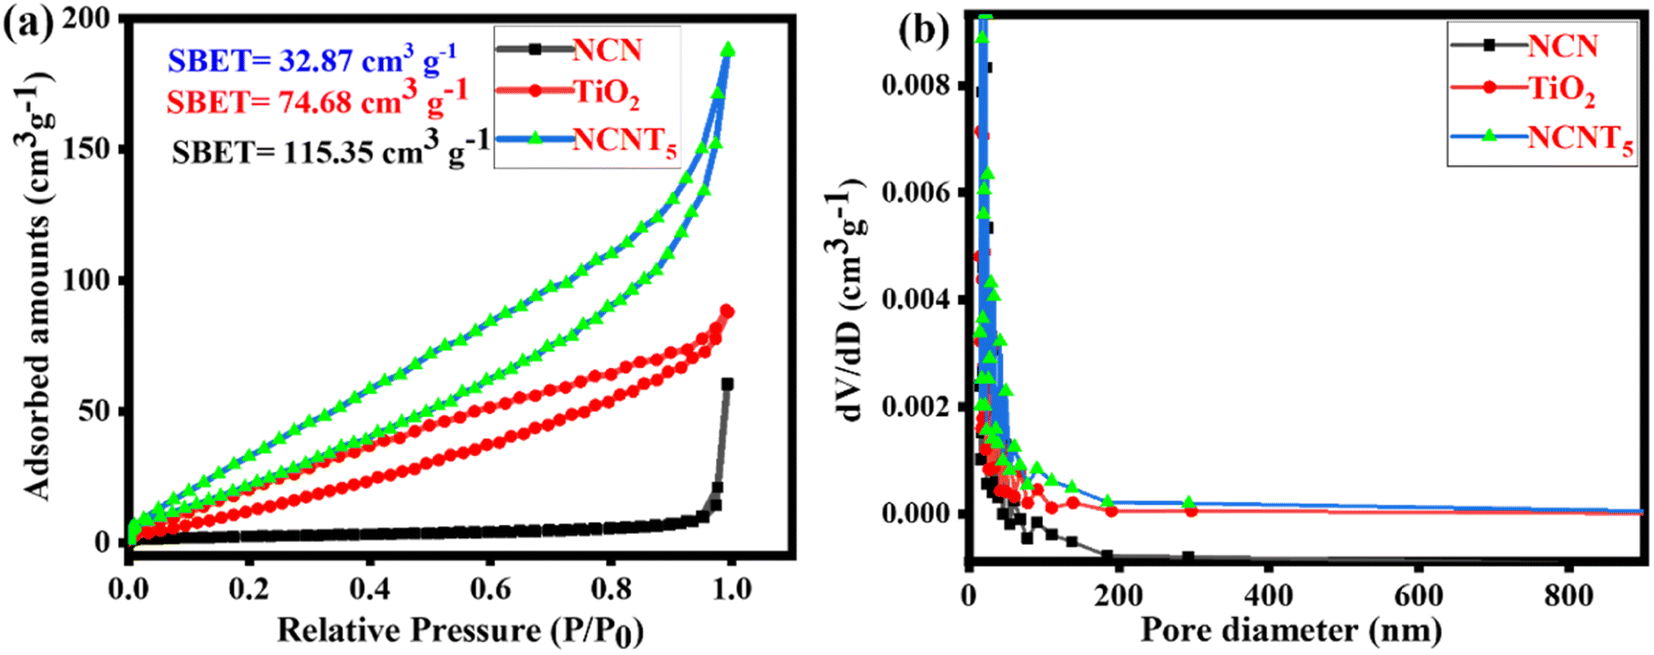
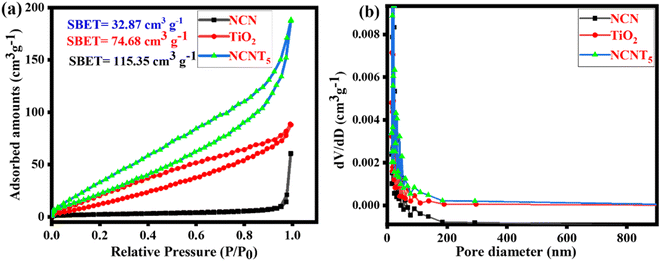
N2 adsorption analysis was also used to limit the textural assets of as-arranged samples. As depicted in Fig. 3a, type (IV) isotherms by H3 hysteresis curves at the comparative pressure series of 0.0 to 1.0 are present in the prepared samples' mesoporous formations. The (BJH) pore size circulation plots (inset) show mesoporous appearances, including the 2–200 nm primary pore size. As determined by BET, the surface areas of NCN, TiO2, and NCNT5 composites were 32.87, 74.68, and 115.35 cm3 g−1, respectively. The NCNT5 photocatalyst has a large surface area,48 indicating that the recombination rate of photo-generated charge carriers remained low. The increased diameter range, pore size, migration, and isolation of photo-generated carriers' optical properties all contributed to the increased photocatalytic activity. The NCNT5 composite is advantageous for improved adsorption.49,50 According to the findings above, it gives a more significant number of responsive positions for photocatalytic processes, significantly impacting the development of photocatalytic efficiency. TiO2 and NCNT5 samples have a larger specific surface area than pure NCN. Fig. 3b depicts the distribution of pore sizes. NCNT5 has a broad pore size distribution curve of 8–200 nm, and its pore volume is (0.289 cm3 g−1), which is two times that of TiO2 (0.138 cm3 g−1) and nearly three times that of NCN (0.105 cm3 g −1). The BET surface area, pore volume, and pore size of all samples are shown in Table 1. TiO2 and NCNT5 samples have a larger specific surface area than pure NCN. The increased concentration of 3-amino-1,2,4-triazole in the final material may be responsible for the improved specific surface area of NCNT5.
 |
| | Fig. 3 N2 adsorption/desorption isotherms (a) and pore size distribution of the NCN, TiO2, and NCNT5 samples (b). | |
Table 1 Surface characteristics of prepared samples
| Samples |
S
BET (cm3 g−1) |
Pore volume (cm3 g−1) |
Pore size (nm) |
| NCN |
32.87 |
0.105 |
14.30 |
| TiO2 |
74.680 |
0.138 |
16.23 |
| NCNT5 |
115.351 |
0.289 |
16.21 |
3.4. Surface chemical composition (XPS)
The chemical valence states and surface elemental compositions of NCNT5, NCN, and TiO2 samples were confirmed using XPS analysis. XPS survey data confirmed that NCNT5, NCN, and TiO2 composites primarily contain the four elements (Ti, O and C, N) Fig. 4i. The two peaks positioned at (458.05/457.95 eV) and (464.08/463.97 eV) in the high-resolution Ti 2p spectra in Fig. 4a and g, are credited to (Ti 2p3/2) and (Ti 2p1/2), respectively,51 indicating the occurrence of Ti4+ in TiO2 and NCNT5. Two chemical positions of O 1s for NCNT5 and TiO2 were found for the H–R O 1s spectra in Fig. 4b and h, at (529.15/529.37 eV) and (531.37/531.90 eV), which are attributed to O2−-type and OH− bonds. The peaks from NCN and NCNT5 at (284.65/284.48 eV and (288.24/288.01 eV) in the C 1s H–R spectra in Fig. 4c and e can be a reason for the (C–N and N–CN) bond groups.52 The significant donation peak at (288.24 and 288.01) eV is attributable to the sp2-hybridized C bonded to the nitrogen atom within the triazine rings. As shown in Fig. 4d and f, the H–R N 1s spectrum of NCNT5 differs slightly from that of NCN. The N 1s spectrum of NCN and NCNT5 can be separated into five peaks with binding energies of 398.1 eV, 398.9 eV, 399.7 eV, 400.2, 403.7 eV, and 397.5 eV, 398.2 eV, 399.2 eV, 400.1 eV, 402.3 eV, respectively. The dominant peaks at 398.1 and 397.5 eV are attributed to sp2-hybridized nitrogen in C-containing triazine rings (C–NC). In contrast, the peaks at 398.9 and 398.2 eV are usually attributed to tertiary N in N–(C)3 groups.53,54 The amino groups (C–N–H) are indicated by the peaks at 399.7 and 399.2 eV, while π excitation is indicated by the height at 403.7 and 402.3 eV. Another peak at 400.2 and 400.1 eV) corresponding to graphitic N, can be seen in samples NCN and NCNT5, signifying that nitrogen-doped graphitic carbon has been created and is present in the g-C3N5 composite.55,56 When citric acid was added to g-C3N5, N–N and NN bond peaks appeared, indicating that nitrogen replaced the carbon atom. Notably, when TiO2 is coupled with NCN, a slight peak change of Ti 2p, O 1s, C 1s, and N 1s is observed, which applies to the electron screening caused by the variation in electron density. The C–N, N–(C)3, N–CN, and C–NC peaks revealed that the g-CN, NCN, and NCNT5 structures are triazole/triazine unit hybrids (Table 2). The g-CN peaks at 284.70 and 288.64 eV in the C 1s high-resolution spectrum of Fig. 4j correspond to the C–N and N–CN bond groups. The C–NC and sp3 N–(C)3 bonds were attributed to two peaks at approximately 398.50 and 399.60 eV in the H–R N 1s spectra shown in Fig. 4k.3,46 X-ray photoelectron spectroscopy and g-CN and NCN results all supported the idea that the g-C3N5 structure was successfully formed and well preserved in these samples before N-doping. In general, surface electron density is negatively related to binding energy.57 The internal electric field (IEF) was formed when electrons transferred from NCN to TiO2 after contact, as shown by the XPS results.
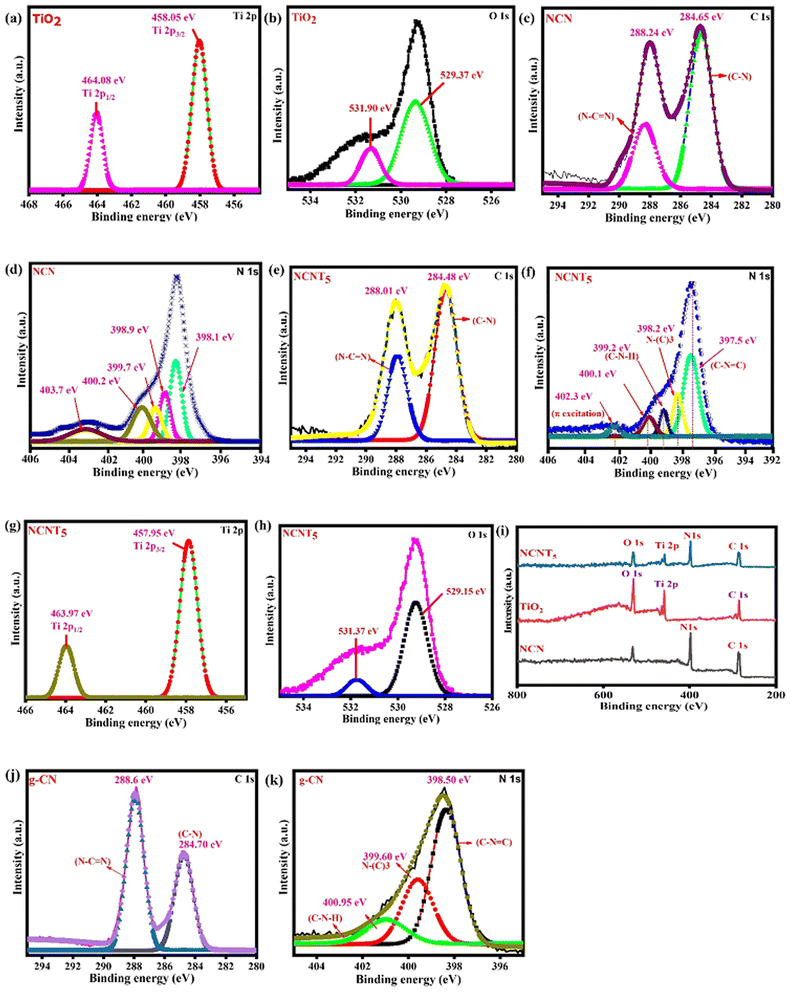 |
| | Fig. 4 XPS of (Ti 2p, O 1s) from TiO2 (a and b), XPS of C 1s and N 1s from NCN (c and d), XPS of C 1s, N 1s, Ti 2p and O 1s from NCNT5 (e–h), XPS survey spectra of NCN, TiO2 and NCNT5 samples (i), and pristine g-CN of C 1s, N 1s (j and k). | |
Table 2 An analysis of deconvoluted XPS spectra revealed the binding energies and valence bond percentages for carbon and nitrogen
| Samples |
C–N |
N–CN |
C–NC |
N–(C)3 |
C–N–H |
| g-CN |
37.61 (284.70) |
62.39 (288.6) |
53.25 (398.50) |
29.11 (399.60) |
17.51 (400.95) |
| NCN |
29.82 (284.65) |
70.18 (288.24) |
44.67 (398.1) |
30.84 (398.9) |
24.47 (399.7) |
| NCNT5 |
36.28 (284.48) |
63.28 (288.01) |
46.90 (397.5) |
29.97 (398.2) |
23.12 (399.2) |
3.5. Energy band structure and photoelectric properties
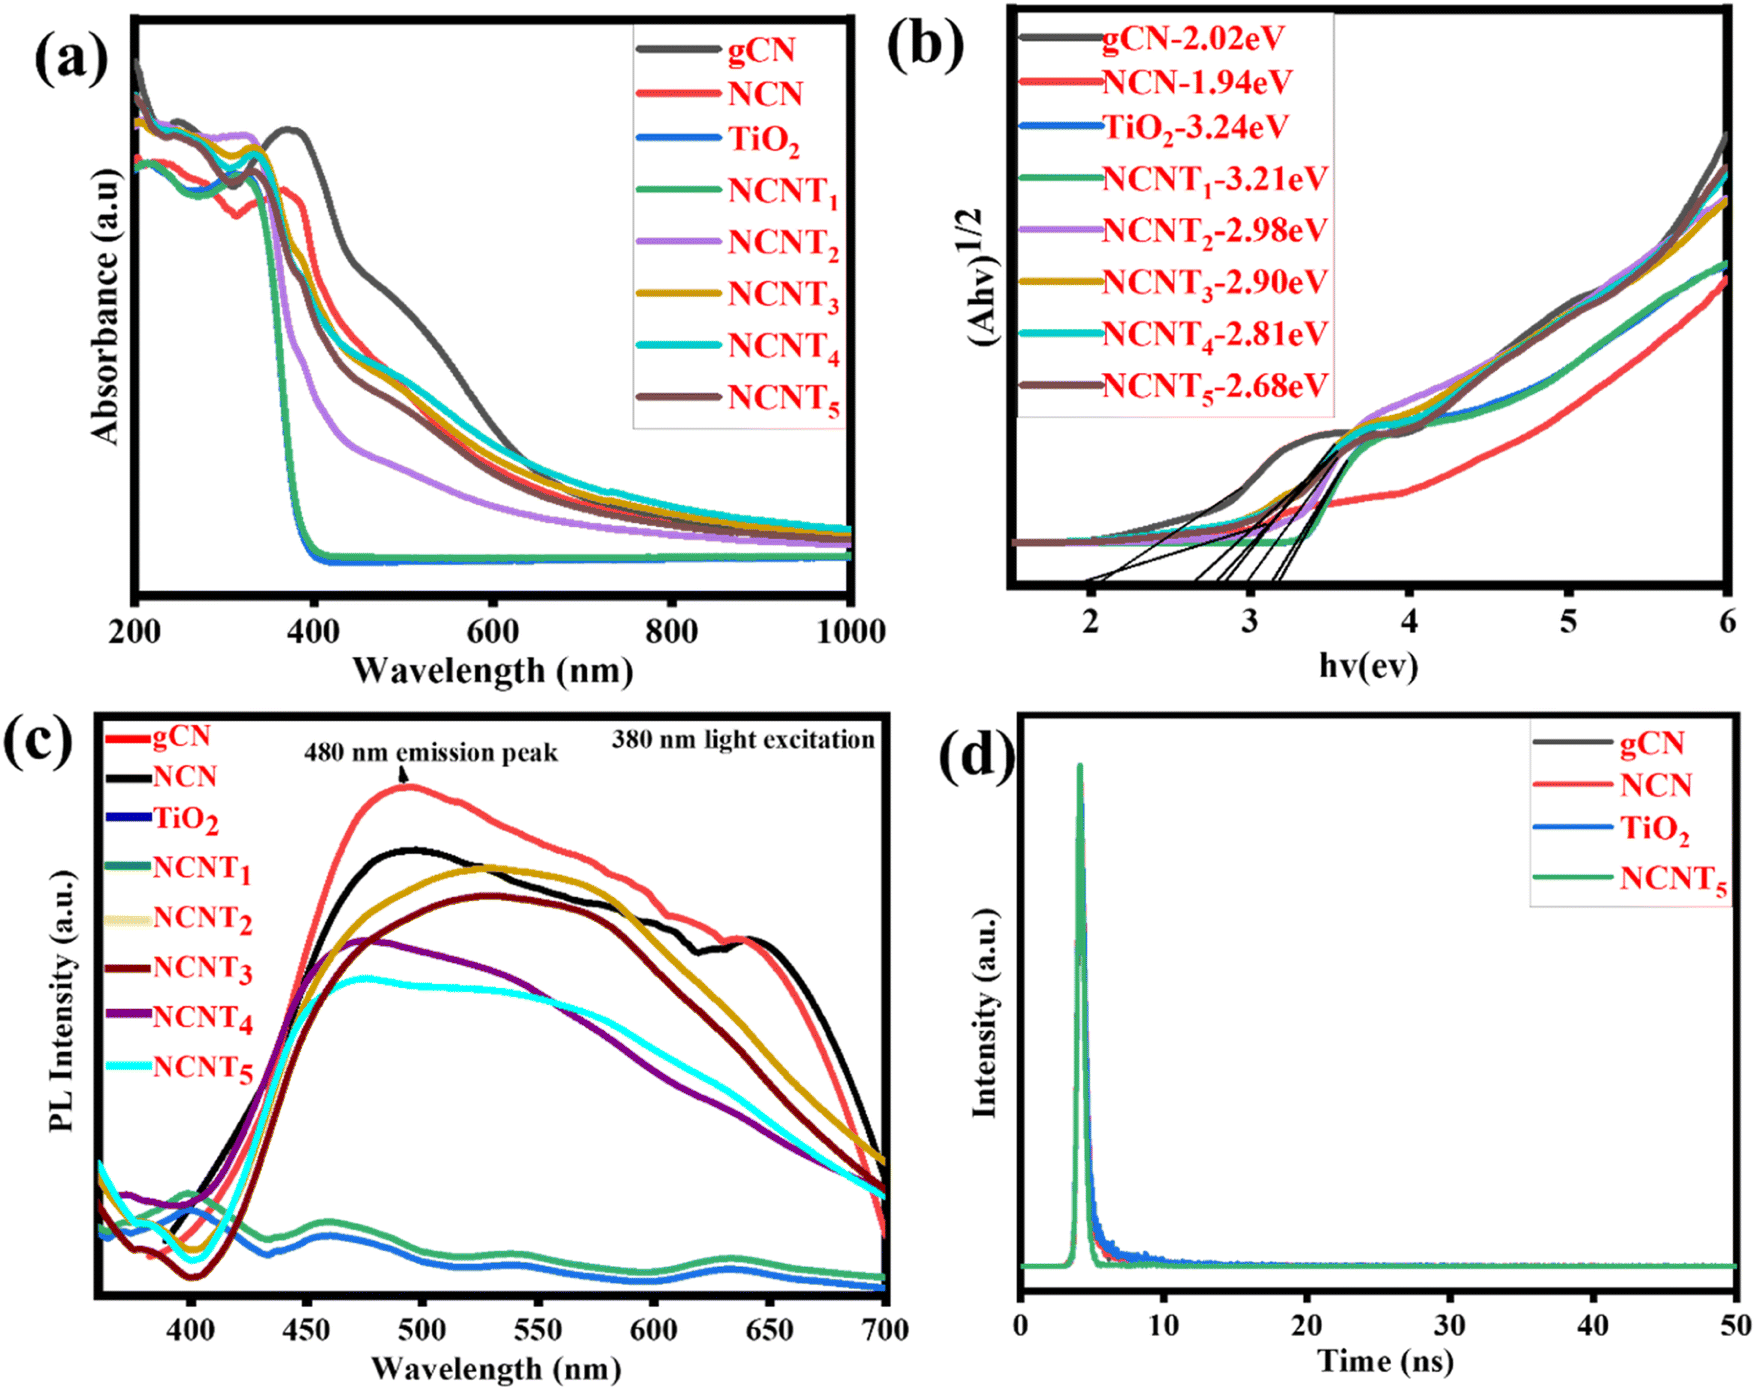
UV-vis spectra were used to characterize the photocatalytic activity of g-CN, NCN, TiO2, and NCNTx, and the correlating DRS (diffuse reflectance spectra) were generated using the Kubelka–Munk method,58 as shown in Fig. 5a and b. In the visible wavelength spectrum, 400–800 nm, the band gaps of the NCN and NCNTx were red-shifted and the spectral intensity was more significant than that of the g-CN, which may be attributed to the Nitrogen-doped photocatalysts' intrinsic regulation of the interactive band structure or the hierarchical system. The optical properties of the NCNTx samples were investigated using UV-vis photographs, as illustrated in Fig. 5a and the inset. As previously reported, TiO2 exclusively shows the optical absorption of UV light.59 The standard wide absorption bands of g-CN, NCN, and NCNTx were observed, relating to the raw band-to-band shift edges of absorbance at 461 to 666 nm, comparable to the optical properties shown in Fig. S3.† As a result, the Eg values of g-CN, NCN, TiO2, and NCNTx were estimated to be 2.02, 1.94, 3.24, 3.21, 2.98, 2.90, 2.81, and 2.68 eV Fig. 5b. The higher visible-light spectrum of NCN in comparison to g-C3N5 suggested that NCN had more excellent illumination capability over a broader range of visible-light wavelengths. The correlation among the N 2p orbitals of the connecting azo-nitrogen of triazole-rings, the heptazine π-conjugated process,60 which spans the π-conjugation network, is primarily responsible for the more extended absorption of C3N5. The increased visible light absorbance of NCNTx was related to the presence of nitrogen in carbon sites in the NCN unit. It can generate donor regions in the forbidden gap from its N 2p level and contribute too many electrons, thereby refining photocatalytic activity.61 A UV-Vis spectrum of g-C3N4, g-CN, and NCN is shown in Fig. S3.† The energy gap of g-CN is higher than that of g-C3N4; after doping nitrogen in g-CN, the band gap was considerably reduced relative to the g-C3N4. The results showed that NCN and NCNTx have a smaller band gap than g-CN, which is helpful for light absorption and raises photocatalytic activity.62
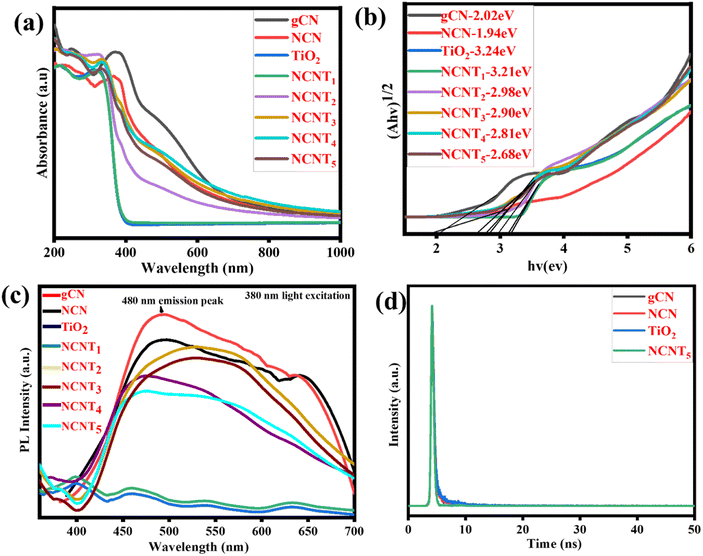 |
| | Fig. 5 UV-DRS spectra (a), plots of band gap (b), PL spectra of (g-CN, NCN, TiO2, and NCNTx) (c), time-resolved photoluminescence (TRPL) of bare g-CN, NCN, TiO2, and NCNT5 (d). | |
Fig. 5c depicts the photoluminescence spectra of g-CN, NCN, TiO2, and NCNTx composite samples under 380 nm light excitation. Similar to prior reports, neither TiO2 nor NCNT1 exhibited a detectable emission peak. Although the g-CN and NCN had the highest PL, the peak intensities of the NCNT2 to NCNT5 composites were significantly reduced after the NCN was attached to TiO2. As for the low NCN in the composite,63 the NCNT5 sample showed no observable emission peaks. The other composites, on the other hand, displayed exceptional photoluminescence signals. Among the NCNTx (x = 2, 3, 4, and 5) samples, the NCNT5 sample had low PL intensity, indicating that charge carrier recombination in the composite was critically restricted due to the S-scheme heterojunction structure at the interface of NCN and TiO2. The overall characteristic peaks of these tests showed that the intensity of their PL emission was reduced following N-doping, with NCNT5 exhibiting the average PL emission, i.e., the average charge recombination of these samples.64,65 An exciting suppression of (e−/h+) pair recombination may cause the hybrid to generate different photo-induced carriers, activating the photocatalytic reaction.
Time-resolved photoluminescence (TRPL) of bare g-CN, NCN, TiO2, and NCNT5 are shown in Fig. 5d, and Table S2† shows the results of a TRPL performed to estimate the lifetime of the charge carriers. The PL emission peak located at approximately 480 nm was determined. Further, bare g-CN, NCN, TiO2, and NCNT5 all had average lifetimes of 2.21, 1.98, 2.35, and 1.49 ns. The average charge carrier lifetime of NCNT5 was 1.49 ns, which is significantly shorter than that of NCN (1.98 ns); this is related to the decreased recombination rate and longer charge carrier lifetime, and was confirmed by Nyquist plots and transient photocurrents.66,67 The NCNT5 heterojunction demonstrated the best charge-transfer efficiency based on the average lifetime of the four samples.
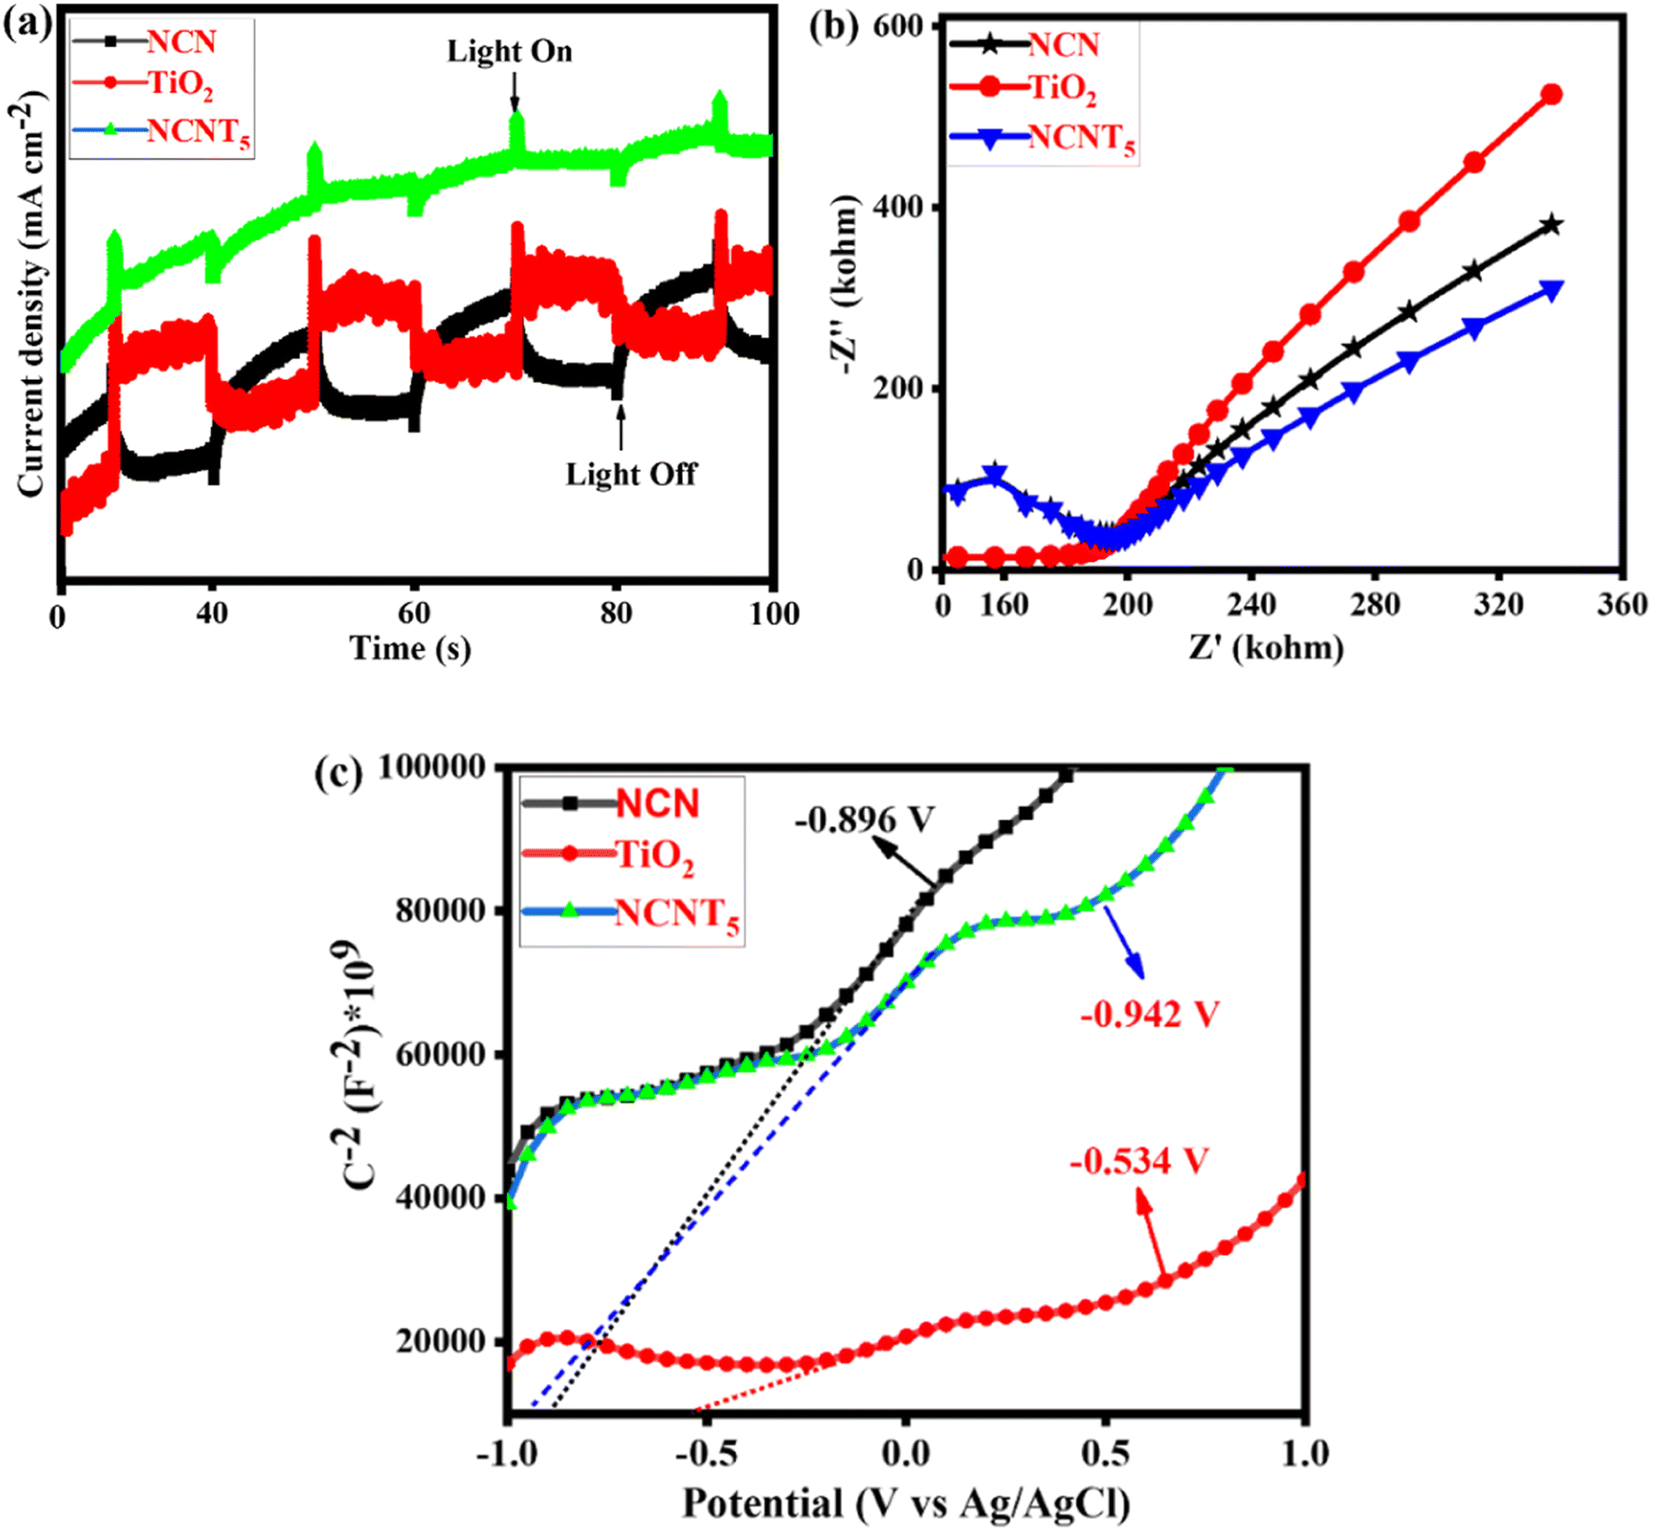
Fig. 6a depicts the cyclic photocurrent curves of pure NCN, TiO2, and NCNT5. When a light source is turned on and off, the photocurrent intensities sharply increase and decrease, indicating the formation of photo-induced electrons under visible irradiation. The transient photocurrent density is slightly higher in the NCNT5 composite than in the NCN and TiO2 systems, meaning that NCNT5 can generate more electrons when exposed to visible light. This is stable with the significantly higher current density of the NCNT5 sample when compared to NCN and TiO2. The results show that NCNT5 S-scheme heterojunctions are more easily activated by visible light, resulting in extra photo-generated electrons,68,69 which indicates improved photocatalytic hydrogen production by powerful visible-light NCNT5. These findings suggest that NCN's NCNT5 could improve charge separation and activity, thus enhancing photocurrent responses.
 |
| | Fig. 6 Photocurrent spectra (a), Nyquist plot (b), and Mott–Schottky plots of NCN, TiO2, and NCNT5 samples (c). | |
As a result, it is not surprising that the NCNT5 sample exhibited more excellent photocatalytic activity than bare NCN and TiO2 due to its greater separation efficiency. Fig. 6b depicts the Nyquist plots of pure NCN, TiO2, and NCNT5. The diameter of the semicircle arranged on an EIS plot agrees with the electron-transfer resistance in a sample.70–72 Because NCNT5 has a smaller arc radius than NCN and TiO2, the composite has lower energy transference resistance. Forming the S-scheme heterojunction significantly improves the movement and separation efficiency in the NCNT5 sample. These data show that NCNT5 composites outperform single components in electron–hole transportation and partition.
In Fig. 6c, the adequate slopes of the Mott–Schottky plots of the samples revealed their n-type semiconducting nature. As a result, their CB positions can be determined using their plane band capacities, which are determined by the (x) values of their Mott–Schottky curves' linear regions. Thus, the generalized CB positions of NCN, TiO2, and NCNT5 samples were −0.89, −0.53, and −0.94 V (vs. Ag/AgCl).73 The band gaps of NCN (1.94 eV), TiO2 (3.24 eV), and NCNT5 (2.68 eV) were used to calculate their VB positions, which were 1.04, 2.70, and 1.73 V, respectively, as shown in Table 3.
Table 3 The band gap, valence band edge, and conduction band edge potentials of NCN, TiO2, and NCNT5 catalysts on a standard hydrogen electrode
| Semiconductor |
E
g (eV) |
E
CB (eV) |
E
VB (eV) |
| NCN |
1.94 |
−0.896 |
1.04 |
| TiO2 |
3.24 |
−0.534 |
2.70 |
| NCNT5 |
2.68 |
−0.942 |
1.73 |
3.6. Photocatalytic hydrogen production activity
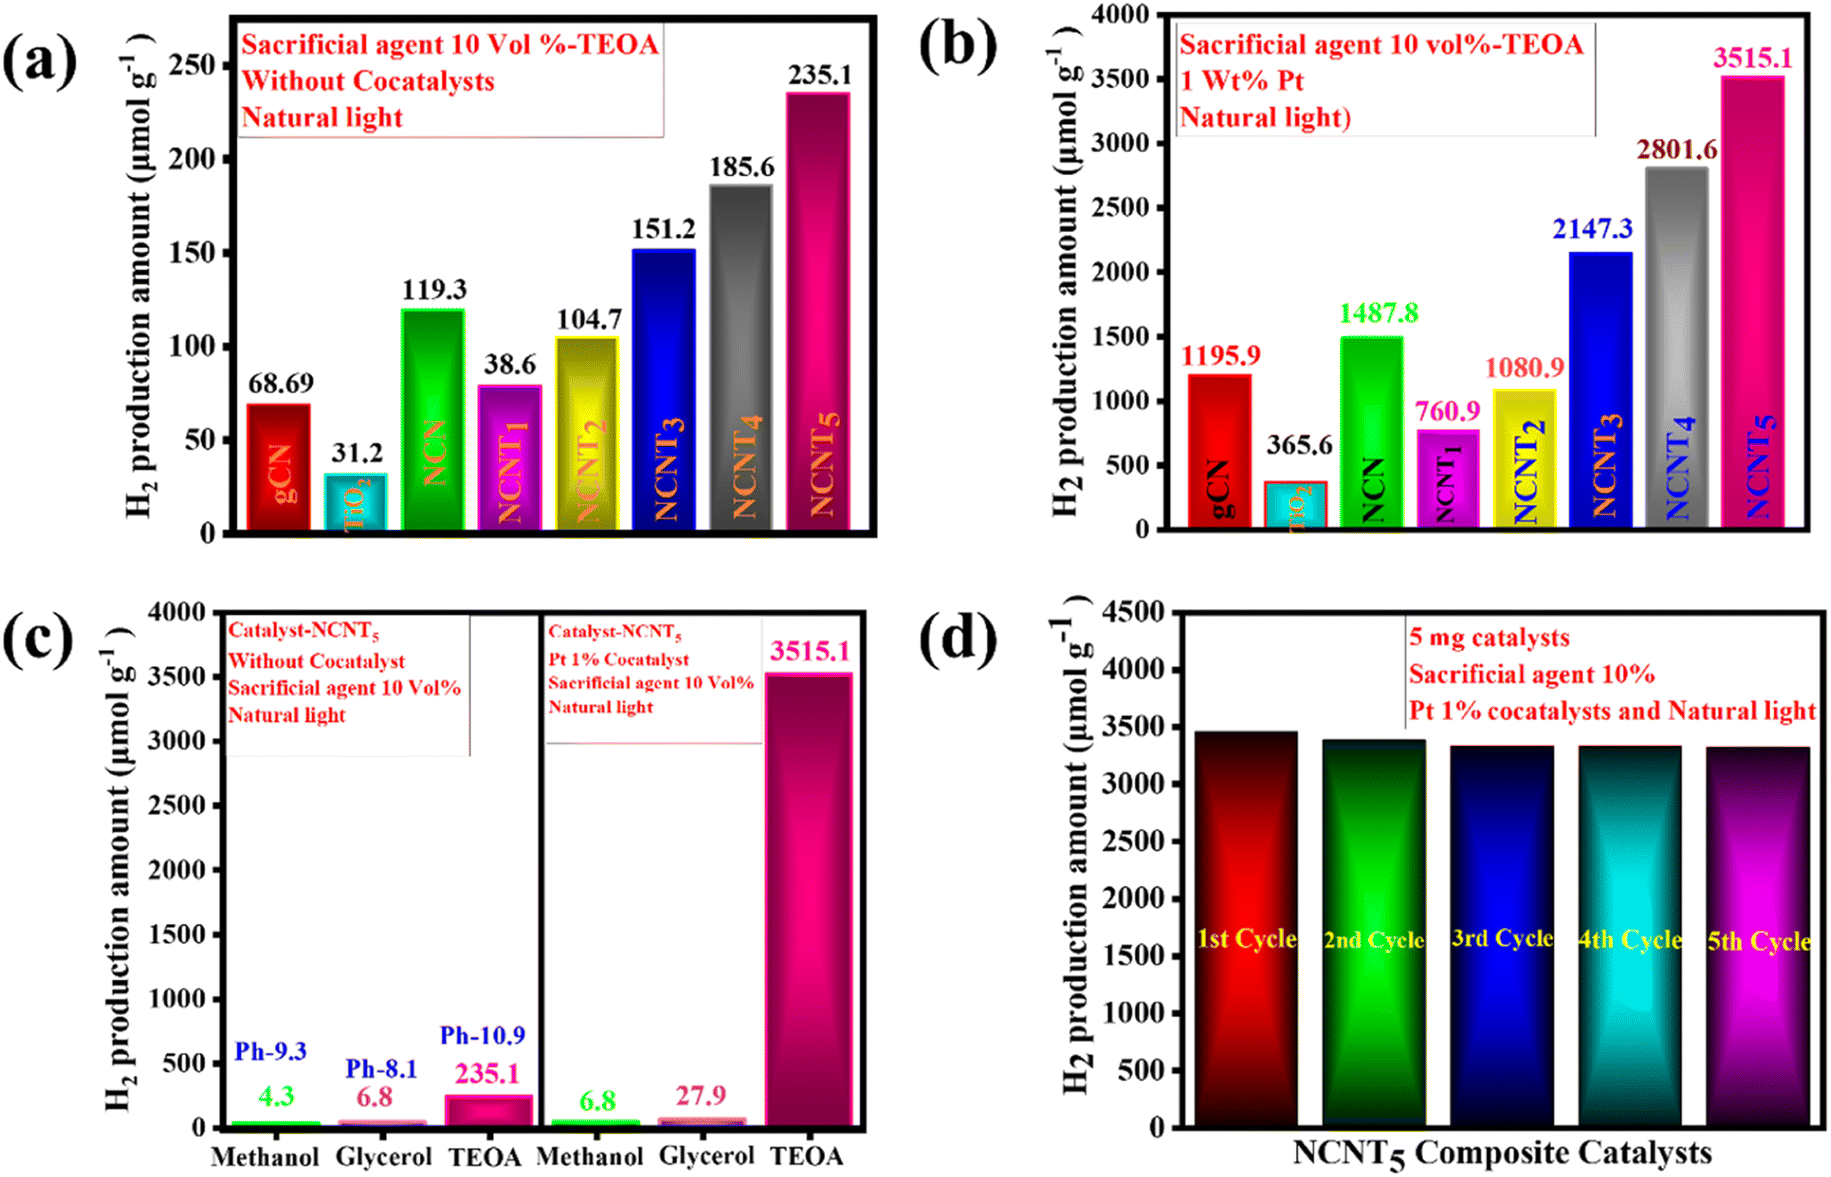
The photocatalytic activity of NCNTx composites was further validated using an H2-evolution experiment. According to the controlled experiments, neither the absence of a photocatalyst nor the non-appearance of light irradiation produced measurable H2. Photocatalytic H2 production and the consistency of the prepared photocatalysts were tested for triethanolamine 10% as the sacrificial electron donor under sunlight. Fig. 7a displays the hydrogen production amount and maximum H2 production rate of the g-CN samples. The TiO2 sample had a lower H2-evolution rate of (31.2 μmol g−1), which could be the reason for the small surface area and fewer active photocatalytic sites. Close examination of the effects of g-CN precursors and their bonding with the NCNTx revealed that the order of H2 evolution under solar light was g-CN (68.69 μmol g−1), NCN (119.3 μmol g−1), NCNT1 (38.6 μmol g−1), NCNT2 (104.7 μmol g−1), NCNT3 (151.2 μmol g−1), NCNT4 (185.6 μmol g−1), NCNT5 (235.1 μmol g−1) Fig. 4a.
 |
| | Fig. 7 H2 generation activity in the photocatalysts. Exposure of sunlight to 5 mg catalyst, TEOA 10 vol% (a), exposure of sunlight to 5 mg catalyst, Pt (1 wt%) cocatalyst, TEOA 10 vol% (b), exposure of sunlight with the 10 vol% sacrificial agents, with and without cocatalyst, and 5 mg catalyst (c), and the re-usability of the NCNT5 catalyst after exposure, 5 mg catalyst, Pt (1 wt%) cocatalyst, TEOA 10 vol% (d). | |
With cocatalysts, the amount of hydrogen production was similarly determined under natural sunlight. The Pt 1 wt% cocatalyst was used with 10% triethanolamine to improve the photocatalyst activity, and the activity of NCNTx towards H2 production was investigated. Compared to g-CN, NCN, TiO2, and NCNTx without a cocatalyst, the photocatalytic hydrogen evolution rate improved with a cocatalyst. The bare TiO2 had a poor photocatalytic H2 production rate of (365.6 μmol g−1), possibly because of the rapid recombination of electron–hole pairs. After 3 hours of reaction, the amount of hydrogen produced by these bare g-CN catalysts was close to 1195.9 μmol g−1. Fig. 7b demonstrates a significant shift in photocatalyst effectiveness to H2 evolution in the order of NCN (1487.8 μmol g−1), NCNT1 (760.9 μmol g−1), NCNT2 (1080.9 μmol g−1), NCNT3 (2147.3 μmol g−1), NCNT4 (2801.6 μmol g−1), and NCNT5 (3515.1 μmol g−1). Related to the new photocatalysts, g-CN, NCN, TiO2, and NCNTx, with 1% Pt as a cocatalyst, produced significantly more hydrogen. The increased output could be attributed to the short band gap, more excellent sunlight absorption, and charge carrier division caused by the suitable band orientation of g-CN, NCN, TiO2, and NCNTx.
Fig. 7c depicts several sacrificial agents, such as methanol, glycerol, and triethanolamine, resulting from the photocatalytic H2 production of the NCNT5 composite. TEOA (235.1 μmol g−1), methanol (4.3 μmol g−1), and glycerol (6.8 μmol g−1) had the highest H2 production rates for the NCNT5 composite without cocatalysts. Hydrogen production rates for Pt 1% cocatalysts with NCNT5 composite were as follows: TEOA (3515.1 μmol g−1), glycerol (27.9 μmol g−1), methanol (6.8 μmol g−1). Furthermore, as shown in Fig. 7c, a system's primary pH significantly impacts photocatalytic activity. The rate of hydrogen evolution was most significant at pH = 10.9 (235.1 μmol g−1) and was insignificant in acidic pH. In an acidic environment, triethanolamine is protonated, preventing the loss of H+ from TEOA+. In a virtual environment, H2 formation from water is suppressed due to an increase in repulsive force and a decrease in the ability of TEOA to be adsorbed on the photocatalyst surface.74
Fig. 7d displays the amount of H2-evolution for the NCNT5 composite over five cycles. After each test, a sacrificial agent, triethanolamine, was filled, and the entire hydrogen production activity was re-evaluated. The quantity of H2 produced was reserved for up to five cycles, and the cycling experiment demonstrated stability. As a result, the NCNT5 composite could be a promising material for improving photocatalysis efficiency.
The maximum H2 production activity completed on a photocatalyst with a cocatalyst created on NCNT5 is shown in Table 4. The improved photocatalytic activity of NCNT5 can be attributed to forming an active, S-scheme heterojunction between NCN and TiO2 and the bond of high electron mobility (Pt) to the TiO2 surface. Furthermore, as a control experiment, photocatalytic H2 production activity was carried out using various sacrificial agents such as methanol, glycerol, and TEOA. The rates of H2 production completed with methanol, glycerol, and triethanolamine were 6.8, 27.9, and 3515.1 μmol g−1 for 3 hours, respectively.
Table 4 The similarity of the photocatalytic activity in H2 production from g-C3N5 and the TiO2-based photocatalyst
| Composite photocatalysts |
Cocatalyst |
Sacrificial agent |
Light source |
H2 production (μmol g−1) |
Year |
Ref. |
| g-C3N5 |
— |
Triethanolamine |
300 W Xe lamp |
28.97 |
2020 |
75
|
| g-C3N5/poly(triazine imide) |
Pt |
Triethanolamine |
Natural light |
2326.8 |
2022 |
76
|
| g-C3N4/TiO2 |
Pt |
Triethanolamine |
300 W Xe |
329 |
2016 |
77
|
| S-doped g-C3N4 |
— |
Triethanolamine |
450 W Xe |
986 |
2017 |
78
|
| C3N5/CdS |
— |
Na2S and Na2SO3 |
300 W Xe |
7860 |
2023 |
79
|
| LaCoO3/C3N5 |
— |
Methanol |
300 W Xe |
956.11 |
2022 |
80
|
| P-doped C3N5 |
Pt |
Triethanolamine |
300 W Xe |
318 |
2020 |
81
|
| S-doped C3N5 |
Pt |
Triethanolamine |
450 W Xe |
486 |
2023 |
82
|
| N doped g-C3N5/TiO2 |
Pt |
Triethanolamine |
Natural light |
3515.1 |
2022 |
This work |
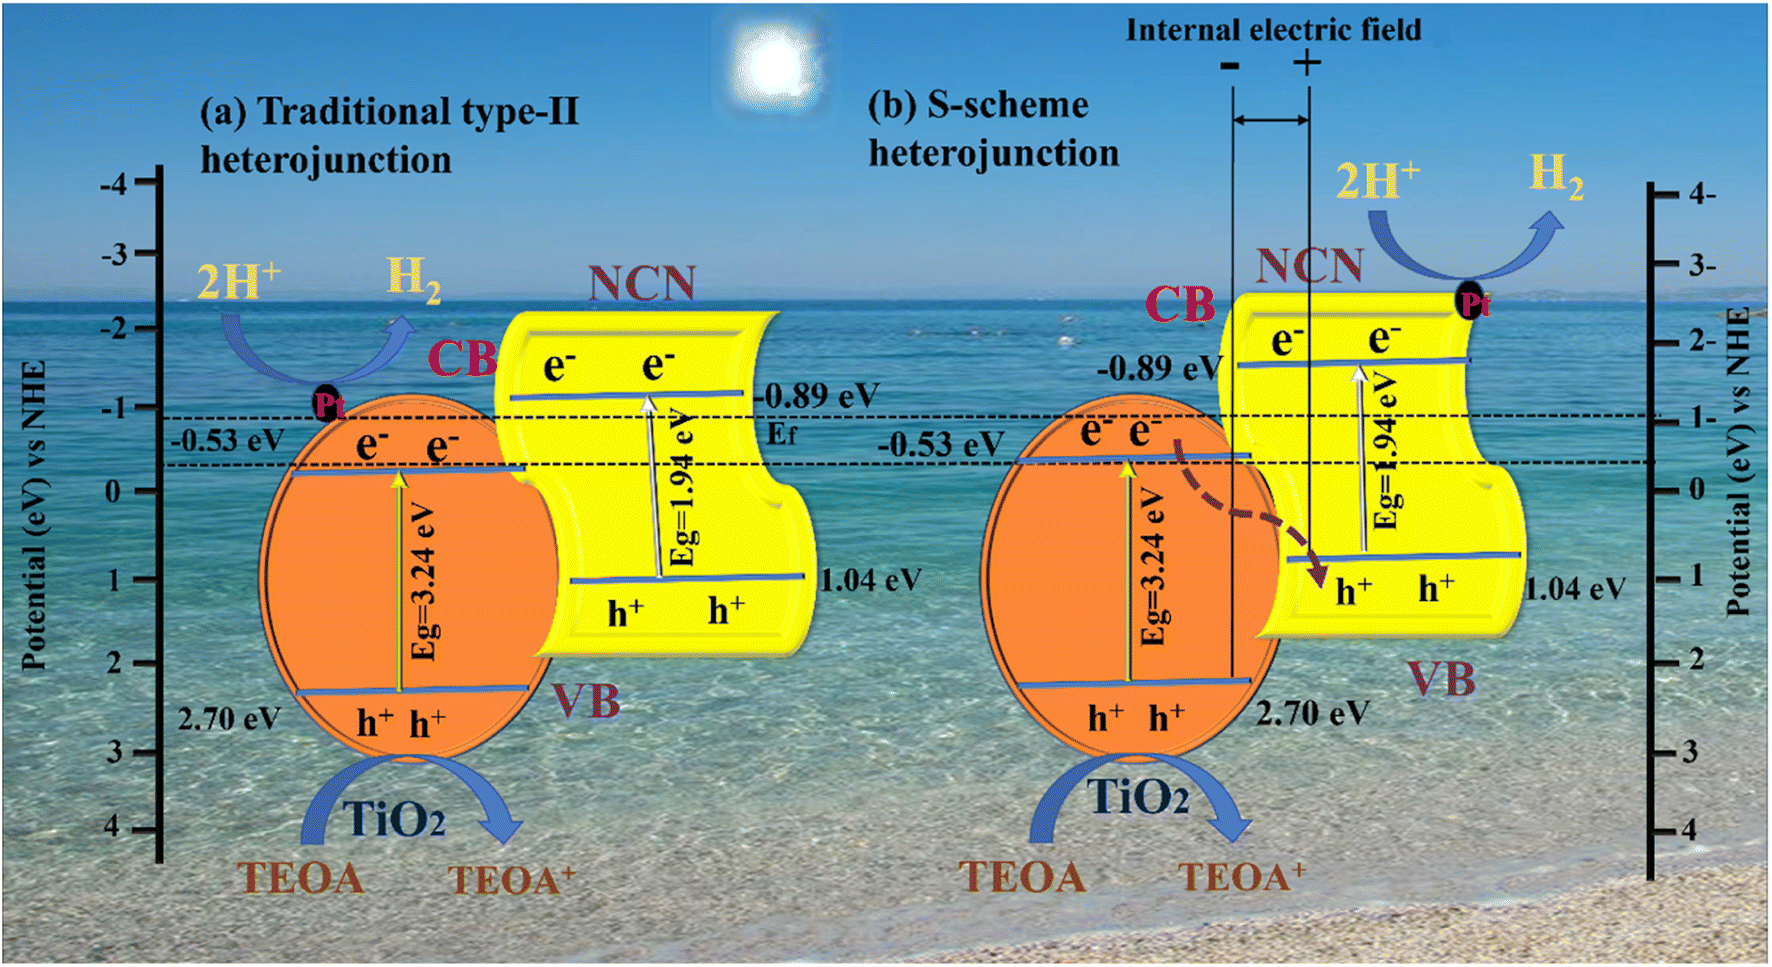
3.7. Possible photocatalytic reaction mechanism on the NCNTx S-scheme heterojunction
Based on the analysis above, it was proposed that a photocatalytic mechanism may enhance catalytic capacity. A traditional type-II heterojunction mechanism was first assumed for the composite (Fig. 8 a). TiO2 and NCN photo-induced electrons (e−) migrate from the VB to CB under the influence of visible light, leaving holes in the VB (h+). A more negative CB of NCN (−0.89 eV) than TiO2 (−0.53 eV) caused (e−) in the CB of NCN to migrate to TiO2; the TiO2 had a more positive VB (2.70 eV) than NCN (1.04 eV), and (h+) in the VB of TiO2 migrated to the VB of NCN.83,84 A more practical S-scheme heterojunction was proposed in Fig. 8b in response to the earlier analysis and report based on the XPS and EPR characteristics.85 NCN operates as a reduction semiconductor with a greater Fermi level in the NCN/TiO2 S-scheme heterojunction,86 whereas TiO2 acts as an oxidized semiconductor with lower Fermi levels.87 As well as determining Fermi levels (Ef), we obtained band structures of samples using Mott–Schottky plots. A shift from −0.53 to −0.89 V was observed after NCN/TiO2 treatment, as shown in Fig. 8b. Water reduction potential and Ef levels are represented by the flat band potential.88 A heterojunction formed between TiO2 and NCN initiated spontaneous electron transport to TiO2 before the equilibrium of the Fermi level. According to the XPS analysis, an internal electric field (IEF) formed at the interface between TiO2 and NCN. TiO2 and NCN semiconductors react when visible light irradiates their internal electric fields, in which the electrons in the CB of TiO2 migrate to the VB of NCN, becoming more effective electrons while retaining more CB holes from NCN and holes VB from TiO2 (eqn (1)). With the assistance of Pt (eqn (2)), the electrons in the CB of NCN combined with (H+) to produce H2. The oxidation reaction was carried out by the holes that accumulated in TiO2 (eqn (3)). As a result of electron separation, the CB donates its electrons to an electron acceptor such as H+ (eqn (4)). H2 is formed as a result of this donation. The surface adsorbed (Pt2+) was subsequently reduced by electrons deposited in the CB of TiO2, and the newly designed Pt was deposited on the TiO2 surface as an efficient cocatalyst for Hydrogen evolution.89,90 This composite enhances photocatalytic activity by suppressing the recombination of photogenerated electron–hole pairs, and broadening the light absorption range. In addition, it can increase the efficiency of electron–hole separation. As a result, the photocatalytic activity of the N-doped g-C3N5/TiO2 composite with Pt as cocatalysts is significantly improved.| | | NCN/TiO2 + hv → h+ + e− | (1) |
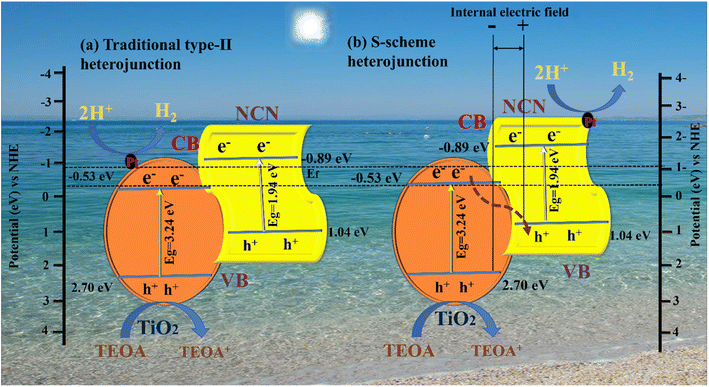 |
| | Fig. 8 Proposed charge separation and transfer mechanisms of the NCNTx photocatalyst: (a) traditional type-II heterojunction, (b) S-scheme heterojunction. | |
3.8. DFT calculations
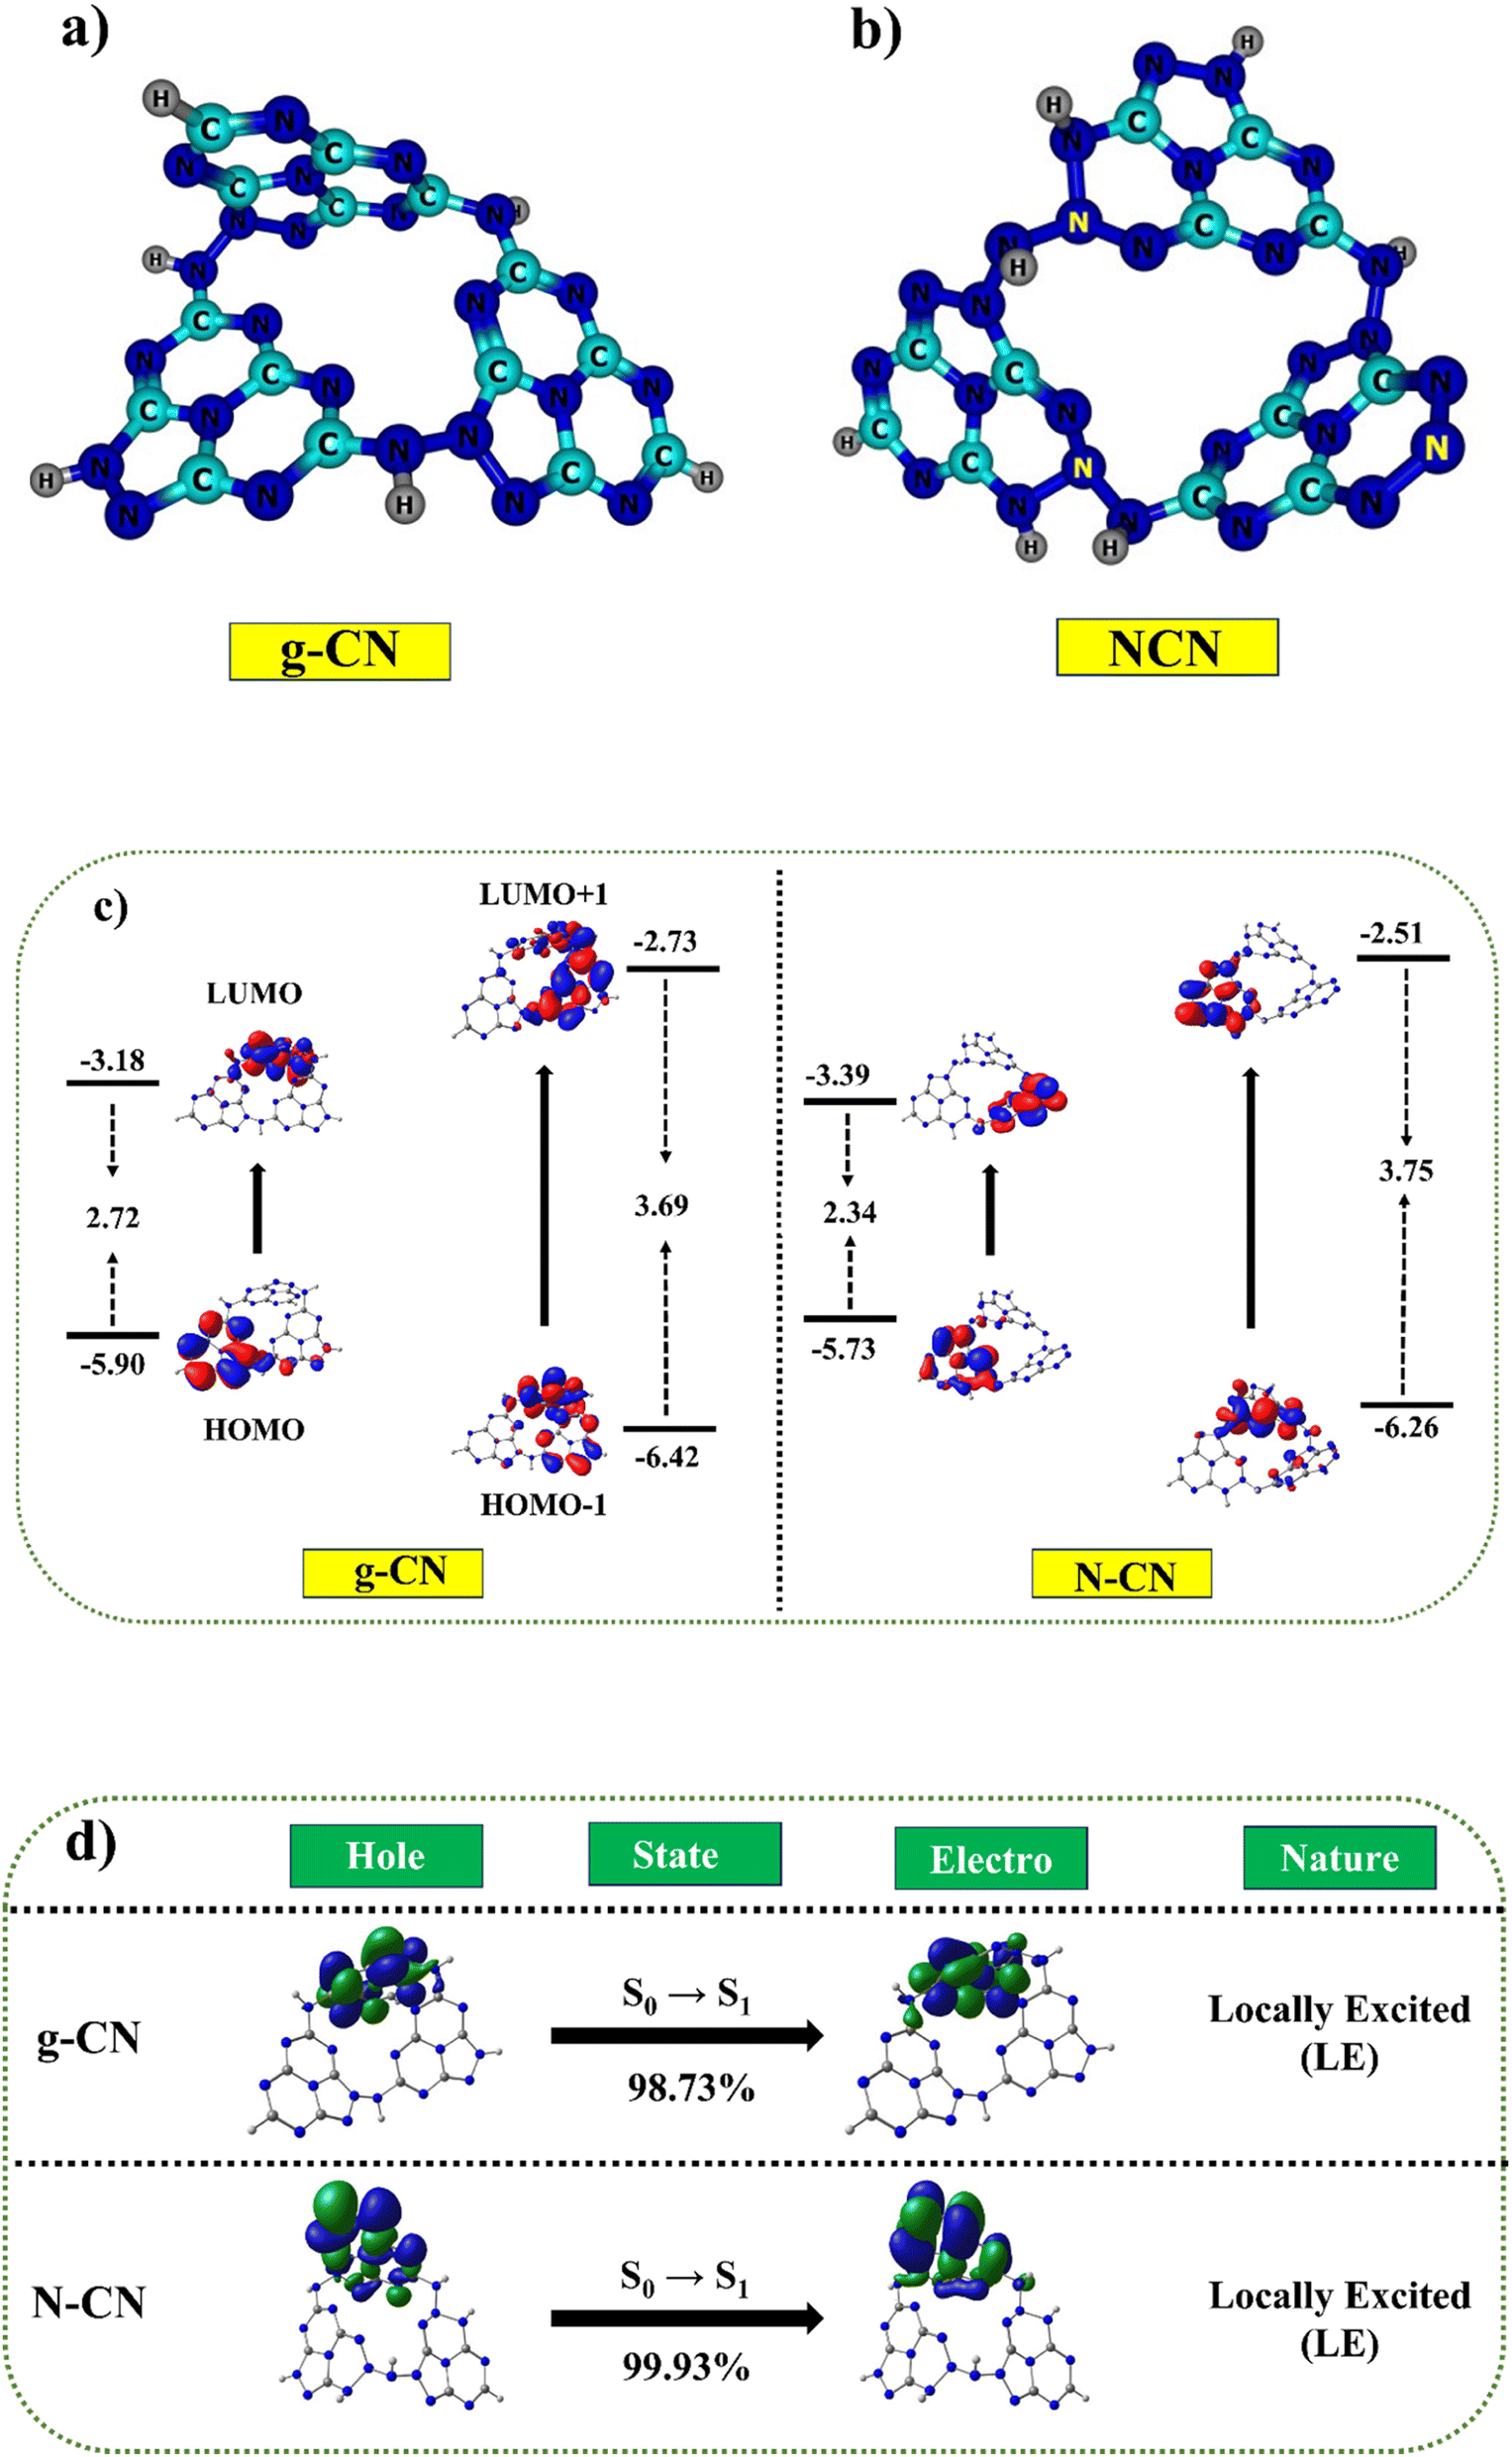
Two possible doping locations were evaluated in the g-CN structure (named C1 and C2). According to earlier research and DFT calculations, the construction energy of a substitutional nitrogen atom in the C1 position was significantly less than in the C2 site.22,36 In this study, however, the construction energy of a substitutional N atom in the C2 position was considerably less than in the C1 area. As a result of its lower construction energy, C2 is more actively supportive of N atom doping. Fig. 9a and b depicts the optimized geometric structure (shown by the yellow ball). Hence, it was concluded that some of the C sites in g-C3N5 must have had N species replacing the C atoms to produce N–NN bonds.91
 |
| | Fig. 9 The probable existing forms of g-C3N5 and N-doped g-C3N5 (a and b). Correlation diagram for the frontier orbitals (FMOs in eV) of g-CN and NCN trimers (iso-surface value = 0.02 au) (c). Hole-particle NTOs (iso-surface value = 0.02 au.) of g-CN and NCN molecules with excited state transition character (d). | |
Table S3,† the calculated HOMO–LUMO values for g-CN were −5.90 eV (HOMO) and −3.18 eV (LUMO). The inclusion of nitrogen in NCN as compared to g-CN leads to a linear destabilization of the HOMO value (−5.73 eV) and stabilization of the LUMO value (−3.34 eV), resulting in a reduced band gap of 2.34 eV as compared to the g-CN molecule (2.72 eV) Fig. 9c. These analyses revealed that the calculated results demonstrated consistent trends with the experimental values. Furthermore, we employed a combination of hybrid B3LYP, PBE0, and meta-hybrid M06 and M06-2X functionals to simulate the absorption studies with the 6-31+G* basis set.92–94 The table revealed a clear linear correlation between the absorption values and the Hartree–Fock values within the functional. The absorption range for both molecules, determined using the M06-2X functional, closely matched the experimentally measured absorption values, falling within the range of 390 nm to 394 nm, while the experimental values ranged from 365 nm to 375 nm (Fig. 9d). A broad absorption band was observed for g-C3N5 and nitrogen-doped g-C3N5, with absorption edges at 461 and 484 nm (Table S4†), consistent with DFT calculations. The natural transition orbital (NTO) maps further validated the presence of a similar absorption range in both the g-CN and NCN molecules.95 The NTOs for both the holes and electrons were predominantly localized within the sole monomer units, indicating locally excited characteristics. The calculated energies exhibited a remarkable agreement with the experimentally measured values, highlighting the noteworthy correspondence achieved for the ground and excited state energies using the O3LYP and M06-2X functionals, respectively.
4. Conclusion
We have reported a new photocatalyst using the N-doped g-C3N5/TiO2 composite as an effective photocatalyst for visible-light-assisted photocatalytic hydrogen production. The XRD and XPS results have demonstrated fruitful nitrogen doping on the C2 site of g-C3N5. The DFT calculations, PL, and XPS results show that the nitrogen doping occurred on the C2 site of g-C3N5; as indicated by the fluctuation in charge density, constant PEC, and PL spectra, NCNTx exhibits excellent photo-generated carrier separation and charge transfer, enhancing photocatalytic activity. Photocurrent and EIS analysis predicted the S-scheme heterojunction mechanism to explain the electron process flow in composites, especially in the presence of light. The efficacy of H2 production on the nitrogen-doped g-C3N5/TiO2 for 3 hours (3515.1 μmol g−1) without a co-catalyst is about three times that of N-doped g-C3N5. The efficacy of the nitrogen-doped g-C3N5/TiO2 catalyst with Pt as the cocatalyst significantly showed a ten-fold increase in performance as compared to the N-doped g-C3N5/TiO2 without cocatalyst. This work highlights the photocatalytic reaction of the N-doped g-C3N5/TiO2 composite with Pt as a cocatalyst. It demonstrates a promising strategy for the efficient production of hydrogen through the S-scheme mechanism.
Conflicts of interest
The authors declare that they have no known competing financial interests or personal relationships that could have appeared to influence the work reported in this paper.
Acknowledgements
K. Saravanan acknowledges financial support from the University Research Fellowship (URF) SRM Institute of Science and Technology, Tamil Nadu 603 203, India. The authors gratefully acknowledge the XRD, HR-TEM facilities at SRMIST set up with support from MNRE (project no. 31/03/2014-15/PVSE-R&D), Government of India. We acknowledge NRC, SRM Institute of Science and Technology, for providing the FE-SEM facility. The authors acknowledge SRM Institute of Science and Technology for providing the UV-visible DRS facility. Finally, the authors are grateful for the SRM Research Institute of Science and Technology facilities.
References
- Y. Li, S. Zhu, Y. Liang, Z. Li, S. Wu, C. Chang, S. Luo and Z. Cui, Mater. Des., 2020, 196, 109191 CrossRef CAS.
- X. Zhai, P. Zhang, C. Liu, T. Bai, W. Li, L. Dai and W. Liu, Chem. Commun., 2012, 48, 7955–7957 RSC.
- Y. Wang, X. Liu, C. Zheng, Y. Li, S. Jia, Z. Li and Y. Zhao, Adv. Sci., 2018, 5, 1700844 CrossRef PubMed.
- H. Li, C. Jin, Z. Wang, Y. Liu, P. Wang, Z. Zheng, M. H. Whangbo, L. Kou, Y. Li, Y. Dai and B. Huang, Chem. Eng. J., 2019, 369, 263–271 CrossRef CAS.
- H. Li, C. Jin, Z. Wang, Y. Liu, P. Wang, Z. Zheng, M. H. Whangbo, L. Kou, Y. Li, Y. Dai and B. Huang, Chem. Eng. J., 2019, 369, 263–271 CrossRef CAS.
- Q. Dong, Y. Fang, Y. Shao, P. Mulligan, J. Qiu, L. Cao and J. Huang, Science, 2015, 347, 967–970 CrossRef CAS PubMed.
- S. Otsuka-Yao-Matsuo, T. Omata and M. Yoshimura, J. Alloys Compd., 2004, 376, 262–267 CrossRef CAS.
- L. Liang, L. Shi, F. Wang, H. Wang and W. Qi, Sustainable Energy Fuels, 2020, 4, 5179–5187 RSC.
- X. She, L. Liu, H. Ji, Z. Mo, Y. Li, L. Huang, D. Du, H. Xu and H. Li, Appl. Catal., B, 2016, 187, 144–153 CrossRef CAS.
- J. Xu and M. Antonietti, J. Am. Chem. Soc., 2017, 139, 6026–6029 CrossRef CAS PubMed.
- X. Bai, L. Wang, R. Zong and Y. Zhu, J. Phys. Chem. C, 2013, 117, 9952–9961 CrossRef CAS.
- W. J. Jo, J. W. Jang, K. J. Kong, H. J. Kang, J. Y. Kim, H. Jun, K. P. S. Parmar and J. S. Lee, Angew. Chem., Int. Ed., 2012, 51, 3147–3151 CrossRef CAS PubMed.
- Y. Liu, S. Wu, J. Liu, S. Xie and Y. Liu, RSC Adv., 2021, 11, 4810–4817 RSC.
- H. Zhang, F. Liu, H. Wu, X. Cao, J. Sun and W. Lei, RSC Adv., 2017, 7, 40327–40333 RSC.
- N. Tian, Y. Zhang, X. Li, K. Xiao, X. Du, F. Dong, G. I. N. Waterhouse, T. Zhang and H. Huang, Nano Energy, 2017, 38, 72–81 CrossRef CAS.
- F. Ling, W. Li and L. Ye, Appl. Surf. Sci., 2019, 473, 386–392 CrossRef CAS.
- C. Hu, M. S. Wang, C. H. Chen, Y. R. Chen, P. H. Huang and K. L. Tung, J. Membr. Sci., 2019, 580, 1–11 CrossRef CAS.
- L. Liang, L. Shi, F. Wang, H. Wang, P. Yan, Y. Cong, L. Yao, Z. Yang and W. Qi, Appl. Catal., A, 2020, 599, 117618 CrossRef CAS.
- L. T. Huynh, S. B. Eger, J. D. S. Walker, J. R. Hayes, M. W. Gaultois and A. P. Grosvenor, Solid State Sci., 2012, 14, 761–767 CrossRef CAS.
- D. H. Park, K. S. Lakhi, K. Ramadass, M. K. Kim, S. N. Talapaneni, S. Joseph, U. Ravon, K. Al-Bahily and A. Vinu, Chem.–Eur. J., 2017, 23, 10753–10757 CrossRef CAS PubMed.
- F. He, Z. Wang, Y. Li, S. Peng and B. Liu, Appl. Catal., B, 2020, 269, 118828 CrossRef CAS.
- G. P. Mane, S. N. Talapaneni, K. S. Lakhi, H. Ilbeygi, U. Ravon, K. Al-Bahily, T. Mori, D. Park and A. Vinu, Angew. Chem., 2017, 129, 8601–8605 CrossRef.
- W. Wang, M. Chen, D. Huang, G. Zeng, C. Zhang, C. Lai, C. Zhou, Y. Yang, M. Cheng, L. Hu, W. Xiong, Z. Li and Z. Wang, Composites, Part B, 2019, 172, 704–723 CrossRef CAS.
- Y. Zhou, L. Zhang, W. Huang, Q. Kong, X. Fan, M. Wang and J. Shi, Carbon, 2016, 99, 111–117 CrossRef CAS.
- B. Luo, R. Song, J. Geng, D. Jing and Y. Zhang, Appl. Catal., B, 2018, 238, 294–301 CrossRef CAS.
- C. Jia, L. Yang, Y. Zhang, X. Zhang, K. Xiao, J. Xu and J. Liu, ACS Appl. Mater. Interfaces, 2020, 12, 53571–53591 CrossRef CAS PubMed.
- T. Liu, W. Chen, Y. Hua and X. Liu, Appl. Surf. Sci., 2017, 392, 616–623 CrossRef CAS.
- C. Hu, Y. R. Lin and H. C. Yang, ChemSusChem, 2019, 12, 1794–1806 CrossRef CAS PubMed.
- C. Zhao, Q. Li, Y. Xie, L. Zhang, X. Xiao, D. Wang, Y. Jiao, C. A. Hurd Price, B. Jiang and J. Liu, J. Mater. Chem. A, 2020, 8, 305–312 RSC.
- A. Thomas, A. Fischer, F. Goettmann, M. Antonietti, J. O. Müller, R. Schlögl and J. M. Carlsson, J. Mater. Chem., 2008, 18, 4893–4908 RSC.
- J. Ran, T. Y. Ma, G. Gao, X. W. Du and S. Z. Qiao, Energy Environ. Sci., 2015, 8, 3708–3717 RSC.
- Z. F. Huang, J. Song, L. Pan, Z. Wang, X. Zhang, J. J. Zou, W. Mi, X. Zhang and L. Wang, Nano Energy, 2015, 12, 646–656 CrossRef CAS.
- M. Xiao, B. Luo, S. Wang and L. Wang, J. Energy Chem., 2018, 27, 1111–1123 CrossRef.
- L. Huang, Z. Liu, W. Chen, D. Cao and A. Zheng, J. Mater. Chem. A, 2018, 6, 7168–7174 RSC.
- Y. Zhu, Y. Feng, S. Chen, M. Ding and J. Yao, J. Mater.
Chem. A, 2020, 8, 25626–25648 RSC.
- A. Akbarzadeh, Y. Khazani, S. Khaloo and M. Ghalkhani, Research Square, 2022, 1–21 Search PubMed.
- M. Li, Q. Lu, M. Liu, P. Yin, C. Wu, H. Li, Y. Zhang and S. Yao, ACS Appl. Mater. Interfaces, 2020, 12, 38266–38274 CrossRef CAS PubMed.
- D. Zhu and Q. Zhou, Appl. Catal., B, 2021, 281, 119474 CrossRef CAS.
- S. Vadivel, S. Hariganesh, B. Paul, S. Rajendran, A. Habibi-Yangjeh, D. Maruthamani and M. Kumaravel, Chem. Phys. Lett., 2020, 738, 136862 CrossRef CAS.
- I. Y. Kim, S. Kim, X. Jin, S. Premkumar, G. Chandra, N. S. Lee, G. P. Mane, S. J. Hwang, S. Umapathy and A. Vinu, Angew. Chem., Int. Ed., 2018, 57, 17135–17140 CrossRef CAS PubMed.
- S. Hu, L. Ma, J. You, F. Li, Z. Fan, G. Lu, D. Liu and J. Gui, Appl. Surf. Sci., 2014, 311, 164–171 CrossRef CAS.
- Q. Wang, G. Zhang, W. Xing, Z. Pan, D. Zheng, S. Wang, Y. Hou and X. Wang, Angew. Chem., Int. Ed., 2023, 62, e202307930 CrossRef CAS PubMed.
- Y. Wang, R. Shi, J. Lin and Y. Zhu, Energy Environ. Sci., 2011, 4, 2922–2929 RSC.
- Q. Guo, Y. Xie, X. Wang, S. Zhang, T. Hou and S. Lv, Chem. Commun., 2004, 4, 26–27 RSC.
- S. Obregón and G. Colón, Appl. Catal., B, 2014, 144, 775–782 CrossRef.
- G. Li, G. Zeng, Z. Chen, J. Hong, X. Ji, Z. Lan, X. Tan, M. Li, X. Hu and C. Tang, Nanomaterials, 2022, 12, 2701 CrossRef CAS PubMed.
- L. Wang, M. Li, Q. Zhang, F. Li and L. Xu, Inorg. Chem. Front., 2021, 8, 3566–3575 RSC.
- F. Xu, B. Zhu, B. Cheng, J. Yu and J. Xu, Adv. Opt. Mater., 2018, 6, 1800911 CrossRef.
- F. He, G. Chen, Y. Yu, Y. Zhou, Y. Zheng and S. Hao, Chem. Commun., 2015, 51, 425–427 RSC.
- W. Zhou, L. Lin, W. Wang, L. Zhang, Q. Wu, J. Li and L. Guo, J. Phys. Chem. C, 2011, 115, 7126–7133 CrossRef CAS.
- R. Hao, G. Wang, C. Jiang, H. Tang and Q. Xu, Appl. Surf. Sci., 2017, 411, 400–410 CrossRef CAS.
- S. Yang, Y. Gong, J. Zhang, L. Zhan, L. Ma, Z. Fang, R. Vajtai, X. Wang and P. M. Ajayan, Adv. Mater., 2013, 25, 2452–2456 CrossRef CAS PubMed.
- D. Zhu and Q. Zhou, Appl. Catal., B, 2021, 281, 1194 Search PubMed.
- W. Ding, Z. Wei, S. Chen, X. Qi, T. Yang, J. Hu, D. Wang, L. J. Wan, S. F. Alvi and L. Li, Angew. Chem., Int. Ed., 2013, 52, 11755–11759 CrossRef CAS PubMed.
- Y. Zhou, L. Zhang, W. Huang, Q. Kong, X. Fan, M. Wang and J. Shi, Carbon, 2016, 99, 111–117 CrossRef CAS.
- Y. Wang, X. Cui, Y. Li, L. Chen, H. Chen, L. Zhang and J. Shi, Carbon, 2014, 68, 232–239 CrossRef CAS.
- J. Li, L. Zhao, S. Wang, J. Li, G. Wang and J. Wang, Appl. Surf. Sci., 2020, 515, 145922 CrossRef CAS.
- T. Liu, G. Yang, W. Wang, C. Wang, M. Wang, X. Sun, P. Xu and J. Zhang, Environ. Res., 2020, 188, 109741 CrossRef CAS PubMed.
- X. Shi, M. Fujitsuka, Z. Lou, P. Zhang and T. Majima, J. Mater. Chem. A, 2017, 5, 9671–9681 RSC.
- P. Kumar, E. Vahidzadeh, U. K. Thakur, P. Kar, K. M. Alam, A. Goswami, N. Mahdi, K. Cui, G. M. Bernard, V. K. Michaelis and K. Shankar, J. Am. Chem. Soc., 2019, 141, 5415–5436 CrossRef CAS PubMed.
- Y. Gong, H. Li, C. Jiao, Q. Xu, X. Xu, X. Zhang, Y. Liu, Z. Dai, X. Y. Liu, W. Chen, L. Liu and D. Zhan, Appl. Catal., B, 2019, 250, 63–70 CrossRef CAS.
- H. Wang, M. Li, Q. Lu, Y. Cen, Y. Zhang and S. Yao, ACS Sustain. Chem. Eng., 2019, 7, 625–631 CrossRef CAS.
- S. Vadivel, S. Hariganesh, B. Paul, G. Mamba and P. Puviarasu, Colloids Surf., A, 2020, 592, 124583 CrossRef CAS.
- A. B. Djurišić, Y. He and A. M. C. Ng, APL Mater., 2020, 8, 030903 CrossRef.
- Y. Chen, C. Liu, S. Guo, T. Mu, L. Wei and Y. Lu, Green Energy Environ., 2022, 7, 394–410 CrossRef CAS.
- R. Tao, X. Li, X. Li, C. Shao and Y. Liu, Nanoscale, 2020, 12, 8320–8329 RSC.
- J. Li, M. Li, H. Li and Z. Jin, J. Mater. Chem. C, 2022, 10, 2181–2193 RSC.
- C. Lv, X. Lan, F. Li, L. Wang, L. Xiao, C. Wang, J. Shi and S. Yu, Catal. Sci. Technol., 2020, 10, 690–699 RSC.
- F. Amano, M. Nakata, A. Yamamoto and T. Tanaka, Catal. Sci. Technol., 2016, 6, 5693–5699 RSC.
- V. D. Dang, J. Adorna, T. Annadurai, T. A. N. Bui, H. L. Tran, L. Y. Lin and R. A. Doong, Chem. Eng. J., 2021, 422, 130103 CrossRef CAS.
- A. Babu Ganganboina, M. Dung Nguyen, T. Hien Luong Nguyen, E. Prasetyo Kuncoro and R. A. Doong, Chem. Eng. J., 2021, 425, 131520 CrossRef CAS.
- X. Zhang, L. Shi and Y. Zhang, J. Taiwan Inst. Chem. Eng., 2022, 132, 104111 CrossRef CAS.
- H. Zhao, H. Yu, X. Quan, S. Chen, H. Zhao and H. Wang, RSC Adv., 2014, 4, 624–628 RSC.
- A. Rajan and B. Neppolian, Appl. Mater. Today, 2022, 28, 101524 CrossRef.
- T. Liu, G. Yang, W. Wang, C. Wang, M. Wang, X. Sun, P. Xu and J. Zhang, Environ. Res., 2020, 188, 109741 CrossRef CAS PubMed.
- J. Zhang, H. Tao, S. Wu, J. Yang and M. Zhu, Appl. Catal., B, 2021, 296, 120372 CrossRef CAS.
- J. Ma, X. Tan, T. Yu and X. Li, Int. J. Hydrogen Energy, 2016, 41, 3877–3887 CrossRef CAS.
- J. S. Kim, J. W. Oh and S. I. Woo, Int. J. Hydrogen Energy, 2017, 42, 5485–5495 CrossRef CAS.
- X. Wang, K. Wu, W. Cao, K. Rui, W. Wang, R. Zhu, J. Zhu and Z. Yan, Adv. Mater. Interfaces, 2023, 10, 2201627 CrossRef CAS.
- R. Wang, K. Zhang, X. Zhong and F. Jiang, RSC Adv., 2022, 12, 24026–24036 RSC.
- Q. Lin, Z. Li, T. Lin, B. Li, X. Liao, H. Yu and C. Yu, Chin. J. Chem. Eng., 2020, 28, 2677–2688 CrossRef CAS.
- X. Guan, M. Fawaz, R. Sarkar, C. H. Lin, Z. Li, Z. Lei, P. D. Nithinraj, P. Kumar, X. Zhang, J. H. Yang, L. Hu, T. Wu, S. Chakraborty, J. Yi and A. Vinu, J. Mater. Chem. A, 2023, 11, 12837–12845 RSC.
- S. Li, M. Cai, Y. Liu, J. Zhang, C. Wang, S. Zang, Y. Li, P. Zhang and X. Li, Inorg. Chem. Front., 2022, 9, 2479–2497 RSC.
- J. Bai, R. Shen, K. Zhou, Z. Jiang, P. Zhang and X. Li, Chin. J. Catal., 2022, 43, 359–369 CrossRef CAS.
- B. Li, B. Zhang, Y. Zhang, M. Zhang, W. Huang, C. Yu, J. Sun, J. Feng, S. Dong and J. Sun, Int. J. Hydrogen Energy, 2021, 46, 32413–32424 CrossRef CAS.
- J. Fu, Q. Xu, J. Low, C. Jiang and J. Yu, Appl. Catal., B, 2019, 243, 556–565 CrossRef CAS.
- Z. Wang, Y. Chen, L. Zhang, B. Cheng, J. Yu and J. Fan, J. Mater. Sci. Technol., 2020, 56, 143–150 CrossRef CAS.
- L. Wang, C. S. Tsang, W. Liu, X. Zhang, K. Zhang, E. Ha, W. M. Kwok, J. H. Park, L. Y. Suk Lee and K. Y. Wong, J. Mater. Chem. A, 2019, 7, 221–227 RSC.
- J. T. Lee, Y. J. Chen, E. C. Su and M. Y. Wey, Int. J. Hydrogen Energy, 2019, 44, 21413–21423 CrossRef CAS.
- J. Zhang, L. Wang, M. Mousavi, J. B. Ghasemi and J. Yu, Jiegou Huaxue, 2022, 41, 2206003–2206005 CAS.
- C. Hu, Y. H. Lin, M. Yoshida and S. Ashimura, ACS Appl. Mater. Interfaces, 2021, 13, 24907–24915 CrossRef CAS PubMed.
- C. Adamo and V. Barone, J. Chem. Phys., 1999, 110, 6158–6170 CrossRef CAS.
- R. Valero, R. Costa, I. d. P. R. Moreira, D. G. Truhlar and F. Illas, J. Chem. Phys., 2008, 128, 114103 CrossRef PubMed.
- J. Tirado-Rives and W. L. Jorgensen, J. Chem. Theory Comput., 2008, 4, 297–306 CrossRef CAS PubMed.
- R. L. Martin, J. Chem. Phys., 2003, 118, 4775–4777 CrossRef CAS.
Footnote |
| † Electronic supplementary information (ESI) available: XRD patterns, FT-IR spectra, TEM images, XPS survey spectrum of NCN, TiO2, and NCNT5 samples, pristine g-CN (g-C3N5), UV-vis spectra of g-C3N4, g-CN (g-C3N5), NCN (nitrogen-doped g-C3N5), and density functional theory (DFT) calculations. See DOI: https://doi.org/10.1039/d3na00597f |
|
| This journal is © The Royal Society of Chemistry 2023 |
Click here to see how this site uses Cookies. View our privacy policy here. 
 Open Access Article
 This Open Access Article is licensed under a Creative Commons Attribution-Non Commercial 3.0 Unported Licence
 *a,
Neppolian
Bernaurdshaw
b and
Ganesh
Vattikondala
c
*a,
Neppolian
Bernaurdshaw
b and
Ganesh
Vattikondala
c