
 Open Access Article
 This Open Access Article is licensed under a Creative Commons Attribution-Non Commercial 3.0 Unported Licence
Percolative proton transport in hexagonal boron nitride membranes with edge-functionalization†
Anjan
Das
,
Vikas
Yadav
,
C. V.
Krishnamurthy
* and
Manu
Jaiswal
 *
*
Department of Physics, Indian Institute of Technology Madras, Chennai 600036, India. E-mail: manu.jaiswal@iitm.ac.in; cvkm@iitm.ac.in
First published on 17th August 2023
Abstract
Two-dimensional layered materials have been used as matrices to study the structure and dynamics of trapped water and ions. Here, we demonstrate unique features of proton transport in layered hexagonal boron nitride membranes with edge-functionalization subject to hydration. The hydration-independent interlayer spacing indicates the absence of water intercalation between the h-BN sheets. An 18-fold increase in water sorption is observed upon amine functionalization of h-BN sheet edges. A 7-orders of magnitude increase in proton conductivity is observed with less than 5% water loading attributable to edge-conduction channels. The extremely low percolation threshold and non-universal critical exponents (2.90 ≤ α ≤ 4.43), are clear signatures of transport along the functionalized edges. Anomalous thickness dependence of conductivity is observed and its plausible origin is discussed.
1 Introduction
The structure and dynamics of water and ions can significantly differ in the proximity of two-dimensional (2D) materials. This has enabled various applications in water filtration and industrial lubrication besides serving as proto-typical structures that capture the physics of complex biological systems. Water's hydrogen bonding network is modified inside strongly confining networks such as graphene oxide.1 This results in unusual flow properties such as single-file diffusion2 and super-permeation.3 Furthermore, the dielectric properties of water can also be significantly different from those of bulk.4–6 In the case of ions, the sub-nanometer interlayer spaces of the layered 2D materials provide an efficient control of the rate of molecular and ionic transport,7 and the hydrated diameter of ions play an essential role in the same.8 Temperature-dependent permeation experiments have revealed the activated nature of ion transport through these 2D membranes.9 The barrier's strength is related to the energetics of dehydration of the water shell surrounding the ions since the sizes of the hydrated ions and the interlayer spaced are comparable.10 The high aspect ratio of individual sheets is unique to 2D materials. The stacking of 2D sheets creates continuous interstitial spaces, permeating the entire material and maintaining a high uniformity in size and orientation. This provides for two-dimensional connected pathways for the propagation of water and proton materials such as graphene oxide and clay materials such as vermiculite.11These previous reports have focused on the confinement of water and ions by the sub-nanometer interlayer spaces of the 2D materials. However, not all 2D materials easily allow the intercalation of water and ions. Systems such as hexagonal boron nitride (h-BN) also form lamellar membranes that regulate molecular and ionic transport. Crystalline h-BN is arranged in a graphene-like layer structure composed of sp2 hybridized strong covalent and highly polarized B–N bonds along the plane. These sheets combine to form stacks held with van der Waals interactions. While water can enter h-BN membranes, the sorption is restricted to void spaces between crystallites and the peripheral or edge regions of the sheets.12 The sub-nanometer interlayer spaces of h-BN do not expand to accommodate the water12 as they do with graphene oxide13 and in MXenes.14 Thus a limited sub-space of the material is accessible to water and ions, and the nature of pathways for conduction can be expected to be remarkably different. h-BN is unique in many ways. h-BN can be easily exfoliated in water through physicochemical functionalization, which is much more benign than the chemical exfoliation of graphene and other 2D materials. Furthermore, the chemical structure and lamellar ordering of h-BN membranes are preserved under harsh conditions or elevated temperatures.15,16
Proton permeation across 2D materials has attracted a lot of interest.17–20 The understanding of the proton transport processes through h-BN sheets is also helpful for energy applications.21 Protons can traverse through the central pores of a defect-free monolayer h-BN sheet.22 This capability arises from the distinct electronegativity values of boron (B) and nitrogen (N) in hBN. This leads to less dense electron clouds and larger pore sizes (approximately 3.0 Å2) at the center of the hexagonal rings greater than graphene.23 However, this ability diminishes rapidly with thickness, with the through-plane proton conductivity of trilayer h-BN being below the detection limit of experiments.22,24. Therefore, the mechanisms for proton transport in macroscopic h-BN membranes are different. Proton transport has been reported at the aqueous interface of h-BN crystals.25 It was found that the solid: water interface provides a preferential pathway for lateral proton transport with the optically active nearby surface defects. The poor dispersibility of h-BN in water posed a significant challenge for exfoliation and the preparation of colloidal solutions. Amine and hydroxyl functionalization of h-BN have been used to create stable dispersion.26,27 Urea-assisted exfoliation and functionalization have been used to create stable colloidal dispersions of few-layer BN in water, which was followed by the development of macroscopic lamellar membranes.12,28 Nanofluidic ion conduction channels are formed between the h-BN crystallites. Small-angle X-ray scattering studies on hydrated membranes reveal that water cannot penetrate the sub-nanometer interlayer spacings, which can be attributed to hydrophobic interactions. Transport experiments were performed by immersing h-BN membranes in aqueous environments. They reveal two ionic transport regimes based on the high or low ionic concentration. For the former case, bulk-like ionic transport was reported with conductivity that scales linearly with concentration. A plateau in conductivity was reported and attributed to surface-charge effects at sparse ionic concentrations.12 The nanochannel network in amino-functionalized h-BN membranes allows for size-based molecular separation.29
The aforementioned studies have shown the strong potential of h-BN membranes in molecular and ionic filtration applications. All these studies have been performed with h-BN interfaced with aqueous environments by allowing the membrane to contact ion-rich water reservoirs or by immersing the membranes in aqueous solvents. The conduction pathways are complex since intercalation between the h-BN sheets does not happen. To get a deeper insight on the nature of ion conduction pathways, it is pertinent to study the transport across the percolative threshold by gradually introducing small quantities of water into the system. Monte Carlo simulations and MD simulations have been performed on graphene oxide to study water adsorption and dynamics on GO surfaces.30 The percolative dynamics in GO involve the interplay of oxygen-rich functional groups decorating its basal plane, the surface water clusters that collectively determine the formation of the hydrogen bonding network, and associated Grotthuss transport.30,31 In a recent experimental study, our group revealed the percolative proton transport in GO that involved a 5–6 orders in magnitude change in conductivity when the water loading is varied from 15–25%.4 As discussed, the conduction pathways in h-BN membranes are expected to differ completely from those in GO. With this motivation, we have studied the proton transport in amine-functionalized hBN membranes subjected to variable water loading. Exceptional tunability of proton conductivity is observed and even at less than 5% water loading, a 7-orders of magnitude increase in proton conductivity is observed when compared to the dry state. Not only is the percolation threshold extremely low, but non-universal critical exponents are observed, which point to the nature of transport channels in the system.
2 Materials and methods
2.1 Synthesis and preparation of functionalized h-BN membranes
Aqueous stable colloidal dispersions of h-BN were prepared by milling h-BN powder with urea. h-BN powder (10 μm particle size) of 99.5% pure content (Sigma-Aldrich) and urea (Sigma-Aldrich) were mixed at the weight ratio 1![[thin space (1/6-em)]](https://www.rsc.org/images/entities/char_2009.gif) :20 inside a steel milling container. The total weight of 10.5 g was milled for 20 h using a planetary ball mill (Pulverisette 5, Fritsch) at a rotation speed of 300 rpm at room temperature under a nitrogen gas atmosphere. The milled powder was dispersed in water and dialyzed by dialysis membrane (Hi-media) with membrane cutoff 14 kDa for 1 week in distilled water to remove residual urea completely. Aqueous dispersions were obtained after the unexfoliated h-BN particles were removed via centrifugation at 4300 rpm for 30 min. The white translucent and stable colloidal solution containing functionalized h-BN was thus obtained. h-BN membranes were assembled by vacuum filtration of the dispersion through an anodisc membrane filter (47 mm diameter, 0.02 μm pore size, Whatman) followed by 15 minutes of ultrasonication at 40 kHz. The h-BN membrane was easily peeled off from the filter after drying in the air. Less functionalized membranes were prepared by 4 h milling with the same proportion (1:20) of h-BN and urea. Vacuum-assisted filtration of the milled powder dispersion in water was followed by 20 minutes of sonication without centrifugation.
:20 inside a steel milling container. The total weight of 10.5 g was milled for 20 h using a planetary ball mill (Pulverisette 5, Fritsch) at a rotation speed of 300 rpm at room temperature under a nitrogen gas atmosphere. The milled powder was dispersed in water and dialyzed by dialysis membrane (Hi-media) with membrane cutoff 14 kDa for 1 week in distilled water to remove residual urea completely. Aqueous dispersions were obtained after the unexfoliated h-BN particles were removed via centrifugation at 4300 rpm for 30 min. The white translucent and stable colloidal solution containing functionalized h-BN was thus obtained. h-BN membranes were assembled by vacuum filtration of the dispersion through an anodisc membrane filter (47 mm diameter, 0.02 μm pore size, Whatman) followed by 15 minutes of ultrasonication at 40 kHz. The h-BN membrane was easily peeled off from the filter after drying in the air. Less functionalized membranes were prepared by 4 h milling with the same proportion (1:20) of h-BN and urea. Vacuum-assisted filtration of the milled powder dispersion in water was followed by 20 minutes of sonication without centrifugation.
2.2 Characterization
XRD measurements were performed on a Malvern PANalytical (Aeris Instruments) X-ray diffractometer apparatus with Cu Kα radiation. Scanning electron microscopy (SEM) images were acquired using a Quanta 3D FEG scanning electron microscope. The h-BN solution was diluted and mildly sonicated in water, and the dispersion was drop cast on a Si/SiO2 substrate for imaging. TEM and HRTEM imaging was performed on a JEOL 2100F microscope operated at 200 kV. Samples were prepared by evaporating a drop of diluted aqueous suspension on a carbon-coated copper grid. The atomic force microscopy measurements were performed using non-contact mode AFM (Park Systems NX 10). The FTIR transmittance spectra were recorded using a Bruker Alpha spectrometer. XPS was performed using an X-ray Photo Spectrometer with UPS Model from Thermo Fisher Scientific UKESCALAB 250 instrument equipped with a non-monochromatic Al-Kα X-ray source. The thermal behavior was analyzed by TGA on a TA Instruments Q50 TGA thermal analyzer at a heating rate of 10 °C min−1 from room temperature to 800 °C under nitrogen gas flow. The zeta potential was measured using a Zetasizer Nano ZS90 apparatus from Malvern. Raman spectra were acquired with a Horiba HR-800-UV spectrometer using a He–Ne laser of excitation wavelength, λ = 632.8 nm. Contact angle measurements were made using a contact angle goniometer (Apex D3 model). Contact angle results are presented as an average of five measurements at different locations. Water adsorption in the h-BN membranes was quantified using IGAsorp (Hiden Isochema) dynamic vapor sorption analyzer. The sample was dried at 0% RH for 2 h at 25 °C and exposed to different RH% until it reached saturation adsorption.2.3 Conductivity measurements
h-BN membranes, having 10 μm to 400 μm thickness were sandwiched between Cr/Au electrodes (7 mm2) to prepare devices. Impedance measurements were performed with Compactstat from IVIUM technologies. A small ac bias voltage of amplitude 100 mV (zero dc bias) was applied throughout the experiment to avoid electrochemical reduction. In this geometry, the electric field was perpendicular to the h-BN layers. The impedance measurements were performed in the frequency range from 1 Hz to 500 kHz. Conductivity measurements at low RH% involved high impedance, and these were acquired using an Andeen-Hagerling 2700A capacitance bridge in the frequency interval from 55 Hz to 20 kHz.A custom-made humidity cell was used to create variable humidity environments for conductivity measurements. Relative humidity was varied from 2% to 95% upon mixing dry nitrogen gas and water vapor saturated nitrogen gas in different proportions. A capacitive humidity sensor (DHT22, RH resolution 0.1%, accuracy ± 2%) and thermistor temperature sensor (accuracy ± 0.5 °C) were used to monitor the RH% and temperature, respectively. The RH% was also verified using salt solution set-point calibrations.
3 Results and discussions
3.1 Deposition of h-BN membranes
To produce membranes with layered architecture and well-defined thickness, it is necessary to disperse h-BN in a solvent. h-BN crystallites do not form a stable colloidal dispersion due to the large particle size, small zeta potential, and hydrophobic nature, all of which favor aggregation. Amine functionalization can be achieved by long-duration ball milling of h-BN powder together with urea powder,28 and the details can be found in ESI S1.† Amine groups show a preferential tendency to bond at the flake edges rather than with the basal plane, as illustrated in Fig. 1(a). The enthalpy of reaction for bonding an amine group to the edges was estimated using density functional theory (DFT) techniques to be ΔH ≈ −5 to −7 eV.28 In contrast, the bonding to the basal plane is far less favored. The reaction enthalpy is ΔH ≈ −1 eV for amine bonded to basal-plane boron, while a slightly positive ΔH was seen for amine bonded to basal-plane nitrogen.28Fig. 1(b) compares the photographs of unstable and stable aqueous dispersions, which are realized by tuning the milling duration. Stable dispersions are characterized by large negative zeta potential32 (see ESI S2†). Besides the functionalization of edges, the milling also reduced the lateral crystallite size from several microns to 100–200 nm. The SEM image in Fig. 1(c) shows the crystallites of h-BN cast on SiO2/Si substrate after diluting the dispersion; further details are provided in ESI S3.† The height of the h-BN crystallites is measured using non-contact mode AFM by considering the smallest non-aggregated particles, and a value of 6.5 nm is obtained, as shown in Fig. 1(d). Thus several sheets of h-BN combine to form crystallites. Each crystallite of h-BN comprised ≈19 layers of h-BN stacked with van der Waals bonding, and each layer had an average lateral size of 156 nm. The HRTEM image in Fig. 1(e) shows regions where the layered material has folded over, revealing the intersheet spacing of 3.34 Å. Fig. 1(f) inset shows a macroscopic h-BN membrane of diameter 47 mm deposited on anodic aluminum oxide (AAO) filter paper using a vacuum filtration technique. The membrane has a hierarchical microstructure, as revealed by the cross-section SEM image in Fig. 1(f). The macroscopic h-BN membrane consists of stacks of flat crystallites in a lamellar configuration.29 The microstructure of this membrane resembles a slightly imperfect stacking of paper sheets, albeit on a much smaller length scale.33 | ||
| Fig. 1 (a) Schematic illustration of the chemical structure of amine-functionalized hexagonal boron nitride. (b) Photographs of the colloidal dispersion of h-BN with less functionalization (left image) and adequate functionalization (right image). (c) FESEM image of the few-layer BN sheets drop-casted on Si/SiO2 substrate with scale bar 2 μm. (d) Non-contact mode AFM image of few-layer BN nanosheets on a Si/SiO2 substrate. Inset shows the height profile along the red line indicated in the figure. (e) HRTEM images of partially-folded few-layer BN sheets with a scale bar of 5 nm. Inset shows a representative fast Fourier transform image from another region that lacks folding. (f) Cross-sectional SEM image of h-BN revealing the microstructure of the membrane. The scale bar is 1 μm. Inset shows a photograph of the macroscopic membrane assembled with vacuum filtration technique. | ||
3.2 Evidence of amine functionalization
Spectroscopic techniques provide insight into the functionalization of h-BN. XPS was performed to reveal the functionalization of h-BN.34,35 The B-1s spectrum shown in Fig. 2(a) indicates the dominant B–N bonding (190.4 eV) related to the covalent bonds in the basal plane of h-BN. A small fraction of B–O (191.5 eV) is also observed, which carries forward from the pristine h-BN. This peak is attributed to B2O3 impurities.28 The N-1s spectrum is shown in Fig. 2(b). The amine functionalization is confirmed by an N–H peak (399.6 eV).28,35 This peak is absent in the XPS spectrum of pristine h-BN (see ESI S4†). Deconvolution of the spectrum provides the fraction of N–H bonds over N–B bonds, which is found to be ≈0.08. For less-functionalized h-BN membranes synthesized with shorter milling times, the corresponding ratio is ≈0.03 (see ESI S4†). The population of amine groups at the edges and the basal plane is governed by the Boltzmann factor, e−ΔH/kBT. Since ΔH values for the edges are highly negative, most amine groups can be expected to be present at the edges with a diffuse population in the basal plane. | ||
| Fig. 2 XPS spectra of h-BN together with their deconvolution: (a) core-level B-1s. (b) Core-level N-1s. (c) FTIR spectra of pristine and functionalized h-BN. (d) Zoomed-in FTIR spectra of functionalized h-BN over a narrow wavenumber interval marked with a dashed rectangle in part-c, indicating the absorption from N–H stretching mode. | ||
The Fourier-transform Infrared Spectroscopy (FTIR) plot of pristine and functionalized h-BN is compared in Fig. 2(c). The most important peaks in both samples are B–N stretching modes corresponding to out-of-plane vibrations at 748 cm−1 and in-plane vibrations at 1334 cm−1. The important difference is the onset of N–H stretching mode at 3220 cm−1 observed in the amine-functionalized sample;28,36,37 the zoomed spectrum is shown in Fig. 2(d). The degree of functionalization was determined by thermogravimetric analysis (TGA), which suggests ≈1.3% content of NH2 groups present in the functionalized h-BN sheets (see ESI S5†).
3.3 Distribution of water in membranes
The FTIR spectra discussed above were recorded for dry membranes. We next consider the susceptibility of amine-functionalized h-BN membranes to water sorption. FTIR spectra of water loaded h-BN membranes are shown in ESI S6,† which reveals the broad –OH stretching modes and in-plane deformation modes at 3410 cm−1, both related to water.34,38,39 Contact angle measurements of pristine and amine-functionalized h-BN membranes are shown in Fig. 3(a) and (b), respectively. Pristine h-BN is hydrophobic with a contact angle of 110°, while amine functionalization results in a hydrophilic membrane with a contact angle of 10°. These results further corroborate the observations made with FTIR. FTIR and contact angle measurements indicate that the amine groups attract water molecules. | ||
| Fig. 3 Contact angle measurement on h-BN membranes: (a) pristine and (b) functionalized. (c) X-ray diffraction spectrum of functionalized h-BN membranes in the dry state (2% RH, red curve) and with water loading (90% RH, black curve). (d) Interlayer spacing of h-BN (red) and GO (blue) for low (2% RH) and high (100% RH) humidities. | ||
h-BN is a layered material with an interlayer spacing of 3.34 Å. Can the adsorbed water intercalate these interlayer spaces? In systems such as graphene oxide (GO), which have a large density of oxygen-rich functional groups in the basal plane, water intercalation is thermodynamically favored.3 The dry-state interlayer spacing is small in both systems. The interlayer spacing of functionalized h-BN was obtained from HRTEM as discussed in Fig. 1(e) above. The same interlayer spacing of 3.34 Å is obtained from X-ray diffraction for pristine and functionalized h-BN, as shown in ESI S7.† The increase in FWHM is consistent with a lower number of h-BN layers in each crystallite.40 In GO membranes, which are well-studied in literature, water intercalation progressively increases the spacing to 1 nm.4,9 To explore whether water intercalates h-BN membranes, we performed X-ray diffraction studies on these membranes prepared in different humidity environments. h-BN membranes were encapsulated with an water-impermeable epoxy binder after being stored in relative humidity ranging from 2% RH and 90% RH for long duration. The results are shown in Fig. 3(c). The interlayer spacing is obtained from the position of the (001) peak and found to be independent of the humidity. This contrasts with GO membranes behavior (for comparison, see Fig. 3(d) and ESI, Fig. S7(b)).† This reflects the inability of water to intercalate between the h-BN sheets of a crystallite. We conclude that the adsorbed water exists in the peripheral regions of h-BN sheets where hydrogen bonding with the amine groups helps stabilize the water.
3.4 Water sorption–desorption isotherms and kinetics
This paragraph discusses the extent of water sorption and the associated dynamics. Fig. 4(a) shows the kinetics of water adsorption–desorption of h-BN samples exposed to different relative humidity values. The vertical-axis is normalized with the saturation mass uptake. The samples are exposed to the high RH% value from a base value of 0% RH. Water sorption is rapid for an intermediate value of 55% RH but notably slower at 10% RH and 85% RH. The slow sorption processes at low RH% can be attributed to water trapping by defects such as edge-amine groups. Once these trap sites have been filled, subsequent sorption is comparatively faster for the relatively mobile water.4 The sorption rate decreases again at very high RH%, which may indicate slower diffusion of water when it likely forms small clusters. On the other hand, water desorption follows a monotonic dependence on RH%, with rapid desorption for 85% RH. The relatively slow dynamics of desorption is related to the detrapping process.41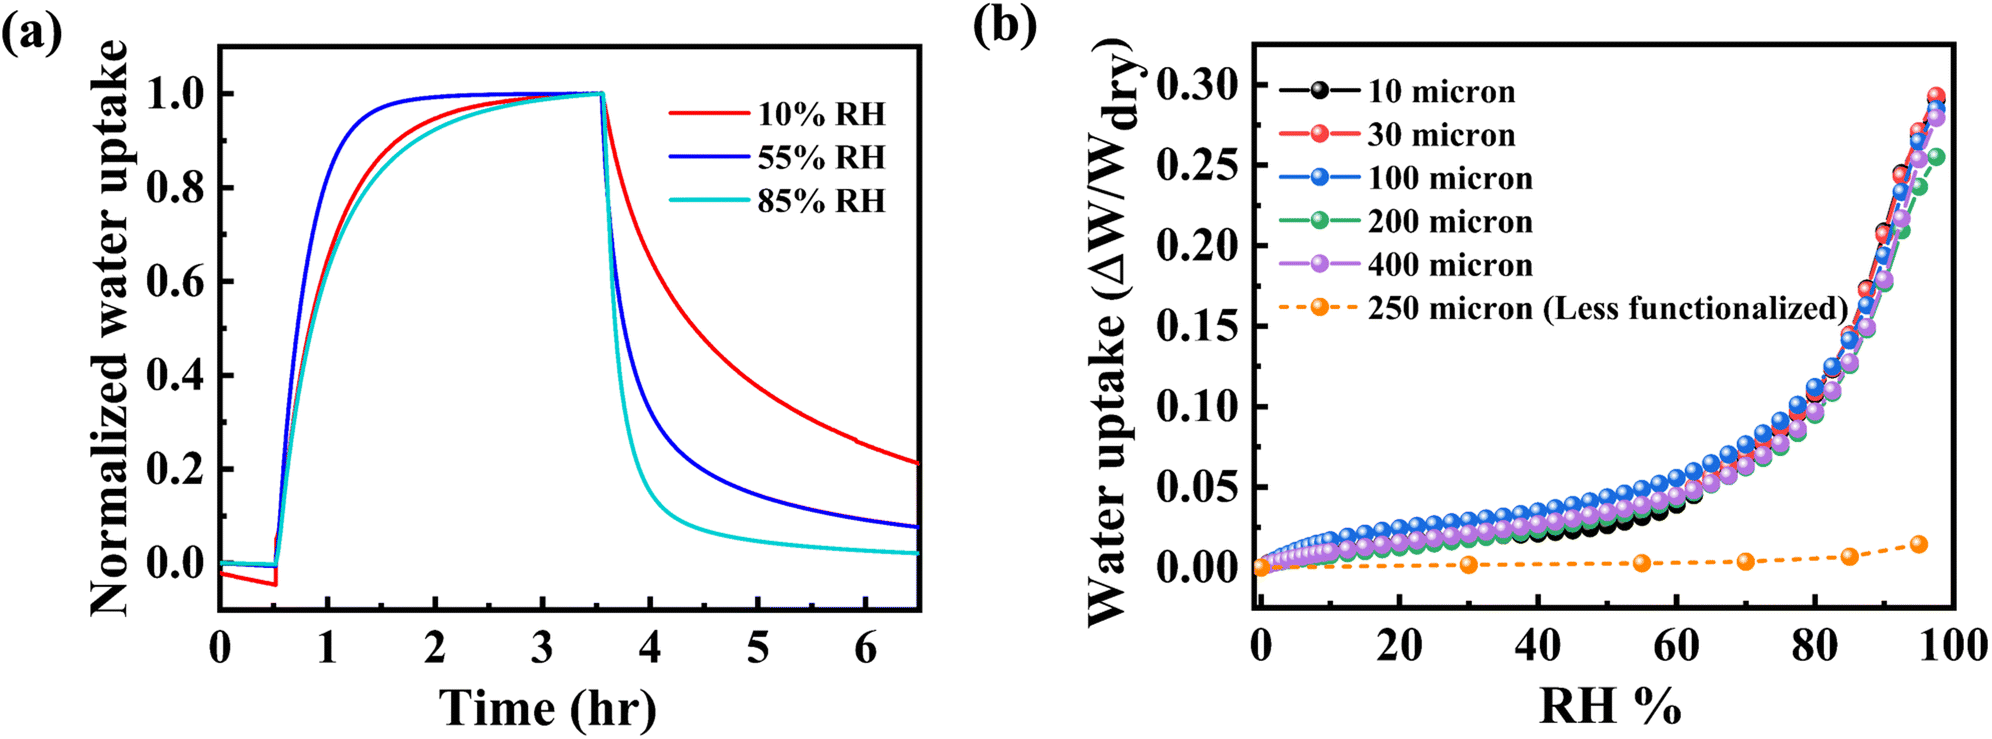 | ||
| Fig. 4 (a) Normalized water uptake versus time at three RH% conditions: 10 (red), 55 (blue), and 85% RH (green). (b) Normalized water uptake versus RH% for functionalized h-BN membranes of thickness varying from 10 to 400 μm. Also shown is the data for 230 μm membrane with less functionalization. | ||
Fig. 4(b) shows the isotherm of water uptake normalized to dry weight of the membrane. The membranes show an absolute sorption of 25–30% at 95 RH%. Membranes of 400 μm thickness can take the same density of water as 10 μm thick membranes. This indicates that the hierarchical microstructure or presence of voids in the lamellar structure does not affect the water sorption properties for the thickness range considered, which is unlike the case for GO membranes.4 More importantly, the water sorption of amine-functionalized h-BN membranes averaged across different thicknesses is 18 times the sorption observed in less functionalized h-BN membranes at a water loading of 1.4 wt%. The water uptake for functionalized h-BN membranes at 95% RH was 25%, while it was only 1.4 wt% for less functionalized membranes. This comparison between functionalized and control samples quantifies the role of edge amine groups in water uptake.
3.5 Proton transport in water-loaded membranes
We next discuss impedance measurement results for h-BN membranes under variable humidity environments. Fig. 5(a) shows a representative Nyquist plot obtained from impedance spectroscopy measurements on a 230 μm h-BN membrane sandwiched between Au/Cr electrodes. The broad features include a semi-circle at high frequencies with a straight line at low frequencies. The semi-circle corresponds to the Debye response, while the straight line feature can be attributed to the interfacial electric-double layer associated with the proton-blocking metal electrodes.42 Equivalent circuit fits were performed on the impedance data over the entire frequency range from 1 Hz to 500 kHz, a representative fit is shown in the inset of Fig. 5(a). A parallel combination of resistance and a constant phase element (CPE) replaces the ideal Debye response.43 In series to this is another parallel combination of resistance and CPE that models the low-frequency interfacial response. The Warburg element is also included for a smooth transition between these two regimes.44 At low water loading (<50% RH), the resistance of the sample is quite high and lies outside the measurement range of the EIS apparatus. For these cases, the impedance data were acquired with the AH-bridge. Only a section of the semicircle feature representing the bulk response is observed for low water loading, and the data are fitted with the Debye response. The conductivity of these samples as a function of RH% was thus obtained over a wide conductivity interval. Functional groups on the basal plane thermodynamically favor water intercalation between the sub-nanometer interlayer spaces in systems like graphene oxide. In GO, this also results in the expansion of the interlayer spacing. As discussed above, water does not intercalate the interlayer spaces of h-BN, so the capacitive part of the response cannot be directly related to the dielectric property of confined water. Rather, conductivity forms interesting data, as discussed in the following paragraph.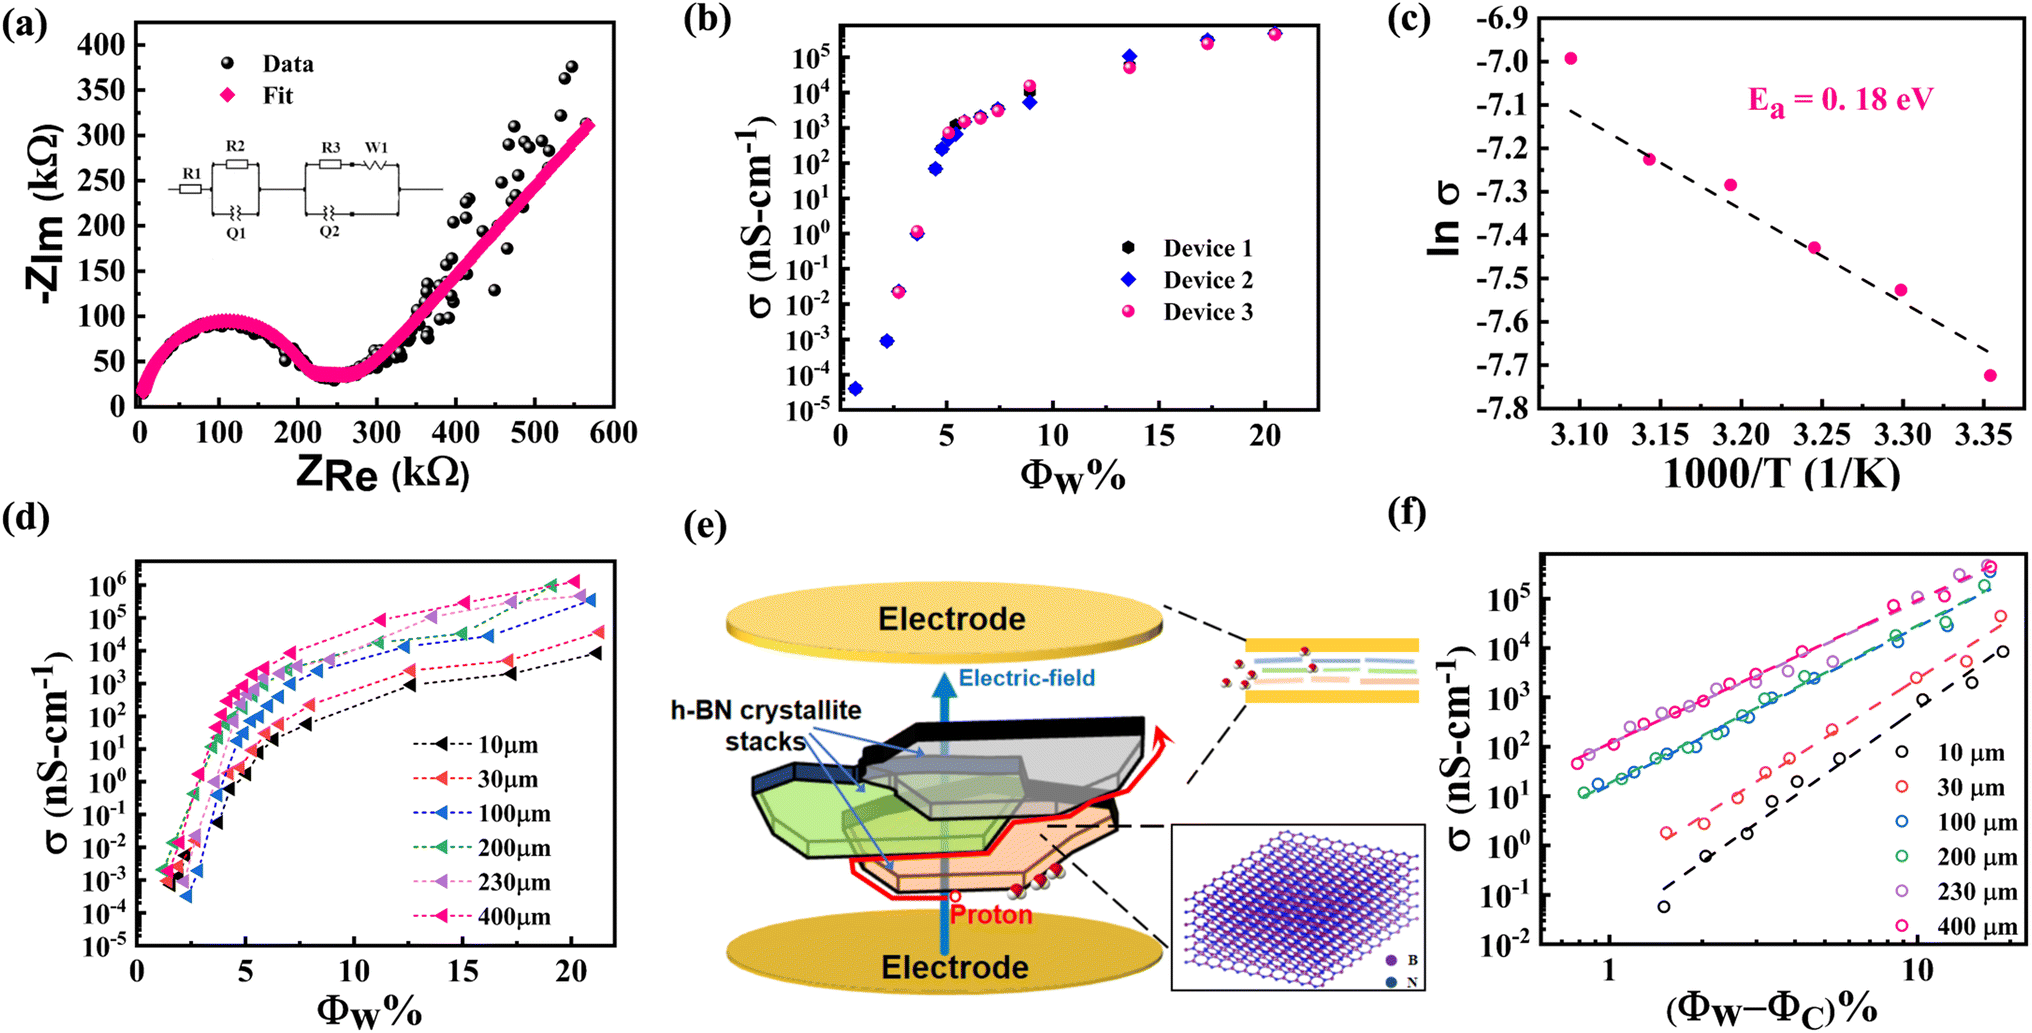 | ||
| Fig. 5 (a) Representative Nyquist plot for impedance of functionalized h-BN membrane at 65 RH%. The equivalent circuit is illustrated in the inset. Data are shown as black spheres and the fit is shown with the red curve. (b) Conductivity versus water wt% fraction for three devices of 230 μm thick functionalized h-BN. Note that the vertical axis is on a logarithmic scale. (c) Arrhenius plot together with linear fit (dashed line). (d) Conductivity versus water wt% fraction for functionalized h-BN membranes of thickness varying from 10 to 400 μm. Also shown is the data for 230 μm membrane with less functionalization. Note that the vertical axis is on a logarithmic scale. (e) Schematic illustration (not to scale) of the interconnected proton-conduction pathways along the edges of h-BN sheets. h-BN crystallite stacks at different depths are denoted with different colors only for clarity. (f) Conductivity vs. water wt% fraction fitted with the power-law, σ ∝ (Φw − Φc)α. | ||
3.6 Percolative transport
We now discuss the conductivity of h-BN samples as a function of water loading. Results from three devices of 230 μm thick h-BN membranes are plotted in Fig. 5(b) and show consistent dependence on the water loading. The conductivity of the membranes varies from ≈105 nS cm−1 to values exceeding 10−5 nS cm−1. This represents a variation in conductivity by a factor of more than 1010. Of this huge variation, a 7-orders magnitude change is observed for water loading, Φw < 5%. The less functionalized 250 μm hBN membrane has a conductivity of 4.25 × 10⁻⁴ nS cm−1 at 95% RH, which is 9-orders of magnitude lower than well-functionalized membranes of a similar thickness at the same RH condition (4.75 × 10⁵ nS cm−1). The average density of amine groups in the well-functionalized h-BN membrane is estimated from the deconvolution of XPS N-1s spectrum (Fig. 2(b)), and found to be 4.41/nm−3. The corresponding value for the less functionalized membrane is 1.65/nm−3, while the signal corresponding to amine groups is not detected in the electrically insulating pristine h-BN films (see ESI S4†). It is significant to note that a relatively small increase (≈2.7×) in the density of amine groups results in several orders of magnitude increase in the conductivity of water-loaded h-BN membranes. We suggest that this percolative process happens when the threshold density of edge functionalization has been achieved. The observed sharp transition may be understood as arising from a contiguous pathway of edge amine groups enabling water sorption (see Fig. 4(b)) and percolation of protons (see Fig. 5(b)). This further confirms the significant role of functionalization in proton transport for this system. A steady increase for Φw > 5% is also observed. The water loading range over which these conductivity changes occur may seem surprisingly small for a three-dimensional material.45 The low value of water loading indicates that the percolative pathways constitute a diminished subspace of the overall physical space of the membrane. This observation is consistent with the dense edge-functionalization of h-BN membranes, where the amine groups form the percolative pathways. Protons dissociated from the adsorbed water can use these rapid conduction pathways provided by the network of edge amine groups.Temperature dependence of conductivity was studied at the highest water loading. A plot of ln(σ) versus inverse temperature is shown in Fig. 5(c) over the temperature interval 25–50 °C. The Nyquist plots are shown in ESI S8.† A linear fit to the data gives the activation energy of EA ≈ 0.18 eV. This low value is indicative of Grotthuss mechanism of transport for protons along the hydrogen-bonded networks. The alternative vehicle mechanism that involves diffusion of water molecules or hydrated protons. The vehicle mechanism is hindered by the presence of hydrogen bonded network46 and involves a much higher value of activation energy, EA > 0.50 eV, which is clearly not the case for our data.47–49
Conductivity was measured as a function of membrane thickness varying from 10 to 400 μm, and the data is plotted in Fig. 5(d). A clear trend is observed in the thickness dependence once the water loading Φw > 2%. Near Φw ≈ 20%, which is the highest water loading in our experiments, the conductivity of 10 μm h-BN membrane was 8.417 × 10³ nS cm−1, while for the 400 μm membrane, it was 1.3 × 10⁶ nS cm−1. Thus, more than two-orders in magnitude increase in conductivity is observed with the increase in thickness. This behavior is counter-intuitive, as explained below. To note, the conductivity measurements are performed in the sandwich geometry. If the system is highly conductive and electrically well beyond the percolation threshold, additional layers in the membrane would primarily not affect the conductivity. On the other hand, closer to the percolation threshold, the conductivity is expected to decrease with increasing thickness. The size-dependent behavior is governed by a power law dependence, σ ∝ L−α/ν, with α, ν > 0 and depending on the dimensionality.45 Thus thicker membranes are thus expected to be less conductive. This is understood since, for thicker membranes, the charge carrier has to go through additional pathways that appear in series.50 These observations have been reported for various isotropic systems near the percolation threshold, such as lithium borate glasses.51 An increase in conductivity with thickness has been reported only for 3D systems where the electrodes are placed on one membrane surface in the in-plane geometry.52 In that case, the additional percolative pathways are added parallel to the existing ones. In light of the above discussion, the thickness dependence of conductivity observed for our h-BN membranes in the sandwich geometry is anomalous. However, these experimental observations can be reconciled by noting the anisotropic nature of transport pathways and the hierarchical microstructure of the membranes. As discussed, individual 150 nm size h-BN sheets stack with van der Waals interactions to form flat crystallites of thickness ≈6 nm. The process of vacuum filtration favors stacking these crystallites against each other such that the macroscopic membrane has individual sheets of h-BN that are approximately aligned with each other and with the deposition substrate (see Fig. 1(f) and related discussion).29 In conductivity studies, the electric field is applied perpendicular to the h-BN membrane. Due to the lamellar arrangement of the sheets in the membrane, the applied field is also mainly perpendicular to the individual flat h-BN sheets. The electric field cannot easily drive the protons since the percolative pathways are dominantly in-plane. However, due to slight misalignment of the sheets, protons are driven along the edge of the sheets. On the other hand, a strong electric field drives them vertically at points of overlap of the stacked sheets, as depicted in the schematic diagram in Fig. 5(e). This allows the proton to propagate to successive layers between the electrodes using a winding ladder whose steps are constituted from the edges of h-BN sheets (see another schematic depiction in ESI S9†). The hierarchical microstructure of the membranes is associated with voids in the lamellar structure. Thicker membranes can thus be expected to have increased average misalignment of h-BN sheets from the lamellar arrangement. Indeed, the roughness of the membranes significantly increases with thickness. The average surface roughness of 10 μm membrane was 14.2 nm, corresponding to the thickness of 2–3 flat crystallites stacked in lamellar arrangement. On the other hand, the roughness of 400 μm membrane was 148.2 nm (see surface profilometry data in ESI S10†).The increased roughness for thicker film indicates an increased departure from the ideal lamellar structure. The increased misalignment is expected to enhance the component of the electric field along the edges of the h-BN sheet and thereby, increase the conductivity of the membrane with thickness. This qualitatively explains the observed thickness dependence.
Finally, we quantitatively analyze the data within the percolation theory for deeper insight into the underlying processes. For random resistor networks near the percolation threshold, conductivity depends on the loading with a power law, σ ∝|Φw − Φc|α.45 A log–log plot of conductivity with |Φw − Φc| is shown in Fig. 5(f), and a linear trend is observed for each thickness. The slope gives the related exponent for different thicknesses, α = 4.43 (10 μm), 3.99 (30 μm), 3.21 (100 μm), 3.19 (200 μm), 2.87 (230 μm), and 2.90 (400 μm). The value of the exponent that characterizes the conducting regions close to the percolation threshold is typically determined only by dimensionality. Universal values of the exponent have been obtained, both in simulation (lattice models) and in experiments (continuum composites), with α2D ≈ 1.3 and α3D ≈ 2.00, for two- and three-dimensional systems, respectively.45,51,53 Nevertheless, the literature has also reported non-universal values of critical exponents, with 2 ≤ α ≤ 6 across different systems.53 In particular, non-universal critical exponents have been observed in composites of graphite-boron nitride, where graphite formed the conducting part and h-BN the insulating part of the system.54 Milled graphite loaded in an insulating matrix is an example of a system comprising elongated or flattened anisotropic-oriented particles in random contact with each other.53 For these systems, the transition to a non-universal large α value was realized for a large aspect ratio. A wide range of systems demonstrated non-universal critical exponents, with α > 2, and the common characteristic of such systems was a cellular microstructure involving insulating islands decorated with conducting particles on the edges.55 These systems possess a low percolation threshold, ΦC < 6.5%. Our system also shares these characteristics of large α value and low percolation threshold. This confirms the percolative proton transport along the amine-functionalized edges of flattened crystallites constituting the h-BN membrane. The decrease in the α value with the increasing thickness of the membrane is then associated with departure from the lamellar arrangement of the crystallites. More theoretical work is needed to model these subtle variations in the non-universal percolation exponent.
4 Summary and conclusions
Hexagonal boron nitride (h-BN) sheets are known to possess ionic conductive pathways, and applications have utilized these for size-dependent particle filtration.12,28,29 However, the nature of these pathways has not been sufficiently understood. The present investigations have established that water does not intercalate the sub-nanometer intersheet spaces of h-BN. From our earlier studies in another 2D system, graphene oxide, it is clear that the conduction process is very different in the h-BN system. Previous experiments have been performed in aqueous environments at large water loading.12,28,29 By incrementally adding water to the system, our work reveals the unique percolative process in edge-functionalized h-BN. Even without water uptake, the overlapping network of amine-functionalized h-BN edges ensures the system lies close to the percolation threshold. Adding less than 5 wt% water increases the conductivity by 7 orders in magnitude, which is much larger than reported in other proton conducting systems.48 The low percolation threshold indicates that the conduction pathways occupy a small sub-space of the material, namely, the added protons propagating along the dense network of edge amine groups. Since the system lies close to the percolation threshold even before any water loading, significant conductivity variations governed by power-law dependence are realized upon water loading. As potential applications, this is promising for ultra-sensitive humidity sensing and our study provides a broad strategy for realizing very large proton conductivity variations through materials engineering of percolative pathways. The non-universal conductivity critical exponent determined from our study further establishes the transport along the overlapping edges of flattened h-BN crystallites in the membrane revealing subtle features of proton permeation pathways in amine-functionalized h-BN. Future studies could look at the ability of percolative pathways created with other functional groups, such as hydroxyls, to rapidly conduct protons through the system. Such engineered systems can also be prototypes for complex bio-systems since proton conduction is a fundamental biological process.Conflicts of interest
The authors declare no conflict of interest.Acknowledgements
This research is supported under the Institute of Eminence (IoE) Program at IIT Madras vide sanction order SB-2223-1263-PHET-WO-008657 and SB-2021-0793-PH-MHRD-008657. The development of functionalized h-BN material was supported by IITM ERP project vide sanction order RF-2021-0669-PH-RFER-008508 and ISRO-IITM cell project vide sanction order SP-2122-1194-PH-ISRO-008508. The authors gratefully acknowledge using the FTIR facility at SAIF, IIT Madras. The authors gratefully acknowledge the use of profilometer and electron-beam evaporation facilities at CNNP, IIT-Madras. The authors would like to acknowledge the use of zeta potential measurements at PECS laboratory and Pradeep research group facilities. The authors gratefully acknowledge the use of XPS facilities at NCL Pune.Notes and references
- S. Chakraborty, H. Kumar, C. Dasgupta and P. K. Maiti, Acc. Chem. Res., 2017, 50, 2139–2146 CrossRef CAS PubMed.
- J. Köfinger, G. Hummer and C. Dellago, Proc. Natl. Acad. Sci. U. S. A., 2008, 105, 13218–13222 CrossRef PubMed.
- N. Raghav, S. Chakraborty and P. K. Maiti, Phys. Chem. Chem. Phys., 2015, 17, 20557–20562 RSC.
- V. Yadav, A. Das, C. Krishnamurthy and M. Jaiswal, Phys. Chem. Chem. Phys., 2022, 24, 26438–26448 RSC.
- L. Fumagalli, A. Esfandiar, R. Fabregas, S. Hu, P. Ares, A. Janardanan, Q. Yang, B. Radha, T. Taniguchi and K. Watanabe, et al. , Science, 2018, 360, 1339–1342 CrossRef CAS PubMed.
- S. Cerveny, F. Barroso-Bujans, A. Alegria and J. Colmenero, J. Phys. Chem. C, 2010, 114, 2604–2612 CrossRef CAS.
- R. Joshi, P. Carbone, F.-C. Wang, V. G. Kravets, Y. Su, I. V. Grigorieva, H. Wu, A. K. Geim and R. R. Nair, science, 2014, 343, 752–754 CrossRef CAS PubMed.
- A. Esfandiar, B. Radha, F. Wang, Q. Yang, S. Hu, S. Garaj, R. R. Nair, A. Geim and K. Gopinadhan, Science, 2017, 358, 511–513 CrossRef CAS PubMed.
- J. Abraham, K. S. Vasu, C. D. Williams, K. Gopinadhan, Y. Su, C. T. Cherian, J. Dix, E. Prestat, S. J. Haigh and I. V. Grigorieva, et al. , Nat. Nanotechnol., 2017, 12, 546–550 CrossRef CAS PubMed.
- R. Tredgold, Biochim. Biophys. Acta, 1973, 323, 143–150 CrossRef CAS PubMed.
- J.-J. Shao, K. Raidongia, A. R. Koltonow and J. Huang, Nat. Commun., 2015, 6, 7602 CrossRef PubMed.
- S. Qin, D. Liu, G. Wang, D. Portehault, C. J. Garvey, Y. Gogotsi, W. Lei and Y. Chen, J. Am. Chem. Soc., 2017, 139, 6314–6320 CrossRef CAS PubMed.
- M. Ghosh, L. Pradipkanti, V. Rai, D. K. Satapathy, P. Vayalamkuzhi and M. Jaiswal, Appl. Phys. Lett., 2015, 106, 241902 CrossRef.
- C. E. Ren, K. B. Hatzell, M. Alhabeb, Z. Ling, K. A. Mahmoud and Y. Gogotsi, J. Phys. Chem. Lett., 2015, 6, 4026–4031 CrossRef CAS PubMed.
- A. E. Naclerio and P. R. Kidambi, Adv. Mater., 2023, 35, 2207374 CrossRef CAS PubMed.
- Z. Wang, P. Priego, M. J. Meziani, K. Wirth, S. Bhattacharya, A. Rao, P. Wang and Y.-P. Sun, Nanoscale Adv., 2020, 2, 2507–2513 RSC.
- O. J. Wahab, E. Daviddi, B. Xin, P. Z. Sun, E. Griffin, A. W. Colburn, D. Barry, M. Yagmurcukardes, F. M. Peeters, A. K. Geim, M. Lozada-Hidalgo and P. R. Unwin, Proton Transport through Nanoscale Corrugations in Two-Dimensional Crystals, 2023 Search PubMed.
- L. Shi, Y. Gao, Z. Ying, A. Xu and Y. Cheng, Nanoscale, 2022, 14, 6518–6525 RSC.
- J. Kroes, A. Fasolino and M. Katsnelson, Phys. Chem. Chem. Phys., 2017, 19, 5813–5817 RSC.
- K. Raidongia and J. Huang, J. Am. Chem. Soc., 2012, 134, 16528–16531 CrossRef CAS PubMed.
- V. Yadav and V. Kulshrestha, Nanoscale, 2019, 11, 12755–12773 RSC.
- S. Hu, M. Lozada-Hidalgo, F. Wang, A. Mishchenko, F. Schedin, R. R. Nair, E. Hill, D. Boukhvalov, M. Katsnelson and R. A. Dryfe, et al. , Nature, 2014, 516, 227–230 CrossRef CAS PubMed.
- S. I. Yoon, K. Y. Ma, T.-Y. Kim and H. S. Shin, J. Mater. Chem. A, 2020, 8, 2898–2912 RSC.
- L. Mogg, S. Zhang, G.-P. Hao, K. Gopinadhan, D. Barry, B. Liu, H. Cheng, A. Geim and M. Lozada-Hidalgo, Nat. Commun., 2019, 10, 4243 CrossRef CAS PubMed.
- J. Comtet, B. Grosjean, E. Glushkov, A. Avsar, K. Watanabe, T. Taniguchi, R. Vuilleumier, M.-L. Bocquet and A. Radenovic, Nat. Nanotechnol., 2020, 15, 598–604 CrossRef CAS PubMed.
- J. Ren, L. Stagi and P. Innocenzi, J. Mater. Sci., 2021, 56, 4053–4079 CrossRef CAS.
- X. Shi, K. Wang, J. Tian, X. Yin, B. Guo, G. Xi, W. Wang and W. Wu, ACS Appl. Nano Mater., 2020, 3, 2310–2321 CrossRef CAS.
- W. Lei, V. N. Mochalin, D. Liu, S. Qin, Y. Gogotsi and Y. Chen, Nat. Commun., 2015, 6, 8849 CrossRef CAS PubMed.
- C. Chen, J. Wang, D. Liu, C. Yang, Y. Liu, R. S. Ruoff and W. Lei, Nat. Commun., 2018, 9, 1902 CrossRef PubMed.
- M. Rajasekaran and K. G. Ayappa, Phys. Chem. Chem. Phys., 2022, 24, 14909–14923 RSC.
- M. R. Karim, K. Hatakeyama, T. Matsui, H. Takehira, T. Taniguchi, M. Koinuma, Y. Matsumoto, T. Akutagawa, T. Nakamura and S.-i. Noro, et al. , J. Am. Chem. Soc., 2013, 135, 8097–8100 CrossRef CAS PubMed.
- J. N. Israelachvili, Intermolecular and Surface Forces, Academic Press, 2011, pp. 291–340 Search PubMed.
- C. D. Wood, M. J. Palmeri, K. W. Putz, Z. An, S. T. Nguyen and L. Catherine Brinson, J. Appl. Mech., 2013, 80, 040913 CrossRef.
- Y. Lin, T. V. Williams, T.-B. Xu, W. Cao, H. E. Elsayed-Ali and J. W. Connell, J. Phys. Chem. C, 2011, 115, 2679–2685 CrossRef CAS.
- T. Sainsbury, T. Ikuno, D. Okawa, D. Pacile, J. M. Frechet and A. Zettl, J. Phys. Chem. C, 2007, 111, 12992–12999 CrossRef CAS.
- K. S. Kim, C. T. Kingston, A. Hrdina, M. B. Jakubinek, J. Guan, M. Plunkett and B. Simard, ACS Nano, 2014, 8, 6211–6220 CrossRef CAS PubMed.
- W. Lei, D. Portehault, R. Dimova and M. Antonietti, J. Am. Chem. Soc., 2011, 133, 7121–7127 CrossRef CAS PubMed.
- Q. Weng, B. Wang, X. Wang, N. Hanagata, X. Li, D. Liu, X. Wang, X. Jiang, Y. Bando and D. Golberg, ACS Nano, 2014, 8, 6123–6130 CrossRef CAS PubMed.
- T. Sainsbury, A. Satti, P. May, Z. Wang, I. McGovern, Y. K. Gun'ko and J. Coleman, J. Am. Chem. Soc., 2012, 134, 18758–18771 CrossRef CAS PubMed.
- T. Pranav, T. Sakorikar, P. Vayalamkuzhi and M. Jaiswal, J. Appl. Phys., 2019, 125, 024303 CrossRef.
- L. Zhanshayeva, V. Favaron and G. Lubineau, ACS Omega, 2019, 4, 21883–21890 CrossRef CAS PubMed.
- R. A. Huggins, Ionics, 2002, 8, 300–313 CrossRef CAS.
- C. Hsu and F. Mansfeld, Corrosion, 2001, 57, 747–748 CrossRef CAS.
- S. Taylor and E. Gileadi, Corrosion, 1995, 51, 664–671 CrossRef CAS.
- D. Stauffer and A. Aharony, Introduction to Percolation Theory, CRC Press, 2018 Search PubMed.
- K. Kreuer, A. Rabenau and R. Messer, Appl. Phys. A: Solids Surf., 1983, 32, 45–53 CrossRef.
- H.-X. Sun, Y.-M. Fu, X. Meng, H.-N. Wang, Y.-O. He, R.-G. Yang and Z.-M. Su, Mater. Chem. Phys., 2022, 280, 125845 CrossRef CAS.
- S. S. Park, A. J. Rieth, C. H. Hendon and M. Dincă, J. Am. Chem. Soc., 2018, 140, 2016–2019 CrossRef CAS PubMed.
- G. Xu, K. Otsubo, T. Yamada, S. Sakaida and H. Kitagawa, J. Am. Chem. Soc., 2013, 135, 7438–7441 CrossRef CAS PubMed.
- Y. Aoki, H. Habazaki and T. Kunitake, Electrochem. Solid-State Lett., 2008, 11, P13 CrossRef CAS.
- F. Berkemeier, M. R. S. Abouzari and G. Schmitz, Phys. Rev. B: Condens. Matter Mater. Phys., 2007, 76, 024205 CrossRef.
- W. Aigner, M. Wiesinger, H. Wiggers, M. Stutzmann and R. N. Pereira, Phys. Rev. Appl., 2016, 5, 054017 CrossRef.
- A. Celzard and J. Marêché, Phys. A, 2003, 317, 305–312 CrossRef.
- J. Wu and D. McLachlan, Phys. Rev. B: Condens. Matter Mater. Phys., 1997, 56, 1236 CrossRef CAS.
- C. Chiteme and D. Mclachlan, Phys. B, 2000, 279, 69–71 CrossRef CAS.
Footnote |
| † Electronic supplementary information (ESI) available. See DOI: https://doi.org/10.1039/d3na00524k |
| This journal is © The Royal Society of Chemistry 2023 |