 Open Access Article
Magnetoplasmonic gold nanorods for the sensitive and label-free detection of glutathione†
Zexiang
Han‡
a,
Wajid
Ali‡
abc,
Ting
Mao
d,
Fei
Wang
ab and
Xiaoli
Wang
 *ab
*ab
aCAS Key Laboratory of Nanosystem and Hierarchical Fabrication, National Center for Nanoscience and Technology, Beijing, 100190, P. R. China. E-mail: wangxl@nanoctr.cn
bCenter of Materials Science and Optoelectronics Engineering, University of Chinese Academy of Sciences, Beijing 100049, P. R. China
cKey Laboratory for Micro-Nano Physics and Technology of Hunan Province, Hunan Institute of Optoelectronic Integration, College of Materials Science and Engineering, Hunan University, Changsha, Hunan 410082, P. R. China
dInstitute of Materials, Ecole Polytechnique Fédérale de Lausanne, 1015 Lausanne, Switzerland
First published on 8th August 2023
Abstract
This work exploits the magneto-optical activity of gold nanorods for the detection of sub-micromolar concentrations of glutathione using magnetic circular dichroism spectroscopy. Modulations of the magnetoplasmonic response of nanorods serve as the basis of the sensing methodology, whereby the presence of glutathione induces the end-to-end assembly of nanorods. In particular, the nanorod self-assembly enables a localized electric field in the nanocavities with adsorbed thiol molecules, whose field strength is amplified by the external magnetic field as confirmed by finite-element modeling, enabling their high-sensitivity detection. Our simple magnetoplasmonic sensor for glutathione requires no specific chemical tags and exhibits an impressive limit of detection of 97 nM.
Glutathione (GSH) is a tripeptide antioxidant that plays a vital role in diverse physiological functions of plant and animal cells.1,2 GSH exists in reduced form under normal conditions, whereas, in high concentrations, it becomes oxidized into glutathione disulfide. The ratio of the reduced to the oxidized form is commonly used for assessing cellular toxicity, and the normal functioning of biological cells necessitates a sufficiently high fraction of the reduced GSH.2 Accordingly, abnormal changes in this level/concentration are found to correlate with numerous diseases, including cystic fibrosis and immunodeficiency diseases.3,4 This highlights the critical need to detect GSH in a facile fashion. Traditional analytical techniques such as liquid chromatography and mass spectrometry could provide the exact fingerprint of GSH for high-fidelity detection. Nevertheless, these methodologies are often time-consuming and may require a large sample volume for analysis.
Optical spectroscopies are attractive alternatives as they have been widely adopted in the food science and pharmaceutical industries thanks to their ease of use and efficacy. Plasmonic sensors based on metallic nanoparticles are bourgeoning owing to the localized surface plasmon resonance (LSPR) and its strong manipulation of electromagnetic waves, especially visible light, in the nanoscale regime. Such a plasmonic response is sensitive to the nanostructure shape and assembly configuration and greatly enhances the optical activity of molecules in close proximity. By this remarkable property, metallic nanostructures are excellent materials for designing sensing devices to detect biological and chemical analytes with high sensitivity, generally outperforming their dielectric analogs.5–12 However, the sensing performance of nanoplasmonic devices such as using fluorescence or Raman signals is often compromised because of the strong absorption and scattering background. To overcome this, an external agent that enhances the optical resonance at specific wavelengths should be sought, and the application of an external magnetic field remains a strategy that is less explored. In particular, the external magnetic field couples with the localized field around the plasmonic nanostructures to enable emergent magnetoplasmonic effects for enhanced sensing performance.
Herein, we propose for the first time a magnetoplasmonic sensor for GSH based on the circular magnetoplasmonic modes of GNRs. The choice of design could be rationalized for the following reasons. Colloidal GNRs greatly amplify the optical activity of adjacent organic molecules via LSPR compared to the gold nanospheres that lack the longitudinal LSPR mode.13,14 Using an external magnetic field, magnetic circular dichroism (MCD) spectroscopy provides rich information on the plasmonic nanostructures and their environment that remains uncaptured by ordinary absorption or CD spectroscopies.15,16 This underutilized magneto-optical effect lays another foundation for our design. A previous study from our group has demonstrated that the MCD spectral signature of plasmonic nanostructures is highly dependent on the nanoparticle geometry and assembly configuration.17 The overall concept is schematically shown in Fig. 1. To elaborate, the colloidal sensing platform is subject to a static 1.6 T magnetic field. Upon the addition of GSH, the magnetoplasmonic modes of GNRs change due to changes at the metal–dielectric interface via self-assembly, leading to spectral differences in the MCD signal. By examining the spectral shift in the zero-line crossing point, GSH could be quantitatively detected at low concentrations.
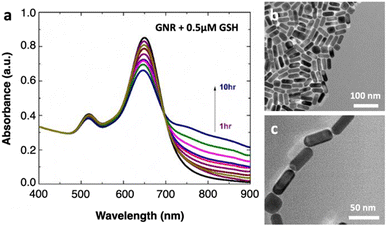
Colloidal GNRs coated with cetyltrimethylammonium bromide (CTAB) are synthesized following the well-reported seed-mediated growth method,18 and the synthesis protocol is detailed in the ESI file.† The absorption spectrum (Perkin Lambda 950) of the as-prepared GNRs in water displays two apparent plasmonic resonance modes, where the transverse plasmon band is found at 517 nm and the longitudinal LSPR band at 646 nm, confirming their anisotropy (Fig. 2a, black line). Transmission electron microscopy (TEM, Tecnai G2 T-20 U-TWIN, Fig. 2b) images show that the nanorods are well-dispersed and relatively homogeneous in morphology: the GNRs are 18.2 ± 4.6 nm in diameter and 40.2 ± 8.5 nm in length (Fig. S1, ESI†). The aspect ratio is about 2.3 ± 0.5, which is relatively optimized for achieving large MCD signals.17,19 For spiking, GSH is added into the colloidal suspension at a desired concentration. Importantly, the pH of the mixture is kept constant around 5.07 since the chemistry of the medium has a strong influence on the self-assembly of GNRs.20,21 Following GSH spiking, all the spectra at different time points show a similar spectral shape. As time progresses, the longitudinal LSPR also redshifts slightly, whereas the transverse mode remains relatively stable. In addition, the appearance of small and new plasmonic modes in the longer wavelengths corroborates the self-organization of GNRs in the longitudinal direction. These nanoassemblies and the existence of nanogap regions between the GNR ends are directly visualized by TEM (Fig. 2c) and scanning electron microscopy (Fig. S2, ESI†). The thiol groups in GSH preferentially adsorb onto Au tips due to strong gold–thiol interactions and a lower density of CTAB ligands compared to on the surface, enabling GNRs to self-assemble in an end-to-end configuration.22,23 The formation of end-to-end assembly with such a low concentration of GSH as well indicates the reduced interaction of CTAB molecules and Au at the ends of the nanorods as compared to their sides.
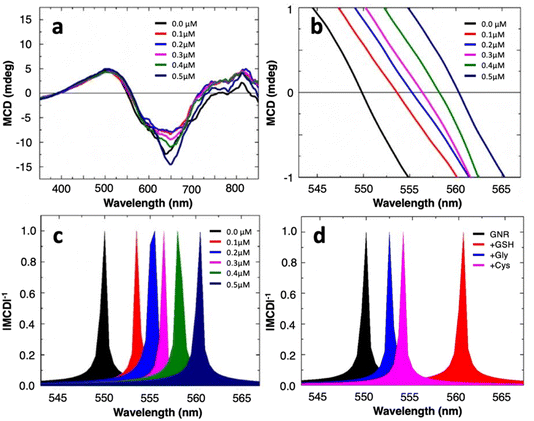
MCD spectroscopy (Jasco-1500 spectrophotometer) measures the differential absorption of left and right circularly polarized light under the influence of a static magnetic field parallel to the light propagation direction. Averaged MCD spectra of the gold nanorods in the absence and presence of varying concentrations (0.1–0.5 μM) of GSH are shown in Fig. 3a. Both well-dispersed GNRs and nanoassemblies present nondegenerate circular magnetoplasmonic modes. This is seen in the opposite signs of the MCD signal across the visible frequency range, induced by the external magnetic field, in agreement with our previous results.17 A closer examination of the spectra, especially the region with x-axis intersection points, shows that the presence of GSH induces spectral redshifts to the zero-line crossing in a concentration-dependent manner (Fig. 3b). By converting the signal to |MCD|−1, the intersections manifest as sharply defined singularity points that are easier to see (Fig. 3c), where the spectrum for well-dispersed GNRs in water has a zero crossing at 549.8 nm which serves as a reference point for calculating spectral shifts or Δλ. We further test the effect of glycine and cysteine, the latter of which is another simple molecule containing the thiol functional group, on our colloidal sensor. At an identical spiking concentration of 0.5 μM, the spectral shift for GSH is much larger than for glycine or cysteine (Fig. 3d). This suggests that, without adopting specific surface functionalization strategies (i.e., being label-free), the magnetoplasmonic sensor proposed here could still realize the relative selectivity towards GSH over cysteine (Fig. S3, ESI†).
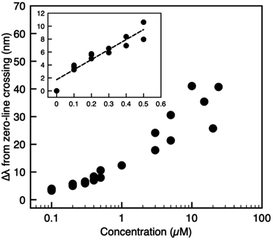
Fig. 4 plots the spectral shift as a function of the analyte concentration, where higher GSH concentrations correlate with larger spectral redshifts. To demonstrate a high-sensitivity magnetoplasmonic sensor, we focus our discussion of results exclusively on the regime with GSH concentrations between zero (pristine GNRs) and 0.5 μM. A common figure-of-merit for colloidal sensors is the limit of detection (LOD), defined as  where σy is the standard deviation of the y-intercept and s is the slope from the linear regression fitting.6,24 For the linear regime of the calibration curve, the line of best fit has the form
| ŷ = (15.4 ± 1.7)x + (1.7 ± 0.5) |
 | ||
| Fig. 4 Calibration curve showing the spectral shift versus GSH concentration recorded for different batches of GNRs to ensure repeatability. See Fig. S4† (ESI) for details. The inset shows the zoom-in view of data with spiking concentrations less than or equal to 0.5 μM and the corresponding linear fit. | ||
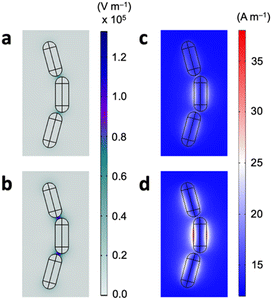
We finally attribute the sensing mechanism of the magnetoplasmonic platform to the thiol-mediated end-to-end self-assembly of GNRs. While prior studies have demonstrated the use of magnetoplasmonic modes for refractometric sensing, where a change in the bulk dielectric refractive index leads to a change in the (magneto)plasmonic mode position,15,30 our design shows otherwise. In typical refractive index-based biosensing, the change in the resonance wavelength generally correlates linearly with the refractive index of the dielectric environment or the analyte concentration. However, experimentally measured refractive indices of aqueous GSH solutions (Atago Abbe refractometer, DR-A1-plus) show essentially no changes on the order of 10−4 in our concentration range of interest (Table S2†), suggesting that the capability of detecting sub-micromolar concentrations of GSH is not attributed to changes in the refractive index of the bulk dielectric medium. Now, because the addition of glutathione induces GNR assembly, it is reasonable to conclude that the sensing mechanism lies within. This has indeed been observed previously showing the assembly-induced spectral changes in the MCD signals of magnetoplasmonic nanorods.17 To further elucidate this, electromagnetic field distributions of the GNR assemblies are calculated using the finite element method. The system setup and calculation details can be found in the ESI file.† In the GNR nanoassemblies, there exist nanosized gap regions with adsorbed GSH molecules with a concurrent localized electric field enhancement (Fig. 5a). The plasmonic resonance coupling at the ends of adjacent nanorods gives rise to Fabry–Perot resonance effects, and at the resonance position of around 650 nm the field enhancement is maximized. Importantly, when there is an external magnetic field as per MCD spectroscopy, the electric field approximately doubles in strength in the gap regions (Fig. 5b). The broken time symmetry under the external magnetic field leads to emergent magneto-optical effects, generating additional optical modes that are believed to be responsible for both the increased absorption and enhanced cavity resonance effects. Similar plots show that the magnetic field preferentially localizes at the surface of GNRs (Fig. 5c and d). In the presence of an external 1.6 T field, the localized magnetic field also becomes amplified in strength. This would provide a rationale for the enhanced sensitivity towards GSH when using MCD signals compared to using traditional CD spectroscopy.31 Overall, the enhanced electromagnetic fields and the fact that the adsorbed GSH molecules sit within or in proximity to the localized electric field could explain the high sensitivity of the magnetoplasmonic GNRs for GSH.
Conclusions
In conclusion, this work reports the first design of a magneto-optical sensor for detecting glutathione based on widely researched GNRs. The assay relies on MCD spectral signatures, whereby the external magnetic field couples to the LSPR of the plasmonic nanorods, giving off nondegenerate magnetoplasmonic modes that are sensitive to the nanostructure configuration. By monitoring the narrow-width signals from |MCD|−1, our colloidal sensor shows highly promising performance, capable of sensitively detecting GSH with a LOD of 97 nM. The high performance could be rationalized by the fact that the analyte molecules sit in the gap regions between GNRs in the nanoassemblies where there is a significant, localized electric field enhancement assisted by the external magnetic field. Our work expands the current application portfolio of magneto-plasmonic nanostructures and demonstrates the possibility of high-sensitivity, label-free detection of bio-analytes using field-enhanced magneto-optical sensors.Conflicts of interest
There are no conflicts to declare.Acknowledgements
This work was supported by the National Natural Science Foundation of China (21673053 and 21975060, X. L. W.) and Youth Innovation Promotion Association CAS (2019039, X. L. W.).References
- H. Sies, Free Radical Biol. Med., 1999, 27, 916–921 CrossRef CAS PubMed.
- C. Hwang, A. J. Sinskey and H. F. Lodish, Science, 1992, 257, 1496–1502 CrossRef CAS PubMed.
- W. Dröge, K. Schulze-Osthoff, S. Mihm, D. Galter, H. Schenk, H. Eck, S. Roth and H. Gmünder, FASEB J., 1994, 8, 1131–1138 CrossRef.
- J. H. Roum, R. Buhl, N. G. McElvaney, Z. Borok and R. G. Crystal, J. Appl. Physiol., 1993, 75, 2419–2424 CrossRef CAS PubMed.
- J. Homola, Chem. Rev., 2008, 108, 462–493 CrossRef CAS.
- J. C. Gukowsky, C. Tan, Z. Han and L. He, J. Food Sci., 2018, 83, 1631–1638 CrossRef CAS PubMed.
- M. Lafuente, S. De Marchi, M. Urbiztondo, I. Pastoriza-Santos, I. Pérez-Juste, J. Santamaría, R. Mallada and M. Pina, ACS Sens., 2021, 6, 2241–2251 CrossRef CAS PubMed.
- A. Minopoli, B. Della Ventura, B. Lenyk, F. Gentile, J. A. Tanner, A. Offenhäusser, D. Mayer and R. Velotta, Nat. Commun., 2020, 11, 6134 CrossRef CAS PubMed.
- N. Bosio, H. Šípová-Jungová, N. O. Länk, T. J. Antosiewicz, R. Verre and M. Käll, ACS Photonics, 2019, 6, 1556–1564 CrossRef CAS.
- H.-K. Oh, K. Kim, J. Park, H. Im, S. Maher and M.-G. Kim, Biosens. Bioelectron., 2022, 205, 114094 CrossRef CAS PubMed.
- H. Geng, S. Vilms Pedersen, Y. Ma, T. Haghighi, H. Dai, P. D. Howes and M. M. Stevens, Acc. Chem. Res., 2022, 55, 593–604 CrossRef CAS PubMed.
- C. Che, R. Xue, N. Li, P. Gupta, X. Wang, B. Zhao, S. Singamaneni, S. Nie and B. T. Cunningham, ACS Nano, 2022, 16, 2345–2354 CrossRef CAS PubMed.
- C. Martín-Sánchez, G. González-Rubio, P. Mulvaney, A. Guerrero-Martínez, L. M. Liz-Marzán and F. Rodríguez, J. Phys. Chem. Lett., 2019, 10, 1587–1593 CrossRef.
- H. Chen, X. Kou, Z. Yang, W. Ni and J. Wang, Langmuir, 2008, 24, 5233–5237 CrossRef CAS PubMed.
- F. Pineider, G. Campo, V. Bonanni, C. de Julián Fernández, G. Mattei, A. Caneschi, D. Gatteschi and C. Sangregorio, Nano Lett., 2013, 13, 4785–4789 CrossRef CAS PubMed.
- B. Han, X. Gao, J. Lv and Z. Tang, Adv. Mater., 2020, 32, 1801491 CrossRef CAS PubMed.
- B. Han, X. Gao, L. Shi, Y. Zheng, K. Hou, J. Lv, J. Guo, W. Zhang and Z. Tang, Nano Lett., 2017, 17, 6083–6089 CrossRef CAS PubMed.
- N. R. Jana, L. Gearheart and C. J. Murphy, Adv. Mater., 2001, 13, 1389–1393 CrossRef CAS.
- D. Melnikau, A. A. Govyadinov, A. Sánchez-Iglesias, M. Grzelczak, L. M. Liz-Marzán and Y. P. Rakovich, Nano Lett., 2017, 17, 1808–1813 CrossRef CAS PubMed.
- C. J. Orendorff, P. L. Hankins and C. J. Murphy, Langmuir, 2005, 21, 2022–2026 CrossRef CAS PubMed.
- Z. Sun, W. Ni, Z. Yang, X. Kou, L. Li and J. Wang, Small, 2008, 4, 1287–1292 CrossRef CAS PubMed.
- X. Lu, D. Punj and M. Orrit, RSC Adv., 2022, 12, 13464–13471 RSC.
- J. Lu, Y.-X. Chang, N.-N. Zhang, Y. Wei, A.-J. Li, J. Tai, Y. Xue, Z.-Y. Wang, Y. Yang, L. Zhao, Z.-Y. Lu and K. Liu, ACS Nano, 2017, 11, 3463–3475 CrossRef CAS.
- A. Shrivastava and V. Gupta, Chron. Young Sci., 2011, 2, 21 CrossRef.
- P. Singh, R. P. Ojha, S. Kumar, A. K. Singh and R. Prakash, Mater. Chem. Phys., 2021, 267, 124684 CrossRef CAS.
- D. Bano, V. Kumar, V. K. Singh and S. H. Hasan, New J. Chem., 2018, 42, 5814–5821 RSC.
- K. Güçlü, M. Özyürek, N. Güngör, S. Baki and R. Apak, Anal. Chim. Acta, 2013, 794, 90–98 CrossRef PubMed.
- C. Liu, Y. Cai, J. Wang, X. Liu, H. Ren, L. Yan, Y. Zhang, S. Yang, J. Guo and A. Liu, ACS Appl. Mater. Interfaces, 2020, 12, 42521–42530 CrossRef CAS PubMed.
- L. Chen, X. Li, Z. Li, K. Liu and J. Xie, RSC Adv., 2022, 12, 595–601 RSC.
- M. A. Beuwer and P. Zijlstra, J. Chem. Phys., 2021, 155, 044701 CrossRef CAS PubMed.
- F. Zhu, X. Li, Y. Li, M. Yan and S. Liu, Anal. Chem., 2015, 87, 357–361 CrossRef CAS PubMed.
Footnotes |
| † Electronic supplementary information (ESI) available. See DOI: https://doi.org/10.1039/d3na00396e |
| ‡ These two authors contributed equally. |
| This journal is © The Royal Society of Chemistry 2023 |


