
 Open Access Article
 This Open Access Article is licensed under a Creative Commons Attribution-Non Commercial 3.0 Unported Licence
Protein nanoarrays using the annexin A5 two-dimensional crystal on supported lipid bilayers†
Hiroaki
Kominami
 a,
Yoshiki
Hirata
b,
Hirofumi
Yamada
a and
Kei
Kobayashi
*a
a,
Yoshiki
Hirata
b,
Hirofumi
Yamada
a and
Kei
Kobayashi
*a
aDepartment of Electronic Science and Engineering, Kyoto University, Kyoto University Katsura, Nishikyo, Kyoto 615-8510, Japan. E-mail: keicoba@iic.kyoto-u.ac.jp
bInstitute for Biological Resources and Functions, National Institute of Advanced Industrial Science and Technology, 1-1-1 Higashi, Tsukuba 305-8566, Japan
First published on 19th June 2023
Abstract
Protein nanoarrays are regularly ordered patterns of proteins fixed on a solid surface with a periodicity on the order of nanometers. They have significant potential applications as highly sensitive bioassays and biosensors. While several researchers have demonstrated the fabrication of protein nanoarrays with lithographic techniques and programmed DNA nanostructures, it has been difficult to fabricate a protein nanoarray containing a massive number of proteins on the surface. We now report the fabrication of nanoarrays of streptavidin molecules using a two-dimensional (2D) crystal of annexin A5 as a template on supported lipid bilayers that are widely used as cell membranes. The 2D crystal of annexin A5 has a six-fold symmetry with a period of about 18 nm. There is a hollow of a diameter of about 10 nm in the unit cell, surrounded by six trimers of annexin A5. We found that a hollow accommodates up to three streptavidin molecules with their orientation controlled, and confirmed that the molecules in the hollow maintain their specific binding capability to biotinylated molecules, which demonstrates that the fabricated nanoarray serves as an effective biosensing platform. This methodology can be directly applied to the fabrication of nanoarrays containing a massive number of any other protein molecules.
Introduction
Protein nanoarrays, regularly ordered patterns of proteins fixed on a solid surface with a periodicity on the order of nanometers, are expected not only as a platform for highly sensitive biosensors to detect target molecules and screen drug candidates,1–3 but also as a tool to analyze the functions of the proteins themselves.4 Several methods have already been reported to fabricate protein nanoarrays, such as lithographic techniques5,6 and programmed DNA nanostructures.7–10 However, it has been difficult to fabricate a nanoarray containing a massive number of proteins with a unit size on the order of tens of nanometers on the surface. Dip-pen nanolithography using atomic force microscopy (AFM)5,6 is a useful technique to fabricate nanoarrays with a nanometer-scale unit size. However, fabrication throughput and the size of the patterned area are limited. On the other hand, programmed DNA nanostructures are suitable techniques for efficiently fabricating nanoarrays containing a massive number of proteins since they are based on the self-assembly of DNA molecules. However, it is difficult to carefully program the DNA nanostructures such that the proteins do not have strong interactions with the DNA or substrate and maintain their functions that they should have in vivo.We now report the fabrication of protein nanoarrays using a two-dimensional (2D) crystal of annexin A5 (Ax5) on supported lipid bilayers (SLBs) as a template. SLBs are widely used as a model for the cell membrane.11–13 Since lipid molecules with various molecular functional groups are available, we can fix various proteins to those functional groups in the hollow sites and even control their orientations.
We first characterized the Ax5 molecules in the 2D crystal by high-resolution AFM, and then demonstrated the attachment of streptavidin (SA) molecules to the SLBs within each hollow in a controlled manner. Since the binding between SA and biotin is strong with a dissociation constant of 10−14 M and it is stable under physiological conditions, SA–biotin interaction is widely used in molecular science.14 The interaction has also been used as a technique to immobilize proteins of interest to the substrate.9,15–17 We then confirmed that the SA molecules within each hollow maintain their specific binding capability to biotinylated bovine serum albumin (BBSA), which demonstrates that the SA molecules maintain their strong affinities to biotinylated molecules.
Ax5 is one of the annexin family proteins that binds to negatively charged phospholipids in a Ca2+-dependent manner.18 In particular, annexins have a high-affinity for phosphatidylserine (PS) in the presence of Ca2+.19 Ax5 is well known to form a trimer immediately after adsorption onto SLBs and then form the 2D crystal,20–24 The structure of Ax5 registered in the protein data bank (PDB code 1ALA) is shown in Fig. 1a.25 A monomer of Ax5 consists of four repeats of 70 amino acids, which are numbered from 1 to 4. Each repeating unit, denoted by different colors in Fig. 1a, is folded into five α-helices. The blue background represents the shape of the monomer as observed by AFM described below. The number 2 domain was lightly colored because it was observed lower than the other domains. The crystal forms having p6 and p3 symmetries have commonly been observed in liquids.22Fig. 1b shows a model of the 2D Ax5 crystal that has a p6 symmetry that we used as a template for the protein nanoarray in this study. The white rhombus shows the hexagonal unit cell. According to previous studies using electron microscopy, the lattice constant is 17.7 nm.26,27 The red hexagon also shows the centered hexagonal unit cell at the center of which there is a hollow with a diameter of about 10 nm and surrounded by six trimers of the Ax5 molecules. We employed these arrays of the nanometer-scale hollows to accommodate proteins.
 | ||
| Fig. 1 Structures of an annexin A5 (Ax5) monomer and two-dimensional (2D) Ax5 crystal. (a) Ribbon model of the Ax5 monomer having four domains with the same 70 amino acid series, which are numbered from 1 to 4 (PDB code 1ALA). (b) Schematic of the 2D crystal of annexin A5 with a p6 symmetry (unit cell: a1 = a2 = 17.7 nm, β = 120°). | ||
Results and discussion
We prepared the 2D crystal of Ax5 molecules on the SLBs and characterized the structures of the 2D crystal in detail by frequency-modulation AFM (FM-AFM)28 that is capable of ultra-high resolution imaging of biomolecules in liquids.29,30 When a tip is oscillated with an amplitude set close to the decay length of the tip–sample interaction force, the force sensitivity of FM-AFM is significantly enhanced, which provides a resolution higher than that of other conventional AFM methods. Fig. 2a shows a typical FM-AFM image of a p6 2D Ax5 crystal on the SLBs. Clear p6 lattices are observed in Fig. 2a. The white dashed rhombus indicates the unit cell. We found that almost half of the hollow sites were filled with ring-like features. They are also the trimers of the Ax5 molecules which were weakly bound to the surrounding six trimers in the 2D crystal. For simplicity, hereafter, the trimer within the hollow and the trimer forming the 2D crystal are referred to as the H-trimer and C-trimer, respectively.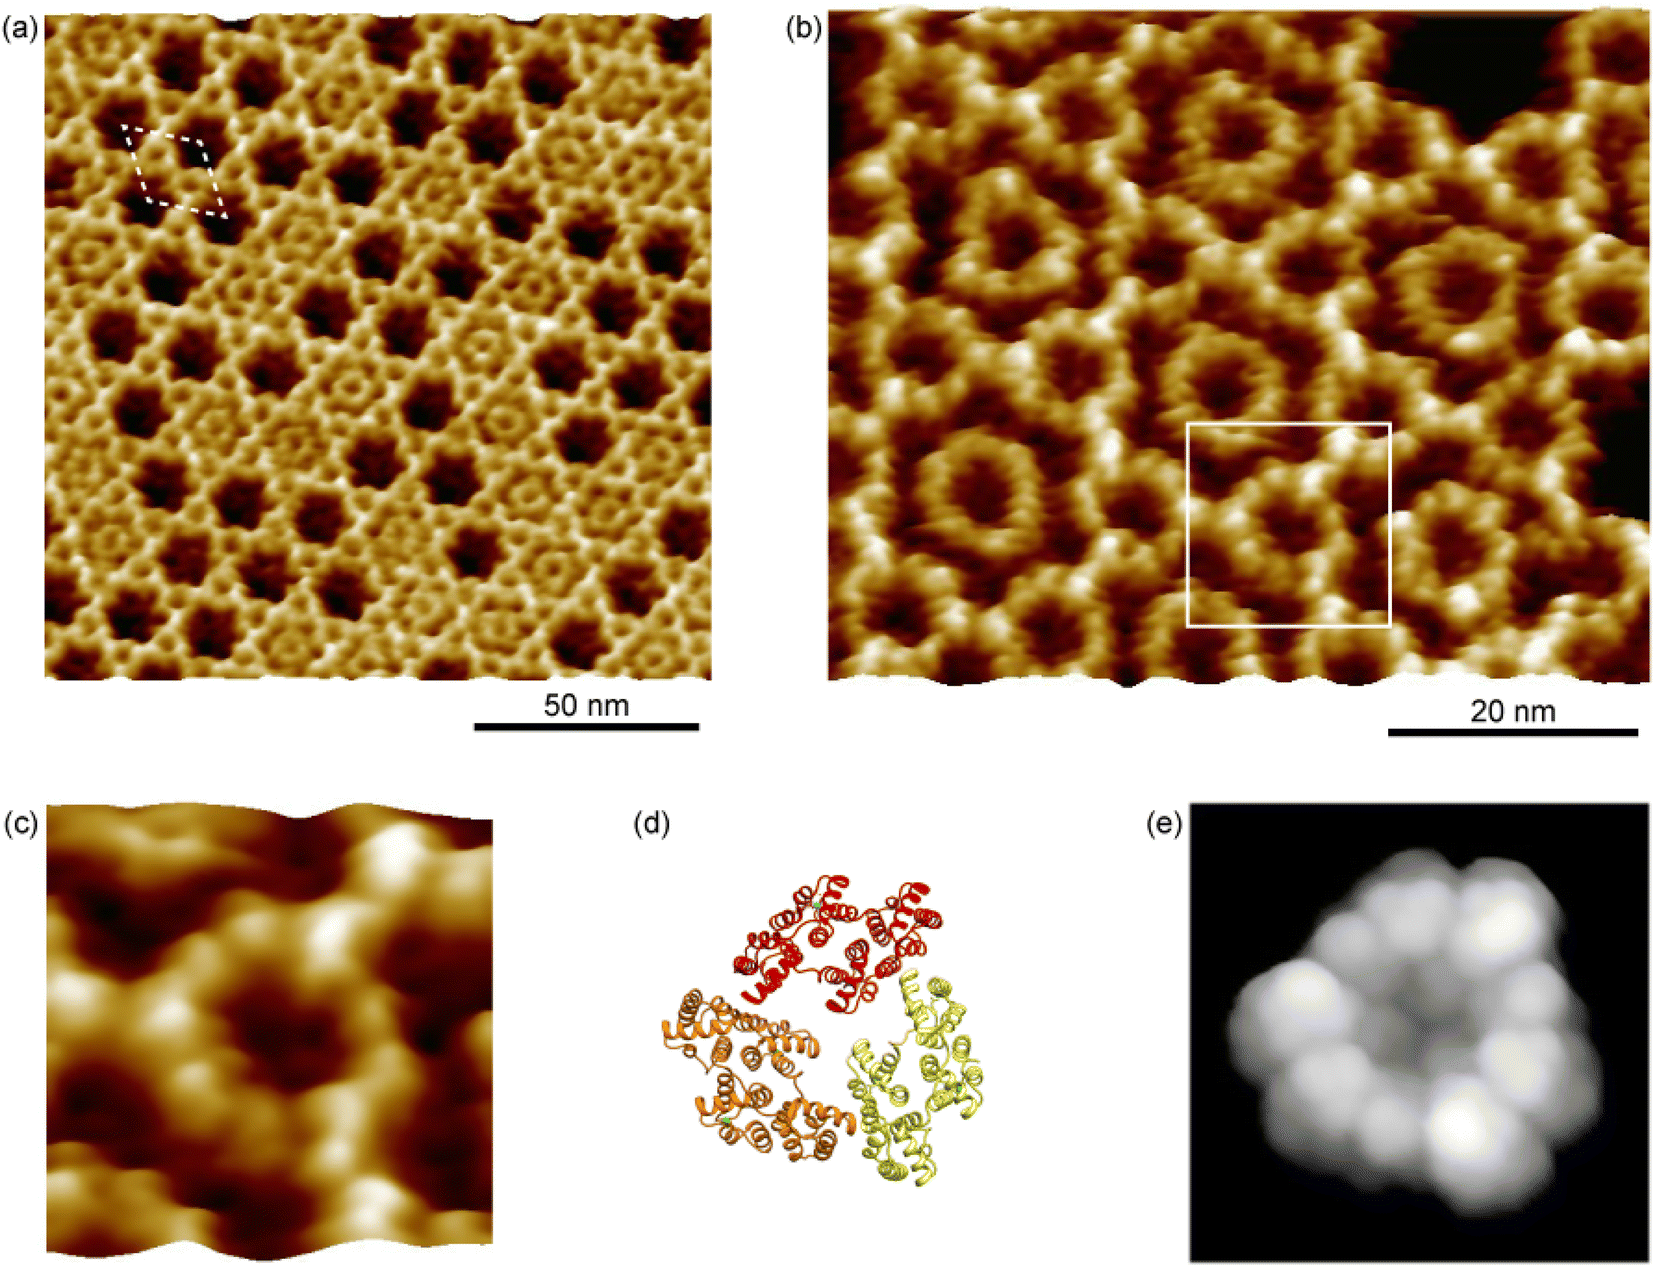 | ||
| Fig. 2 FM-AFM images of the p6 2D annexin A5 crystal. (a) Topographic image of the p6 2D annexin A5 crystal. The white dashed line indicates a unit cell. (b) High-resolution image of the p6 2D annexin A5 crystal. (c) Magnified image of the annexin A5 trimer that consists of the p6 lattice indicated by the white rectangle in (b). (d) Ribbon model of an annexin A5 trimer that corresponds to (c). (e) Simulated AFM image of an annexin A5 trimer shown in (d), assuming the tip radius of 1 nm and cone angle of 10°. | ||
A high-resolution image of the p6 2D Ax5 crystal is shown in Fig. 2b. It shows the ring-like C-trimers connected to each other forming the hexagonal lattice, and most of the hollow sites are filled with the H-trimer. While fine globular structures of the C-trimers were resolved, one of which is enclosed by the white square, fine features were not observed for most of the H-trimers. This result is in good agreement with a recent study by a high-speed AFM study that showed the H-trimer has six stable rotational states and changes its state on a timescale of a second.24 Since it took about 1 minute to obtain the image in Fig. 2b, the temporal resolution was not sufficient to directly visualize the rotational diffusion of the H-trimers but indirectly as the rings without the fine globular structures were resolved. Note that fine globular structures were also resolved in some H-trimers as indicated by the white arrows. This is because there were defects in the surrounding C-trimers. Due to the defects, the rotational states of those H-trimers were pinned so that the trimers were observed as the distorted hexagon and their fine globular features were resolved.
Fig. 2c–e show a magnified image of the C-trimer enclosed by the white square in Fig. 2b, a ribbon model of the Ax5 trimer that corresponds to Fig. 2c, and the simulated AFM image of the Ax5 trimer with a tip radius of 1 nm and a cone angle of 10°, respectively. In Fig. 2e, nine globular structures were observed along the Ax5 trimer ring in the AFM simulation, which correspond to three globular structures per Ax5 monomer corresponding to the domains 1, 3, and 4 in Fig. 1a. However, in Fig. 2c, only nine globular structures were observed. Since the second repeat (the domain 2) in each monomer was lower than the other repeats, they were not clearly resolved by the AFM measurements, while three globular features were resolved in the simulated AFM image in Fig. 2c. Additionally, we found that domain 3 is slightly higher than the other domains because the amino acid loops connecting the second and third repeats are protruding from the surface. It should be noted here that an AFM image of the Ax5 C-trimer with a spatial resolution as high as that of Fig. 2c was recently demonstrated by a data-processing technique called localization AFM based on the high speed AFM dataset.31 It is expected that by data-processing of the C-trimer images obtained by FM-AFM in the same manner the spatial resolution could be further improved.
As already mentioned, we utilized the hollow sites for the protein nanoarray. However, almost half of the hollow sites were filled with the H-trimers in Fig. 2a. To increase the number of unoccupied hollow sites, we changed the incubation time, which is the time after the deposition before the rinse, and investigated the occupancy of the hollow sites with the H-trimers. We found that the occupancy was increased for the longer incubation time when we deposited the Ax5 solution of the same concentration (see ESI Fig. S1†). This result supports the growth model of the 2D Ax5 crystal as suggested by a previous study.20 The Ax5 molecules immediately form trimers upon adsorption onto the SLBs. The Ax5 trimers then diffuse on the SLBs self-assembled into the p6 lattice (C-trimers). After the formation of the p6 lattice, excess trimers (H-trimers) start to fill the hollow sites. We also investigated the effect of the pH of the imaging solution on the occupancy. Fig. 3a–c show topographic images of the 2D Ax5 crystal in 150 mM NaCl and 10 mM CaCl2 containing 10 mM MES-K (2-(N-morpholino)ethanesulfonic acid and KOH) buffer solution (pH 6.0), 10 mM phosphate buffer solution (pH 7.0) and 10 mM Tris–HCl (pH 8.0), respectively. In Fig. 3, the occupancy was increased as the pH value of the imaging solution increased. The percentages of the unoccupied sites, namely vacancies, were calculated from five topographic images including Fig. 3a–c (see ESI Fig. S2†), which were 73.6%, 65.9%, and 56.1% at pH 6.0, 7.0 and 8.0, respectively. In a previous study, it was reported that amino acids that contribute to the formation of the 2D Ax5 crystal are different from those contributing to the interaction between the H-trimer and C-trimer.19 Six amino acids (Gln174, Gln177, Phe180, Thr215, Ile216, Ser217) in the third repeat play an important role in the interaction between adjacent Ax5 molecules forming the 2D Ax5 crystals. Specifically, phenylalanine contributes to the C-trimer–C-trimer interactions by making π-stacking with an adjacent Ax5 molecule. On the other hand, seven other amino acids (Thr215, Ile216, Ser217, Gly218 of the third repeat and Ser295, Tyr297, Ser298 of the fourth repeat) form the interaction between the C-trimer and H-trimer. Since the isoelectric point of most amino acids is around 6, both the C-trimer–C-trimer and C-trimer–H-trimer interactions are supposed to be weakened in the low-pH environment such as in the MES-K buffer solution (pH 6.0). However, the Ax5 molecules still form the 2D crystal because π-stacking does not depend on the pH value. Consequently, only the number of H-trimers decreased in the low-pH environment. We found that the number of vacancies increased by reduction of the incubation time or the pH value of the solution. Although both methods seem to be effective for making a template for the protein nanoarray, there might be a local variation in the density of the vacancies when the incubation time was reduced. Therefore, we performed the experiments in the low-pH solutions to increase the density of the hollow sites in the 2D Ax5 crystal.
 | ||
| Fig. 3 Effect of the pH of the imaging solution on the occupancy. Topographic images of the p6 2D Ax5 crystal obtained in aqueous solutions containing 150 mM NaCl and 10 mM CaCl2 at different pHs, which were (a) 10 mM MES-K buffer solution (pH 6.0), (b) 10 mM phosphate buffer solution (pH 7.0), and (c) 10 mM Tris–HCl (pH 8.0). | ||
We chose SA as a guest protein for the hollow site in the 2D Ax5 crystal. SA is a tetrameric protein and each monomer has a biotin-binding site. The SA tetramer has four biotin-binding sites in total, two of which are located on the same side and the other two on the opposite side. Therefore, when the SA was bound to the biotinylated SLBs, the two biotin binding sites should be exposed to the solid–liquid interface, which can accept biotinylated molecules, since the SA tetramer has a dihedral D2 molecular symmetry with molecular lengths of about 5.4, 5.9, and 4.8 nm along each diad axis.32,33 Considering the size of the SA protein and the hollow site, which has a diameter of about 10 nm, the maximum number of the SA proteins in a hollow site is three.
We prepared the SLBs with biotinylated lipid molecules. We set the concentration of biotinylated lipid in the SLBs at 2%, which was smaller than that in a previous study.34 The lattice constant of the SA 2D crystal is larger than that of the lipid molecules in the SLBs by a factor of about 10, thus there were two biotinylated lipid molecules underneath a single SA molecule. It was the marginal concentration to bind SA molecules to the SLBs via two biotin-binding sites according to a previous study.35 However, we minimized the concentration such that it did not affect the preparation of the 2D Ax5 crystal.
We then prepared the 2D Ax5 crystal on the biotinylated SLBs, and then dropped the SA molecules. The solution pH (pH 7.4) was close to that in Fig. 3b. Since we found the density of the C-trimer increases as a function of the incubation time of Ax5 molecules (see ESI Fig. S1†), we set the incubation time short (5 minutes) in this experiment to increase the number of hollow sites before dropping SA molecules. Fig. 4a shows an FM-AFM image of the 2D Ax5 crystal after dropping the SA molecules. While some hollow sites were filled with the Ax5 trimer or still empty as in the case of Fig. 2a, we can see some globular structures as indicated by white arrows.
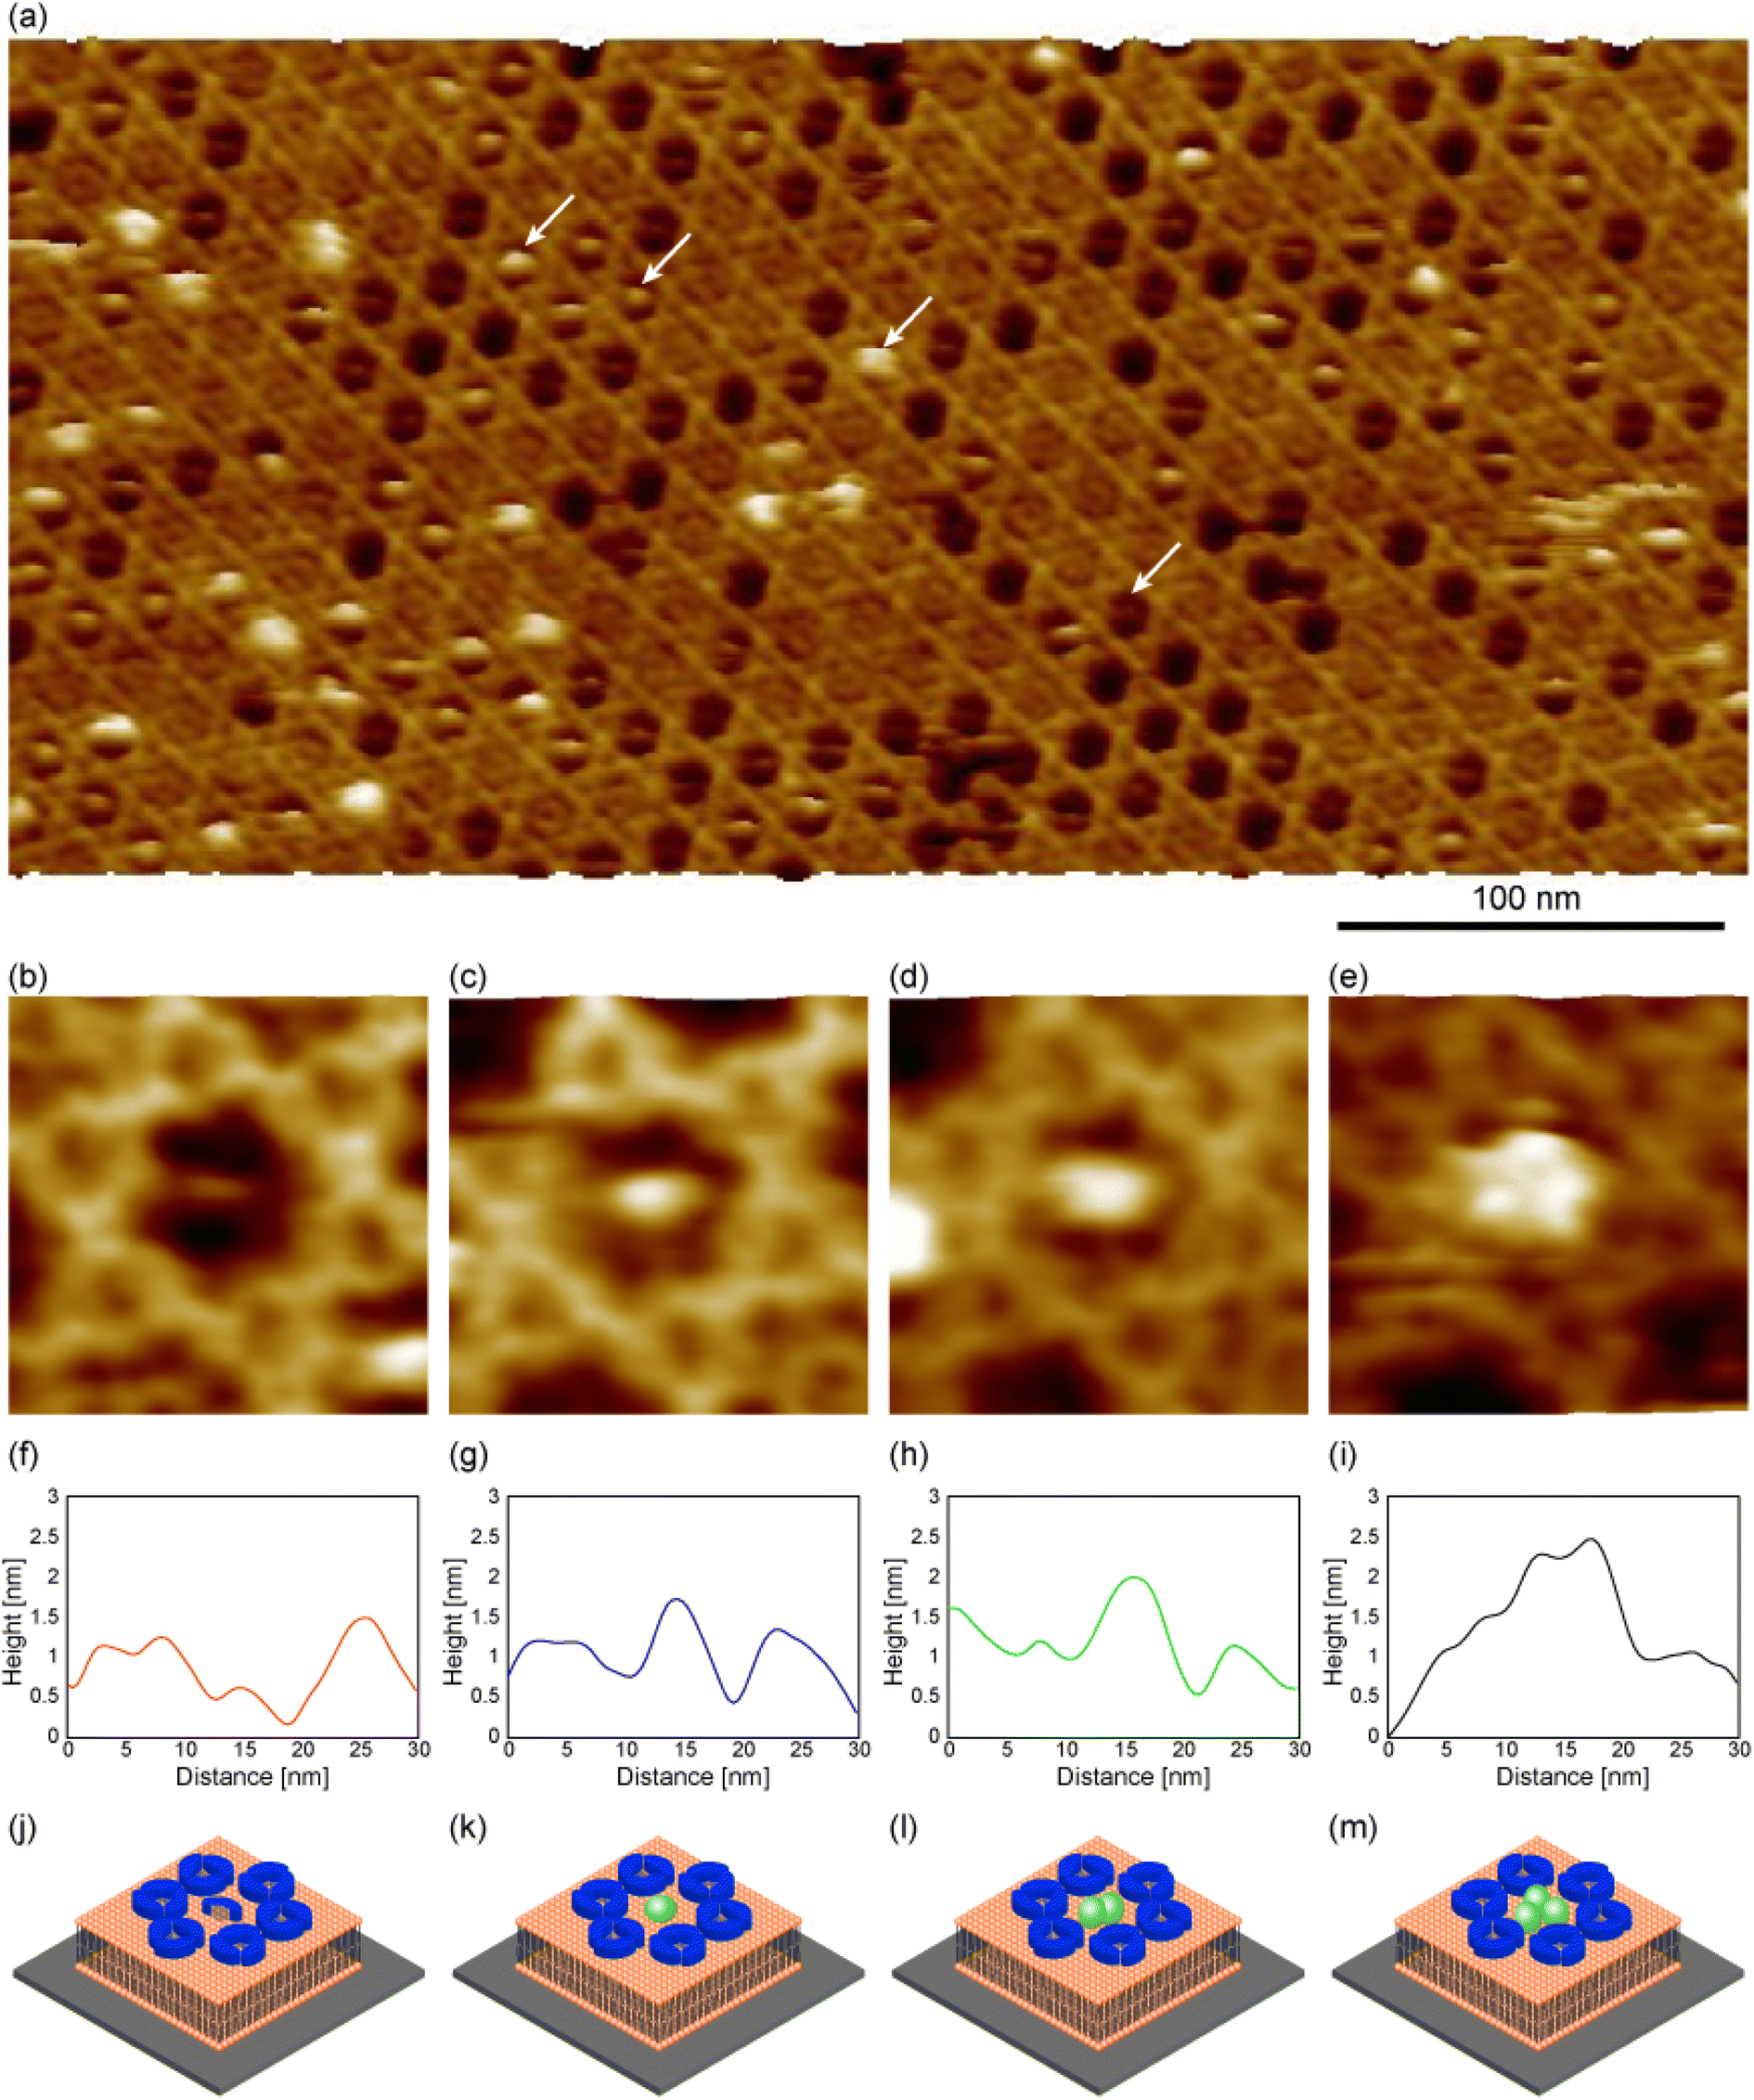 | ||
| Fig. 4 FM-AFM images of the 2D Ax5 crystal after dropping SA molecules. (a) Topographic image of the p6 2D Ax5 crystal after adding streptavidin molecules. (b–e) Magnified images of the hollow sites of the p6 2D Ax5 crystal. (f–i) Cross-sectional profiles along the globular features in (b–e). (j–m) Schematic of the globular molecules inside the hollows in (b–e). Ax5 monomer, SA, lipid molecules, and substrate are shown in blue, green, orange, and gray, respectively. The imaging solution was 10 mM HEPES containing 150 mM NaCl and 10 mM CaCl2 (pH 7.2). | ||
Fig. 4b–e show magnified images of the globular structures of different sizes. Fig. 4f–i show cross-sectional profiles along the globular structures shown in Fig. 4b–e, respectively. To facilitate a comparison of the globular structures, the height axis of each profile was adjusted to align the height of the C-trimer surface at 3.5 nm. This alignment was chosen as the height of the C-trimer itself measured approximately 3.5 nm. The height of the globular structure in Fig. 4b was lower than that of the C-trimer by 0.5 nm (Fig. 4f). Since many globular features similar to this were also observed in the 2D Ax5 crystal before dropping the SA molecules, they were identified as the Ax5 monomers. A schematic of the Ax5 monomer inside the hollow is shown in Fig. 4j. In Fig. 4c, the height of the globular feature was about 4 nm. This value corresponds to the size of the SA molecule. Therefore, this result suggests that a single SA molecule filled the hollow site as schematically shown in Fig. 4k. In Fig. 4d, the globular feature had the same height as that in Fig. 4c, but wider than that in Fig. 4c. Therefore, we identified the globular structure in Fig. 4d as two SA molecules, as shown in Fig. 4l. Finally, in Fig. 4e, the three globular structures were visualized. As shown in the profile in Fig. 4i, the height of the globular structures ranged from 4.7 nm to 5 nm, which is comparable to the molecular size of the SA molecule. This result suggests that at most three streptavidin molecules fill the hollow site of the 2D Ax5 crystal with a p6 symmetry.
Fig. 5a shows an FM-AFM image of the SA nanoarrays prepared by dropping a large amount of the SA molecules onto the 2D Ax5 crystal on the biotinylated SLBs in the low-pH environment (pH 6.0), which is the same condition as that of Fig. 3a. This figure shows that most of the hollow sites were occupied by the SA molecules, which appear as protrusions. A cross-sectional profile along the line A–B in Fig. 5a is shown in Fig. 5b. The kinks indicated by the black arrows correspond to the C-trimer, and the height of the protrusions from the C-trimers was about 1.1 nm, as indicated by the dashed lines, which was in agreement with the height of the SA molecules observed in Fig. 4e. Therefore, we consider that three SA molecules occupied all the vacancies of the p6 2D Ax5 crystal in this experiment, as schematically shown in Fig. 5c. The inset in Fig. 5a shows a magnified image of the streptavidin nanoarray. As indicated by the red arrow in the inset, the H-trimers were observed in the remaining hollow sites. This result suggests that the SA molecules do not replace the H-trimers adsorbed prior to the application of the SA molecules.
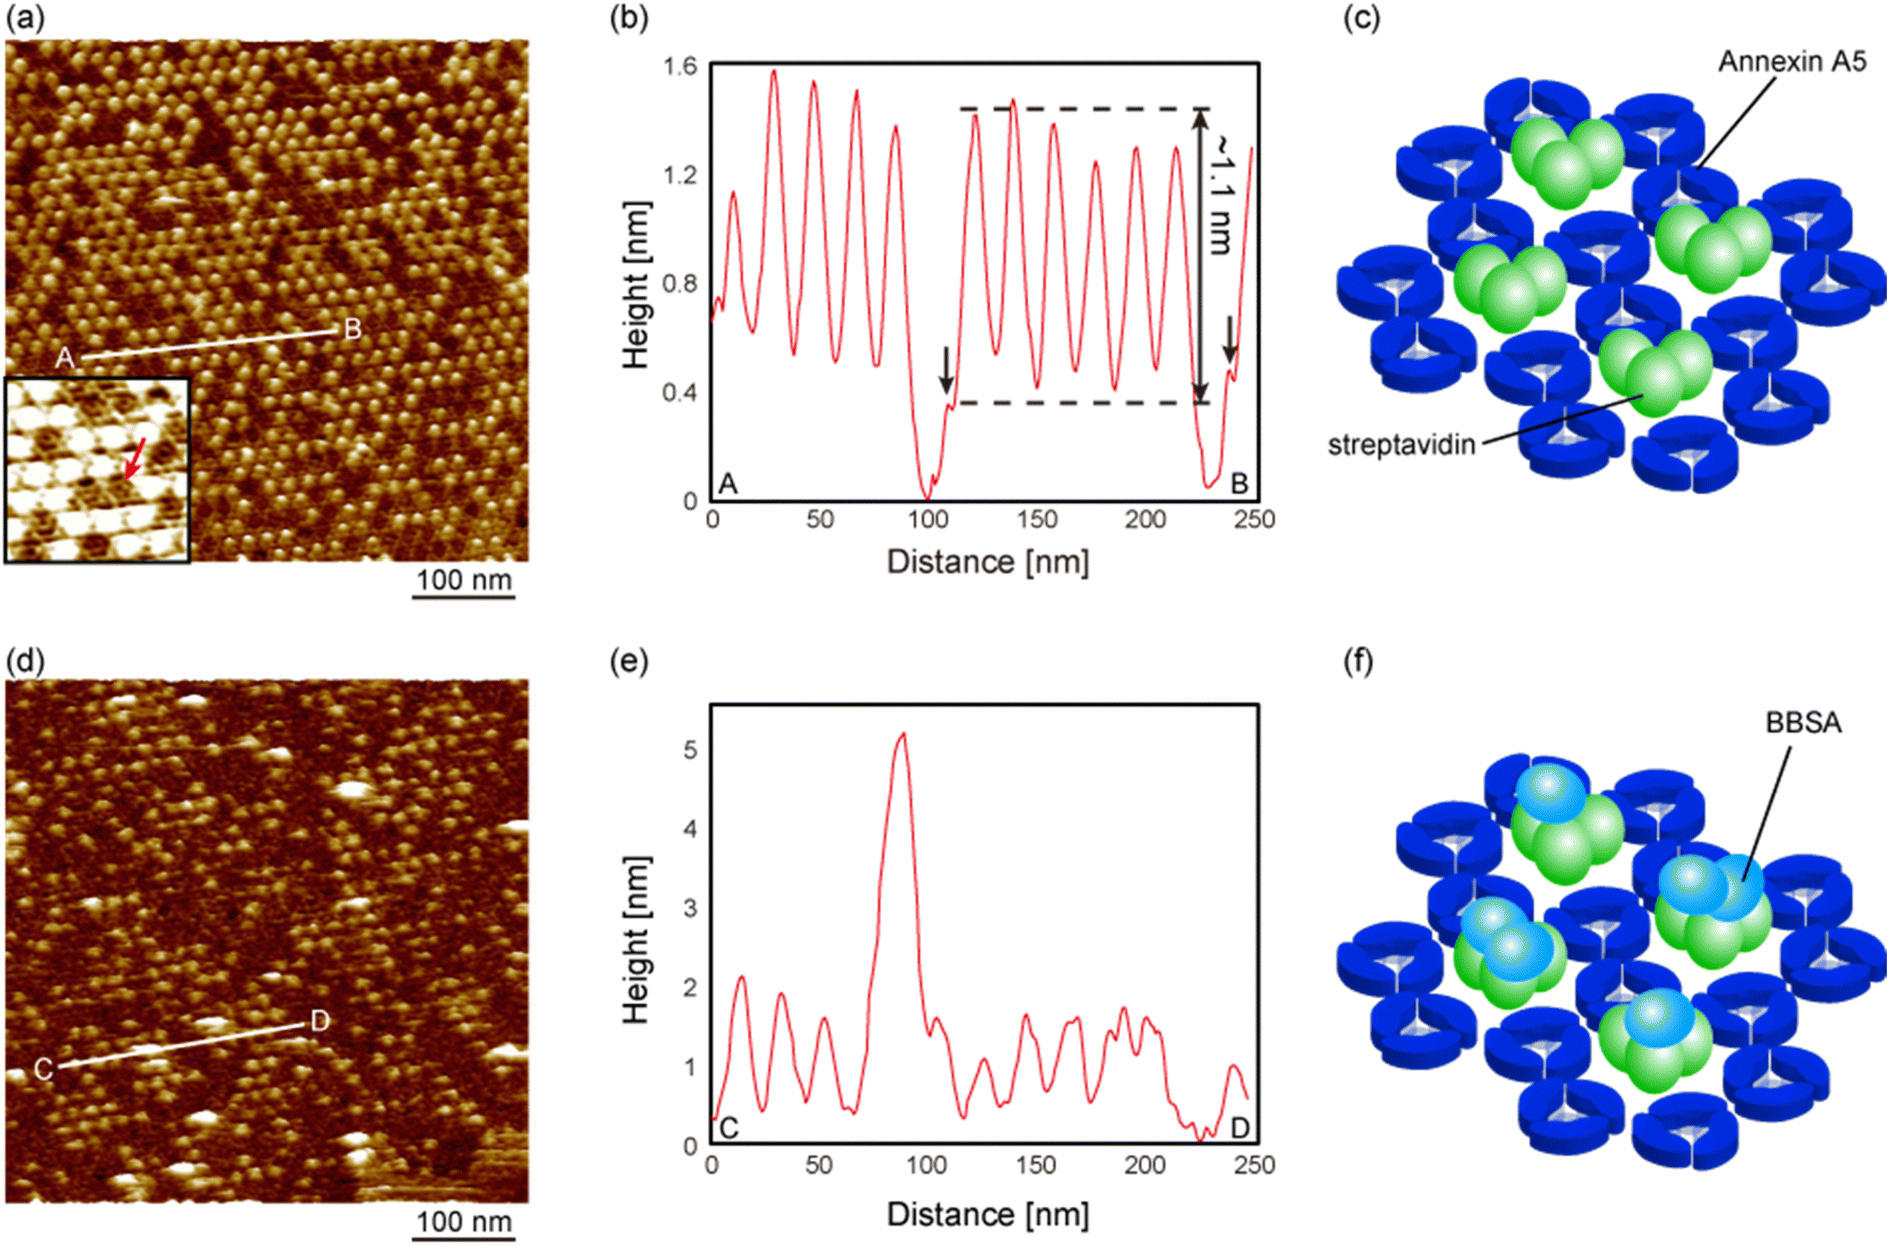 | ||
| Fig. 5 FM-AFM images of the streptavidin (SA) nanoarray interacting with biotinylated bovine serum albumin (BBSA). (a) Topographic image of the SA nanoarray using the 2D annexin A5 crystal after adding streptavidin molecules. Inset shows a magnified image of the SA nanoarray. As shown by the red arrow, the annexin A5 trimers were observed in the vacancies of the SA nanoarray. (b) Cross-sectional profile of the line A–B in (a). (c) Schematic model of the SA nanoarray using the 2D annexin A5 crystal. (d) Topographic image of the SA nanoarray after dropping BBSA molecules. (e) Cross-sectional profile of the line C–D in (d). (f) Schematic model of the SA nanoarray binding BBSA molecules. The imaging solution was 10 mM MES-K buffer solution containing 150 mM NaCl and 10 mM CaCl2 (pH 6.0). | ||
Next, we deposited the biotinylated bovine serum albumin (BBSA), which has twelve biotin molecules, onto the SA nanoarrays to confirm the biological activities of the SA molecules. Fig. 5d shows an FM-AFM image of the SA nanoarray after the deposition of the BBSA molecules. Several large adsorbates were observed on the SA molecules, as indicated by the arrows. Note that the number of SA molecules was reduced due to the additional rinse after the deposition of the BBSA molecules. A cross-sectional profile of the line C–D in Fig. 5d is shown in Fig. 5e. The height of the adsorbate was about 2–3 nm, which corresponds to the height of the BBSA molecule obtained from the protein data bank data.
This result suggests that the BBSA molecules were bound to the SA molecules in the nanoarray, as schematically shown in Fig. 5f, and the biotin-binding capability of the SA molecules in the nanoarray was still active. It has been shown by a previous study34 that biotinylated proteins on the SA 2D crystal remain even after rinse because of their specific binding to the SA while other proteins were washed away. In previous work, we also confirmed by AFM, in the same manner, the antigen-binding activity of the antibodies attached to the substrate and, similarly found that the antigen molecules remained attached to the antibodies while non-antigen molecules were washed away.36 We consider the BBSA molecules that were not washed away after rinse were bound to SA molecules otherwise washed away during rinse likewise the previous studies. On the other hand, the orientation of SA molecules in the SA 2D crystal is well known from the previous studies: two binding sites facing downward and bound to biotinylated lipid molecules and the other two binding sites exposed on the surface. Since the SA molecules in the hollow sites in Fig. 5a were bound to the biotinylated lipid molecules, it is considered that they have the same or similar orientation to those in the 2D crystal, which explains the biotin-binding ability of SA molecules in the hollow sites.
While the SA molecules in the hollow sites were not washed away by the four times of rinse, some SA molecules were removed after dropping BBSA molecules. This is probably because the concentration of biotinylated lipid molecules was marginal to bind SA molecules to the SLBs via two biotin-binding sites,35 which means some SA molecules were weakly bound via only one biotin-binding site to the SLBs. Those weakly bound SA molecules could have been removed upon forming the BBSA–SA–lipid assembly which was relatively a large molecular assembly. It is expected that large BBSA–SA–lipid assemblies were relatively easily removed by rinse from the fluid SLBs especially when the SA molecule was bound only to one lipid molecule.35 Therefore we consider that some SA molecules were removed only after BBSA binding is another proof of the biotin-binding activity of SA molecules. For AFM study of the binding process, it is often necessary to rinse the adsorbate solution before AFM imaging of the attached adsorbates. However, if the rinse process removes some adsorbates likewise in this study, it is better to perform AFM imaging in situ or study the adsorption kinetics by other analytical methods such as surface plasmon resonance15 or fluorescence.16,17
Next, we calculated the number of SA molecules in the nanoarray. Since the lattice constant of the p6 2D Ax5 crystal is 17.7 nm, the ideal density of the hollow sites that can trap the proteins was calculated as 3.7 × 1011 cm−2. Considering that the percentage of the vacancies of the 2D Ax5 crystals in the low-pH environment was about 80% at most, the realistic density of the hollow sites was about 2.7 × 1011 cm−2. In this study, we chose the SA molecules as guest proteins and found that the maximum number of the SA molecules in each hollow site was three. Therefore, the maximum density of the SA molecules on the surface was calculated as 8.1 × 1011 cm−2. Since each SA molecule has two biotin binding sites exposed on the nanoarray surface, the density of the biotin binding sites of the SA nanoarray was calculated to be 1.6 × 1012 cm−2. Since we used a square mica sheet with an area of 1 cm−2, a massive number (1012) of SA molecules were assumed to be arranged on a centimeter-scale mica sheet.
It is important for protein nanoarrays to have a uniform density of the proteins. The SA nanoarrays presented here are regular with some defects, of whose density can be controlled by changing pH after preparation of the Ax5 crystal to a certain extent. It should be noted that we can only use the low-pH buffer for preparation of the Ax5 template with less occupied sites, and we can use the buffer with a higher pH that is safe for the proteins of interest.
Conclusions
In conclusion, 2D Ax5 crystals were visualized on a sub-molecular scale by using FM-AFM under physiological conditions. By comparison with the simulation, we found that loops connecting the second and third repeats were higher than the other repeats. Furthermore, we suggest a new technique for protein patterning by using the 2D Ax5 crystal. We demonstrated the fabrication of the SA nanoarray on the SLBs. The SA molecules were arranged with a period of 17.7 nm, which is the lattice constant of the 2D Ax5 crystal, by dropping the SA molecules after forming the lattices of Ax5 molecules. In addition, the biological activity of the SA molecule forming the nanoarray was confirmed by dropping the BBSA molecules onto the SA nanoarray.In this study, we chose the BBSA molecules as target molecules and successfully detected the bound BBSA molecules on the SA nanoarray. The target molecule was not only limited to the BBSA, but any biotinylated molecules can be used as the target molecules. Since the specific binding of biotin molecules to SA is relatively strong,14 they have also been used to fabricate the immuno sensor by fixing the biotinylated antibodies on the lipid bilayers using SA proteins.15–17 If we attach biotinylated antibodies to the SA nanoarrays, the exposed receptors are changed from the SA molecules to the antibodies, namely we can fabricate antibody nanoarrays based on the SA nanoarray. This means that the SA nanoarray is applicable for sensing not only biotinylated molecules but also non-biotinylated molecules. It should also be noted that the guest molecule in the Ax5 hollow sites presented here was not only limited to the SA molecules, but they can be any proteins that have affinities to the specific lipid molecules in the SLBs. For example, it is even possible to directly tether the antibodies on the lipid bilayers using functionalized lipid molecules, as demonstrated in previous studies.12,37 We believe that this technique can be used for the development of protein 2D arrays and be applied to biotechnological platforms such as biosensors or bioassays.
Methods
Supported lipid bilayers
Dioleoylphosphatidylcholine (DOPC) (Avanti polar lipids) and dioleoylphosphatidylserine (DOPS) (Avanti polar lipids) molecules were dissolved in chloroform at a weight ratio of 65![[thin space (1/6-em)]](https://www.rsc.org/images/entities/char_2009.gif) :35. The mixture of lipids in a test tube was dried to form a thin lipid film. The dried lipid films were immersed in 10 mM HEPES (Sigma-Aldrich) containing 150 mM NaCl (Sigma-Aldrich) and 10 mM CaCl2 (Sigma-Aldrich). The lipid solution was sonicated to form a vesicle and diluted with the same solution to a final concentration of 0.1 mg mL−1. A 40 μL droplet of the lipid solution was dropped onto a freshly cleaved mica substrate. 30 minutes later, the substrate was gently rinsed with the same solution.
:35. The mixture of lipids in a test tube was dried to form a thin lipid film. The dried lipid films were immersed in 10 mM HEPES (Sigma-Aldrich) containing 150 mM NaCl (Sigma-Aldrich) and 10 mM CaCl2 (Sigma-Aldrich). The lipid solution was sonicated to form a vesicle and diluted with the same solution to a final concentration of 0.1 mg mL−1. A 40 μL droplet of the lipid solution was dropped onto a freshly cleaved mica substrate. 30 minutes later, the substrate was gently rinsed with the same solution.
Annexin A5 (Ax5)
Annexin A5 (Sigma-Aldrich) was dissolved in 10 mM HEPES containing 150 mM NaCl and 10 mM CaCl2 at a final concentration of 40–70 μg mL−1. A 20 μL droplet of the Ax5 solution was deposited onto the SLBs. After waiting 20 minutes, the surface was carefully rinsed four times with an imaging solution that consisted of 10 mM HEPES containing 150 mM NaCl and 10 mM CaCl2. The FM-AFM imaging was performed without drying the sample.Biotinylated SLBs and streptavidin
SLBs containing DOPC, DOPS and 1,2-dioleoyl-sn-glycero-3-phosphoethanolamine-N-(cap-biotinyl) (biotin-cap-DOPE) (Avanti polar lipids) (74:24:2, weight ratio) were made by the same method previously described. A 20 μL droplet of the Ax5 solution was dropped onto the biotinylated SLBs. After incubation for 5 minutes, the substrate was rinsed four times with the imaging solution. Streptavidin (Nakarai tesque) was dissolved in 10 mM phosphate buffer solution (pH 7.5) at a concentration of 1 mg mL−1. After removing the imaging solution, a 10 μL droplet of the streptavidin solution was dropped onto the 2D Ax5 crystal. The substrate was rinsed four times with the imaging solution after waiting 5 minutes. We then performed the FM-AFM imaging without drying the sample.
FM-AFM imaging
A customized AFM instrument (SPM-9500, Shimadzu)38 and a home-built digital controller programed in LabVIEW (National Instruments) were used. We used silicon cantilevers with an Au coating on the detector side (Fig. 2: Arrow™UHFAuD, Nanoworld, Fig. 3 and 4: Tap300GD-G, Innovative Solutions Bulgaria, Ltd.). The resonance frequency and nominal spring constant in the liquids were 400 kHz and 5 N m−1 (Arrow™UHFAuD), 130 kHz and 40 N m−1 (Tap300GD-G), respectively. The cantilever was oscillated by a photothermal excitation method, and the oscillation amplitude was 0.5 nm. The frequency shift was detected by HF2LI (Zurich Instruments). WSxM (Nanotech Electronica)39 was used to analyze the obtained AFM images.AFM simulation
GeomAFM Simulator software (version 1.1) in the SPM Sim Software Suite, developed by Prof. M. Tsukada and co-workers under the JST SENTAN Program, was used for the simulation of the AFM image of the Ax5 trimer by calculating the tip trajectory when the conical tip touched and followed the outermost atoms. The tip was modeled as a sphere with a radius of 1 nm and a cone angle of 10°.Author contributions
H. K. performed AFM imaging, analysed data and wrote the paper. Y. H. prepared the biological sample. H. Y. designed the study and analysed data and wrote the paper. K. K. developed AFM instruments and electronics and wrote the paper.Conflicts of interest
The authors declare no competing financial interests.Acknowledgements
This work was supported by Grant-in-Aid for Scientific Research from Japan Society for the Promotion of Science, JSPS KAKENHI Grant Numbers 17H06122, 19H02598, and 22H00294.References
- C. Wingren and C. A. K. Borrebaeck, Progress in Miniaturization of Protein Arrays—a Step Closer to High-Density Nanoarrays, Drug Discovery Today, 2007, 12, 813–819 CrossRef CAS PubMed.
- Y. Liu and J. Yu, Oriented Immobilization of Proteins on Solid Supports for Use in Biosensors and Biochips: a Review, Microchim. Acta, 2016, 183, 1–19 CrossRef CAS.
- K. L. Christman, V. D. Enriquez-Rios and H. D. Maynard, Nanopatterning Proteins and Peptides, Soft Matter, 2006, 2, 928–939 RSC.
- A. Kuzuya, M. Kimura, K. Numajiri, N. Koshi, T. Ohnishi, F. Okada and M. Komiyama, Precisely Programmed and Robust 2D Streptavidin Nanoarrays by Using Periodical Nanometer-Scale Wells Embedded in DNA Origami Assembly, ChemBioChem, 2009, 10, 1811–1815 CrossRef CAS PubMed.
- K.-B. Lee, S.-J. Park, C. A. Mirkin, J. C. Smith and M. Mrksich, Protein Nanoarrays Generated by Dip-Pen Nanolithography, Science, 2002, 295, 1702–1705 CrossRef CAS PubMed.
- R. V. Martínez, J. Martínez, M. Chiesa, R. Garcia, E. Coronado, E. Pinilla-Cienfuegos and S. Tatay, Large-scale Nanopatterning of Single Proteins Used as Carriers of Magnetic Nanoparticles, Adv. Mater., 2010, 22, 588–591 CrossRef PubMed.
- Y. Suzuki, M. Endo and H. Sugiyama, Lipid-Bilayer-Assisted Two-Dimensional Self-Assembly of DNA Origami Nanostructures, Nat. Commun., 2015, 6, 8052 CrossRef CAS PubMed.
- K. Numajiri, T. Yamazaki, M. Kimura, A. Kuzuya and M. Komiyama, Discrete and Active Enzyme Nanoarrays on DNA Origami Scaffolds Purified by Affinity Tag Separation, J. Am. Chem. Soc., 2010, 132, 9937–9939 CrossRef CAS PubMed.
- H. Li, S. H. Park, J. H. Reif, T. H. LaBean and H. Yan, DNA-Templated Self-Assembly of Protein and Nanoparticle Linear Arrays, J. Am. Chem. Soc., 2004, 126, 418–419 CrossRef CAS PubMed.
- D. N. Selmi, R. J. Adamson, H. Attrill, A. D. Goddard, R. J. C. Gilbert, A. Watts and A. J. Turberfield, DNA-Templated Protein Arrays for Single-Molecule Imaging, Nano Lett., 2011, 11, 657–660 CrossRef CAS PubMed.
- L. K. Tamm and H. M. McConnell, Supported phospholipid bilayers, Biophys. J., 1985, 47, 105–113 CrossRef CAS PubMed.
- E. Sackmann, Supported Membranes: Scientific and Practical Applications, Science, 1996, 271, 43–48 CrossRef CAS PubMed.
- J. Andersson, P. Bilotto, L. L. E. Mears, S. Fossati, U. Ramach, I. Köper, M. Valtiner and W. Knoll, Solid-supported lipid bilayers – A versatile tool for the structural and functional characterization of membrane proteins, Methods, 2020, 180, 56–68 CrossRef CAS PubMed.
- N. Michael, Green. Avidin and Streptavidin, Methods Enzymol., 1990, 184, 51–67 Search PubMed.
- E. Gizeli, M. Liley, C. R. Lowe and H. Vogel, Antibody Binding to a Functionalized Supported Lipid Layer: A Direct Acoustic Immunosensor, Anal. Chem., 1997, 69, 4808–4813 CrossRef CAS PubMed.
- M. F. Sánchez, V. Levi, T. Weidemann and D. C. Carrer, Agonist mobility on supported lipid bilayers affects Fas mediated death response, FEBS Lett., 2015, 589, 3527–3533 CrossRef PubMed.
- H.-Y. Liu, R. Kumar, C. Zhong, S. Gorji, L. Paniushkina, R. Masood, U. A. Wittel, H. Fuchs, I. Nazarenko and M. Hirtz, Rapid Capture of Cancer Extracellular Vesicles by Lipid Patch Microarrays, Adv. Mater., 2021, 33, 2008493 CrossRef CAS PubMed.
- V. Gerke, C. E. Creutz and S. E. Moss, Annexins: Linking Ca2+ Signalling to Membrane Dynamics, Nat. Rev. Mol. Cell Biol., 2005, 6, 449–461 CrossRef CAS PubMed.
- P. Raynal and H. B. Pollard, Annexins: the Problem of Assessing the Biological Role for a Gene Family of Multifunctional Calcium- and Phospholipid-Binding Proteins, Biochim. Biophys. Acta, 1994, 1197, 63–93 CrossRef CAS PubMed.
- A. Bouter, C. Gounou, R. Bérat, S. Tan, B. Gallois, T. Granier, B. L. d'Estaintot, E. Pöshl, B. Brachvogel and A. R. Brisson, Annexin-A5 Assembled into Two-Dimensional Arrays Promotes Cell Membrane Repair, Nat. Commun., 2011, 2, 270 CrossRef PubMed.
- I. Reviakine, W. Bergsma-Schutter and A. Brisson, Growth of Protein 2-D Crystals on Supported Planar Lipid Bilayers Imaged in situ by AFM, J. Struct. Biol., 1998, 121, 356–362 CrossRef CAS PubMed.
- I. Reviakine, W. Bergsma-Schutter, C. Mazères-Dubut, N. Govorukhina and A. Brisson, Surface Topography of the p3 and p6 Annexin V Crystal Forms Determined by Atomic Force Microscopy, J. Struct. Biol., 2000, 131, 234–239 CrossRef CAS PubMed.
- T. Ando, T. Uchihashi and S. Scheuring, Filming Biomolecular Processes by High-Speed Atomic Force Microscopy, Chem. Rev., 2014, 114, 3120–3188 CrossRef CAS PubMed.
- A. Miyagi, C. Chipot, M. Rangl and S. Scheuring, High-Speed Atomic Force Microscopy Shows That Annexin V Stabilizes Membranes on the Second Timescale, Nat. Nanotechnol., 2016, 11, 783–790 CrossRef CAS PubMed.
- M. C. Bewley, C. M. Boustead, J. H. Walker and D. A. Waller, Structure of Chicken Annexin V at 2.25-Å Resolution, Biochemistry, 1993, 32, 3923–3929 CrossRef CAS PubMed.
- D. Voges, R. Berendes, A. Burger, P. Demange, W. Baumeister and R. Huber, Three-Dimensional Structure of Membrane-Bound Annexin V: a Correlative Electron Microscopy-X-ray Crystallography Study, J. Mol. Biol., 1994, 238, 199–213 CrossRef CAS PubMed.
- F. Oling, W. Bergsma-Schutter and A. Brisson, Trimers, Dimers of Trimers, and Trimers of Trimers are Common Building Blocks of Annexin A5 Two-Dimensional Crystals, J. Struct. Biol., 2001, 133, 55–63 CrossRef CAS PubMed.
- T. R. Albrecht, P. Grütter, D. Horne and D. Rugar, Frequency Modulation Detection Using High-Q Cantilevers for Enhanced Force Microscope Sensitivity, J. Appl. Phys., 1991, 69, 668–673 CrossRef.
- H. Asakawa, K. Ikegami, M. Setou, N. Watanabe, M. Tsukada and T. Fukuma, Submolecular-Scale Imaging of α-Helices and C-Terminal Domains of Tubulins by Frequency Modulation Atomic Force Microscopy in Liquid, Biophys. J., 2011, 101, 1270–1276 CrossRef CAS PubMed.
- H. Asakawa, S. Yoshioka, K. Nishimura and T. Fukuma, Spatial Distribution of Lipid Headgroups and Water Molecules at Membrane/Water Interfaces Scanning Force Microscopy, ACS Nano, 2012, 6, 9013–9020 CrossRef CAS PubMed.
- G. R. Heath, E. Kots, J. L. Robertson, S. Lansky, G. Khelashvili, H. Weinstein and S. Scheuring, Localization Atomic Force Microscopy, Nature, 2020, 594, 385–404 CrossRef PubMed.
- W. A. Hendrickson, A. Pahler, J. L. Smith, Y. Satow, E. A. Merritt and R. P. Phizackerley, Crystal Structure of Core Streptavidin Determined from Multiwavelength Anomalous Diffraction of Synchroron Radiation, Proc. Natl. Acad. Sci. U. S. A., 1989, 86, 2190–2194 CrossRef CAS PubMed.
- D. M. Czajkowsky, L. Li, J. Sun, J. Hu and Z. Shao, Heteroepitaxial Streptavidin Nanocrystals Reveal Critical Role of Proton “Fingers” and Subsurface Atoms in Determining Adsorbed Protein Orientation, ACS Nano, 2012, 6, 190–198 CrossRef CAS PubMed.
- D. Yamamoto, N. Nagura, S. Omote, M. Taniguchi and T. Ando, Streptavidin 2D Crystal Substrates for Visualizing Biomolecular Processes by Atomic Force Microscopy, Biophys. J., 2009, 97, 2358–2367 CrossRef CAS PubMed.
- P. H. E. Hamming and J. Huskens, Streptavidin Coverage on Biotinylated Surfaces, ACS Appl. Mater. Interfaces, 2021, 13, 58114–58123 CrossRef CAS PubMed.
- S. Ido, H. Kimiya, K. Kobayashi, H. Kominami, K. Matsushige and H. Yamada, Immunoactive Two-Dimensional Self-Assembly of Monoclonal Antibodies in Aqueous Solution Revealed by Atomic Force Microscopy, Nat. Mater., 2014, 13, 264–270 CrossRef CAS PubMed.
- M. Egger, S. P. Heyn and H. E. Gaub, Two-dimensional recognition pattern of lipid-anchored fab’ fragments, Biophys. J., 1990, 57, 669–673 CrossRef CAS PubMed.
- K. Kobayashi, N. Oyabu, S. Ido, K. Suzuki, T. Imai, K. Tagami, M. Tsukada and H. Yamaka, Visualization of Hydration Layers on Muscovite Mica in Aqueous Solution by Frequency-Modulation Atomic Force Microscopy, J. Chem. Phys., 2013, 138, 184704 CrossRef PubMed.
- I. Horcas, R. Fernández, J. M. Gómez-Rodríguez, J. Colchero, J. Gómez-Herrero and A. M. Baro, WSXM: A Software for Scanning Probe Microscopy and a Tool for Nanotechnology, Rev. Sci. Instrum., 2007, 78, 013705 CrossRef CAS PubMed.
Footnote |
| † Electronic supplementary information (ESI) available. See DOI: https://doi.org/10.1039/d3na00335c |
| This journal is © The Royal Society of Chemistry 2023 |