 Open Access Article
Revolutionizing fuel production through biologically synthesized zero-dimensional nanoparticles†
Yogeshwari
Vyas
a,
Priyanka
Chundawat
a,
Dharmendra
Dharmendra
a,
Purnima
Chaubisa
a,
Mukesh
Kumar
b,
Pinki B.
Punjabi
a and
Chetna
Ameta
 *a
*a
aPhotochemistry Laboratory, Department of Chemistry, University College of Science, M.L. Sukhadia University, Udaipur-313001, Rajasthan, India. E-mail: chetna.ameta@yahoo.com
bDepartment of Chemistry, Sahu Jain Degree College, Affiliated toM. J. P. Rohilkhand University, Bareilly, Najibabad, Bijnor-246763, India
First published on 23rd August 2023
Abstract
The sustainable management of wastewater and the production of clean fuel with a reduced carbon footprint require innovative methods, including photocatalytic degradation of pollutants and hydrogen generation. To achieve this, biosynthesized photocatalysts are necessary, with carbon quantum dots (CQDs) being a promising candidate for achieving this goal. In this study, CQDs were prepared from water caltrop peels and a composite of greenly synthesized CQDs with copper selenide (CuSe) was used for the photocatalytic degradation of pollutants and production of fuel. Thymol blue (TB) and Congo red (CR) were chosen as model dyes for degradation studies, with optimized reaction conditions being determined by varying the dose, pH, intensity, and concentration of dyes. The composite (CuSe@CQDs) showed a degradation rate of 99.4% and 97.8% for TB and CR, respectively, within 60 minutes, with a corresponding hydrogen production rate of 2360 and 1875 μmol g−1 h−1. The yield of hydrogen production using the composite was 35.7 and 29 times greater than that of CuSe alone for TB and CR, respectively. Spectroscopic techniques such as XRD, UV-Vis, FESEM, HRTEM, XPS, FTIR, BET, and TGA were used to characterize the composite, and the results revealed that the composite had superior degradation rates compared to CuSe alone, with the degradation rate being enhanced by about three times. GCMS analysis was used to investigate the intermediate and possible degradation pathways. Overall, this study highlights the potential of biosynthesized CQDs as effective photocatalysts for the sustainable management of wastewater and production of fuel.
1 Introduction
The rapid growth of the printing and textile industries has resulted in a significant increase in the volume of wastewater generated during their production processes.1 The presence of pollutants in effluents poses significant hazards to the environment, humans, and animals alike. Therefore, it is imperative to develop new technologies for handling sewage water contaminated with dyes. Although various physical and chemical treatments exist to treat effluents, there are still gaps in our knowledge and understanding of how to effectively address these pollutants. Photocatalysis offers a ray of hope since it is simple, does not require expensive instruments, is eco-friendly, and more efficient.2,3 The ability to reuse the catalyst multiple times consecutively and its enhanced reactivity with pollutants are key features.4 Nanomaterials have gained significant attention in the catalytic degradation of various organic contaminants due to their superior stability, improved efficacy, and larger surface area for reaction.5,6 Metal chalcogenide nanostructures have gained popularity among researchers due to their unique electronic properties.7,8 Metal chalcogenides have been proven to exhibit high activity in degrading dyes in just a few hours.9,10 Although nanomaterials offer a larger surface area and higher energy, they can suffer from self-agglomeration, which can reduce their efficiency. To address this issue, composites are often created to enhance their effectiveness.11–13 However, the high pressure and temperature required for the preparation of these composites make the process uneconomical. As such, researchers are in need of cheaper and more environmentally friendly materials to address this issue and enable the use of catalysts for large-scale effluent treatment.Carbon quantum dots (CQDs) are sub-10 nm zero-dimensional particles14 that were discovered accidentally during the synthesis of carbon nanotubes by Xu et al.15 CQDs can be prepared using either a top-down or bottom-up approach. Top-down approaches involve the slicing of bulk materials into small dots, with etching (electrochemical) and laser ablation being common methods. Cui et al.16 used a laser technique to prepare CQDs on carbon cloth, while Ming et al.17 fabricated zero-dimensional CQDs through etching pure water.
Carbonization, solvothermal, MW illumination, and sol–gel methods are categorized in the bottom-up technique. Normally, solvothermal techniques use an autoclave that is operated in a high temperature and elevated pressure solvent to generate CQDs. Elango et al.18 synthesized CQDs in a single step using crab shell wastage utilizing a hydrothermal method. CQDs were produced using fenugreek seeds employing suitable microwave illumination.19 Carbonization has emerged as a popular choice among researchers due to its numerous advantages, including the use of lower temperatures, mild reagents, and green routes. This method involves heating carbon-based materials with appropriate reagents to produce desired CQDs. Scientists are increasingly focusing on the use of biomass as a starting material for synthesizing CQDs, with examples including pomegranate,5 aloe vera,20 banana,21 and various types of biomass.22 Such approaches are considered environmentally safe and sustainable.
CQDs have found wide-ranging applications in photocatalysis,23 bio-imaging,24,25 optoelectronics,26 drug delivery,27 photocatalytic organic transformations28 and sensors.29 Zhang et al.30 explored plastic conversion using a photoredox-based catalytic system and highlighted the transformation in terms of selective synthesis and nonselective breakdown. Qi et al.31 discussed the progress of supportive photoredox coupling of hydrogen generation with a variety of selective organic transformations such as alcohol oxidation, oxidative cross-coupling, methane conversion, etc. using a semiconductor-based photoredox system. Recently, CQDs have been used for water splitting due to their environmentally friendly nature and ability to catalyze the degradation of pollutants while simultaneously producing H2 and O2. Wang et al.32 utilized CQDs in photo-electrochemical water splitting. The unique properties of CQDs, including their ability to convert up-down photoluminescence (PL) and relocate electrons when exposed to sunlight, make them suitable for numerous applications as electron providers and acceptors.33–35 Attenuation of CQDs' PL characteristics via attenuating the fabrication method is preferred as there is a strong correlation between the synthesis method and reaction parameters like initial material, solvent, time, functionalization, temperature, and modification of the surface. The unique characteristics of CQDs make them highly versatile and suitable for a range of applications. CQDs can act as carrier catalysts, co-catalysts, or catalysts in a variety of functions, including sensing, catalysis, energy storage, and exchange.36
Carbon quantum dots (CQDs) are a feasible material for utilization in the preparation of composites because of their electron transfer nature under the exposure of light. Additionally, CQDs exhibit up-down photoluminescence (PL) conversion and the ability to accept and donate electrons.34–36 Some studies have employed CQDs as one of their composite materials to prepare CQDs/CuS,37 Fe2O3/CQDs,38 CQDs/CuO,5 CQDs/ZnO,39 CQD/TiO2,40,41 CQDs/Sb2WO6 (ref. 42) and CQD/PCN (polymeric carbon nitride).43 Li et al.44 demonstrated the reduction of CO2 to CO molecules under a light-driven heterogeneous and homogenous system using a Ru pseudo-supramolecular complex with NCQDs (nitrogen-doped carbon quantum dots). The NCQDs enhance the photosensitization efficiency of the Ru complex by exciton transport because of π-conjugated non-covalent interactions among them. Wang et al.45 synthesized a 3D carbon quantum dots/graphene aerogel (CQDs/GA) composite using a hydrothermal method and utilized it for photocatalytic reduction of chromium(VI). The result revealed that CQDs/GA demonstrate better photocatalytic activity than CQDs alone. This is because of the hierarchical frameworks and multidimensional transport of electrons in the case of CQDs/GA. The results revealed the exceptional photocatalytic activity.
While oxides and sulfides are commonly used in the development of photocatalysts, selenides are a less explored class of catalysts in photocatalysis, despite their lower toxicity and cost compared to sulfides and oxides. Li et al.46 utilized an electrostatic assembly technique for efficient synthesis of branched polyethylenimine (BPEI) passivated TiO2 composites and used it for performing photoreduction of 4-nitroaniline under visible light.
Metal selenides can generate both electrons and holes upon exposure to light and thus function as photocatalysts. However, the quick recombination of these electrons and holes poses a challenge for their practical use. The band structure of metal selenides is also suitable,47 but the restricted band gap causes a problem. The band gap could be modified using doping48 or by forming a composite.49,50 Composite materials can be effective in reducing the recombination rate of electrons and holes, making them more suitable for catalytic reactions. For this reason, metal selenides have been used in the degradation of pollutants, as their incorporation into composites can enhance their photocatalytic activity.51
In the backdrop of the above context and limitations, greenly synthesized CQDs (from water caltrop peels) were used with copper selenide nanoparticles (CuSe NPs). A composite material consisting of CuSe and carbon quantum dots (CQDs) was synthesized and used as a photocatalyst for the degradation of thymol blue (TB) and Congo red (CR) dyes. The photocatalytic activity of the CuSe/CQDs composite was compared to that of CuSe alone. The internal structure and composition of the composite material were characterized using a range of spectroscopic techniques, including XRD, HRTEM, EDS, BET, FESEM, FTIR, and XPS. The kinetics of the photocatalytic reaction were studied using a spectrophotometer, and GCMS analysis was performed to detect the intermediate forms produced during the photocatalytic degradation of the dyes. The results of the GCMS analysis were used to propose a mechanism for the degradation of the dyes. This study involves the synthesis of zero-dimensional particles using green chemistry principles, with the aim of removing hazardous pollutants from the environment, particularly from wastewater. The proposed method employs green waste as a source material and offers the dual benefit of pollutant elimination and hydrogen gas production, without the need for specialized instruments or hazardous chemicals. The process is simple and relies on renewable sources of energy, such as sunlight, making it an environmentally friendly approach for water remediation. The CuSe@CQDs composite is prepared for the first time via green synthesis; hence, green chemistry protocols have been followed, which is the need of the hour for humans and the environment. It is a highly beneficial scheme as the use of waste peels has a double benefit, that is, removal of hazardous pollutants and generation of hydrogen gas. Furthermore, this scheme utilizes less energy and resources and provides more benefits to science and the environment. The use of carbon quantum dots (CQDs) in the sustainable production of future fuels is a promising development, as it allows for the reduction of the total carbon content from natural sources. This green-designed technique is free from hazardous solvents and can be scaled up for commercial applications, enabling the generation of hydrogen gas and the purification of large-scale polluted water using renewable sources of energy and composite materials. The adoption of this approach has the potential to contribute significantly to a more sustainable future.
2 Experimental details
2.1 Materials and methods
All of the chemicals used in this study were of analytical grade. The dye stock solution was prepared using double-distilled water. Commercially available reagents, including copper sulphate pentahydrate (CuSO4·5H2O) from Merck, sodium selenite, ethylene glycol, hydrazine, nitric acid, absolute ethanol, sodium hypochlorite solution from Thomas Baker, dichloromethane, thymol blue and Congo red from Himedia, and hydrogen peroxide (30% w/v) from CDH were used without further purification. The pH of the solutions was measured using a Systronics Model 335 pH meter, solar irradiance was measured with a CEL Model SM 201 radiometer, and a Systronics Model 106 spectrophotometer was used for optical measurements.2.2 Synthesis of green carbon quantum dots
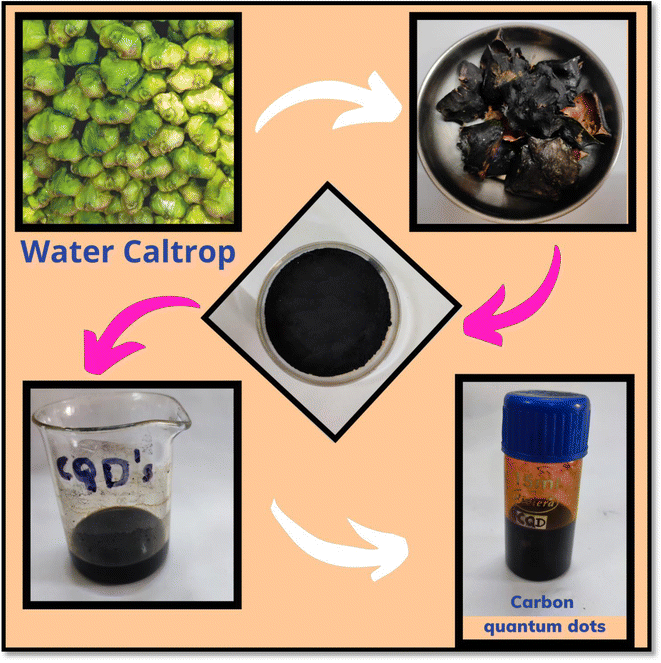
The schematic representation of the synthesis of CQDs via green synthesis is illustrated in Scheme 1. Water caltrops were obtained from a local market in Udaipur, Rajasthan. Water caltrops were utilized and peels (WCP) were collected, washed, and dried in sunlight by covering them with a cotton cloth for 21 days. After grinding, oven drying for carbonization was done at 130 °C for 16 h. 9 g of the WCP powder (invasive material) was washed with 210 mL of an aqueous HNO3 solution (0.1 M) and rinsed with distilled water followed by absolute alcohol. The obtained product was dried under ambient conditions for 22 h. Then the above powder was mixed with sodium hypochlorite solution (140 mL) and left in the ambient environment for 14 h. This solution was sieved and cleaned with distilled water (DW) till the filtrate became neutral. The oxidized WHP was mixed with 200 mL of water and placed in a hot air oven at 130 °C and the temperature was gradually increased up to 170 °C for 20 h. The obtained black color compound was washed with dichloromethane to eliminate the unreacted organic species. To this, distilled water was added and aged for 54 h and then the supernatant was separated using a syringe. This process was repeated till the color of the supernatant water became clear and transparent. Then the black color solution was centrifuged and washed. The final CQDs solution in ethanol was preserved at 4 °C for further use.2.3 Synthesis of copper selenide nanoparticles (CuSe NPs)
Copper selenide nanoparticles (NPs) were synthesized using a sol–gel method with copper(II) sulfate and selenium powder precursors, along with hydrazine as a reducing agent. To prepare the copper sulfate solution, the desired amount of copper sulfate was dissolved in distilled water to create a 0.1 M solution. In a separate step, sodium selenite was dissolved in an appropriate amount of water to produce a 0.2 M solution. The mixture was then ultrasonicated at room temperature for 20 minutes. Next, hydrazine solution was added to the mixture while continuously stirring it magnetically. After 30 minutes, the CuSe NPs precipitated out, were collected by filtration, washed, and dried in an oven.2.4 Production of the CuSe@CQDs nanocomposite
The production process of the CuSe@CQDs nanocomposite follows a similar procedure to the synthesis of CuSe NPs described earlier, with the inclusion of an alcoholic solution of CQDs in the reaction mixture.2.5 Photocatalysis experimental procedure
The photocatalytic performance of CuSe@CQDs was evaluated by investigating the degradation of thymol blue and Congo red dyes under UV light illumination in a photocatalytic reactor equipped with a gas-tight septum and syringe. The amount of H2 produced was measured using a gas chromatograph with a thermal conductivity detector. All H2 production experiments were conducted under identical conditions. The apparent quantum yield (AQY) was calculated using the GC data and the following equation:A digital pH meter (Systronics Model 335) was used to compute the pH of the solution. The pH of the solution was adjusted by the addition of previously standardized 0.1 N sulphuric acid and 0.1 N sodium hydroxide solutions. Various parameters for polluted and treated water were determined by using a water analyzer (Systronics Model 371).
To observe the catalytic activity, 0.05 g of the photocatalyst was dispersed in 100 mL of thymol blue or Congo red dye mixed with 100 mL of methanol and the solution was then placed in a dark chamber for 30 minutes to accomplish adsorption–desorption equilibrium. With the irradiation of the solution, photocatalytic activity started and a sample of the solution was taken out by an outlet syringe at regular intervals of 15 min. The degradation rate was determined spectrophotometrically using a Systronics 2371 UV-vis spectrophotometer. Various operating parameters such as pH of solution, concentration of dye, amount of catalyst and light intensity were optimized. To check the reproducibility, all photocatalytic experiments were performed thrice.
The degradation rate (%) was calculated using the following formula:
2.6 Evaluation of photoelectrochemical performance
An electrochemical workstation (Biologic EC Lab SP-150, MNIT Jaipur) equipped with a standard three-electrode system was employed for the electrochemical measurements. The counter electrode was made of Pt wire, the reference electrode was Ag/AgCl, and the working electrode was a CuSe@CQDs pellet, with 0.1 M KOH solution as the electrolyte. The electrochemical cell was illuminated with a 300 W Xe lamp equipped with a 420 nm cut-off filter. The electrochemical impedance spectroscopy (EIS) analysis was performed on the prepared sample at a bias potential of 10 V and a frequency range of 10–25 MHz. The Mott–Schottky (M–S) curve was measured in the dark.2.7 Characterization of the CuSe nanoparticles and CuSe@CQDs nanocomposite
The nanomaterials CuSe and CuSe@CQDs nanocomposite were characterized using various techniques, including X-ray diffraction (XRD), Fourier transform infrared (FT-IR) spectroscopy, UV-vis absorption spectroscopy, field emission scanning electron microscopy (FESEM), transmission electron microscopy (TEM), X-ray photoelectron spectroscopy (XPS), BET analysis, photoluminescence (PL) spectroscopy, and electrochemical impedance spectroscopy (EIS). The XRD patterns were obtained using an XPERT-PRO diffractometer, while FT-IR spectra were recorded on a PerkinElmer spectrophotometer. The UV-vis absorption spectra were measured on a UV-vis spectrophotometer Model Lambda 750, and the PL spectrum was obtained using a fluorescence spectrophotometer (F-7000, Hitachi). The FESEM and TEM images were acquired using TESCAN and Hitachi (H-7500) instruments, respectively. XPS was performed using Al Kα (1486.6 eV) radiation and an ultraviolet source, and BET analysis was employed to determine the pore diameter and pore size, and for surface analysis. EIS analysis was performed using a Biologic EC Lab SP-150 electrochemical workstation.2.8 Results and observations
The XRD plots are shown in Fig. 1. Fig. 1(a)–(c) present the plots of CQDs, CuSe, and CuSe@CQDs.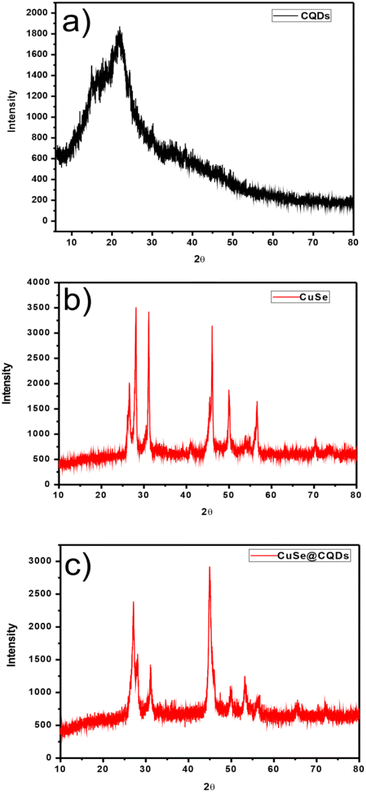 | ||
| Fig. 1 (a) XRD pattern of CQDs. (b) XRD pattern of CuSe nanoparticles. (c) XRD pattern of the produced CuSe@CQDs composite. | ||
Fig. 1(a) shows a wide diffraction peak that occurs at 2θ = 22.6° with a 0.34 mm spacing that matches with 002 planes which implies that CQDs have an amorphous nature.52
In Fig. 1(b), the peaks positioned at 26.60, 28.14, 31.14, 45.46, 49.98, 56.62, and 70.3 which matched perfectly with JCPDS card no. 27-0184 are analogous to (111), (112), (103), (006), (200), (118), and (206) hkl planes. This confirms the synthesis of pure CuSe nanostructures which have a hexagonal phase. The crystalline mean size of CuSe NPs is found to be around 14.85 nm from the given equation.
Fig. 1(c) displays the peaks of CuSe@CQDs at 22.6, 27.14, 28.06, 31.18, 45.08, 49.54, 53.48, 56.58, 65.52, and 72.06 which include peaks of both CQDs and CuSe. The diameter of the synthesized composite is 10.36 nm.
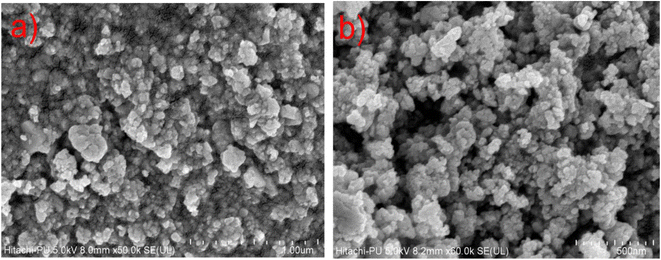
The morphology of CuSe@CQDs is examined by FESEM. Images of the composite are displayed in Fig. 2. Many bulbous-shaped compact particles are formed having sizes of 15–30 nm. The distribution of size studied by a histogram is shown in Fig. S1.†
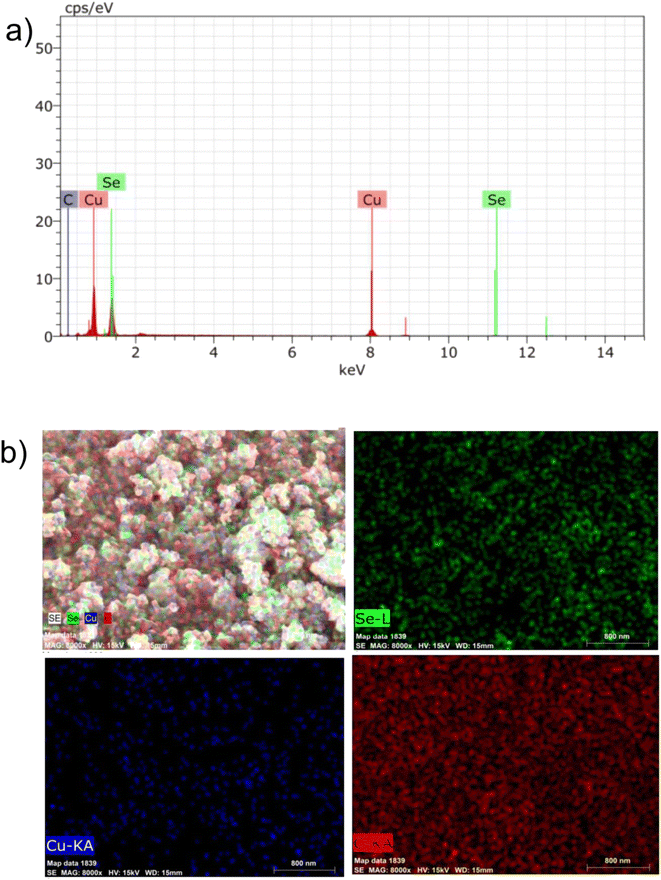
The elemental composition of the composite (CuSe@CQDs) was examined using EDS spectra. Fig. 3(a) displays the EDS pattern, confirming the presence of copper, selenium, and carbon elements. Additionally, Fig. 3(b) illustrates the mapping of these elements, demonstrating a consistent distribution across the material and providing further evidence of successful composite production. Table 1 shows the weight percentage determined through EDS. Copper, selenium, and carbon have weight compositions of 59.65, 35.03, and 5.32%, respectively.
| Element | Wt% | At% |
|---|---|---|
| Copper | 59.65 | 48.37 |
| Selenium | 35.03 | 25.87 |
| Carbon | 5.32 | 25.76 |
The HRTEM images presented in Fig. 4 reveal the morphology of the CuSe@CQDs composite to be predominantly spherical, with some minor agglomeration observed. The size distribution of the fabricated particles was found to be within the range of 14–30 nm. Furthermore, the SAED pattern shown in Fig. 4(d) indicates the polycrystalline nature of the material, with an interplanar distance of 0.38 nm (as confirmed in Fig. S2†).
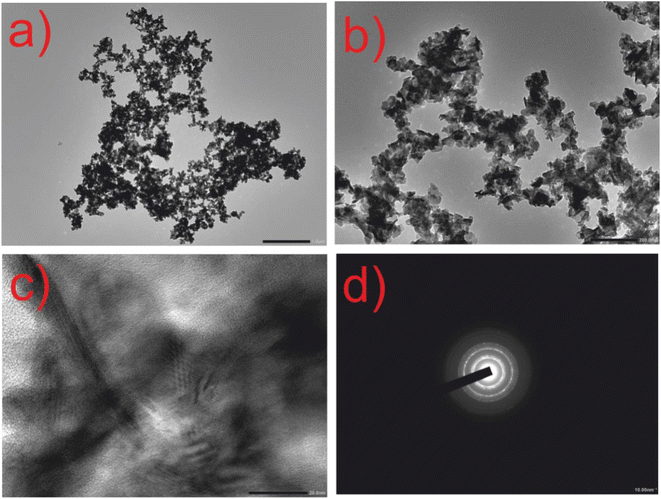 | ||
| Fig. 4 HRTEM images of composite CuSe@CQDs. (a) Resolution at 1 μm. (b) Resolution at 200 nm. (c) Resolution at 20 nm. (d) SAED pattern at 10 nm. | ||
The HRTEM images of CQDs are shown in Fig. 5, where spherical-shaped CQDs are observed. The diameter of CQDs lies between 5 and 8 nm having an interplanar distance of 3.10 nm (Fig. S3†). The SAED image of CQDs displayed in Fig. 5(c), having rings with an absence of sharp diffraction points, signifies the amorphous character of CQDs which matches with the XRD result.
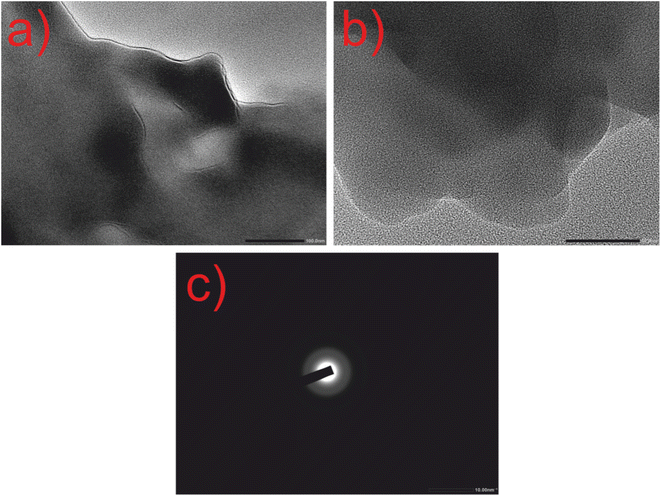 | ||
| Fig. 5 HRTEM images of CQDs alone. (a) Resolution at 100 nm. (b) Resolution at 50 nm. (c) SAED pattern at 10 nm. | ||
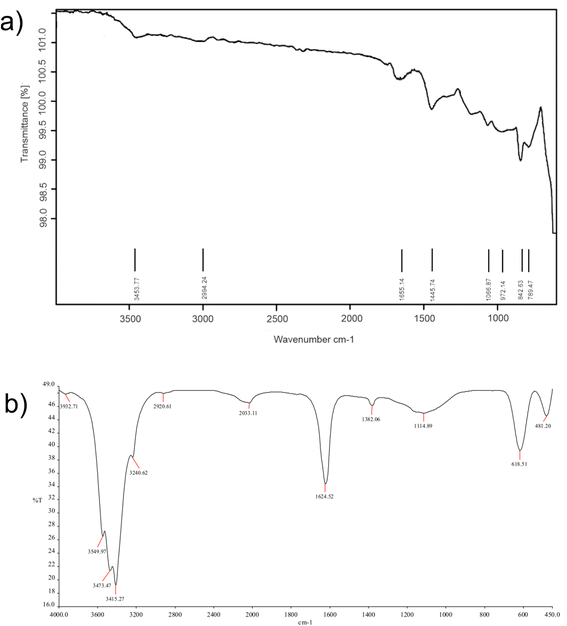
Fig. 6(a) and (b) display the FTIR spectra of CQDs and CuSe@CQDs, respectively. In Fig. 6(a), the band observed at 3453 cm−1 can be assigned to –OH stretching, while the C–H elongation band is observed at 2994 cm−1. The bending mode that appears at 1655 cm−1 corresponds to –OH and the peak around 1445 cm−1 is of aromatic carbon stretching. The band at 1066.87 cm−1 is attributed to the vibration of the C–O bond and the peak at 842.6 cm−1 corresponds to an epoxy group. Hence CQDs formation is confirmed by FTIR.
Fig. 6(b) shows the FTIR spectrum of the CuSe@CQDs composite, with peaks corresponding to both CuSe and CQDs. The peaks observed at 481.20, 618.51, 1114.89, 1382.06, 1624.52, 2033.11, 2920.61, 3240.62, 3415.27, 3473.47, 3549.97, and 3932.71 cm−1 provide information about the functional groups present in the composite. The peak at 618.51 cm−1 is attributed to the bending vibration of Cu–Se bonds.53 The spiky peak observed at 1624.52 cm−1 corresponds to water's bending mode,54 while the broad band around 3400 cm−1 is due to the elongation of –OH groups. The peak at 2920.61 cm−1 is associated with C–H stretching, and the diminished peak at 1382.06 cm−1 indicates the presence of an alkene moiety. These observations confirm the successful formation of the CuSe@CQDs composite.
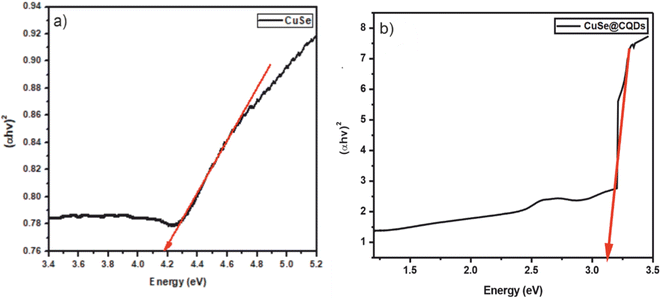
Tauc plots were drawn using UV-absorption data as shown in Fig. 7. It was established that the band gap of CuSe and the CuSe@CQDs composite was 4.19 and 3.12 eV respectively. The enhancement in the gap is because of the occurrence of CQDs in the interstitial sites of CuSe. The greater value of CuSe@CQDs than CuSe alone validates the better absorption ability of the composite in the visible region.55 Consequently, it is appropriate for photocatalytic reactions in perceptible light.
BET analysis was performed to determine the surface area of the CuSe@CQDs composite, as the photocatalytic activity is directly influenced by the surface area. The isotherm is presented in Fig. 8, and the results indicated that the surface area of the composite was 38.7 m2 g−1, which is more than three times higher than that of CuSe alone, which was reported to be 11.1 m2 g−1.56 This increase in surface area is expected to enhance the photocatalytic activity of the composite significantly. The mean pore diameter of the composite was found to be 19.57 nm, and the rectilinear graphs are displayed in Fig. S4.† These results confirm that the CuSe@CQDs composite is highly effective and suitable for photocatalytic applications. Therefore, the BET analysis supports the suitability of the composite for efficient photocatalytic degradation of pollutants.
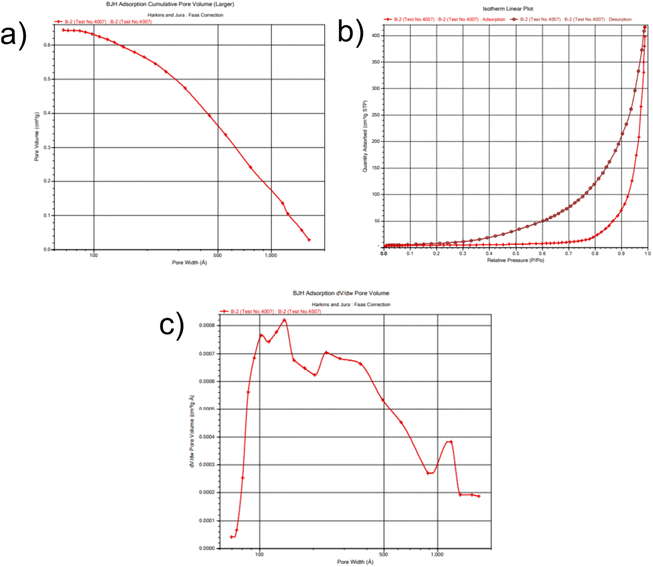 | ||
| Fig. 8 BET plots of the composite. (a) Pore volume. (b) Desorption–adsorption isotherm. (c) Allocation of pore diameter. | ||
TGA was carried out at a 20° min−1 heating rate under a N2 environment from RT (room temperature) to 800 °C as demonstrated in Fig. 9. The slight drop in weight (2.32%) below 300 °C is due to absorbed water.57 Then the sharp decrease of weight (33.35%) from 325 to 500 °C represents the decomposition of the composite.58 Complete decomposition occurs after 500 °C, which implies that the composite is stable below 325 °C. DSC examination of the composite is shown in Fig. S5.†
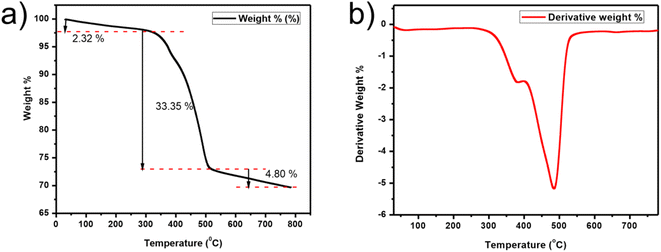 | ||
| Fig. 9 TGA plots. (a) Wt% versus T (temperature) plot of CQD/CuSe. (b) Graph of first derivatives vs. the temperature for the composite. | ||
Chemical entities of the composite were further confirmed by XPS, portrayed in Fig. 10. Fig. 10(d) exemplifies the entire spectrum of CuSe@CQDs. The presence of copper (Cu 2p), carbon (C 1s), and selenium (Se 2p) is verified. The elemental spectrum of particular elements is presented in Fig. 10(a)–(c). The peak at 941.11 eV is a satellite peak corresponding to Cu (2p)59 (Fig. 10(a)). The tip of the spectrum at 930.76 and 950.20 belongs to Cu2+ (2p3/2) and Cu2+ (2p1/2). Subordinate peaks are also available.60 Therefore, the spectrum confirms the presence of Cu (+2) and excludes the possibility of Cu (+1).
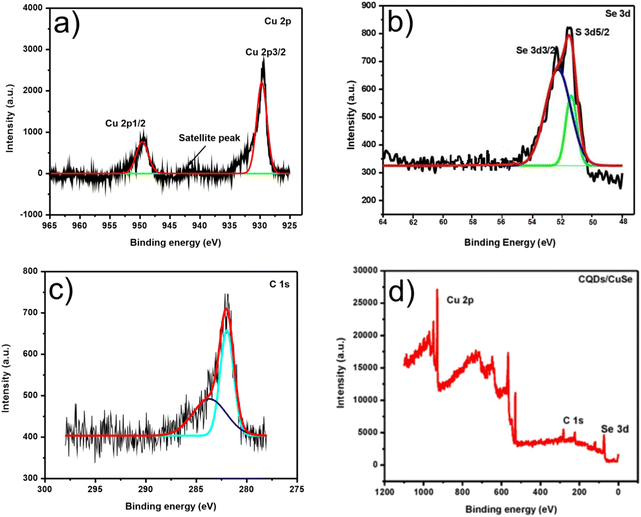 | ||
| Fig. 10 XPS spectra of CuSe@CQDs. (a) XPS of Cu. (b) XPS of Se. (c) XPS of C. (d) CuSe@CQDs' survey XPS. | ||
Fig. 10(b) shows the peaks corresponding to 2d5/2 and 2d3/2 of selenium at 51.8 and 52.4 eV, correspondingly.61 Hence Se2− is confirmed by XPS and is similar to prior reports.56 The XPS of C 1s is presented in Fig. 10(c) which shows apexes at 283.90, 282.16, and 282.09 eV. The sp3 and sp2 carbon peaks appear at 282.09 and 283.90 eV, correspondingly.62 Every spectroscopy technique validates the triumphant production of the CuSe@CQDs composite.
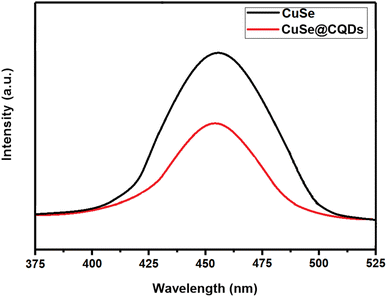
The PL spectra of CuSe and its composite were analyzed to evaluate the efficacy of charge separation of photoproduced electron–hole pairs. Fig. 11 shows the PL spectra of CuSe and the CuSe@CQDs composite at an excitation wavelength of 320 nm in the 375–525 nm wavelength range. The PL emission spectra of the CuSe@CQDs composite are at a lower intensity than those of pure CuSe, indicating a lower recombination rate of photoproduced electron–hole pairs. This observation suggested that the composite has a better separation efficiency of photoproduced electron–hole pairs.
3 Photocatalytic activities of the synthesized composite
3.1 Catalytic efficiency for the generation of hydrogen through photocatalysis
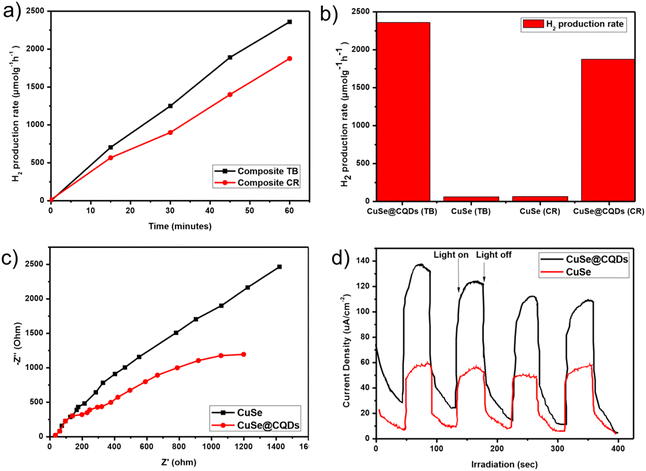
Hydrogen production rates were found to be 2360 and 1875 μmol g−1 h−1 for the composite with TB and CR, respectively (Fig. 12(a)). A comparative analysis was conducted between the composite and pure copper selenide nanoparticles, which is depicted in the bar graph of Fig. 12(b). The results indicate that the composite demonstrated 35.7 times and 29 times higher hydrogen production compared to pure CuSe nanoparticles for TB and CR, respectively.To examine the charge separation efficiency, EIS spectra were studied. To investigate the transfer of photoproduced electrons at the composite surface, electrochemical impedance spectroscopy (EIS) was used (Fig. 12(c)). The Nyquist plot of EIS revealed a smaller curvature radius for the composite (CuSe@CQDs), indicating superior electron–hole separation and a faster photocatalytic reaction. A larger curvature radius for pure CuSe nanoparticles indicates less charge separation and lower photocatalytic activity. The photoproduced electrons of the CuSe@CQDs composite material are rapidly transferred due to the addition of CQDs, implying that the interface charges can be transferred to the acceptor more quickly.
Fig. 12(d) displays the photocurrent response curves of both CQDs and CuSe@CQDs. Upon illumination, there is a rapid increase in the charge transfer rate and photocurrent density and on switching off the light, the photocurrent density decreases rapidly. CuSe@CQDs has roughly twice the photocurrent density of CuSe. This is most likely due to the fact that loading much smaller CQDs on the surface of CuSe greatly increases the external specific surface area. Meanwhile, the ability of CQDs to stabilize the photoproduced electrons and holes suggests that they may allow the surface to accumulate a significant number of electrons and holes before recombination, thereby increasing photocurrent density. In addition to the up-conversion luminescence properties of CQDs, a synergetic effect had developed between CQDs and CuSe, as shown in Fig. 12(c); the impedance of CuSe@CQDs is significantly lower than that of CuSe, which is consistent with the current density results.
3.2 Photocatalytic activity towards dye degradation
Thymol blue (TB) and Congo red (CR) dyes were selected as focus contaminants to inspect the photocatalytic action of the prepared CuSe@CQDs composite. Thymol blue (TB) and Congo red (CR) dyes are extremely toxic. The details of the dyes are presented in Table S1.† These dyes are commonly used in the textile industry as well as for pH indication and coloring. However, they are known to be highly toxic and carcinogenic. Additionally, they can cause irritation to the respiratory system, especially the lungs, and are primarily used for their staining properties. If orally ingested, they greatly influence the gastric tract. The maximum wavelength absorbance of TB and CR was found at 595 and 497 nm, respectively.The CuSe@CQDs composite exhibited remarkable photocatalytic ability, decaying 99.4% of TB and 97.8% of CR dyes within 1 hour under the visible lamp. The outcome of catalyst and light on the decay is inspected by doing equivalent experiments in the dark and devoid of catalyst. The photolysis stayed incompetent for the decay when the catalyst was absent. Furthermore, the photocatalytic degradation of TB and CR dyes was carried out using pristine CuSe NPs and CuSe@CQDs composite. The outcomes demonstrated that in the presence of CuSe NPs, only 34% and 29.8% of TB and CR dyes, respectively, were degraded after 60 minutes of illumination. However, under the same experimental conditions, the CuSe@CQDs composite degraded 99.4% of TB and 97.8% of CR dyes, as depicted in Fig. 13(a). Hence it has been verified that the CuSe@CQDs displays advanced photocatalytic ability for the degradation of TB and CR dyes, which proves that the introduction of CQDs plays the foremost role in enhancing the decay rate.
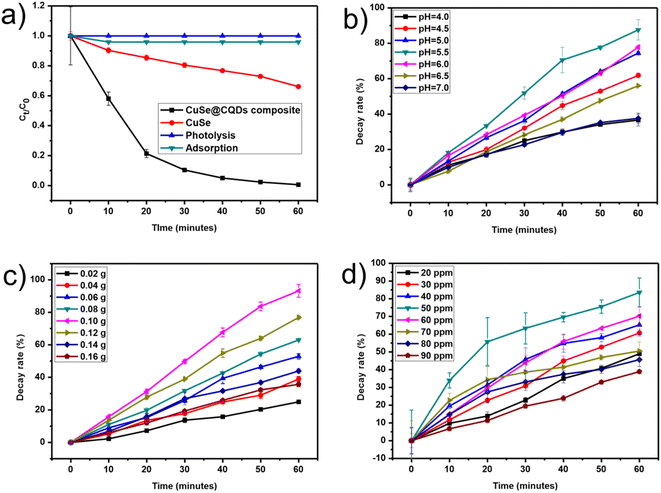 | ||
| Fig. 13 (a) Relative examinations of the rate of decay. (b) Influence of pH on dye degradation. (c) Effect of the dose of catalyst. (d) Effect of dye concentration. | ||
4 Effects of various parameters
The efficiency of the CuSe@CQDs nanocomposite was assessed by optimizing various parameters such as pH, catalyst dosage, initial dye concentration, and light intensity.4.1 Effect of pH
Initially, the thymol blue solution's pH was adjusted, leaving the other factors unchanged. The exploration was completed in alkaline and acidic media which divulges that there is enhanced decay in a slightly acidic medium so varying the pH from 4 to 7 was considered for the pH tuning (Fig. 13(b)). The optimized value of pH for TB was 5.5.4.2 Effect of catalyst quantity
To calculate what would be a sufficient dose of composite for TB photocatalytic decay, the quantity was varied to 0.16 g from 0.02 g of CuSe@CQDs, maintaining a TB concentration of 50 ppm and pH of 5.5 as shown in Fig. 13(c). It showed that by enhancing the quantity from 0.02 to 0.10 g, the disintegration rate of TB was enhanced from 24.9% to 93.2%, due to the ease in the expansion of active spots on the surface of the composite. After further enhancement to 0.16 g of catalyst, the rate decayed to 35.7%. Since turbidity appears at a higher quantity which prevents the radicals from reaching the substrate, 0.10 g was chosen as an apt quantity of the CuSe@CQDs composite.4.3 Effect of dye concentration
Fig. 13(d) displays the effect of variation of TB concentration. The TB concentration was examined from 20 ppm to 90 ppm, keeping other factors constant. It was revealed that as the TB concentration increased from 20 ppm to 50 ppm, the decay enhanced from 60.7% to 83.6%, and with further increase to 90 ppm the decay rate fell to 38.9%. Primarily, the improved rate is because of greater availability of TB molecules but the extra increase retards the rate since the number of collisions amongst the TB molecules increased compared to that with the composite. Moreover, the TB molecules get affixed on the composite's exterior thus the exterior is not accessible for contact. The depiction of decay rate vs. TB concentration is shown in Fig. S6† using a bar graph.4.4 Effect of light exposure
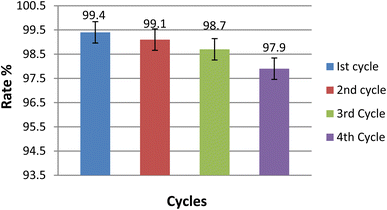
The study analyzed how the exposure to light affected decay. To investigate this, the power levels were changed from 10 to 70 mW cm−2 and the decay rate was observed. Fig. S7† displays how the decay rate increased with rising power, reaching a maximum rate at 60 mW cm−2. As the light power increased, more photons were able to interact with the material, resulting in a higher decay rate. However, beyond a certain point, the rate began to decrease because the additional intensity did not correspond to a change in the number of interaction sites.63The composite material was designed for multiple cycles of use, which was achieved by carefully retrieving it from the photochemical reaction mixture and subjecting it to several rounds of rinsing and air exposure. The experimental results, shown in Fig. 14, indicate that the photocatalytic rate decreased slightly with each cycle (99.4%, 99.1%, 98.7%, and 97.9%). Despite this gradual reduction, the composite demonstrated excellent photocatalytic performance for the degradation of TB, confirming its suitability for repeated use.
The XRD pattern, SEM image, and FTIR spectrum of the reused catalyst are shown in Fig. 15. The spectra of the reused catalyst show little or insignificant difference from the spectra of the synthesized catalyst, confirming that there is no structural or morphological change after four cycles of use.
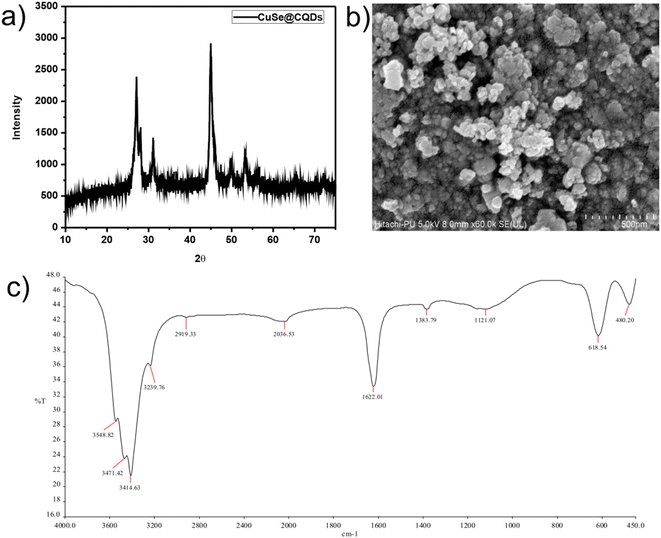 | ||
| Fig. 15 Spectra of the reused catalyst. (a) XRD pattern. (b) FESEM image at a resolution of 500 nm. (c) FTIR spectrum. | ||
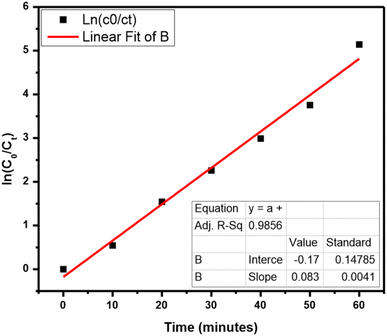
A scavenger test was performed for the identification of energetic radicals. The effect of diverse scavengers on the decay rate is shown in Fig. S8.† NaCl, K2Cr2O7, and IPA worked as foragers for holes, electrons, and OH radicals, correspondingly. The rate was 99.4% when there is no scavenger and then it goes down to 94.1%, 54.3%, and 45.8% in the presence of NaCl, K2Cr2O7, and IPA, correspondingly. Hence, the scavenger test leads to the monitoring of species that are h+ and OH in the TB photocatalytic decay. The Langmuir–Hinshelwood model is utilized for following the kinetics of the reaction,
| ln(C0/Ct) = kt |
The water quality of the dye-containing specimen was assessed before and after the photocatalytic degradation process using various parameters listed in Table S2.† The results showed improvements in total dissolved solids (TDS), conductance, salinity, pH, and dissolved oxygen (DO), while a decrease in chemical oxygen demand (COD) was observed. These changes provide evidence of successful degradation of the dye and an overall improvement in water quality.
The photocatalytic decay of Congo red was also examined by CuSe@CQDs under light irradiation. The optimal run suggests a 97.8% decay of CR dye within 60 min of exposure. The best conditions were achieved at CR concentration (60 ppm), pH = 6.5, and 0.12 g (composite quantity). The rate of decay was 0.0617 min−1 (Fig. S9†). Table S3† corresponds to the water bounds for CR before and after the decay. Meanwhile, pure CuSe was able to decay only 29.8% of dye.
Table 2 summarizes the efficiency of the composite by comparing it to recently reported works. The findings indicate that the synthesized composite (CuSe@CQDs) exhibits superior stability and maximum efficiency compared to other composites.
| Sr. no. | Photocatalyst | Pollutant | Conc. | Rate constant (min−1) | Time (min) | Degradation (%) | Ref. |
|---|---|---|---|---|---|---|---|
| 1 | Hydroxyapatite | Crystal violet | — | — | 75 | 77 | 64 |
| 2 | Ag/Bi2O3/hydroxyapatite | Phenol | 10 ppm | — | 100 | 98.7 | 65 |
| 3 | Cotton fabrics/cuprous oxide-nanocellulose | Methylene blue | — | 120 | 98.32 | 66 | |
| 4 | Fe3O4-PDA-bentonite | Rhodamine B | 20 ppm | 0.090 | 60 | 93 | 13 |
| 5. CQD | CQDs/TiO2 | Rhodamine B | 0.163 | 70 | 92 | 41 | |
| 6 | BaTiO3 nanocubes/cuboids-Ag | Bisphenol A | 10 ppm | 0.091 | 100 | 99 | 67 |
| 7 | ZnO | Eosin Y | 10 ppm | — | 180 | 90.5 | 68 |
| 8 | MoS2/TiO2 | Methyl orange | 25 ppm | — | 300 | 86 | 69 |
| 9 | GO/g-C3N4–Fe3O4 | Tetracycline | 50 ppm | — | 360 | 78 | 70 |
| 10 | TiO2 (P25) | Congo red | 40 ppm | — | 210 | 93 | 71 |
| 11 | CuSe@CQDs | Thymol blue | 50 ppm | 0.083 | 60 | 99.4 | This work |
| 12 | CuSe@CQDs | Congo red | 60 ppm | 0.061 | 60 | 97.8 | This work |
5 Pathway proposed for TB degradation via CuSe@CQDs based on GCMS studies
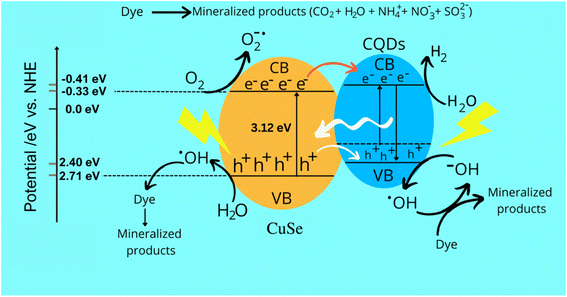
CQDs play a crucial role in the photocatalytic degradation of TB, making them the optimal composite material for CuSe to generate holes (h+) and electrons (e−). Additionally, CQDs prevent the recombination of charged species by preserving and supplying electrons, thereby enhancing the efficiency of the CuSe@CQDs composite. The interaction of electrons and oxygen on the surface of the composite generates OH radicals, which result from the interaction of holes with water. These highly reactive species are responsible for the complete degradation of organic pollutants. Scheme 2 illustrates the process of attack and degradation of hazardous pollutants using the synthesized composite.GCMS was performed to examine the decayed product. The products formed during the reaction were identified, which leads to a possible mechanism of decay. Table 3 presents the GCMS results of some degraded products. Scheme S1† presents the mechanism of TB's decay. The MS spectra of the degraded products (A, B, E, F, G, H) are given in Fig. S10.† The OH radical attacks and oxidizes the substrate and yields a mineralized product.
| Sr. No. | Intermediates | Labelling of intermediates | Retention time | Main characteristic ion (m/z) |
|---|---|---|---|---|
| 1 | 2-Isopropyl-5-methyl-phenol | (A) | 10.73 | 152, 94, 66, 65, 39, 15, 33 |
| 2 | 2-Isopropyl-6-methyl-1,4-benzoquinone | (B) | 13.56 | 154, 140, 122, 108, 82, 80, 54, 53, 52, 26 |
| 3 | Benzenesulfonic acid | (E) | 11.69 | 152, 84, 52, 39, 33 |
| 4 | Phenol | (F) | 8.52 | 94, 66, 65, 39 |
| 5 | Benzene-1,2-diol | (G) | 9.43 | 110, 91, 65, 39, 23 |
| 6 | Hexa-2,4-dienedioic acid | (H) | 6.13 | 142, 97, 52, 51, 50, 18 |
6 Conclusion
This study presents a green and cost-effective approach for the synthesis of carbon quantum dots (CQDs) from waste peels of water caltrop (Trapa natans) and copper selenide (CuSe) nanoparticles using the sol–gel process. The CuSe@CQDs composite was utilized for the photocatalytic degradation of TB and CR dyes, and the results showed that the composite exhibited a significantly higher rate of decay and hydrogen production compared to CuSe alone. Various techniques, including BET, FTIR, XPS, FESEM, HRTEM, XRD, and UV, were used to confirm the formation of the CuSe@CQDs composite, which was found to be an effective catalyst for both degradation and hydrogen production. Under similar conditions, the composite achieved 99.4% and 97.8% degradation of TB and CR dyes, respectively, within 60 minutes of illumination, whereas CuSe alone achieved only 34% and 29.8% degradation. The rate of hydrogen production for TB and CR was found to be 2360 and 1875 μmol g−1 h−1, respectively, which was 35.7 and 29 times greater when using the composite compared to CuSe alone. Overall, this study provides a promising avenue for the development of efficient and sustainable photocatalysts for environmental remediation applications.Author statement
Authors confirmed that the material presented in this manuscript has not been previously published, except in abstract form, nor is it simultaneously under consideration by any other journal.Author contributions
All the experiment and former analysis were done by YV. PC, DD, MK, and PC analyzed data and software. PBP conceptualized the work. CA conceptualized, supervised and validated the manuscript. The first draft of the manuscript, experiment and all analysis was written by YV. All authors read and approved the manuscript.Conflicts of interest
The authors declare no competing financial interest.Acknowledgements
My sincere gratitude goes to the Department of Physics, MLSU (Mohanlal Sukhadia University) for offering us XRD spectra. I appreciate the efforts of PU facilities (SAIF and CIL Chandigarh) for their fast services including HRTEM, FESEM, and UV-vis. I would like thank IIT Roorkee for providing XPS results. I am thankful to IIT Bombay for providing GCMS results. I express my gratitude towards MNIT Jaipur for use of the FTIR and EIS facilities and also CSMCRI Bhavnagar for their BET technique. Special thanks to Mr Gunjan Vyas for his technical support and help. C. Ameta sincerely acknowledges the Ministry of Education, Government of India and Ministry of Higher Education, Government of Rajasthan, India for providing research facilities under the RUSA 2.0 research and innovation project. Dharmendra Dharmendra expresses his gratitude to the Council of Scientific and Industrial Research (CSIR), New Delhi, for providing a research fellowship (CSIR award no. 09/172(0093)/2019-EMR-I) for financial support. Chetna Ameta is thankful to the Rashtriya Uchchatar Shiksha Abhiyan (RUSA) 2.0, MHRD, New Delhi (grant no. F30(16)SPD/RUSA/2016/178).References
- T. Ito, Y. Adachi, Y. Yamanashi and Y. Shimada, Long–term natural remediation process in textile dye–polluted river sediment driven by bacterial community changes, Water Res., 2016, 100, 458–465, DOI:10.1016/j.watres.2016.05.050.
- Q. Zeng, Y. Liu, L. Shen, H. Lin, W. Yu, Y. Xu, R. Li and L. Huang, Facile preparation of recyclable magnetic Ni@filter paper composite materials for efficient photocatalytic degradation of methyl orange, J. Colloid Interface Sci., 2020, 582, 291–300, DOI:10.1016/j.jcis.2020.08.023.
- A. Cabrera-Reina, A. B. Martínez-Piernas, Y. Bertakis, N. P. Xekoukoulotakis, A. Agüera and J. A. Sánchez Pérez, TiO2 photocatalysis under natural solar radiation for the degradation of the carbapenem antibiotics imipenem and meropenem in aqueous solutions at pilot plant scale, Water Res., 2019, 166, 115037–115047, DOI:10.1016/j.watres.2019.115037.
- S. Kumawat, Y. Vyas, P. Chundawat, K. Meghwal and C. Ameta, Sonophotocatalytic degradation of fast green in aqueous phase using undoped and nitrogendoped ZnO, J. Indian Chem. Soc., 2020, 97, 1523–1530 CAS.
- Y. Vyas, P. Chundawat, D. Dharmendra, P. B. Punjabi and C. Ameta, Green and Facile Synthesis of Luminescent CQDs from Pomegranate Peels and its Utilization in the Degradation of Azure B and Amido Black 10B by Decorating it on CuO Nanorods, ChemistrySelect, 2021, 6, 8566–8580, DOI:10.1002/slct.202102156.
- E. Kusiak-Nejman, J. Wojnarowicz, A. W. Morawski, U. Narkiewicz, K. Sobczak, S. Gierlotka and W. Lojkowski, Size-dependent effects of ZnO nanoparticles on the photocatalytic degradation of phenol in a water solution, Appl. Surf. Sci., 2021, 541, 148416–148430, DOI:10.1016/j.apsusc.2020.148416.
- H. Zhang, Y. Song, L. C. Nengzi, J. Gou, B. Li and X. Cheng, Activation of persulfate by a novel magnetic CuFe2O4/Bi2O3 composite for lomefloxacin degradation, Chem. Eng. J., 2020, 379, 122362–122373, DOI:10.1016/j.cej.2019.122362.
- X. Meng, C. Zhang, C. Dong, W. Sun, D. Ji and Y. Ding, Carbon quantum dots assisted strategy to synthesize Co@NC for boosting photocatalytic hydrogen evolution performance of CdS, Chem. Eng. J., 2020, 389, 124432–124442, DOI:10.1016/j.cej.2020.124432.
- L. Zhou, S. Dai, S. Xu, Y. She, Y. Li, S. Leveneur and Y. Qin, Piezoelectric effect synergistically enhances the performance of Ti32-oxo-cluster/BaTiO3/CuS p–n heterojunction photocatalytic degradation of pollutants, Appl. Catal., B, 2021, 291, 120019–120030, DOI:10.1016/j.apcatb.2021.120019.
- Y. Fahoul, M. Zouheir, K. Tanji and A. Kherbeche, Synthesis of a novel ZnAl2O4/CuS nanocomposite and its characterization for photocatalytic degradation of acid red 1 under UV illumination, J. Alloys Compd., 2022, 889, 161708–161718, DOI:10.1016/j.jallcom.2021.161708.
- W. Wang, F. Lin, B. Yan, Z. Cheng, G. Chen, M. Kuang, C. Yang and L. Hou, The Role of Seashell Wastes in TiO2/Seashell Composites: Photocatalytic Degradation of Methylene Blue Dye under Sunlight, Environ. Res., 2020, 188, 109831–109865, DOI:10.1016/j.envres.2020.109831.
- W. Chen, W. Li, F. Liu, D. Miao, L. Ma, X. Gao, Q. Wei, K. Zhou, Z. Yu and Y. Yu, Microstructure of boron doped diamond electrodes and studies on its basic electrochemical characteristics and applicability of dye degradation, J. Environ. Chem. Eng., 2020, 8, 104348–104357, DOI:10.1016/j.jece.2020.10434.
- Q. U. Ain, U. Rasheed, M. Yaseen, H. Zhang and Z. Tong, Superior dye degradation and adsorption capability of polydopamine modified Fe3O4-pillared bentonite composite, J. Hazard. Mater., 2020, 397, 122758–122775, DOI:10.1016/j.jhazmat.2020.122758.
- Y. P. Sun, B. Zhou, Y. Lin, W. Wang, K. A. S. Fernando, P. Pathak and S. Y. Xie, Quantum-Sized Carbon Dots for Bright and Colorful Photoluminescence, J. Am. Chem. Soc., 2006, 128, 7756–7757, DOI:10.1021/ja062677d.
- X. Xu, R. Ray, Y. Gu, H. J. Ploehn, L. Gearheart, K. Raker and W. A. Scrivens, Electrophoretic Analysis and Purification of Fluorescent Single-Walled Carbon Nanotube Fragments, J. Am. Chem. Soc., 2004, 126, 12736–12737, DOI:10.1021/ja040082h.
- L. Cui, X. Ren, J. Wang and M. Sun, Homogeneous carbon quantum dot by ultrafast dual-beam pulsed laser ablation for bioimaging, Mater. Today Nano, 2020, 12, 100091–100100, DOI:10.1016/j.mtnano.2020.100091.
- H. Ming, Z. Ma, Y. Liu, K. Pan, H. Yu, F. Wang and Z. Kang, Large scale electrochemical synthesis of high quality carbon nanodots and their photocatalytic property, Dalton Trans., 2012, 41, 9526–9531, 10.1039/c2dt30985h.
- D. Elango, J. S. Packialakshmi, V. Manikandan and P. Jayanthi, Sustainable synthesis of carbon quantum dots from shrimp shell and its emerging applications, Mater. Lett., 2022, 312, 131667, DOI:10.1016/j.matlet.2022.131667.
- A. Dager, A. Baliyan, S. Kurosu, T. Maekawa and M. Tachibana, Ultrafast synthesis of carbon quantum dots from fenugreek seeds using microwave plasma enhanced decomposition: application of C-QDs to grow fluorescent protein crystals, Sci. Rep., 2020, 10, 12333–12348, DOI:10.1038/s41598-020-69264-9.
- V. R. Raikwar, Synthesis and study of carbon quantum dots (CQDs) for enhancement of luminescence intensity of CQD@LaPO4:Eu3+ nanocomposite, Mater. Chem. Phys., 2022, 275, 125277, DOI:10.1016/j.matchemphys.2021.125277.
- R. Atchudan, T. N. Jebakumar Immanuel Edison, M. Shanmugam, S. Perumal, T. Somanathan and Y. R. Lee, Sustainable synthesis of carbon quantum dots from banana peel waste using hydrothermal process for in vivo bioimaging, Phys. E, 2020, 126, 114417–114425, DOI:10.1016/j.physe.2020.114417.
- V. Ahuja, A. K. Bhatt, S. Varjani, K. Y. Choi, S. H. Kim, Y. H. Yang and S. K. Bhatia, Quantum dot synthesis from waste biomass and its applications in energy and bioremediation, Chemosphere, 2022, 293, 133564, DOI:10.1016/j.chemosphere.2022.133564.
- Y. Zhao, Z. Li, J. Wei, X. Li, H. Shi, B. Cao and J. Cao, Efficient photodegradation of cefixime catalyzed by a direct Z-scheme CQDs-BiOBr/CN composite: performance, toxicity evaluation and photocatalytic mechanism, Chemosphere, 2022, 292, 133430, DOI:10.1016/j.chemosphere.2021.133430.
- Y. Li, Y. Shi, X. Song, Z. Zhao, N. Zhang and C. Hao, Pitch-derived carbon quantum dots as fluorescent probe for selective and sensitive detection of ferric ions and bioimaging, J. Photochem. Photobiol., A, 2021, 412, 113253, DOI:10.1016/j.jphotochem.2021.113253.
- P. K. Praseetha, P. Chandran, V. A. Devi, P. Alexander and S. Vijayakumar, Biocompatible and nuclear penetrating carbon quantum dots for photoresistive bioimaging applications in animal cell lines, Gene Rep., 2022, 26, 101519, DOI:10.1016/j.genrep.2022.101519.
- S. Sawalha, M. Assali, A. Nasasrah, M. Salman, M. Nasasrah, M. Jitan, H. S. Hilal and A. Zyuod, Optical properties and photoactivity of carbon nanodots synthesized from olive solid wastes at different carbonization temperatures, RSC Adv., 2022, 12, 4490–4500, 10.1039/D1RA09273A.
- M. Pooresmaeil, H. Namazi and R. Salehi, Dual anticancer drug delivery of D-galactose-functionalized stimuli-responsive nanogels for targeted therapy of the liver hepatocellular carcinoma, Eur. Polym. J., 2022, 167, 111061–111072, DOI:10.1016/j.eurpolymj.2022.111061.
- H. L. Wu, M. Y. Qi, Z. R. Tang and Y. J. Xu, Semiconductor quantum dots: a versatile platform for photoredox organic transformation, J. Mater. Chem. A, 2023, 11, 3262–3280, 10.1039/D2TA09423A.
- S. Ganesan, R. Kalimuthu, T. Kanagaraj, R. Kulandaivelu, R. Nagappan, L. A. Pragasan and V. K. Ponnusamy, Microwave-assisted green synthesis of multi-functional carbon quantum dots as efficient fluorescence sensor for ultra-trace level monitoring of ammonia in environmental water, Environ. Res., 2022, 206, 112589–112612, DOI:10.1016/j.envres.2021.112589.
- Y. Zhang, M. Y. Qi, Z. R. Tang and Y. J. Xu, Photoredox-catalyzed plastic waste conversion: nonselective degradation versus selective synthesis, ACS Catal., 2023, 13, 3575–3590, DOI:10.1021/acscatal.3c00301.
- M. Y. Qi, M. Conte, M. Anpo, Z. R. Tang and Y. J. Xu, Cooperative coupling of oxidative organic synthesis and hydrogen production over semiconductor-based photocatalysts, Chem. Rev., 2021, 121, 13051–13085, DOI:10.1021/acs.chemrev.1c00197.
- Y. Wang, D. Chen, J. Zhang, M. S. Balogun, P. Wang, Y. Tong and Y. Huang, Charge Relays via Dual Carbon-Actions on Nanostructured BiVO4 for High Performance Photoelectrochemical Water Splitting, Adv. Funct. Mater., 2022, 32, 2112738, DOI:10.1002/adfm.202112738.
- Y. Vyas, P. Chundawat, D. Dharmendra, P. B. Punjabi and C. Ameta, Review on hydrogen production photocatalytically using carbon quantum dots: Future fuel, Int. J. Hydrogen Energy, 2021, 46, 37208–37241, DOI:10.1016/j.ijhydene.2021.09.004.
- R. Wang, K. Q. Lu, Z. R. Tang and Y. J. Xu, Recent progress in carbon quantum dots: synthesis, properties and applications in photocatalysis, J. Mater. Chem. A, 2017, 5, 3717–3734, 10.1039/C6TA08660H.
- K. Q. Lu, Q. Quan, N. Zhang and Y. J. Xu, Multifarious roles of carbon quantum dots in heterogeneous photocatalysis, J. Energy Chem., 2016, 25, 927–935, DOI:10.1016/j.jechem.2016.09.015.
- L. Cao, S. Sahu, P. Anilkumar, C. E. Bunker, J. Xu, K. A. S. Fernando, P. Wang, E. S. Guliants, K. N. Tackett II and Y. P. Sun, Carbon Nanoparticles as Visible-Light Photocatalysts for Efficient CO2 Conversion and Beyond, J. Am. Chem. Soc., 2011, 133, 4754–4757, DOI:10.1021/ja200804h.
- Y. Vyas, P. Chundawat, D. Dharmendra, A. Jain, P. B. Punjabi and C. Ameta, Biosynthesis and characterization of carbon quantum Dots@CuS composite using water hyacinth leaves and its usage in photocatalytic dilapidation of Brilliant Green dye, Mater. Chem. Phys., 2022, 281, 125921, DOI:10.1016/j.matchemphys.2022.125921.
- Y. Li, W. Xiang, T. Zhou, M. Huang, V. Wang, X. Wu, J. Mao and P. Wang, Visible light induced efficient activation of persulfate by a carbon quantum dots (CQDs) modified γ-Fe2O3 catalyst, Chin. Chem. Lett., 2020, 31, 2757–2761, DOI:10.1016/j.cclet.2020.01.032.
- A. Mahmood, G. Shi, Z. Wang, Z. Rao, W. Xiao, X. Xie and J. Sun, Carbon quantum dots-TiO2 nanocomposite as an efficient photocatalyst for the photodegradation of aromatic ring-containing mixed VOCs: an experimental and DFT studies of adsorption and electronic structure of the interface, J. Hazard. Mater., 2021, 401, 123402–123413, DOI:10.1016/j.jhazmat.2020.123402.
- Z. Yu, L. Zhang, X. Wang, D. He, H. Suo and C. Zhao, Fabrication of ZnO/Carbon Quantum Dots Composite Sensor for Detecting NO, Gas Sens., 2020, 20, 4961–4972, DOI:10.3390/s20174961.
- K. Wang, L. Liang, Y. Zheng, H. Li, X. Niu, D. Zhang and H. Fan, Visible light-driven photocatalytic degradation of organic pollutants via carbon quantum dots/TiO2, New J. Chem., 2021, 45, 16168–16178, 10.1039/d1nj02387j.
- W. Li, Z. Wang, Y. Li, J. B. Ghasemi, J. Li and G. Zhang, Visible-NIR light-responsive 0D/2D CQDs/Sb2WO6 nanosheets with enhanced photocatalytic degradation performance of RhB: Unveiling the dual roles of CQDs and mechanism study, J. Hazard. Mater., 2022, 424, 127595, DOI:10.1016/j.jhazmat.2021.127595.
- H. Ming, D. Wei, Y. Yang, B. Chen, C. Yang, J. Zhang and Y. Hou, Photocatalytic activation of peroxymonosulfate by carbon quantum dots functionalized carbon nitride for efficient degradation of bisphenol A under visible-light irradiation, Chem. Eng. J., 2021, 424, 130296–130310, DOI:10.1016/j.cej.2021.130296.
- S. H. Li, M. Y. Qi, Y. Y. Fan, Y. Yang, M. Anpo, Y. M. Yamada, Z. R. Tang and Y. J. Xu, Modulating photon harvesting through dynamic non-covalent interactions for enhanced photochemical CO2 reduction, Appl. Catal., B, 2021, 292, 120157, DOI:10.1016/j.apcatb.2021.120157.
- R. Wang, K. Q. Lu, F. Zhang, Z. R. Tang and Y. J. Xu, 3D carbon quantum dots/graphene aerogel as a metal-free catalyst for enhanced photosensitization efficiency, Appl. Catal., B, 2018, 233, 11–18, DOI:10.1016/j.apcatb.2018.03.108.
- S. H. Li, B. Weng, K. Q. Lu and Y. J. Xu, Improving the efficiency of carbon quantum dots as a visible light photosensitizer by polyamine interfacial modification, Acta Phys.-Chim. Sin., 2018, 34, 708–718, DOI:10.3866/PKU.WHXB201710162.
- S. Chen, G. Ma, Q. Wang, S. Sun, T. Hisatomi, T. Higashi, Z. Wang, M. Nakabayashi, N. Shibata, Z. Pan, T. Hayashi, T. Minegishi, T. Takata and K. Domen, Metal selenide photocatalysts for visible-light-driven Z -scheme pure water splitting, J. Mater. Chem. A, 2019, 7, 7415–7422, 10.1039/C9TA00768G.
- E. Rayappan, J. Muthaian and P. Muthirulan, Investigation on the photocatalytic activity of chemically synthesized zirconium doped cadmium selenide nanoparticles for indigo carmine dye degradation under solar light irradiation, J. Water Environ. Nanotechnol., 2021, 6, 177–187, DOI:10.22090/jwent.2021.02.07.
- M. K. Ahmed, A. E. Shalan, M. Afifi, M. M. El-Desoky and S. Lanceros-Méndez, Silver-doped cadmium selenide/graphene oxide-filled cellulose acetate nanocomposites for photocatalytic degradation malachite green toward wastewater treatment, ACS Omega, 2021, 6, 23129–23138, DOI:10.1021/acsomega.1c02667.
- D. Ren, O. Merdrignac-Conanec, V. Dorcet, M. Cathelinaud, Z. Zheng, H. Ma and X. Zhang, In situ synthesis and improved photoelectric performances of a Sb2Se3/β-In2Se3 heterojunction composite with potential photocatalytic activity for methyl orange degradation, Ceram. Int., 2020, 46, 25503–25511, DOI:10.1016/j.ceramint.2020.07.021.
- C. S. Diko, Y. Qu, Z. Henglin, Z. Li, N. Ahmed Nahyoon and S. Fan, Biosynthesis and characterization of lead selenide semiconductor nanoparticles (PbSe NPs) and its antioxidant and photocatalytic activity, Arabian J. Chem., 2020, 13, 8411–8423, DOI:10.1016/j.arabjc.2020.06.005.
- S. Sharma, A. Umar, S. K. Mehta and S. K. Kansal, Fluorescent spongy carbon nanoglobules derived from pineapple juice: a potential sensing probe for specific and selective detection of chromium (VI) ions, Ceram. Int., 2017, 43, 7011–7019, DOI:10.1016/j.ceramint.2017.02.127.
- A. Muthukannan, G. Sivakumar and K. Mohanraj, Influence of equimolar concentration on structural and optical properties of binary selenides nanoparticles, Part. Sci. Technol., 2014, 32, 392–398, DOI:10.1080/02726351.2014.880978.
- J. Bahadur, S. Agrawal, A. Parveen, A. Jawad, S. S. Z. Ashraf and R. M. Ghalib, Micro-structural, optical and dielectric properties of Ag doped TiO2 synthesized by sol-gel method, Mater. Focus, 2015, 4, 134–141, DOI:10.1166/mat.2015.1228.
- W. Reichardt, F. Gompf, M. Äın and B. M. Wanklyn, Lattice dynamics of cupric oxide, Z. Phys. B, 1990, 81, 19–24, DOI:10.1007/bf01454208.
- S. Yang, F. Ji, Z. Wang, Y. Zhu, K. Hu, Y. Ouyang, R. Wang, X. Ma and C. Cao, Microwave-assisted synthesis of CuSe nano-particles as a high -performance cathode for rechargeable magnesium batteries, Electrochim. Acta, 2019, 324, 134864–134871, DOI:10.1016/j.electacta.2019.134864.
- A. Gobeaut, L. Laffont, J. M. Tarascon, L. Parissi and O. Kerrec, Influence of secondary phases during annealing on re-crystallization of CuInSe2 electrodeposited films, Thin Solid Films, 2009, 517, 4436–4442, DOI:10.1016/j.tsf.2009.01.043.
- J. Y. C. Liew, Z. A. Talib, Z. Zainal, M. A. Kamarudin, N. H. Osman and H. K. Lee, Structural and transport mechanism studies of copper selenide nanoparticles, Semicond. Sci. Technol., 2019, 34, 125017–125027, DOI:10.1088/1361-6641/ab5436.
- H. A. Elazab, M. A. Sadek and T. T. El-Idreesy, Microwave-assisted synthesis of palladium nanoparticles supported on copper oxide in aqueous medium as an efficient catalyst for Suzuki cross-coupling reaction, Adsorpt. Sci. Technol., 2018, 36, 1352–1365, DOI:10.1177/0263617418771777.
- J. Moulder, W. Sticke, P. Sobol and K. Bomben, Standard ESCA spectra of the elements and line energy information, in Handbook of X-Ray Photoelectron Spectroscopy, ed. J. Chastain, Perkin Elmer Coorporation: Physical Electronics Division, USA, 1992 Search PubMed.
- H. Lin, M. Li, X. Yang, D. Yu, Y. Zeng, C. Wang, G. Chen and F. Du, Nanosheets assembled CuSe crystal pillar as a stable and high-power anode for sodium ion and potassium-ion batteries, Adv. Energy Mater., 2019, 9, 1900323–1900332, DOI:10.1002/aenm.201900323.
- N. H. Zainal Abidin, V. Wongso, K. C. Hui, K. Cho, N. S. Sambudi, W. L. Ang and B. Saad, The effect of functionalization on rice-husks derived carbon quantum dots properties and cadmium removal, J. Water Proc. Eng., 2020, 38, 101634–101646, DOI:10.1016/j.jwpe.2020.101634.
- D. F. Ollis, E. Pelizzetti and N. Serpone, Photocatalyzed destruction of water contaminants, Environ. Sci. Technol., 1992, 25, 1522–1529, DOI:10.1021/es00021a001.
- S. Sathiyavimal, S. Vasantharaj, M. Shanmugavel, E. Manikandan, P. Nguyen-Tri, K. Brindhadevi and A. Pugazhendhi, Facile synthesis and characterization of hydroxyapatite from fish bones: photocatalytic degradation of industrial dyes (crystal violet and Congo red), Prog. Org. Coat., 2020, 148, 105890, DOI:10.1016/j.porgcoat.2020.10589.
- M. Chahkandi, M. Zargazi, A. Hajizadeh and R. Tayebee, Insitu incorporation of Bi2O3 nanorods and Ag metal plasmonic surface into crystalline HAp nanosheets: efficient visible light degradation of phenol, J. Alloys Compd., 2022, 902, 163737, DOI:10.1016/j.jallcom.2022.163737.
- X. Su, W. Chen, Y. Han, D. Wang and J. Yao, In situ synthesis of Cu2O on cotton fibers with antibacterial properties and reusable photocatalytic degradation of dyes, Appl. Surf. Sci., 2020, 536, 147945, DOI:10.1016/j.apsusc.2020.147945.
- E. Lin, Z. Kang, J. Wu, R. Huang, N. Qin and D. Bao, BaTiO3 nanocubes/cuboids with selectively deposited Ag nanoparticles: efficient piezocatalytic degradation and mechanism, Appl. Catal., B, 2021, 285, 119823–119834, DOI:10.1016/j.apcatb.2020.119823.
- K. Rambabu, G. Bharath, F. Banat and P. L. Show, Green synthesis of zinc oxide nanoparticles using phoenix dactylifera waste as bioreductant for effective dye degradation and antibacterial performance in wastewater treatment, J. Hazard. Mater., 2021, 402, 123560–123572, DOI:10.1016/j.jhazmat.2020.123560.
- G. Chandrabose, A. Dey, S. S. Gaur, S. Pitchaimuthu, H. Jagadeesan, N. S. J. Braithwaite, V. Selvaraj, V. Kumar and S. Krishnamurthy, Removal and degradation of mixed dye pollutants by integrated adsorption-photocatalysis technique using 2-D MoS2/TiO2 nanocomposite, Chemosphere, 2021, 279, 130467–130479, DOI:10.1016/j.chemosphere.2021.130467.
- S. K. Sahoo, S. Padhiari, S. K. Biswal, B. B. Panda and G. Hota, Fe3O4 nanoparticles functionalized GO/g-C3N4 nanocomposite: an efficient magnetic nanoadsorbent for adsorptive removal of organic pollutants, Mater. Chem. Phys., 2020, 244, 122710, DOI:10.1016/j.matchemphys.2020.12.
- H. X. Guo, K. L. Lin, Z. S. Zheng, F. B. Xiao and S. X. Li, Sulfanilic acid-modified P25 TiO2 nanoparticles with improved photocatalytic degradation on Congo red under visible light, Dyes Pigm., 2012, 92, 1278–1284, DOI:10.1016/j.dyepig.2011.09.004.
Footnote |
| † Electronic supplementary information (ESI) available. See DOI: https://doi.org/10.1039/d3na00268c |
| This journal is © The Royal Society of Chemistry 2023 |

