
 Open Access Article
 This Open Access Article is licensed under a
 Creative Commons Attribution 3.0 Unported Licence
Green room temperature synthesis of silver–gold alloy nanoparticles†
N. E.
Traoré
 ab,
M. J.
Uttinger
ab,
P.
Cardenas Lopez
ab,
D.
Drobek
c,
L.
Gromotka
ab,
J.
Schmidt
ab,
J.
Walter
ab,
B.
Apeleo Zubiri
c,
E.
Spiecker
c and
W.
Peukert
*ab
ab,
M. J.
Uttinger
ab,
P.
Cardenas Lopez
ab,
D.
Drobek
c,
L.
Gromotka
ab,
J.
Schmidt
ab,
J.
Walter
ab,
B.
Apeleo Zubiri
c,
E.
Spiecker
c and
W.
Peukert
*ab
aInstitute of Particle Technology, Friedrich-Alexander-Universität Erlangen-Nürnberg, Cauerstraße 4, 91058 Erlangen, Germany. E-mail: wolfgang.peukert@fau.de
bInterdisciplinary Center for Functional Particle Systems, Friedrich-Alexander-Universität Erlangen-Nürnberg, Haberstraße 9a, 91058 Erlangen, Germany
cInstitute of Micro- and Nanostructure Research (IMN), Center for Nanoanalysis and Electron Microscopy (CENEM), Interdisciplinary Center for Nanostructured Films (IZNF), Friedrich-Alexander-Universität Erlangen-Nürnberg, Cauerstraße 3, 91058 Erlangen, Germany
First published on 13th February 2023
Abstract
Metallic alloy nanoparticles (NPs) exhibit interesting optical, electrical and catalytic properties, dependent on their size, shape and composition. In particular, silver–gold alloy NPs are widely applied as model systems to better understand the syntheses and formation (kinetics) of alloy NPs, as the two elements are fully miscible. Our study targets product design via environmentally friendly synthesis conditions. We use dextran as the reducing and stabilizing agent for the synthesis of homogeneous silver–gold alloy NPs at room temperature. Our approach is a one-pot, low temperature, reaction-controlled, green and scalable synthesis route of well-controlled composition and narrow particle size distribution. The composition over a broad range of molar gold contents is confirmed by scanning transmission electron microscopy-energy-dispersive X-ray spectroscopy (STEM-EDX) measurements and auxiliary inductively coupled plasma-optical emission spectroscopy measurements (ICP-OES). The distributions of the resulting particles in size and composition are obtained from multi-wavelength analytical ultracentrifugation using the optical back coupling method and further confirmed by high-pressure liquid chromatography. Finally, we provide insight into the reaction kinetics during the synthesis, discuss the reaction mechanism and demonstrate possibilities for scale-up by a factor of more than 250 by increasing the reactor volume and NP concentration.
1 Introduction
Particles with a nominal size below 100 nm are widely classified as nanoparticles (NPs).1 Their size, surface, structure and chemical composition directly define their physical properties, i.e. specifically their optical and electrical properties. In recent times, a wide range of NPs have been successfully used in many fields of application such as microelectronics,2,3 medicine4 and the chemical industry.5 In this context, targeted product design strategies of any type of NPs require an iterative approach and multiple optimization steps.6 In particular, the NPs' composition, size and shape7,8 have to be precisely controlled both in the lab and during scale-up. Therefore, methods to determine those quantities are imperative for the development of promising synthesis routes.In the context of product design, particulate systems have attracted increasing interest due to their unique functionalities.9 Specific examples include quantum dots,10,11 which are used in modern displays,12,13 solar cells14,15 or nanosensors,16 and precious metal NPs, which play an important role in plasmonic sensors17,18 or catalysis.19 Moreover, as many applications depend on the product quality, especially in terms of particle size distribution (PSD) and composition, the development of scalable synthesis strategies for well-controlled particles with a defined composition is mandatory.20,21 Examples are quantum dots, whose optical properties are determined by their PSD due to their size-dependent bandgap energy,22–24 or gold NPs, whose size influences their distribution in the body and blood circulation times.25–27 The latter are especially relevant when used as contrast agents for computed tomography.27–30 Alloy NPs find applications in a variety of fields including heterogeneous catalysis.19,31 Further, medical applications of alloy NPs show promising results, e.g. in the case of hyperthermia treatment of tumors.4,32 The anti-bacterial properties of silver NPs33 can be combined with the biological inertness of gold NPs in silver–gold alloy NPs, effectively varying the dose of the antibacterial component.34 Aside from their specific applications, silver and gold NPs are often used as model alloy systems to better understand the formation of other alloy NPs as silver and gold atoms are fully miscible due to their almost identical lattice constants.35–37
A variety of different synthesis routes has been reported in literature. These include gas phase syntheses like flame spray pyrolysis,38 as well as more commonly used liquid phase synthesis routes like laser syntheses,36,37,39,40 microwave assisted synthesis routes,41 electrochemical reduction,35 chemical co-reduction42–45 and biosynthesis utilizing bacteria46 or fungi.47–49 The exploited particle formation mechanisms depend strongly on the built-up supersaturation.37,39,40 Chemical co-reduction is the most commonly applied route for the synthesis of silver and gold NPs. Co-reduction can be achieved via electrochemical routes in a multi-potentiostat,35 chemical routes by addition of a reducing agent like sodium borohydride45 or biochemical routes by exposure to bacteria46 or fungi.47–49 It consists of three main steps: (1) the reduction of precursor ions and supersaturation build-up, (2) the nucleation of the free gold and silver atoms to stable nuclei and (3) the growth of nuclei to NPs.50–55 The final particles are subsequently stabilized. Commonly, AgNO3 is chosen as the silver precursor salt and HAuCl4·3H2O as the gold precursor salt. Due to the growing need of environmentally friendly methods in the production of NPs, especially green synthesis routes receive increased attention in the field.56
While many synthesis routes reported in literature show promising results in terms of the produced NPs' properties, a compromise between harsh process conditions in terms of temperature, energy input and hazardous chemicals on the one hand, and the precise adjustment of the composition of the resulting particles on the other hand, is necessary. For the transfer of lab protocols to industrial production at a larger scale, all these aspects must be considered during scale-up, while keeping all disperse properties, in particular size and composition, constant. The laser, electrochemical and flame spray synthesis routes reported above require dedicated equipment, biochemical reductions with bacteria and fungi require a prior cultivation step.47,49 Additionally, the produced NPs usually show a comparably wide or even bimodal PSD,46–49 non-spherical shapes47 or varying compositions.46,49 Moreover, multiple syntheses were reported using citrate at temperatures above 100 °C under vigorous mixing.42,44 Few syntheses at room temperature were reported using sodium borohydride and other harmful chemicals.44,45 A two-step green synthesis route using dextran as the reducing and capping agent was reported by Bankura et al. In this work, silver NPs were produced in the first step and alloys were synthesized by mixing with gold precursor.57 The produced alloy NPs, however, were neither tuned to precise molar compositions nor analyzed comprehensively to judge their quality.
In our study, we synthesized silver–gold alloy NPs with accurately adjustable molar compositions and constant mean particle sizes at room temperature using dextran as the reducing as well as the capping agent. The NPs are produced via a one-pot, low temperature, reaction-controlled, green and scalable synthesis route. The produced NPs are analyzed with regards to their distribution in size and chemical composition using multi-wavelength analytical ultracentrifugation (MWL-AUC). The hereby generated unique 2D distributions present an excellent measure for the quality of the produced particles with outstanding accuracy, reproducibility and statistical significance. The particles are further characterized by UV-vis spectroscopy, size exclusion chromatography and scanning transmission electron microscopy (STEM). We show how our novel green synthesis route at room temperature results in narrowly distributed alloy NPs with respect to size and composition. The optical properties of the alloy NPs can be directly controlled by varying the alloy composition. Moreover, the alloy NPs are biocompatible due to the use of dextran as a stabilizer, while maintaining green process conditions at atmospheric pressure and room temperature without the need of fast mixing throughout the reaction. The latter aspect largely simplifies scale-up since mass transfer issues during mixing are avoided when moving from small to larger reactors. Hence, our results aim towards a targeted product design to provide tailored silver–gold alloy NPs without the need of complex NP synthesis routes while maintaining green synthesis conditions. We further intend to establish our synthesis protocol as a model system for automated syntheses and for the detailed investigation of the particles' formation mechanism.
2 Materials and methods
2.1 Synthesis of silver–gold alloy nanoparticles
Silver nitrate in aqueous solution (1 M) was purchased from VWR Chemicals (Darmstadt, Germany). Hydrogentetrachloroaurat(III) trihydrat was purchased from Sigma Aldrich (Taufkirchen, Germany). Sodium hydroxide solution (1 M) was purchased from Honeywell (Seelze, Germany). Dextran with a molecular weight of 40 kDa was purchased from ITW Reagents (Darmstadt, Germany). All reagents have been used without further purification. Deionized water (>17 MΩ cm) was used for all experiments in this work.For the synthesis of alloy NPs with a molar gold content of 50%, a dextran solution was prepared by dissolving 5 g of dextran in 100 mL of water. 4.5 mL of this solution was transferred into a 10 mL snap cap vial and mixed with 0.5 mL of a 1 mM aqueous solution of AgNO3 and 0.5 mL of a 1 mM aqueous solution of HAuCl4. Different compositions were produced by changing the molar ratio of silver to gold, while keeping the total volume of 1 mL constant. After mixing, 0.5 mL of a 10 mM NaOH solution was added to the mixture to start the reduction, followed by another mixing step. The mixing was stopped and the solution was kept under the fume hood overnight. After several hours, the solution showed an orange color, which can be attributed to the formation of stabilized silver–gold alloy NPs. Pure gold NPs were synthesized according to the same protocol, while for the synthesis of silver NPs, the concentration of the NaOH solution was set to 100 mM.
2.2 Methods
![[thin space (1/6-em)]](https://www.rsc.org/images/entities/char_2009.gif) 000 rpm and held for the necessary amount of time until all NPs had sedimented. The sedimentation velocity experiments were conducted with a radial step size of 50 μm and rotor speeds of 5500 rpm (silver and gold NPs) and 18000 rpm (silver–gold alloys).
000 rpm and held for the necessary amount of time until all NPs had sedimented. The sedimentation velocity experiments were conducted with a radial step size of 50 μm and rotor speeds of 5500 rpm (silver and gold NPs) and 18000 rpm (silver–gold alloys).
The acquired gravitational sweep sedimentation data was analyzed using HDR-MULTIFIT (high dynamic range-multi-wavelength fitting)61 with 150 grid points and a confidence level of 0.95. Sedimentation velocity data of the measured silver and gold NPs was analyzed with a c(s) continuous size distribution model in the software Sedfit (version 16-1c).62 The data was fitted with the second derivative regularization using a confidence level of 0.95 and resolution of 150 grid points. In addition, automated multi-wavelength analyses were conducted for selected alloy NPs using a modified ls-g*(s) algorithm based on the work of Walter et al.63 Data was fitted with the second derivative regularization using a confidence level of 0.9 as well as 200 grid points for the sedimentation coefficient and 0.5 nm resolution for the wavelength. Multi-wavelength sedimentation coefficient distributions obtained from gravitational sweep and sedimentation velocity data were analyzed using the optical-back coupling (OBC) method according to the procedure of Cardenas et al.58
As relevant input for the AUC and OBC analyses, the dynamic viscosity and density of the solvent were measured at 20 °C with a Lovis 2000 ME viscosimeter and a DMA 5000 M density meter, respectively. Both instruments from Anton Paar (Graz, Austria). A medium viscosity of 2.276 mPa s and a density of 1.01673 g cm−3 were measured.
3 Results and discussion
3.1 Synthesis of pure silver and gold nanoparticles
The synthesis of pure silver and gold NPs using dextran as the reducing and the stabilizing agent has been reported in literature before.33,57,73 As noted, the resulting particles under the described conditions show a fairly wide PSD33,73 or strong agglomeration within the samples,57 hence in our work, synthesis conditions were optimized to gain an understanding of the system and receive NPs with a mean size below 10 nm with a narrow PSD. For this purpose, preliminary experiments were performed on the synthesis of pure silver and gold NPs prior to the synthesis of silver–gold alloy NPs. The synthesis protocol was carried out according to the methodology, which has been outlined in the materials and methods section of this publication. The optimized conditions were found to be at pH 10 and 12 for gold and silver NPs, respectively, room temperature and the concentrations described in the materials and methods section of this work. The inset of Fig. 1 depicts STEM images of synthesized silver NPs (Fig. 1a) and gold NPs (Fig. 1b) under optimized synthesis conditions, serving as a proof-of-concept for our synthesis of spherical NPs. Moreover, Fig. 1 shows the PSD as measured by MWL-AUC experiments and validated by STEM image analysis (>160 particles counted). Both PSDs agree very well. | ||
| Fig. 1 STEM images and measured PSDs of silver (a) and gold (b) NPs produced according to the experimental procedure described in the materials and methods section. | ||
Furthermore, it can be seen from both panels in Fig. 1 that the NPs show a narrow PSD with a mean particle size of (4.47 ± 0.56) nm for Ag and (5.1 ± 0.67) nm for Au, respectively, as retrieved from the MWL-AUC distributions. The standard deviations are 12.7% and 13.1% for silver and gold, respectively, which is in line with standard syntheses for gold and silver NPs found in literature. Puntes et al. reported values of 9.7% (ref. 74) and 11.9% (ref. 75) for silver and gold respectively, while Turkevich reported values between 8.1% and 12.5% (ref. 76) for his standard gold NP synthesis. A stabilizing dextran shell with a thickness of 2.3 nm was retrieved from sedimentation velocity experiments and assumed constant for all compositions of particles between pure silver and gold. Details on the method to determine the shell thickness can be found in the ESI.† Notably, the pH during the synthesis of the silver NPs was slightly higher. This is firstly due to the formation of Ag2O from AgNO3 under alkaline conditions,33,51,77 which shows a faster reduction kinetic to Ag0 in the subsequent step than the reduction of silver ions.51,77 It was shown by Nishimura et al. that an increasing ratio of NaOH to AgNO3 increases the reaction kinetics for the formation of Ag0.77 Secondly, an increase in the pH increases the potency of dextran due to the formation of alkoxide groups. Alkoxide groups are generated through the deprotonation of hydroxyl or aldehyde groups by the negatively charged hydroxide ions in solutions at elevated pH levels. The negatively charged alkoxide groups subsequently reduce the metal ions and are therefore responsible for the reduction of metal ions to metal atoms.33,78 Both effects thereby lead to a higher supersaturation of silver atoms, which in turn leads to a faster nucleation step, resulting in a higher concentration of smaller silver particles and a narrower distribution in sizes.79
3.2 Synthesis and characterization of silver–gold alloy NPs
 | ||
| Fig. 2 (a) EDX map of silver–gold alloy NPs with a molar gold content of 25% (inset) and their respective elementary concentration over the spatial coordinate. (b) PSD for a molar gold content of 25% as retrieved from STEM measurements and exemplary STEM images (inset). (c) EDX map of silver–gold alloy NPs with a molar gold content of 50% (inset) and their respective elementary concentration over the spatial coordinate. (d) PSD as retrieved from STEM measurements and exemplary STEM images (inset). (e) EDX measurement for alloy NPs with a molar gold content of 75% (inset) and their respective elementary concentration over the spatial coordinate. (f) PSD for a molar gold content of 75% as retrieved from STEM measurements and exemplary STEM images (inset). The EDX maps show the net intensity of gold in green and silver in red with the white arrow indicating the line scan, measuring the local element distribution shown in graph a, c and e. Additional HR-STEM images of the samples can be found in Fig. S7 in the ESI.† | ||
The analysis of the EDX measurements shows the chemical composition for alloy NPs with an expected molar gold content of 25%, 50% and 75%. Mean molar gold contents of (24.5 ± 7.5)%, (47 ± 2)% and (79 ± 7.0)% are retrieved respectively, which is in good agreement with the targeted values and proofs that all compositions can be synthesized within good accuracy with our protocol. This result validates that the composition of the alloy NPs can be controlled by the initial molar concentration of the precursors during a room temperature synthesis using dextran as a reducing and capping agent. Furthermore, the line profiles through the particles in the EDX analyses proof that the molar distribution within an alloy NP is, in most cases, homogenous. However, as typical for co-reduced silver–gold bimetallic NPs, some of the produced NPs, especially NPs with a high molar silver content (Fig. 2a, silver content = 75%), show an enrichment of gold in the center of the particles and an enrichment of silver atoms towards the outer spatial coordinate of the NP.39,44,81,82 This can be explained by the higher bond strength between gold atoms, compared to the gold–silver bond, which is higher than the bond between silver atoms.56 Also the redox potential of gold ions is higher compared to silver ions.83–85 Finally, the surface energy of silver is lower than that of gold.56 While a slight gradient of the composition seems to be present within some of the particles, no core–shell structure was found. The analysis of the optical properties of the alloy NPs (see Fig. 3) further proofs that point.
 | ||
| Fig. 3 (a) Silver–gold alloy NP dispersions from pure gold (left) to pure silver (right) in 10% composition intervals. (b) UV-vis extinction spectra of silver–gold alloy NPs and (c) their LSPR compared to the simulated values using Mie's theory calculations. | ||
In order to proof the accuracy with which the composition of the produced particles can be adjusted using our new synthesis route, we synthesized silver–gold alloy NPs for a broad range of molar gold contents in intervals of 10 mol%. The alloy NP suspensions show a color spectrum in between bright red, which is typical for gold NPs, and bright yellow, which is typical for silver NPs, according to their molar composition (see Fig. 3a). Remarkably, the corresponding UV-vis spectra (Fig. 3b) show only one peak, which is unequivocally distinguishable for each composition, clearly demonstrating the precise adjustability of the particles' compositions.
To further solidify the optical model and create a basis on which the composition of the synthesized alloy NP can be assessed, ICP-OES measurements were performed for alloy NPs with a molar gold content of 26%, 58% and 82% according to the optical model. The ICP-OES measurements confirmed the molar gold content of the alloy NPs, which was determined from the optical model after Rioux67 (Table 1). This proofs that the used optical model is in fact accurately predicting the molar composition of the produced silver–gold alloy NPs. Slight deviations in the retrieved compositions can be explained by minor variations in the preparation of the ICP-OES samples as well as the measurement itself.
| LSPR position/nm | Gold concentration from ICP-OES measurements/mg L−1 | Silver concentration from ICP-OES measurements/mg L−1 | Molar silver content retrieved from ICP-OES measurements/— | Molar silver content retrieved from optical model/— |
|---|---|---|---|---|
| 430 | 4.80 ± 0.30 | 6.04 ± 0.18 | 0.70 ± 0.009 | 0.74 |
| 464 | 8.24 ± 0.37 | 2.98 ± 0.13 | 0.40 ± 0.001 | 0.42 |
| 500 | 15.02 ± 0.32 | 2.04 ± 0.10 | 0.20 ± 0.005 | 0.18 |
As expected and described above, the spectrum in the color of the solutions results from a shift in the plasmonic peak between the LSPR of silver and gold NPs. Simulations using Mie's theory further confirmed the shift in the LSPR. Fig. 3c shows the shift in the LSPR according to theoretically modeled values from Mie calculations, compared to the measured values. The UV-vis spectra are in good agreement with the simulated LSPR values. This indicates that the formation of alloy NPs with a highly controllable composition is possible by our synthesis protocol.
The theoretical LSPR positions over the respective alloy composition can be fitted via a quadratic function (see eqn (1) and the dashed line in Fig. 3c). Using the function, the LSPR position of alloys with any given molar gold content xAu can be calculated.
| LSPR/nm = 403.0 + 87.10xAu + 29.72xAu2 | (1) |
The equation is a purely empirical fit, which is only valid for particles of the same size as the particles within this study (5–8 nm), since the plasmon bands shift to higher wavelengths for larger particles.
 | ||
| Fig. 4 Two-dimensional property distributions of the synthesized alloy NP dispersions with a molar gold content of 25% (a) and 90% (b). Additional distributions can be found in the ESI.† The particle size is displayed on the y – axis and the molar gold content on the x – axis. | ||
In order to confirm the presence of a narrow monomodal PSD as retrieved from MWL-AUC and to investigate colloidal stability with respect to particle–particle interactions within the dispersions, size-exclusion chromatography (SEC) was performed. Here, the retention volume is coupled with the hydrodynamic diameter of the alloy NPs. While smaller NPs enter the pores of the stationary phase materials more deeply and therefore have a longer residence time within the column, larger NPs are restricted to larger pores only, thus exit the column faster. The zeta potential of the synthesized particles was determined to −29 mV and the zeta potential of the stationary phase of the column was −40.7 mV. Electrostatic binding of the particles to the column can therefore be ruled out. In Fig. 5, the chromatogram of alloy NPs with a molar gold content of 50% is depicted. A narrow monomodal retention volume distribution is detected. The corresponding extinction spectra, which are directly measured during the SEC experiment, show a plasmonic peak, which corresponds to a molar gold content of 50%. A second small peak at a retention volume of around 6 mL is visible. Based on its extinction spectrum (see Fig. S5†) and its low retention volume, this can be attributed to minor agglomeration during the synthesis. Notably, due to the clear distinction of the agglomerate peak from the main signal, it can easily be separated within the SEC experiment. A third shoulder at a retention volume of 12.5 mL was identified as free unbound dextran based on its extinction spectrum (see Fig. S5†).
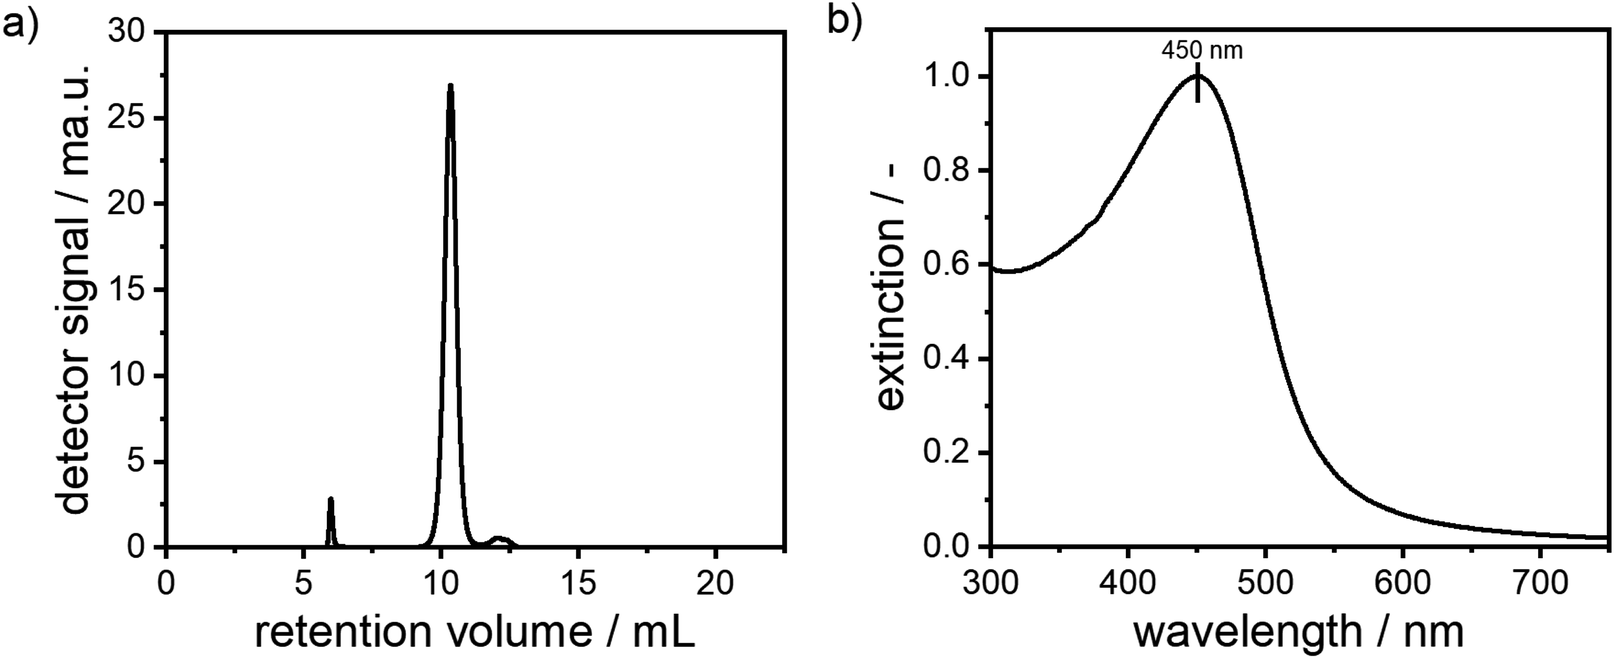 | ||
| Fig. 5 Chromatogram and corresponding UV-vis extinction signal of a suspension of silver–gold alloy NPs with a molar gold content of 50%. | ||
The stability of alloy NP dispersions is governed by particle–particle and particle–solvent interactions, which is related to concentration non-ideality88–91 As the alloy NPs are fully covered with a stabilizing shell of dextran, the attractive van der Waals core–core interactions are suppressed, i.e. the interactions are mostly defined by the interactions of the dextran shells. In order to provide insight into colloidal stability with respect to concentration non-ideality, alloy NPs with different particle concentrations were measured by SEC and the elution times were retrieved, as can be seen in both panels of Fig. 6. No significant shift in the retention volume is noticeable, which points to the excellent stability of the particles, as no agglomerates are formed and no change in the interaction with the stationary phase of the HPLC column is observed. Moreover, the peak at around 12.5 mL remains unchanged and further confirms the presence of free dextran.
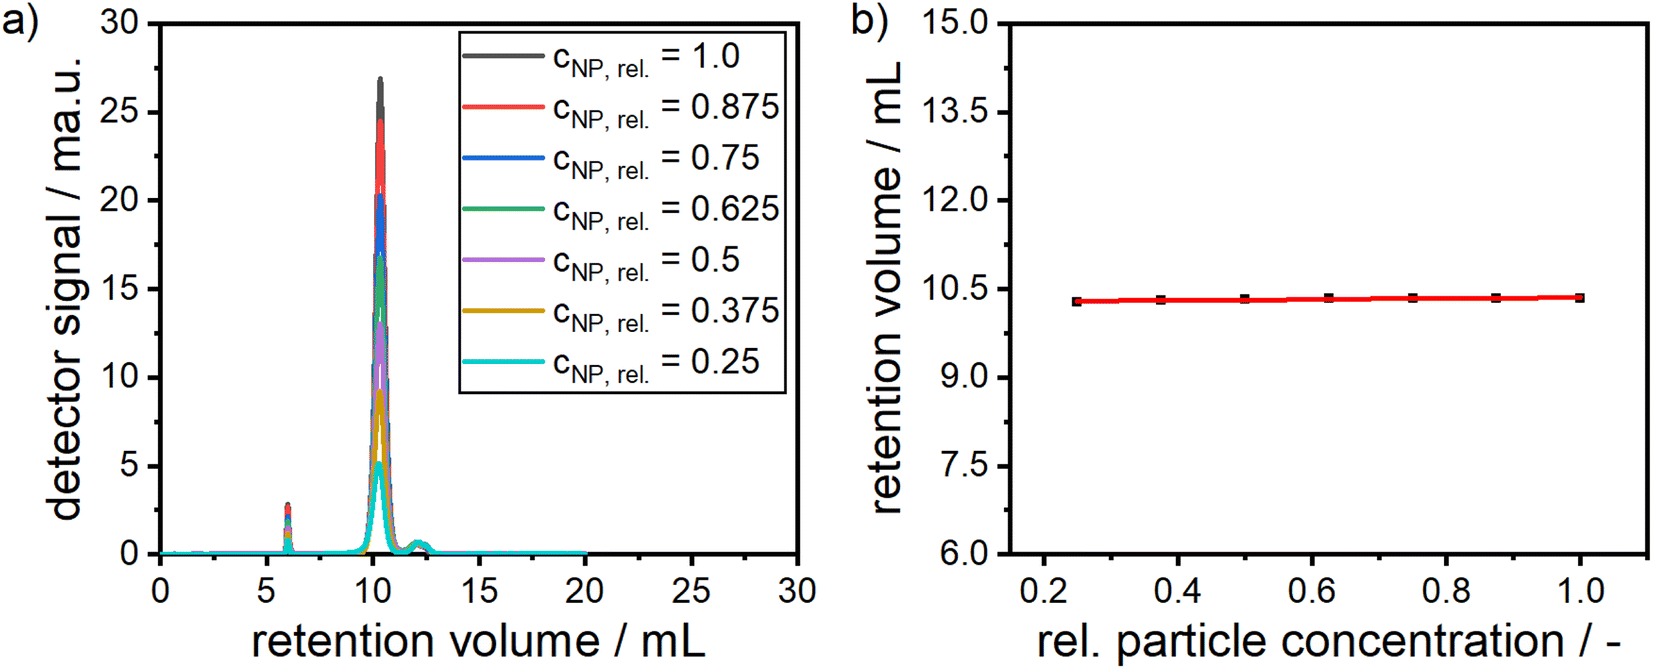 | ||
| Fig. 6 (a) Detector signals for multiple dilutions and (b) retention volume over the relative particle concentration as measured from SEC. | ||
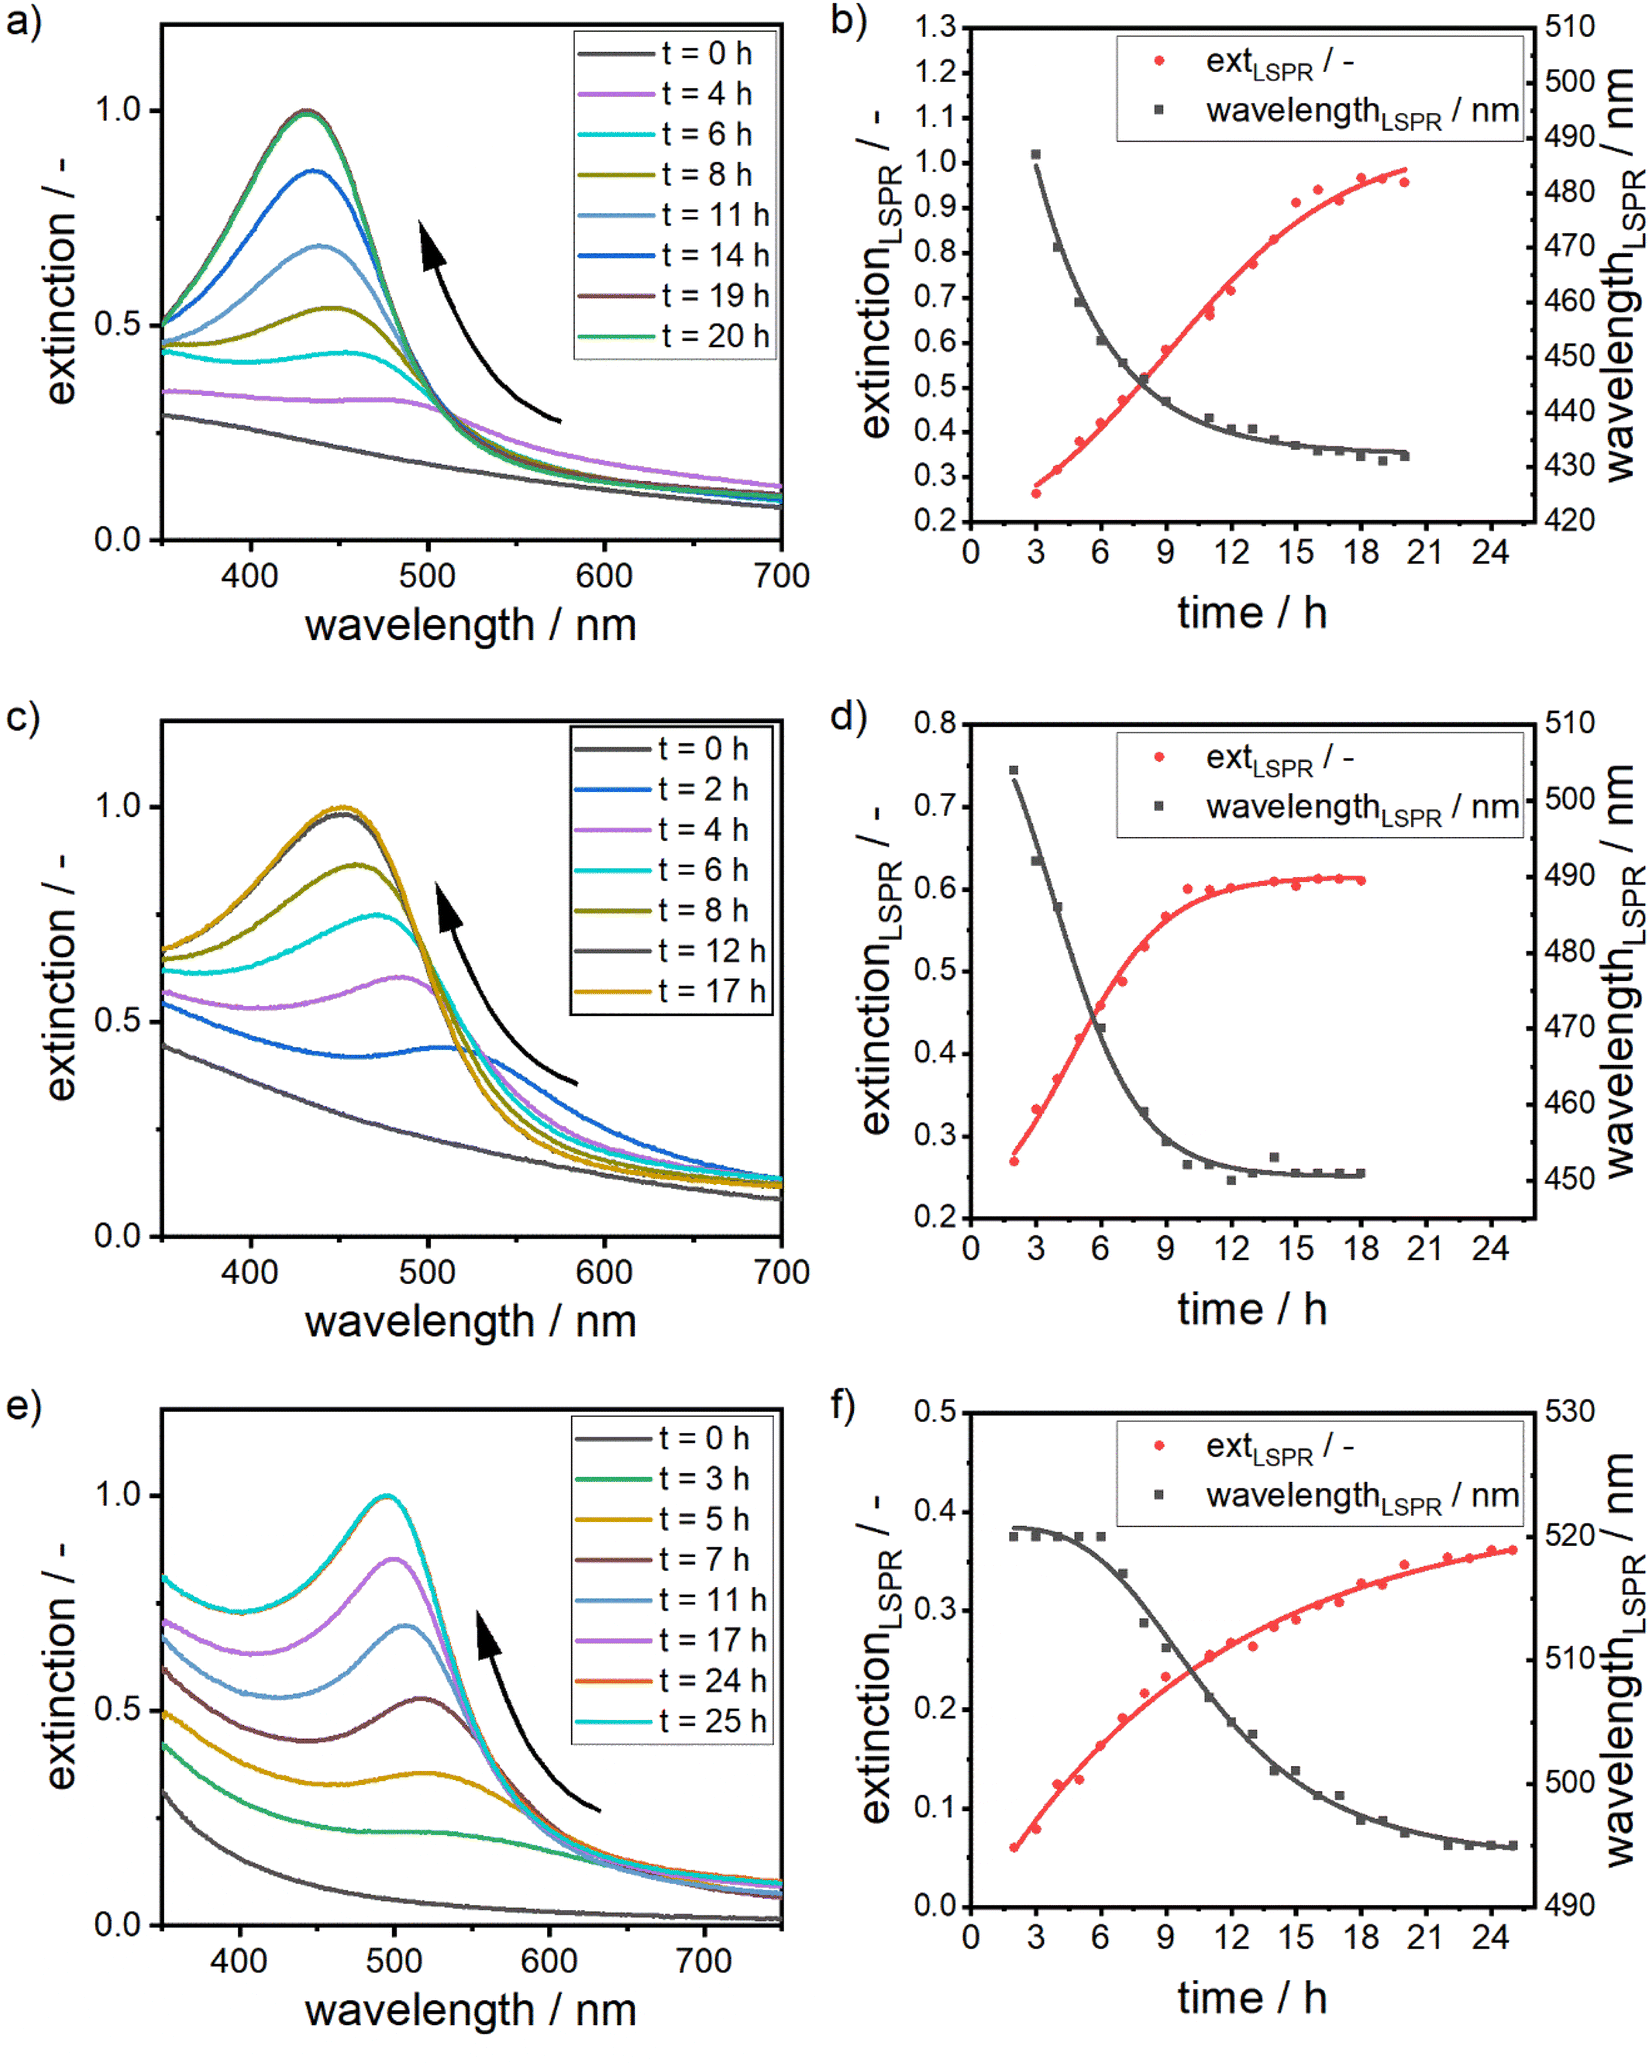 | ||
| Fig. 7 (a) Time-resolved extinction spectra of a silver–gold alloy NPs with a targeted molar gold content of 25%. (b) Corresponding shift in the LSPR position as well as the increase in the extinction at the position of the LSPR peak. (c) Time-resolved extinction spectra of a silver–gold alloy NPs with a targeted molar gold content of 50%. (d) Corresponding shift in the LSPR position as well as the increase in the extinction at the position of the LSPR peak. (e) Time-resolved extinction spectra of a silver–gold alloy NPs with a targeted molar gold content of 75%. (f) Corresponding shift in the LSPR position as well as the increase in the extinction at the position of the LSPR peak. Solid lines in (b, d and f) provide a guide-to-the-eye. | ||
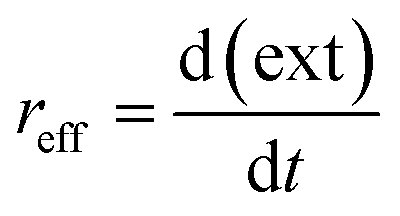
The reaction is rather slow and appears to be completed after 17 to 24 hours (see Fig. 7b, d and f). The formation is thus reaction- and not mixing-controlled, as convection and diffusion happens on much shorter time scales. The change in the extinction values at the respective LSPR position over time can be interpreted as an effective reaction rate reff (see eqn (2)). For that we fit a linear equation to the region in the extinction–time diagrams (Fig. 7b, d and f), in which the extinction increases linearly with time. From the slope of this function, we can then determine the effective reaction rate (see Fig. S9 of the ESI†).
 | (2) |
The formation of the silver–gold alloy NPs starts with the formation of a gold-rich nucleus, which grows to an alloy NP. This is associated with a shift in the chemical composition from pure gold to the desired molar gold content, which is in line with the EDX maps. Due to the higher redox potential, the gold ions are reduced faster, leading to a higher concentration of gold atoms in the solution. Together with the higher bond strength between the gold atoms, NPs, which are formed at the beginning of the reaction, show a high molar gold content.
The gold content of early particles further depends on the concentration of the gold precursor in the precursor mixture. As the early particles are formed via a crystallization reaction, the concentration of silver and gold atoms in solution prior to the nucleation step determines the composition of the formed NPs. This is displayed in the position of the LSPR peak at early reaction times. After three hours of reaction time, the LSPR position shifts to lower wavelengths with an increase in silver content (see Table 2). For suspensions containing NPs with a high molar gold content of 75%, the LSPR position remains at 520 nm for several hours, which is exactly the LSPR position of pure gold particles, as little silver is present in the beginning of the nucleation.
| x Au = 0.75 | x Au = 0.50 | x Au = 0.25 | |
|---|---|---|---|
| r eff/h−1 | 0.025 | 0.04 | 0.05 |
| λ LSPR @ 3 h/nm | 520 | 492 | 487 |
| pH/— | 10.91 | 11.08 | 11.17 |
Over time, the composition shifts and eventually reaches the desired composition. This trend is clearly visible for all three compositions, which hints at the mechanism of alloy formation.
Additionally, it can be observed that the effective reaction rates increase with an increase in silver concentration. This can be explained by a change in the pH values of the solutions. As the gold precursor used for this study is highly acidic and the concentration of NaOH is kept constant for all experiments, the pH in the reaction mixtures decreases with an increase in gold precursor concentration. As described above, the pH of the solution has a strong influence on the reduction behavior of dextran and the metal precursors:
• The reduction potential of dextran increases with increasing pH, which leads to a higher reduction rate of gold and silver.78
• The reduction rates of silver and gold react in an inverse fashion to an increase in the pH level. Silver shows a higher reduction rate,77 while gold shows a lower rate.92
This in sum leads to a higher effective reaction rate for silver rich alloy NPs, where the gold precursor concentration is lower and further explains the differences in the LSPR position at early time points. As the pH is higher for low gold precursor concentrations, the gold reduction rate is reduced, while the silver reduction rate is increased, which leads to a higher silver content in the early particles and thus to a lower LSPR position, further showing the extreme dependency of the system on the pH of the dispersion. Since the reaction rate captured by the change in the extinction of the system at the respective LSPR position is an effective rate, the inverse reaction of the different reaction partners to the pH value also explains the non-linear relationship between pH and effective reaction rate.
Overall, the changes in the optical spectra allow for the quantitative analysis of the formation dynamics of the particles with further in and ex situ measurement techniques and provides in-depth understanding of their formation behavior. A corresponding study is currently ongoing. Notably, our results are directly in accordance with findings reported in the literature over a variety of different reaction routes.39,44,49
As the herein described formation process of alloy NPs is reaction controlled, mass transfer issues during mixing are avoided when moving from small to larger reactors. Fig. 8a and b show the results for an increase in reaction volume by a factor of more than 60 from an initial volume of 6 mL to a maximum volume of 400 mL.
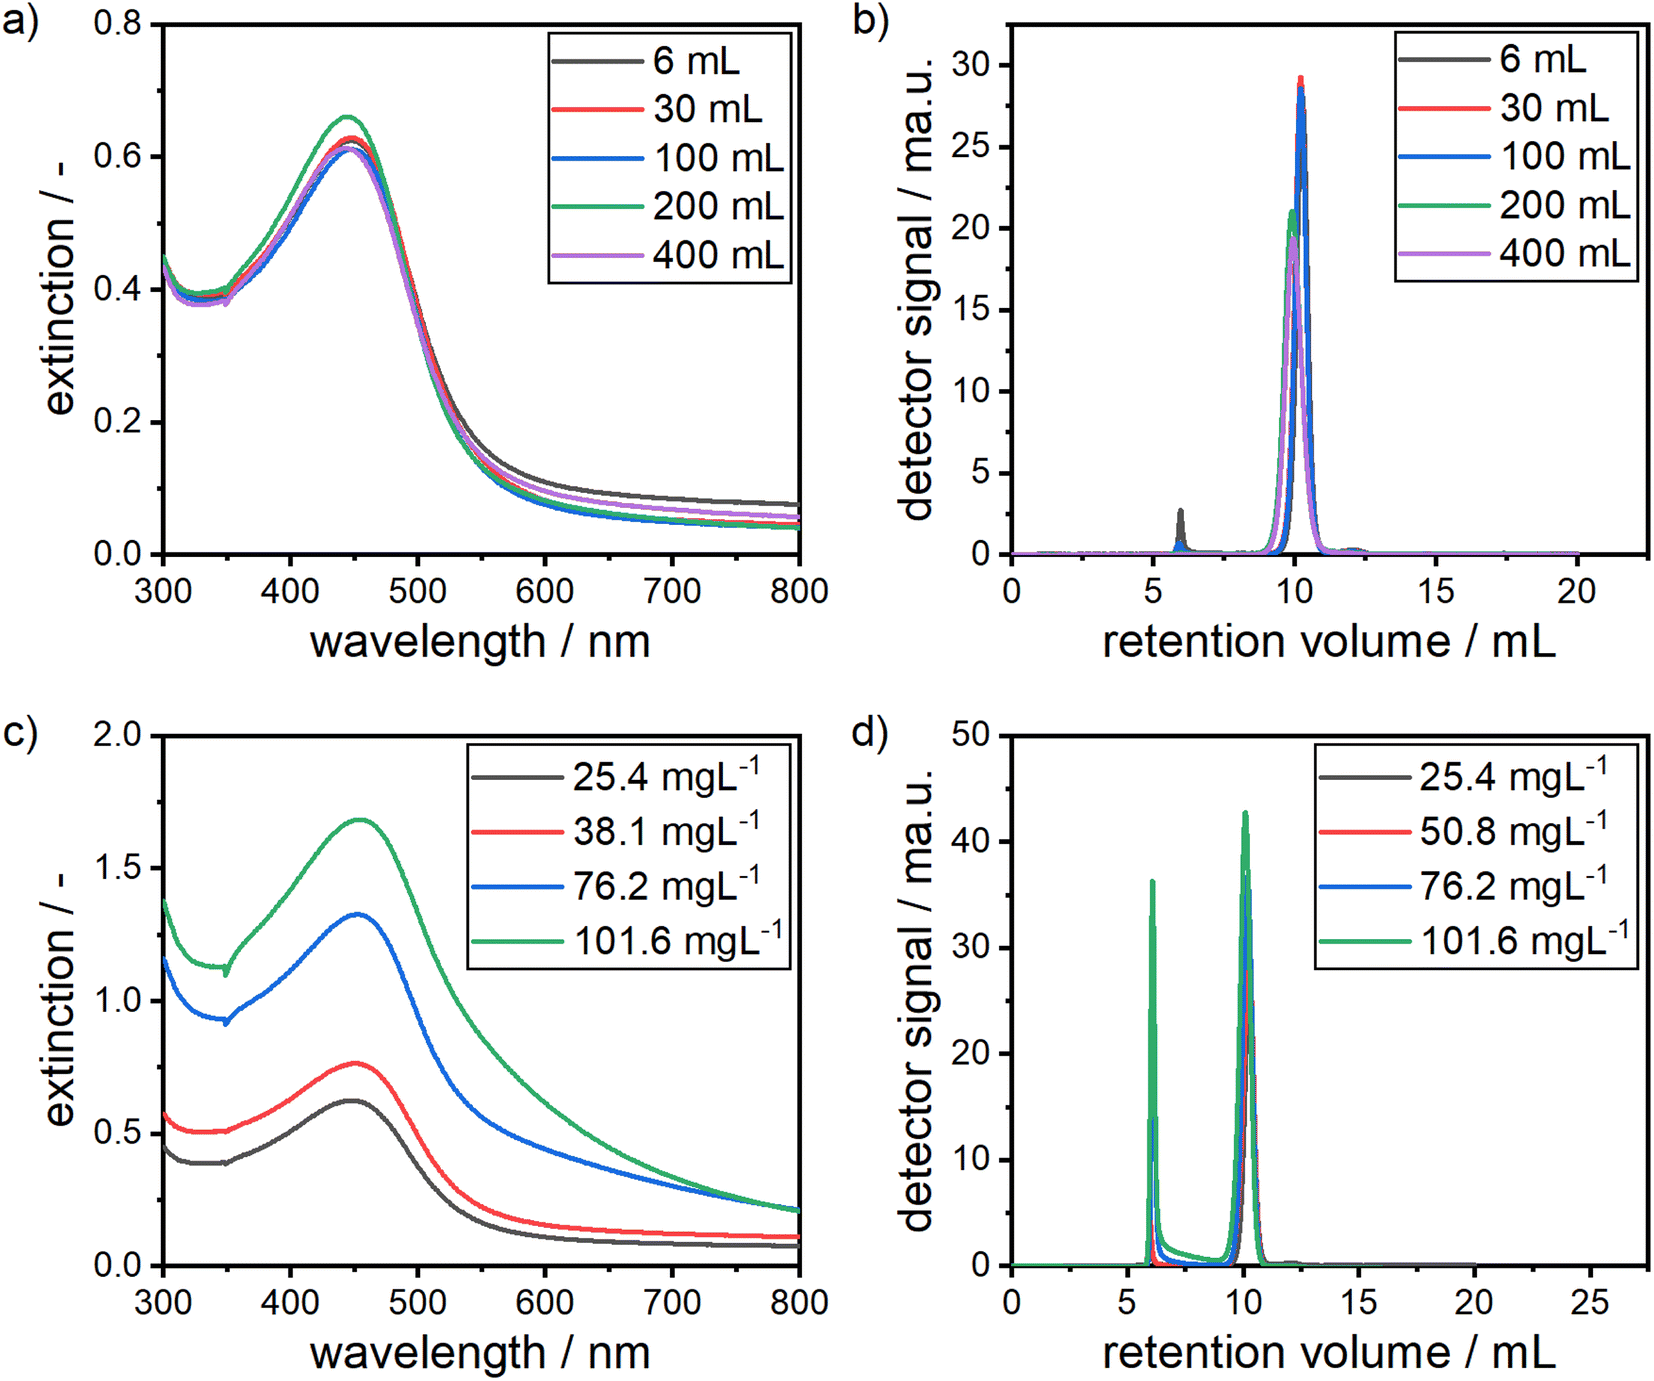 | ||
| Fig. 8 UV-vis spectra of alloy NP dispersions produced at varying reaction volumes between 6 mL and 400 mL (a) and their corresponding chromatograms (b). (c) UV-vis spectra of alloy NP dispersions with varying NP concentrations between 25.4 mg L−1 and 101.6 mg L−1 and their corresponding chromatograms (d). | ||
Remarkably, the measured dispersions show almost identical optical spectra and retention volume distributions. Slight differences, especially in the retention volumes, which would indicate a slight shift to larger particles, can be explained by small differences in the precursor batches. The first batch was used for volumes of 6 mL to 100 mL and another batch for volumes of 200 mL and 400 mL. This clearly shows that no mixing effects are present and that a scale-up to larger reactors independent of their size is easily possible with the presented synthesis approach, as long as the mixing of the precursors is way faster than the formation kinetics of the particles, which is clearly the case under the conditions studied.
Fig. 8c and d show the system's response to an increase in the precursor concentrations by a factor of 4 from 25.4 mg L−1 to 101.6 mg L−1. It should be noted that the concentration of the added sodium hydroxide solution was stepwise adjusted from the initial 10 mM to 30 mM for the highest precursor concentration in order to account for the low pH of the gold precursor. It can be clearly seen that the position of the LSPR peak in the UV-vis spectrum stays at a constant position, showing that the chemical composition of the particles remains constant, given that the size of the particles also remains in the same range, which can be seen in the chromatograms in Fig. 8d. At larger wavelengths of the extinction spectra, a shift to higher extinction values can be observed, which indicates the formation of larger amounts of agglomerates. This can be confirmed from the chromatograms, which show an increase in the agglomerate peak at retention volumes of around 6 mL with an increase of precursor concentration. This means that the quality of the produced particle dispersions suffers at higher concentrations and the effort in purification increases.
In summary, the combined increase in reactor volume and NP concentration would lead to a scale-up by factor of more than 250. Utilizing techniques like SEC, agglomerates formed at higher particle concentrations can be easily separated to keep the product quality constant.
Established syntheses for monometallic NPs reach particle concentrations in the range of 30 mg L−1. Some examples are the works of Puntes et al., who received concentrations of 26.7 mg L−1 and 32.6 mg L−1 for citrate based syntheses of silver74 and gold75 particles, respectively. The original paper by Turkevich reports particle concentrations of 29 mg L−1.76 Our synthesis shows values between 25.4 mg L−1 and 101.6 mg L−1. It must be noted, however, that these concentrations are given for monometallic NPs. For the production of silver–gold alloy NPs, the solubility of AgCl has to be taken into account, which is why the concentrations are usually chosen lower. Link et al. performed the Turkevich synthesis for alloy NPs and received mass concentrations of 22.43 mg L−1,42 which is already lower than in our synthesis. Here it should be noted that the synthesis is performed at 100 °C, which significantly improves the solubility of the AgCl. Mallin et al. present a typical room temperature synthesis using NaBH4 as the reducing agent. They receive particle concentrations of only 0.8 mg L−1 (ref. 45) due to the extremely low solubility of AgCl at room temperature. The thereby realized particle concentrations are lower than the ones obtained in this manuscript by a factor of more than 30, which clearly shows the unprecedented advantage of our synthesis route.
4 Conclusion
In our manuscript, we present a green room temperature synthesis of silver and gold NPs and their homogenous alloys using dextran as the reducing and capping agent. Our synthesis produces NPs with a mean size of 5 nm to 8 nm with narrow size distribution and precisely adjustable molar gold content. The macroscopic optical properties of the alloy NPs are directly controlled by the alloy composition. While the mean particle size remained constant over a broad range of alloy compositions, the molar composition was validated using STEM-EDX as well as auxiliary ICP-OES measurements. With the composition of the alloy NPs well ensured, the predictions from optical modelling by Mie's theory matched our experimental results. Moreover, the distributions in size and chemical composition were analyzed via MWL-AUC experiments demonstrating that the distributions in the molar composition of our alloy NPs are quite narrow. The particle evolution kinetics was evaluated indicating that the synthesis is reaction-controlled allowing for relatively easy scale-up. Our study showcases an environmentally friendly and scalable synthesis for metallic alloy NPs, thus avoiding the need for harsh process conditions while maintaining the high quality of the produced particles.Conflicts of interest
There are no conflicts to declare.Acknowledgements
We gratefully acknowledge the funding by the Deutsche Forschungsgemeinschaft (DFG, German Research Foundation) – Project-ID 416229255 – SFB 1411. Further we would like to acknowledge Malvina Supper, Daphne Hobohm, Patricia Schmul and Bettina Winzer for their experimental work and the intensive discussions as well as Dr Monica Distaso for her guidance, discussions and ideas.References
- V. Sinkevičius, Commission recommendation of 10 June 2022 on the definition of nanomaterial, Off. J. Eur. Union, 2022, 1–5 Search PubMed.
- T. Nann, in First International IEEE Conference on Polymers and Adhesives in Microelectronics and Photonics. Incorporating POLY, PEP & Adhesives in Electronics. Proceedings (Cat. No. 01TH8592), IEEE, 2001, pp. 49–53 Search PubMed.
- U. Simon and G. Schon, in Handbook of Nanostructured Materials and Nanotechnology, Elsevier, 2000, pp. 131–178 Search PubMed.
- K. McNamara and S. A. M. Tofail, Nanosystems: the use of nanoalloys, metallic, bimetallic, and magnetic nanoparticles in biomedical applications, Phys. Chem. Chem. Phys., 2015, 17, 27981–27995 RSC.
- W. J. Stark, P. R. Stoessel, W. Wohlleben and A. Hafner, Industrial applications of nanoparticles, Chem. Soc. Rev., 2015, 44, 5793–5805 RSC.
- W. Peukert, D. Segets, L. Pflug and G. Leugering, in Mesoscale Modeling in Chemical Engineering Part I, Elsevier, 2015, pp. 1–81 Search PubMed.
- B. Ni, G. González-Rubio, F. Kirner, S. Zhang and H. Cölfen, A Symmetry-Based Kinematic Theory for Nanocrystal Morphology Design, Angew. Chem., Int. Ed., 2022, 61, e202200753 CAS.
- B. Ni, M. Mychinko, S. Gómez-Graña, J. Morales-Vidal, M. Obelleiro-Liz, W. Heyvaert, D. Vila-Liarte, X. Zhuo, W. Albrecht, G. Zheng, G. González-Rubio, J. M. Taboada, F. Obelleiro, N. López, J. Pérez-Juste, I. Pastoriza-Santos, H. Cölfen, S. Bals and L. M. Liz-Marzán, Chiral Seeded Growth of Gold Nanorods Into Fourfold Twisted Nanoparticles with Plasmonic Optical Activity, Adv. Mater., 2023, 35, e2208299 CrossRef PubMed.
- U. Frank, M. J. Uttinger, S. E. Wawra, C. Lübbert and W. Peukert, Progress in Multidimensional Particle Characterization, KONA Powder Part. J., 2022, 3–28, DOI:10.14356/kona.2022005.
- J. Jasieniak, L. Smith, J. van Embden, P. Mulvaney and M. Califano, Re-examination of the Size-Dependent Absorption Properties of CdSe Quantum Dots, J. Phys. Chem. C, 2009, 113, 19468–19474 CrossRef CAS.
- Y. Wang and A. Hu, Carbon quantum dots: synthesis, properties and applications, J. Mater. Chem. C, 2014, 2, 6921 RSC.
- Y. Shu, X. Lin, H. Qin, Z. Hu, Y. Jin and X. Peng, Quantum Dots for Display Applications, Angew. Chem., Int. Ed., 2020, 59, 22312–22323 CrossRef CAS PubMed.
- H. Moon, C. Lee, W. Lee, J. Kim and H. Chae, Stability of Quantum Dots, Quantum Dot Films, and Quantum Dot Light-Emitting Diodes for Display Applications, Adv. Mater., 2019, 31, e1804294 CrossRef PubMed.
- X. Yang, K. Wang, Y. Gu, H. Ni, X. Wang, T. Yang and Z. Wang, Improved efficiency of InAs/GaAs quantum dots solar cells by Si-doping, Sol. Energy Mater. Sol. Cells, 2013, 113, 144–147 CrossRef CAS.
- G. S. Selopal, H. Zhao, Z. M. Wang and F. Rosei, Core/Shell Quantum Dots Solar Cells, Adv. Funct. Mater., 2020, 30, 1908762 CrossRef CAS.
- M. Han, X. Gao, J. Z. Su and S. Nie, Quantum-dot-tagged microbeads for multiplexed optical coding of biomolecules, Nat. Biotechnol., 2001, 19, 631–635 CrossRef CAS PubMed.
- S. Thatai, P. Khurana, S. Prasad and D. Kumar, A new way in nanosensors: Gold nanorods for sensing of Fe(III) ions in aqueous media, Microchem. J., 2014, 113, 77–82 CrossRef CAS.
- J. Li, L. Yang, Y. Ruan, S. Chu, H. Wang, Z. Li, C. Jiang, B. Liu, L. Yang and Z. Zhang, Dual-Mode Optical Nanosensor Based on Gold Nanoparticles and Carbon Dots for Visible Detection of As(III) in Water, ACS Appl. Nano Mater., 2020, 3, 8224–8231 CrossRef CAS.
- O. G. Ellert, M. V. Tsodikov, S. A. Nikolaev and V. M. Novotortsev, Bimetallic nanoalloys in heterogeneous catalysis of industrially important reactions: synergistic effects and structural organization of active components, Russ. Chem. Rev., 2014, 83, 718–732 CrossRef.
- F. J. Doyle, C. A. Harrison and T. J. Crowley, Hybrid model-based approach to batch-to-batch control of particle size distribution in emulsion polymerization, Comput. Chem. Eng., 2003, 27, 1153–1163 CrossRef CAS.
- D. Shi, N. H. El-Farra, M. Li, P. Mhaskar and P. D. Christofides, Predictive control of particle size distribution in particulate processes, Chem. Eng. Sci., 2006, 61, 268–281 CrossRef CAS.
- A. M. Salaheldin, J. Walter, P. Herre, I. Levchuk, Y. Jabbari, J. M. Kolle, C. J. Brabec, W. Peukert and D. Segets, Automated synthesis of quantum dot nanocrystals by hot injection: Mixing induced self-focusing, Chem. Eng. J., 2017, 320, 232–243 CrossRef CAS.
- V. N. Soloviev, A. Eichhöfer, D. Fenske and U. Banin, Molecular Limit of a Bulk Semiconductor: Size Dependence of the “Band Gap” in CdSe Cluster Molecules, J. Am. Chem. Soc., 2000, 122, 2673–2674 CrossRef CAS.
- S. Baskoutas and A. F. Terzis, Size-dependent band gap of colloidal quantum dots, J. Appl. Phys., 2006, 99, 13708 CrossRef.
- S. G. Han, J. S. Lee, K. Ahn, Y. S. Kim, J. K. Kim, J. H. Lee, J. H. Shin, K. S. Jeon, W. S. Cho, N. W. Song, M. Gulumian, B. S. Shin and I. J. Yu, Size-dependent clearance of gold nanoparticles from lungs of Sprague-Dawley rats after short-term inhalation exposure, Arch. Toxicol., 2015, 89, 1083–1094 CrossRef CAS PubMed.
- W. H. de Jong, W. I. Hagens, P. Krystek, M. C. Burger, A. J. A. M. Sips and R. E. Geertsma, Particle size-dependent organ distribution of gold nanoparticles after intravenous administration, Biomaterials, 2008, 29, 1912–1919 CrossRef CAS PubMed.
- Y. C. Dong, M. Hajfathalian, P. S. N. Maidment, J. C. Hsu, P. C. Naha, S. Si-Mohamed, M. Breuilly, J. Kim, P. Chhour, P. Douek, H. I. Litt and D. P. Cormode, Effect of Gold Nanoparticle Size on Their Properties as Contrast Agents for Computed Tomography, Sci. Rep., 2019, 9, 14912 CrossRef PubMed.
- D. Kim, S. Park, J. H. Lee, Y. Y. Jeong and S. Jon, Antibiofouling polymer-coated gold nanoparticles as a contrast agent for in vivo X-ray computed tomography imaging, J. Am. Chem. Soc., 2007, 129, 7661–7665 CrossRef CAS PubMed.
- Q.-Y. Cai, S. H. Kim, K. S. Choi, S. Y. Kim, S. J. Byun, K. W. Kim, S. H. Park, S. K. Juhng and K.-H. Yoon, Colloidal gold nanoparticles as a blood-pool contrast agent for X-ray computed tomography in mice, Invest. Radiol., 2007, 42, 797–806 CrossRef CAS PubMed.
- L. E. Cole, R. D. Ross, J. Tilley, T. Vargo-Gogola and R. K. Roeder, Gold nanoparticles as contrast agents in x-ray imaging and computed tomography, Nanomedicine, 2015, 10, 321–341 CrossRef CAS PubMed.
- J. E. S. van der Hoeven, J. Jelic, L. A. Olthof, G. Totarella, R. J. A. van Dijk-Moes, J.-M. Krafft, C. Louis, F. Studt, A. van Blaaderen and P. E. de Jongh, Unlocking synergy in bimetallic catalysts by core-shell design, Nat. Mater., 2021, 20, 1216–1220 CrossRef CAS PubMed.
- P. Amrollahi, A. Ataie, A. Nozari, E. Seyedjafari and A. Shafiee, Cytotoxicity Evaluation and Magnetic Characteristics of Mechano-thermally Synthesized CuNi Nanoparticles for Hyperthermia, J. Mater. Eng. Perform., 2015, 24, 1220–1225 CrossRef CAS.
- K. P. Bankura, D. Maity, M. M. R. Mollick, D. Mondal, B. Bhowmick, M. K. Bain, A. Chakraborty, J. Sarkar, K. Acharya and D. Chattopadhyay, Synthesis, characterization and antimicrobial activity of dextran stabilized silver nanoparticles in aqueous medium, Carbohydr. Polym., 2012, 89, 1159–1165 CrossRef CAS PubMed.
- H. K. Daima, P. R. Selvakannan, Z. Homan, S. K. Bhargava and V. Bansal, 2011 International Conference on Nanoscience, Technology and Societal Implications (NSTSI). 8–10 Dec 2011, Bhubaneswar, India, IEEE, Piscataway, NJ, 2011 Search PubMed.
- A. Arvinte, I.-A. Crudu, F. Doroftei, D. Timpu and M. Pinteala, Electrochemical codeposition of silver-gold nanoparticles on CNT-based electrode and their performance in electrocatalysis of dopamine, J. Electroanal. Chem., 2018, 829, 184–193 CrossRef CAS.
- Y.-H. Chen and C.-S. Yeh, A new approach for the formation of alloy nanoparticles: laser synthesis of gold–silver alloy from gold–silver colloidal mixtures, Chem. Commun., 2001, 371–372 RSC.
- I. Lee, S. W. Han and K. Kim, Production of Au-Ag alloy nanoparticles by laser ablation of bulk alloys, Chem. Commun., 2001, 1782–1783 RSC.
- G. A. Sotiriou, G. D. Etterlin, A. Spyrogianni, F. Krumeich, J.-C. Leroux and S. E. Pratsinis, Plasmonic biocompatible silver-gold alloyed nanoparticles, Chem. Commun., 2014, 50, 13559–13562 RSC.
- C. M. Nguyen, L. M. Frias Batista, M. G. John, C. J. Rodrigues and K. M. Tibbetts, Mechanism of Gold-Silver Alloy Nanoparticle Formation by Laser Coreduction of Gold and Silver Ions in Solution, J. Phys. Chem. B, 2021, 125, 907–917 CrossRef CAS PubMed.
- Y. Herbani, T. Nakamura and S. Sato, Femtosecond Laser-Induced Formation of Gold-Rich Nanoalloys from the Aqueous Mixture of Gold-Silver Ions, J. Nanomater., 2010, 2010, 1–9 CrossRef.
- X. Jia, Y. Yao, G. Yu, L. Qu, T. Li, Z. Li and C. Xu, Synthesis of gold-silver nanoalloys under microwave-assisted irradiation by deposition of silver on gold nanoclusters/triple helix glucan and antifungal activity, Carbohydr. Polym., 2020, 238, 116169 CrossRef CAS PubMed.
- S. Link, Z. L. Wang and M. A. El-Sayed, Alloy Formation of Gold−Silver Nanoparticles and the Dependence of the Plasmon Absorption on Their Composition, J. Phys. Chem. B, 1999, 103, 3529–3533 CrossRef CAS.
- A. V. Girão, P. C. Pinheiro, M. Ferro and T. Trindade, Tailoring gold and silver colloidal bimetallic nanoalloys towards SERS detection of rhodamine 6G, RSC Adv., 2017, 7, 15944–15951 RSC.
- S. Ristig, O. Prymak, K. Loza, M. Gocyla, W. Meyer-Zaika, M. Heggen, D. Raabe and M. Epple, Nanostructure of wet-chemically prepared, polymer-stabilized silver-gold nanoalloys (6 nm) over the entire composition range, J. Mater. Chem. B, 2015, 3, 4654–4662 RSC.
- M. P. Mallin and C. J. Murphy, Solution-Phase Synthesis of Sub-10 nm Au−Ag Alloy Nanoparticles, Nano Lett., 2002, 2, 1235–1237 CrossRef CAS.
- P. Roychoudhury, S. Ghosh and R. Pal, Cyanobacteria mediated green synthesis of gold-silver nanoalloy, J. Plant Biochem. Biotechnol., 2016, 25, 73–78 CrossRef.
- S. Senapati, A. Ahmad, M. I. Khan, M. Sastry and R. Kumar, Extracellular biosynthesis of bimetallic Au-Ag alloy nanoparticles, Small, 2005, 1, 517–520 CrossRef CAS PubMed.
- E. Castro-Longoria, A. R. Vilchis-Nestor and M. Avalos-Borja, Biosynthesis of silver, gold and bimetallic nanoparticles using the filamentous fungus Neurospora crassa, Colloids Surf., B, 2011, 83, 42–48 CrossRef CAS PubMed.
- B. Dasaratrao Sawle, B. Salimath, R. Deshpande, M. Dhondojirao Bedre, B. Krishnamurthy Prabhakar and A. Venkataraman, Biosynthesis and stabilization of Au and Au-Ag alloy nanoparticles by fungus, Fusarium semitectum, Sci. Technol. Adv. Mater., 2008, 9, 35012 CrossRef PubMed.
- J. Vega-Baudrit, S. M. Gamboa, E. R. Rojas and V. V. Martinez, Synthesis and characterization of silver nanoparticles and their application as an antibacterial agent, International Journal of Biosensors & Bioelectronics, 2019, 5, 166–173 Search PubMed.
- N. T. K. Thanh, N. Maclean and S. Mahiddine, Mechanisms of nucleation and growth of nanoparticles in solution, Chem. Rev., 2014, 114, 7610–7630 CrossRef CAS PubMed.
- J. Polte, X. Tuaev, M. Wuithschick, A. Fischer, A. F. Thuenemann, K. Rademann, R. Kraehnert and F. Emmerling, Formation mechanism of colloidal silver nanoparticles: analogies and differences to the growth of gold nanoparticles, ACS Nano, 2012, 6, 5791–5802 CrossRef CAS PubMed.
- J. García-Barrasa, J. López-de-Luzuriaga and M. Monge, Silver nanoparticles: synthesis through chemical methods in solution and biomedical applications, Open Chem., 2011, 9, 7–19 CrossRef.
- M. B. Jolanta Pulit, Preparation of nanocrystalline silver using gelatin and glucose as stabilizing and reducing agents, respectively, Digest Journal of Nanomaterials and Biostructures, 2013, 8, 787–795 Search PubMed.
- A. Henglein and M. Giersig, Formation of Colloidal Silver Nanoparticles: Capping Action of Citrate, J. Phys. Chem. B, 1999, 103, 9533–9539 CrossRef CAS.
- A. Zaleska-Medynska, M. Marchelek, M. Diak and E. Grabowska, Noble metal-based bimetallic nanoparticles: the effect of the structure on the optical, catalytic and photocatalytic properties, Adv. Colloid Interface Sci., 2016, 229, 80–107 CrossRef CAS PubMed.
- K. Bankura, D. Maity, M. M. R. Mollick, D. Mondal, B. Bhowmick, I. Roy, T. Midya, J. Sarkar, D. Rana, K. Acharya and D. Chattopadhyay, Antibacterial activity of Ag-Au alloy NPs and chemical sensor property of Au NPs synthesized by dextran, Carbohydr. Polym., 2014, 107, 151–157 CrossRef CAS PubMed.
- P. Cardenas Lopez, M. J. Uttinger, N. E. Traoré, H. A. Khan, D. Drobek, B. Apeleo Zubiri, E. Spiecker, L. Pflug, W. Peukert and J. Walter, Multidimensional characterization of noble metal alloy nanoparticles by multiwavelength analytical ultracentrifugation, Nanoscale, 2022, 14, 12928–12939 RSC.
- J. Walter, K. Löhr, E. Karabudak, W. Reis, J. Mikhael, W. Peukert, W. Wohlleben and H. Cölfen, Multidimensional analysis of nanoparticles with highly disperse properties using multiwavelength analytical ultracentrifugation, ACS Nano, 2014, 8, 8871–8886 CrossRef CAS PubMed.
- J. Pearson, J. Walter, W. Peukert and H. Cölfen, Advanced Multiwavelength Detection in Analytical Ultracentrifugation, Anal. Chem., 2018, 90, 1280–1291 CrossRef CAS PubMed.
- J. Walter and W. Peukert, Dynamic range multiwavelength particle characterization using analytical ultracentrifugation, Nanoscale, 2016, 8, 7484–7495 RSC.
- P. Schuck, Size-Distribution Analysis of Macromolecules by Sedimentation Velocity Ultracentrifugation and Lamm Equation Modeling, Biophys. J., 2000, 78, 1606–1619 CrossRef CAS PubMed.
- J. Walter, T. Thajudeen, S. Süss, D. Segets and W. Peukert, New possibilities of accurate particle characterisation by applying direct boundary models to analytical centrifugation, Nanoscale, 2015, 7, 6574–6587 RSC.
- W. J. Wiscombe, NCAR/TN-140+STR Mie Scattering Calculations: Advances in Technique and Fast, Vector-Speed Computer Codes Search PubMed.
- J.-P. Schäfer, Implementierung und Anwendung analytischer und numerischer Verfahren zur Lösung der Maxwellgleichungen für die Untersuchung der Lichtausbreitung in biologischem Gewebe, PhD dissertation., Univ. Ulm, 2011 Search PubMed.
- C. F. Bohren and D. R. Huffman, Absorption and Scattering of Light by Small Particles, Wiley, 1998 Search PubMed.
- D. Rioux, S. Vallières, S. Besner, P. Muñoz, E. Mazur and M. Meunier, An Analytic Model for the Dielectric Function of Au, Ag, and their Alloys, Adv. Opt. Mater., 2014, 2, 176–182 CrossRef.
- J. P. Toennies, U. Gonser, R. M. Osgood, M. B. Panish, H. Sakaki, H. K. V. Lotsch, U. Kreibig and M. Vollmer, Optical Properties of Metal Clusters, Springer Berlin Heidelberg, Berlin, Heidelberg, 1995 Search PubMed.
- L. J. Mendoza Herrera, D. M. Arboleda, D. C. Schinca and L. B. Scaffardi, Determination of plasma frequency, damping constant, and size distribution from the complex dielectric function of noble metal nanoparticles, J. Appl. Phys., 2014, 116, 233105 CrossRef.
- A. Derkachova, K. Kolwas and I. Demchenko, Dielectric Function for Gold in Plasmonics Applications: Size Dependence of Plasmon Resonance Frequencies and Damping Rates for Nanospheres, Plasmonics, 2016, 11, 941–951 CrossRef CAS PubMed.
- J. M. J. Santillán, F. A. Videla, M. B. van Fernández Raap, D. Muraca, L. B. Scaffardi and D. C. Schinca, Influence of size-corrected bound-electron contribution on nanometric silver dielectric function. Sizing through optical extinction spectroscopy, J. Phys. D: Appl. Phys., 2013, 46, 435301 CrossRef.
- O. Peña, U. Pal, L. Rodríguez-Fernández and A. Crespo-Sosa, Linear optical response of metallic nanoshells in different dielectric media, J. Opt. Soc. Am. B, 2008, 25, 1371 CrossRef.
- L. Carré-Rangel, G. Alonso-Nuñez, H. Espinoza-Gómez and L. Z. Flores-López, Green Synthesis of Silver Nanoparticles: Effect of Dextran Molecular Weight Used as Stabilizing-Reducing Agent, J. Nanosci. Nanotechnol., 2015, 15, 9849–9855 CrossRef PubMed.
- N. G. Bastús, F. Merkoçi, J. Piella and V. Puntes, Synthesis of Highly Monodisperse Citrate-Stabilized Silver Nanoparticles of up to 200 nm: Kinetic Control and Catalytic Properties, Chem. Mater., 2014, 26, 2836–2846 CrossRef.
- N. G. Bastús, J. Comenge and V. Puntes, Kinetically controlled seeded growth synthesis of citrate-stabilized gold nanoparticles of up to 200 nm: size focusing versus Ostwald ripening, Langmuir, 2011, 27, 11098–11105 CrossRef PubMed.
- J. Turkevich, P. C. Stevenson and J. Hillier, A study of the nucleation and growth processes in the synthesis of colloidal gold, Discuss. Faraday Soc., 1951, 11, 55–75 RSC.
- S. Nishimura, D. Mott, A. Takagaki, S. Maenosono and K. Ebitani, Role of base in the formation of silver nanoparticles synthesized using sodium acrylate as a dual reducing and encapsulating agent, Phys. Chem. Chem. Phys., 2011, 13, 9335–9343 RSC.
- J. F. Gomes, A. C. Garcia, E. B. Ferreira, C. Pires, V. L. Oliveira, G. Tremiliosi-Filho and L. H. S. Gasparotto, New insights into the formation mechanism of Ag, Au and AgAu nanoparticles in aqueous alkaline media: alkoxides from alcohols, aldehydes and ketones as universal reducing agents, Phys. Chem. Chem. Phys., 2015, 17, 21683–21693 RSC.
- A. Myerson, Handbook of Industrial Crystallization, Butterworth-Heinemann, 2002 Search PubMed.
- D. B. Williams and C. B. Carter, Transmission Electron Microscopy, Springer US, Boston, MA, 2009 Search PubMed.
- N. Blommaerts, H. Vanrompay, S. Nuti, S. Lenaerts, S. Bals and S. W. Verbruggen, Unraveling Structural Information of Turkevich Synthesized Plasmonic Gold-Silver Bimetallic Nanoparticles, Small, 2019, 15, e1902791 CrossRef PubMed.
- Z. Y. Li, J. P. Wilcoxon, F. Yin, Y. Chen, R. E. Palmer and R. L. Johnston, Structures and optical properties of 4-5 nm bimetallic AgAu nanoparticles, Faraday Discuss., 2008, 138, 363–373 RSC ; discussion 421-34..
- K. Mallick, M. Witcomb and M. Scurrell, Silver nanoparticle catalysed redox reaction: An electron relay effect, Mater. Chem. Phys., 2006, 97, 283–287 CrossRef CAS.
- A. Henglein, The reactivity of silver atoms in aqueous solutions (A γ-radiolysis study), Berichte der Bunsengesellschaft für physikalische Chemie, 1977, 81, 556–561 CrossRef CAS.
- A. Kundu, R. K. Layek, A. Kuila and A. K. Nandi, Highly fluorescent graphene oxide-poly(vinyl alcohol) hybrid: an effective material for specific Au3+ ion sensors, ACS Appl. Mater. Interfaces, 2012, 4, 5576–5582 CrossRef CAS PubMed.
- L. Lu, G. Burkey, I. Halaciuga and D. V. Goia, Core-shell gold/silver nanoparticles: synthesis and optical properties, J. Colloid Interface Sci., 2013, 392, 90–95 CrossRef CAS PubMed.
- A. Steinbrück, A. Csáki, G. Festag and W. Fritzsche, Preparation and Optical Characterization of Core–Shell Bimetal Nanoparticles, Plasmonics, 2006, 1, 79–85 CrossRef.
- A. P. Philipse, Colloidal sedimentation (and filtration), Curr. Opin. Colloid Interface Sci., 1997, 2, 200–206 CrossRef CAS.
- M. J. Uttinger, D. Jung, N. Dao, H. Canziani, C. Lübbert, N. Vogel, W. Peukert, J. Harting and J. Walter, Probing sedimentation non-ideality of particulate systems using analytical centrifugation, Soft Matter, 2021, 17, 2803–2814 RSC.
- M. J. Uttinger, J. Walter, T. Thajudeen, S. E. Wawra and W. Peukert, Brownian dynamics simulations of analytical ultracentrifugation experiments exhibiting hydrodynamic and thermodynamic non-ideality, Nanoscale, 2017, 9, 17770–17780 RSC.
- E. Antonopoulou, C. F. Rohmann-Shaw, T. C. Sykes, O. J. Cayre, T. N. Hunter and P. K. Jimack, Numerical and experimental analysis of the sedimentation of spherical colloidal suspensions under centrifugal force, Phys. Fluids, 2018, 30, 30702 CrossRef.
- I. Ojea-Jiménez and J. M. Campanera, Molecular Modeling of the Reduction Mechanism in the Citrate-Mediated Synthesis of Gold Nanoparticles, J. Phys. Chem. C, 2012, 116, 23682–23691 CrossRef.
Footnote |
| † Electronic supplementary information (ESI) available. See DOI: https://doi.org/10.1039/d2na00793b |
| This journal is © The Royal Society of Chemistry 2023 |