 Open Access Article
Creative Commons Attribution 3.0 Unported Licence
Zn0.4Mg0.6Fe2O4 nanoenzyme: a novel chemo-sensitizer for the chemotherapy treatment of oral squamous cell carcinoma†
Liang
Chen‡
a,
Qingmei
Kong‡
b,
Mingxing
Tian
a,
Qian
Zhang
b,
Chengwan
Xia
 *b and
Chao
Deng
*c
aDepartment of Oral and Maxillofacial Surgery, Yi Ji Shan Hospital of Wannan Medical College, Wuhu, Anhui, China
bDepartment of Oral and Maxillofacial Surgery, Nanjing Stomatology Hospital, Medical School of Nanjing University, Nanjing, China. E-mail: 2665927917@qq.com
cKey Laboratory of Non-coding RNA Transformation Research of Anhui Higher Education, School of Stomatology, Wannan Medical College, Anhui, China. E-mail: 20120015@wnmc.edu.cn
First published on 28th December 2022
Abstract
Hypoxic and acidic environments are the two main components of the microenvironment contributing to the poor efficacy of chemotherapy drugs in the treatment of oral squamous cell carcinoma (OSCC). In this study, we synthesized a series of Zn1–xMgxFe2O4 nanomaterials with enzyme-like properties, including catalase (CAT)-like, peroxidase (POD)-like, and glutathione (GSH)-like activity in an acidic environment. Among them, Zn0.4Mg0.6Fe2O4 performed the best and effectively increased the efficacy of doxorubicin (DOX) chemotherapy for the treatment of OSCC with reduced cardiotoxicity. Therefore, Zn0.4Mg0.6Fe2O4 could serve as a novel chemosensitizer in the treatment of OSCC.
1 Introduction
As one of the most malignant tumor-prone sites, the number of new cases and associated deaths due to malignant tumors in the oral cavity worldwide were 377![[thin space (1/6-em)]](https://www.rsc.org/images/entities/char_2009.gif) 713 and 177
713 and 177![[thin space (1/6-em)]](https://www.rsc.org/images/entities/char_2009.gif) 757 respectively in 2020, and the numbers are increasing every year.1 Among these, oral squamous cell carcinoma (OSCC) accounts for 80–90%. Although radical resection is the preferred treatment, chemotherapy is still an important auxiliary method to treat or prolong life for patients with advanced/recurrence OSCC or patients who cannot tolerate surgery.2 The armamentarium of available chemotherapy has been increasing rapidly in recent years, while the 5-year survival rate of advanced/recurrence OSCC remains less than 30%.3,4 How to improve chemotherapy efficacy has become the key to prolonging the survival of patients with OSCC.
757 respectively in 2020, and the numbers are increasing every year.1 Among these, oral squamous cell carcinoma (OSCC) accounts for 80–90%. Although radical resection is the preferred treatment, chemotherapy is still an important auxiliary method to treat or prolong life for patients with advanced/recurrence OSCC or patients who cannot tolerate surgery.2 The armamentarium of available chemotherapy has been increasing rapidly in recent years, while the 5-year survival rate of advanced/recurrence OSCC remains less than 30%.3,4 How to improve chemotherapy efficacy has become the key to prolonging the survival of patients with OSCC.
Hypoxic and acidic environments are two important characteristics of the tumor microenvironment. Oxygen is not only an important microenvironmental factor in the development of the organism and normal tissue homeostasis, but is also essential for oxidative metabolism, ATP production, and cell survival.5 In the process of tumor occurrence and development, the abnormal vascular system in the tumor microenvironment leads to obstacles in oxygen delivery, and at the same time, increased oxygen consumption due to tumor cell proliferation and immune cell infiltration eventually leads to hypoxia in the tumor microenvironment.6 Many studies have suggested that the hypoxic environment is closely related to tumor metastasis, tolerance to radiotherapy/chemotherapy, and a poor prognosis.7,8 Moreover, the lack of oxygen in tumor tissues also leads to an increase in anaerobic glycolysis and to the production/secretion of H+ in cells. Eventually, the acidic metabolites accumulate due to the limited blood perfusion in the acidic environment in malignant tumor tissues. Studies have shown that an acidic environment could activate proteolytic enzyme activity, which is involved in tumor tissue remodeling and tumor invasion.9 Furthermore, the degree of acidity of tumor tissues has also been reported to be related to their degree of malignancy.10 Therefore, this feature may be exploited as a novel approach to overcome chemotherapy tolerance in patients with OSCC by designing drugs to correct the hypoxic state based on the acidic tumor environment.
Since Yan et al. reported the intrinsic peroxidase-like activity of ferromagnetic nanoparticles in 2007,11 an increasing number of nanomaterials with enzyme-like characteristics (nanozymes) have been developed and applied in the biomedical field.12 Compared to traditional natural enzymes, nanozymes are generally of low-cost and can be mass-produced. Additionally, previous studies have shown that catalase (CAT)/peroxidase (POD) mimic nanozymes such as MnFe2O4 could catalyze H2O2 oxygen production, which could correct the hypoxic state in tumor tissue and may produce reactive oxygen species (ROS) that could inhibit tumor cell proliferation.13–15 This suggests that we may be able to correct the hypoxic state by constructing appropriate nanozymes that reduce tolerance to chemotherapy in OSCC patients.
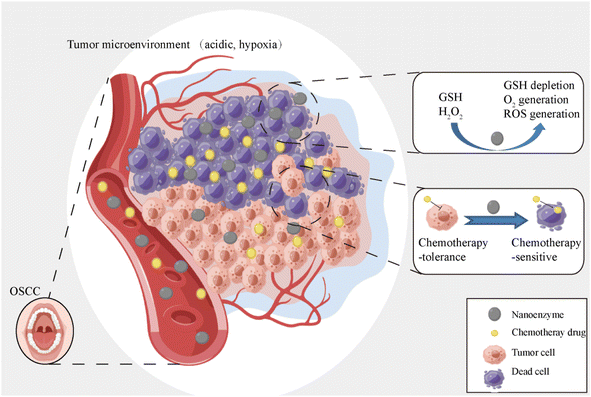
In this paper, a series of Zn1–xMgxFe2O4 nanozymes were synthesized and, of these, Zn0.4Mg0.6Fe2O4 exhibited the highest catalytic efficiency of POD-like, CAT-like, and GSH-like activity. Furthermore, the properties of POD–CAT and glutathione (GSH) activity of Zn0.4Mg0.6Fe2O4 were verified in vitro. Finally, we verified whether Zn0.4Mg0.6Fe2O4 could reduce chemotherapy tolerance and improve the effect of chemotherapy on OSCC, and the results showed that Zn0.4Mg0.6Fe2O4 could serve as a promising chemosensitizer in OSCC management. The main scheme of our study is depicted below (Fig. 1).
2 Results and discussion
2.1 Synthesis and characterization of Zn1–xMgxFe2O4
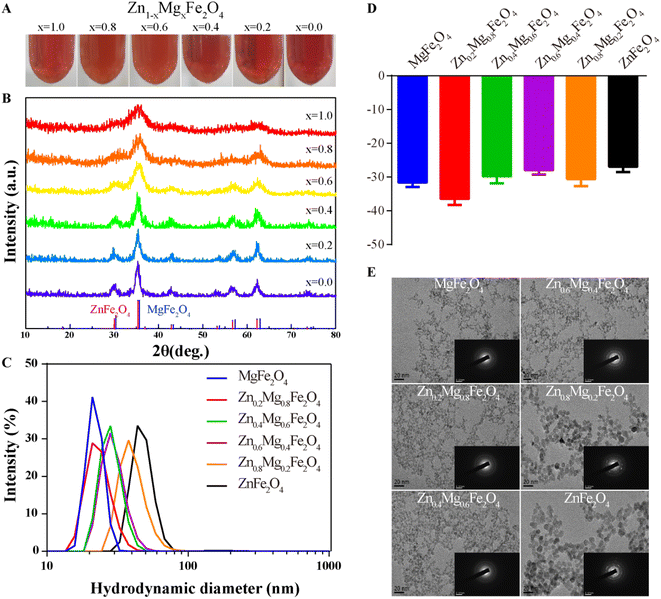
A series of Zn1–xMgxFe2O4 molecules were successfully synthesized as shown in Fig. 2A and the X-ray diffraction (XRD) spectra are given in Fig. 2B. Their hydrodynamic diameters measured by dynamic light scattering (DLS) were 21.96 ± 3.10 nm (MgFe2O4, polymer dispersity index (PDI): 0.02), 23.41 ± 5.04 nm (Zn0.2Mg0.8Fe2O4, PDI: 0.05), 28.52 ± 5.36 nm (Zn0.4Mg0.6Fe2O4, PDI: 0.04), 29.67 ± 6.24 nm (Zn0.6Mg0.4Fe2O4, PDI: 0.04), 40.80 ± 9.76 nm (Zn0.8Mg0.2Fe2O4, PDI: 0.06), and 48.70 ± 15.43 nm (ZnFe2O4, PDI: 0.10), as shown in Fig. 2C. The diameter of Zn1–xMgxFe2O4 increased with an increase in the Zn ratio. The zeta potentials of obtained Zn1–xMgxFe2O4 were −31.63 ± 1.31 mV (MgFe2O4), −36.5 ± 1.75 mV (Zn0.2Mg0.8Fe2O4), −29.83 ± 2.05 mV (Zn0.4Mg0.6Fe2O4), −27.93 ± 1.34 mV (Zn0.6Mg0.4Fe2O4), −30.63 ± 2.11 mV (Zn0.8Mg0.2Fe2O4), and −26.93 ± 1.57 mV (ZnFe2O4), as shown in Fig. 2D. The morphology was evaluated using a transmission electron microscope (TEM) and the selected area electron diffraction (SAED) showed that these nanoparticles had a morphology of homogeneously dispersed spheres and a single-crystal structure, as shown in Fig. 2E.2.2 CAT-like, POD-like, and GSH-like properties of Zn1–xMgxFe2O4
2.3 Zn0.4Mg0.6Fe2O4 could shape the tumor microenvironment that inhibits the progression of OSCC
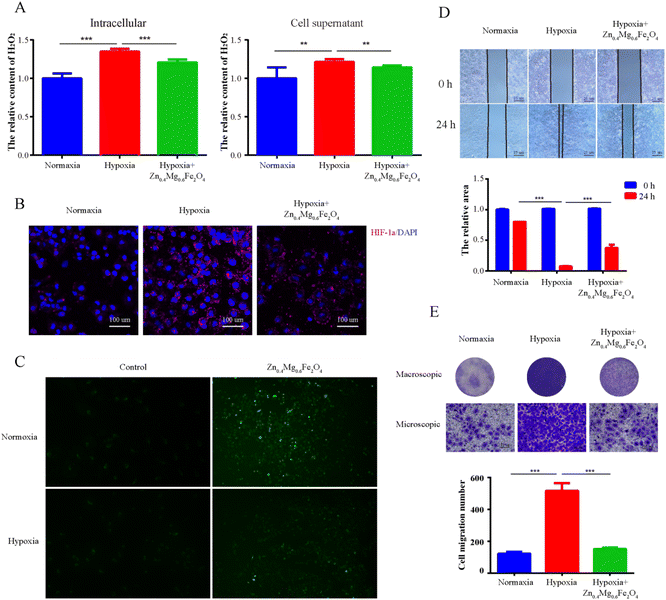
To further validate the CAT-like activity of Zn0.4Mg0.6Fe2O4in vitro, the levels of H2O2 and HIF-1α were detected in OSCC tumor cells treated with 100 μg mL−1 Zn0.4Mg0.6Fe2O4. As shown in Fig. 6A, compared to the normoxic environment, the H2O2 content was markedly elevated in tumor cells cultured in a hypoxic environment, and was also depleted after treatment with Zn0.4Mg0.6Fe2O4. The expression of HIF-1α reflected the O2 content in the cells. As shown in Fig. 6B, the expression of HIF-1α in tumor cells cultured in a hypoxic environment was significantly higher than that in a normoxic environment and also decreased after treatment with Zn0.4Mg0.6Fe2O4. The ROS content was detected to validate the POD activity of Zn0.4Mg0.6Fe2O4in vitro. As shown in Fig. 6C, the ROS content in tumor cells was increased both in a normaxic and a hypoxic environment after treatment with Zn0.4Mg0.6Fe2O4., which further demonstrated that Zn0.4Mg0.6Fe2O4 also exhibited excellent enzyme-like activity in cells. Subsequently, a cell wound scratch assay and a transwell cell migration assay were performed to evaluate the influence of Zn0.4Mg0.6Fe2O4 on OSCC tumor cells. As shown in Fig. 6D and E, the migration rate of tumor cells increased significantly in the hypoxic environment compared to the normoxic environment, while the migration rate also decreased after treating with Zn0.4Mg0.6Fe2O4. This means that Zn0.4Mg0.6Fe2O4 may inhibit the progression of OSCC through an appropriate hypoxia environment.2.4 Zn0.4Mg0.6Fe2O4 could improve the chemotherapy effect in OSCC
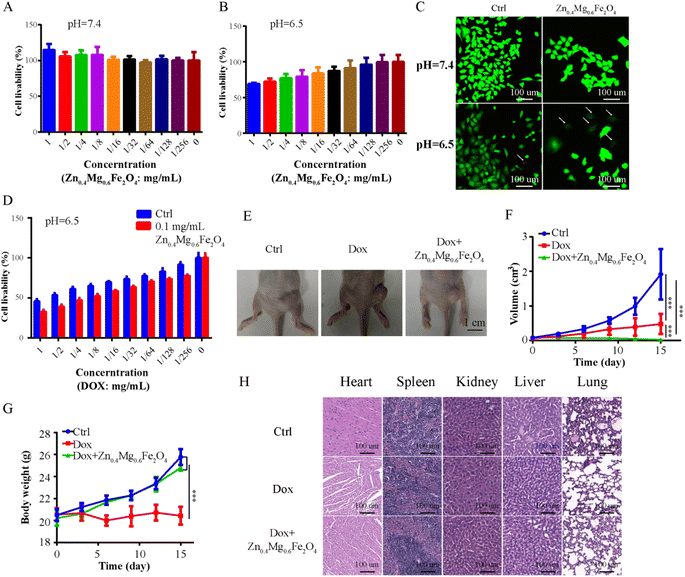
In addition to surgery, chemotherapy is also an important treatment for OSCC. However, due to the tolerance to chemotherapy caused by various factors, such as hypoxia, chemotherapy outcomes are still less than satisfactory. A chemosensitizer could enhance the effect of chemotherapy. Therefore, Zn0.4Mg0.6Fe2O4 was combined with DOX (first-line chemotherapy for OSCC) to treat OSCC in this study. First, the CCK-8 assay was performed to evaluate the toxicity of Zn0.4Mg0.6Fe2O4 to OSCC cells. As shown in Fig. 7A and B, cell viability decreased as the concentration of Zn0.4Mg0.6Fe2O4 increased in an acidic environment (IC50-Zn0.4Mg0.6Fe2O4: 1.398 mg mL−1) while no toxicity was observed in a neutral environment. Furthermore, the live/dead cell-double staining assay also showed greater OSCC cell death after treatment with 0.1 mg mL−1 Zn0.4Mg0.6Fe2O4 in an acidic environment, as shown in Fig. 7C, which indicated that the lethal effect of Zn0.4Mg0.6Fe2O4 also had acid-response properties in vitro. Subsequently, we further evaluated whether Zn0.4Mg0.6Fe2O4 could enhance the chemotherapy effect of DOX on OSCC cells. As shown in Fig. 7D, compared to DOX alone (IC50-DOX: 0.737 mg mL−1), OSCC cell viability obviously decreased when combined with 0.1 mg mL−1 Zn0.4Mg0.6Fe2O4 (IC50-DOX and Zn0.4Mg0.6Fe2O4: 0.394 mg mL−1 and 0.1 mg mL−1, combination index: 0.616). Thus, Zn0.4Mg0.6Fe2O4 could efficiently enhance the chemotherapy effect of DOX on OSCC cells. Finally, a mouse xenograft OSCC tumor model was used to further validate our findings in vivo. As shown in Fig. 7E and F, the tumor volume of mice injected with Zn0.4Mg0.6Fe2O4 and DOX was significantly lower than that of mice injected with DOX alone, while the body weight of mice injected with Zn0.4Mg0.6Fe2O4 and DOX was higher as shown in Fig. 7G. Furthermore, cardiotoxicity was also less marked in mice injected with Zn0.4Mg0.6Fe2O4 compared to mice injected with DOX alone (Fig. 7H). Thus, Zn0.4Mg0.6Fe2O4 can not only enhance DOX chemotherapy, but can also efficiently reduce the toxicity of DOX chemotherapy in vivo. Therefore, Zn0.4Mg0.6Fe2O4 could serve as a chemo-sensitizer in the management of OSCC.3 Experimental section
3.1 Synthesis of Zn1–xMgxFe2O4 nanozymes
The Zn1–xMgxFe2O4 nanozymes were prepared according to previously reported protocols with minor modifications.20,21 Specifically, 0.05 M Mg(NO3)2·6H2O/Zn(NO3)2·6H2O (the ratio between Mg(NO3)2·6H2O and Zn(NO3)2·6H2O was established according to the stoichiometry of Zn1–xMgxFe2O4), 0.1 M Fe(NO3)3 9H2O and 0.15 M trisodium citrate were dissolved in 190 mL of distilled water and 10 mL of 1 M NaOH solution was then slowly added to the solution. The reactants were then placed in a 500-mL capacity container in a Teflon-lined autoclave. The autoclave was maintained at 160 °C for 6 h to prepare MgFe2O4, 180 °C for 8 h to prepare Zn0.2Mg0.8Fe2O4 and Zn0.4Mg0.6Fe2O4, and 180 °C for 6 h to prepare Zn0.6Mg0.4Fe2O4, Zn0.8Mg0.2Fe2O4, and ZnFe2O4.3.2 Characterization of Zn1–xMgxFe2O4 nanozymes
The structural characterization and phase identifications of the sample are done with an X-ray diffractometer (Bruker AKS D8 Advance). The hydrodynamic diameter and zeta potential were measured using a dynamic light scattering instrument (DLS) (ZetaSizer Nano-ZS90; Malvern Instrument) in zeta potential analysis mode. The size and morphology of the obtained Zn1–xMgxFe2O4 nanozymes were observed by transmission electron microscopy (TEM; JEOL).3.3 H2O2 consumption
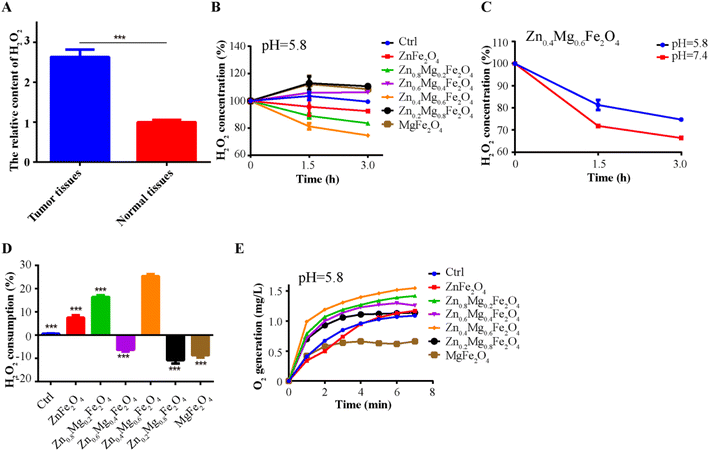
The H2O2 consumption was measured using the colorimetric method of titanium sulfate (Ti(SO4)2) according to a previous protocol with minor modifications.22 Specifically, solution A: 2 mg of Zn1–xMgxFe2O4 was incubated with 5 mL of H2O2 (1 mM) in different buffers (pH 7.4 or pH 5.8) and stirred at 37 °C. Solution B: 665 μL of Ti(SO4)2 and 4.165 mL of H2SO4 were mixed with 25 mL of water. Then 100 μL of solution A was added to 200 μL of solution B at 1.5 h and 3 h. Ten minutes after addition, Zn1–xMgxFe2O4 was separated by centrifugation. UV-vis spectra were recorded to measure the remaining H2O2 by measuring the absorbance at 405 nm.3.4 O2 generation
The generation of O2 was measured according to a method reported in the previous literature22 with minor modifications. In summary, 4 mg of Zn1–xMgxFe2O4 was incubated with 20 mL of PBS (pH = 5.8) containing 0.5 mM H2O2 at 37 °C. The dissolved O2 concentration was monitored with an oxygen meter (HI9146, HANNA instruments, Korea) in real time at 60, 120, 180, 240, 300, 360, and 420 min.3.5 POD-like activity detection
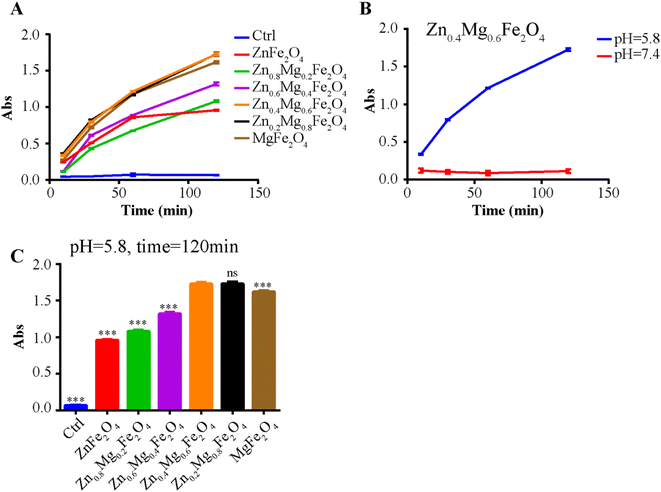
The TMB assay was used to detect the POD-like activity of Zn1–xMgxFe2O4. In brief, 20 μg of Zn1–xMgxFe2O4 was incubated in different buffers (pH 5.8 or pH 7.4) containing 1 mM TMB and 50 mM H2O2. POD-like activity was measured by detecting the absorbance at 625 nm at 30, 60, and 120 min.3.6 GSH-like properties
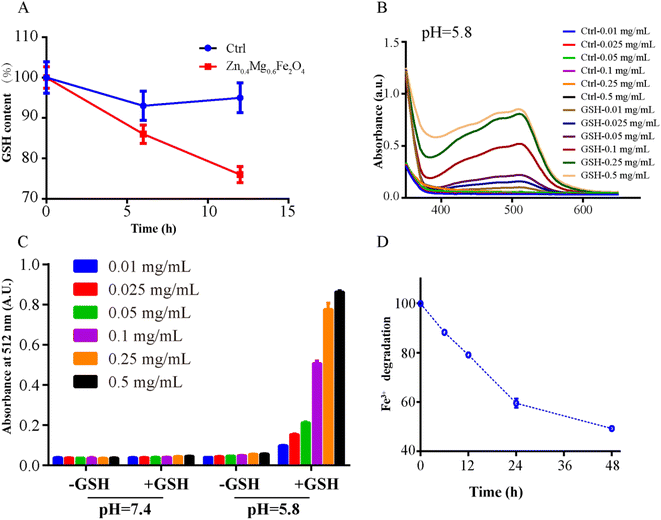
GSH consumption, Fe2+ generation and Fe3+ depletion were investigated to detect GSH-like activity of Zn0.4Mg0.6Fe2O4.19,22 To investigate the consumption of GSH, 475 μL of Zn0.4Mg0.6Fe2O4 (10 μg mL−1) was incubated with 25 μL of GSH (4 mM) at 37 °C for 6 and 12 h. Zn0.4Mg0.6Fe2O4 was separated by centrifugation and the supernatant was collected for GSH measurement using the GSH kit (Beyotime Biotechnology). Finally, 10 μL of the supernatant was added to 100 μL of the reaction mixture from the GSH kit for 25 min and the concentration of GSH was measured by UV-vis spectroscopy at 410 nm. To investigate Fe2+ generation, different concentrations of Zn0.4Mg0.6Fe2O4 (0.01, 0.025, 0.05, 0.1, 0.25, and 0.5 mg mL−1) were incubated with/without 4 mM GSH in different buffers (pH 5.8 or pH 7.4) at 25 °C for 1 h, then the solutions were centrifuged (15![[thin space (1/6-em)]](https://www.rsc.org/images/entities/char_2009.gif) 000 rpm, 20 min) and the supernatant was collected. A 100-μL volume of saturated 1, 10-phenanthroline solution was added to the supernatant. The absorbance at 512 nm was subsequently monitored. To investigate Fe3+ depletion, 10 μg mL−1 Zn0.4Mg0.6Fe2O4 was cultured with 4 mM GSH in acidic buffer (pH = 5.8) at 25 °C for 12, 24, 36, and 48 h. Then the Fe2+ generation was quantitatively analyzed according to the standard Fe2+ concentration absorbance curve, and the Fe3+ depletion was equal to the Fe3+ generation.
000 rpm, 20 min) and the supernatant was collected. A 100-μL volume of saturated 1, 10-phenanthroline solution was added to the supernatant. The absorbance at 512 nm was subsequently monitored. To investigate Fe3+ depletion, 10 μg mL−1 Zn0.4Mg0.6Fe2O4 was cultured with 4 mM GSH in acidic buffer (pH = 5.8) at 25 °C for 12, 24, 36, and 48 h. Then the Fe2+ generation was quantitatively analyzed according to the standard Fe2+ concentration absorbance curve, and the Fe3+ depletion was equal to the Fe3+ generation.
3.7 Cell culture
The OSCC cell line SCC9 was obtained from Fudan University (Shanghai, China); SCC9 cells were cultured in DMEM medium (Gibco) supplemented with 1% FBS (Sigma) in a humidified incubator at 37 °C with 5% CO2. All the cell lines tested negative for mycoplasma contamination.3.8 The detection of H2O2 concentration in tissues and cells
The H2O2 concentration in tissues and cells was measured using an H2O2 assay kit (S0038, Beyotime) according to the manufacturer's protocol. Specifically, for the detection of H2O2 in tumor tissues and normal tissues acquired from OSCC patients, tissue samples were first homogenized with lysis buffer supplied by the H2O2 assay kit (the ratio was 100 μL of lysate to 5 mg of tissues), and then centrifuged at 12![[thin space (1/6-em)]](https://www.rsc.org/images/entities/char_2009.gif) 000 rpm for 5 min. All operations were performed on ice. The supernatant was collected for subsequent measurement of H2O2.
000 rpm for 5 min. All operations were performed on ice. The supernatant was collected for subsequent measurement of H2O2.
This study was conducted in accordance with the Declaration of Helsinki and was approved by the medical ethics committee of the Institute Affiliated Stomatology Hospital, Medical School of Nanjing University. Written informed consent was obtained from all patients. For extracellular and intracellular H2O2 measurement in tumor cells, SCC9 cells were first incubated in fresh culture medium in a normoxic environment (21% O2), in fresh culture medium in a hypoxic environment (1% O2), and in fresh culture medium supplemented with 100 μL of Zn0.4Mg0.6Fe2O4 in a hypoxic environment for 24 h. The culture medium was then harvested to determine the extracellular H2O2 concentration. Subsequently, cells were lysed in 100 μL of lysis buffer and supernatants, collected by centrifuging at 12![[thin space (1/6-em)]](https://www.rsc.org/images/entities/char_2009.gif) 000×g for 10 min, and were used to determine the intracellular H2O2 concentration. The H2O2 concentration detection step was as follows: 50 μL of sample solution was incubated with 100 μL of reaction solution at room temperature for 30 min and then absorption at 560 nm was measured.
000×g for 10 min, and were used to determine the intracellular H2O2 concentration. The H2O2 concentration detection step was as follows: 50 μL of sample solution was incubated with 100 μL of reaction solution at room temperature for 30 min and then absorption at 560 nm was measured.
3.9 Detection of HIF-1α expression
HIF-1α protein expression was detected by the immunofluorescence assay. Specifically, 1 × 10³ cells (SCC9) were seeded in glass bottom culture plates. After 24 h of culture, cells were cultured in a normoxic environment, hypoxic environment, and hypoxic environment supplemented with 100 μg mL−1 Zn0.4Mg0.6Fe2O4 for an additional 24 h. The cells were then fixed with 4% paraformaldehyde for 20 min and blocked with 5% BSA for 30 min at room temperature. Cells were incubated with the primary antibody HIF-1α (Cat no.: 66730-1-Ig, Proteintech) overnight at 4 °C. Dylight-conjugated anti-mouse IgG (647-conjugated anti-mouse IgG, Abcam, USA) was used as the secondary antibody. The nucleus was stained with DAPI (Beyotime, China) and observed under a confocal scanning system (Ti, NIKON).3.10 Intracellular ROS detection
Intracellular ROS expression was detected using a reactive oxygen species assay kit (Beyotime, China). In summary, 1 × 10³ cells (SCC9) were seeded in glass bottom culture plates. After 24 h of culture, cells were placed in a normoxic environment, a normoxic environment supplemented with 100 μg mL−1 Zn0.4Mg0.6Fe2O4, a hypoxic environment, and in a hypoxic environment supplemented with 100 μg mL−1 Zn0.4Mg0.6Fe2O4 for an additional 24 h. The DCFH-DA probe (10 μM) was then added to the cells and incubated for another 30 min at 37 °C. Cells were washed three times with PBS and monitored using a fluorescence microscope (Ti2, NIKON) with 488 nm excitation.3.11 Cell wound healing assay and transwell cell migration assay
The migration ability of OSCC cells was determined by the cell wound healing assay and the transwell cell migration assay. For the cell wound healing assay, Ibidi Culture-Insert 2 wells were placed in 6-well plates, and then SCC9 cells were seeded for 24 hours before forming a 500-μm cell scratch on the cell layer surface. Next, cells were cultured with a fresh medium in a normoxic environment, a hypoxic environment, and a hypoxic environment supplemented with 100 μg mL−1 Zn0.4Mg0.6Fe2O4. Phase-contrast images were acquired at the time of the scratch and 24 h later. For the transwell cell migration assay, 100 μL of SCC9 was seeded in the upper chamber with 10% FBS in the lower chamber in a normoxic environment, a hypoxic environment, and a hypoxic environment supplemented with 100 μg mL−1 Zn0.4Mg0.6Fe2O4. Twenty-four hours later, the cells at the bottom of the filter were stained with crystal violet staining solution (Beyotime, China), and the cell numbers were counted in five fields by microscopy.3.12 Cell proliferation assay
The proliferation ability of OSCC cells was determined using a CCK-8 cell proliferation assay kit (Beyotime). Briefly, 1 × 10³ SCC9 cells were placed in a 96-well plate and cultured for 24 h. The culture medium was then replaced with fresh medium (pH 6.5 or pH 7.4) supplemented with a different concentration of Zn0.4Mg0.6Fe2O4 (0–1 mg mL−1) or different concentrations of DOX (0–1 mg mL−1). After 1 day of incubation, the culture medium was aspirated and treated cells were washed with PBS, before the addition of 10 μL of CCK8 solution to each well and incubated for an additional 2 hours at 37 °C. The absorbance of each well at 450 nm was then measured using an IMark enzyme mark instrument (Bio-Rad Inc., USA). The cell proliferation ability was calculated on the basis of the absorbance data.3.13 Live/dead cell double staining assay
A Calcein-AM/PI double staining kit (Cat no.: 40747ES76, Yeasen, China) was used to detect live/dead cells. Briefly, 1 × 10³ cells (SCC9) were seeded in glass bottom culture plates. After 24 h of culture, cells were cultured in a neutral environment, in a neutral environment supplemented with 100 μg mL−1 Zn0.4Mg0.6Fe2O4, in an acidic environment, and in an acidic environment supplemented with 100 μg mL−1 Zn0.4Mg0.6Fe2O4 for an additional 24 h. The cells were then washed with 1× assay buffer three times and incubated with 100 μL of detection buffer (5 μL of 2 mM Calcein-AM solution and 15 μL of 1.5 mM PI solution in 5 mL of assay buffer) for 15 min at 3 °C and observed under a confocal scanning system.3.14 Animal model
BALB/c athymic nude mice were provided by the Comparative Medical Center of YangZhou University. All mice were housed under SPF conditions in which food, water, bedding, and cages were irradiated prior to use. All animal procedures were performed according to Nanjing University Laboratory Animal Care and Use Guidelines and the experiments were approved by the Nanjing University Animal Ethics Committee. To investigate antitumor efficacy, mice with subcutaneous OSCC xenografts were randomly divided into three groups (n = 5 for each group) when the tumor reached approximately 0.05 cm3: (1) PBS group (intravenous injection of 100 μL of PBS), (2) DOX group (intravenous injection of 100 μL of PBS containing 0.25 mg kg−1 DOX) and (3) DOX + Zn0.4Mg0.6Fe2O4 group (intravenous injection of 100 μL of PBS containing 0.25 mg kg−1 DOX and 0.5 mg kg−1 Zn0.4Mg0.6Fe2O4). The drugs were administered every 3 days for 5 times and the tumor volumes/body weight were recorded simultaneously. Tumor volumes were calculated using the following formula: V = 0.5ab2 (a: the longest diameter and b: the shortest diameter). To examine histological changes in the organs of the experimental mice, including the heart, liver, spleen, lung and kidney, 15 days after drug administration, organs were collected from mice and samples were embedded in paraffin. Subsequently, the paraffin-embedded tissue sections were stained with H&E and observed using a light microscope.3.15 Statistical analysis
Statistical analysis was performed using SPSS statistical software (version 23.0; IBM) and GraphPad Prism (Version 6.0, GraphPad Software, La Jolla, CA, USA). Student's two-sided t-test was used to evaluate statistical significance differences between two groups and one-way ANOVA was used to evaluate statistical significance differences between three or more groups. MANOVA was used to analyze the repeated measured data. A P-value ≤0.05 was considered statistically significant.4 Conclusions
Zn0.4Mg0.6Fe2O4 possessed optimal enzyme-like activity including CAT-like, POD-like, and GSH-like activity across the series of Zn1–xMgxFe2O4 nanoenzymes in an acidic environment. Furthermore, Zn0.4Mg0.6Fe2O4 could effectively improve the efficacy of DOX chemotherapy in the treatment of OSCC and reduce cardiotoxicity. Zn0.4Mg0.6Fe2O4 could serve as a promising alternative chemosensitizer in the management of OSCC.Author contributions
Liang Chen: conceptualization, data curation, and writing - original draft. Qingmei Kong: validation and formal analysis. Mingxing Tian: formal analysis and methodology. Qian Zhang: validation. Chengwan Xia: formal analysis and review & editing. Chao Deng: methodology, project administration, review & editing, funding acquisition, and supervision.Conflicts of interest
The authors declare that they have no known competing financial interests or personal relationships that could have appeared to influence the work reported in this paper.Acknowledgements
The authors gratefully acknowledge support for this research from the Key Research Project Fund of Wannan Medical College (WK2019ZF07), Open Project of Key Laboratory of Non-coding RNA Transformation Research of Anhui higher education institutes (RNA202001), and Young Talents Training Project of Wannan Medical College (wyqnyx202008).References
- H. Sung, J. Ferlay, R. L. Siegel, M. Laversanne, I. Soerjomataram, A. Jemal and F. Bray, Ca-Cancer J. Clin., 2021, 71, 209–249 CrossRef PubMed.
- J. B. Epstein, J. Thariat, R. J. Bensadoun, A. Barasch, B. A. Murphy, L. Kolnick, L. Popplewell and E. Maghami, Ca-Cancer J. Clin., 2012, 62, 400–422 CrossRef PubMed.
- R. L. Siegel, K. D. Miller and A. Jemal, Ca-Cancer J. Clin., 2018, 68, 7–30 CrossRef PubMed.
- C. Holohan, S. Van Schaeybroeck, D. Longley and P. Johnston, Nat. Rev. Cancer, 2013, 13, 714–726 CrossRef CAS PubMed.
- G. Semenza, Cell, 2012, 148, 399–408 CrossRef CAS PubMed.
- E. Rankin and A. Giaccia, Science, 2016, 352, 175–180 CrossRef CAS PubMed.
- Y. Lv, S. Zhao, J. Han, L. Zheng, Z. Yang and L. Zhao, OncoTargets Ther., 2015, 8, 1941–1948 CrossRef CAS PubMed.
- B. Wadsworth, R. Cederberg, C. Lee, N. Firmino, S. Franks, J. Pan, N. Colpo, K. Lin, F. Benard and K. Bennewith, Cancer Lett., 2020, 493, 31–40 CrossRef CAS PubMed.
- I. Robey, B. Baggett, N. Kirkpatrick, D. Roe, J. Dosescu, B. Sloane, A. Hashim, D. Morse, N. Raghunand, R. Gatenby and R. Gillies, Cancer Res., 2009, 69, 2260–2268 CrossRef CAS PubMed.
- V. Estrella, T. Chen, M. Lloyd, J. Wojtkowiak, H. Cornnell, A. Ibrahim-Hashim, K. Bailey, Y. Balagurunathan, J. Rothberg, B. Sloane, J. Johnson, R. Gatenby and R. Gillies, Cancer Res., 2013, 73, 1524–1535 CrossRef CAS PubMed.
- L. Gao, J. Zhuang, L. Nie, J. Zhang, Y. Zhang, N. Gu, T. Wang, J. Feng, D. Yang, S. Perrett and X. Yan, Nat. Nanotechnol., 2007, 2, 577–583 CrossRef CAS PubMed.
- J. Wu, X. Wang, Q. Wang, Z. Lou, S. Li, Y. Zhu, L. Qin and H. Wei, Chem. Soc. Rev., 2019, 48, 1004–1076 RSC.
- J. Kim, H. Cho, H. Jeon, D. Kim, C. Song, N. Lee, S. Choi and T. Hyeon, J. Am. Chem. Soc., 2017, 139, 10992–10995 CrossRef CAS PubMed.
- K. Fan, J. Xi, L. Fan, P. Wang, C. Zhu, Y. Tang, X. Xu, M. Liang, B. Jiang, X. Yan and L. Gao, Nat. Commun., 2018, 9, 1440 CrossRef PubMed.
- C. Liu, T. Wu, C. Liu, K. Chen, Y. Chen, G. Chen and S. Lin, Small, 2017, 13, 1700278 CrossRef PubMed.
- R. Subapriya, R. Kumaraguruparan, C. Ramachandran and S. Nagini, Clin. Biochem., 2002, 35, 489–493 CrossRef CAS PubMed.
- X. Lin, R. Zhu, Z. Hong, X. Zhang, S. Chen, J. Song and H. Yang, Adv. Funct. Mater., 2021, 31, 2101278 CrossRef CAS.
- A. Vernekar, D. Sinha, S. Srivastava, P. Paramasivam, P. D'Silva and G. Mugesh, Nat. Commun., 2014, 5, 5301 CrossRef CAS PubMed.
- J. Shen, T. W. Rees, Z. Zhou, S. Yang, L. Ji and H. Chao, Biomaterials, 2020, 251, 120079 CrossRef CAS PubMed.
- J. Kurian and M. J. Mathew, J. Magn. Magn. Mater., 2018, 451, 121–130 CrossRef CAS.
- D. Ghanbari and M. Salavati-Niasari, Korean J. Chem. Eng., 2015, 32, 903–910 CrossRef CAS.
- S. Y. Yin, G. Song, Y. Yang, Y. Zhao, P. Wang, L. M. Zhu, X. Yin and X. B. Zhang, Adv. Funct. Mater., 2019, 29, 1901417 CrossRef.
Footnotes |
| † Electronic supplementary information (ESI) available. See DOI: https://doi.org/10.1039/d2na00750a |
| ‡ These authors contributed equally to this article. |
| This journal is © The Royal Society of Chemistry 2023 |

