
 Open Access Article
 This Open Access Article is licensed under a Creative Commons Attribution-Non Commercial 3.0 Unported Licence
Te-induced fabrication of Pt3PdTe0.2 alloy nanocages by the self-diffusion of Pd atoms with unique MOR electrocatalytic performance†
Yuhe
Shi‡
a,
Ling
Zhang‡
 *a,
Huiwen
Zhou
a,
Ruanshan
Liu
a,
Shichen
Nie
b,
Guojie
Ye
c,
Fengxia
Wu
de,
Wenxin
Niu
*de,
Jing Long
Han
*fg and
Ai Jie
Wang
fg
*a,
Huiwen
Zhou
a,
Ruanshan
Liu
a,
Shichen
Nie
b,
Guojie
Ye
c,
Fengxia
Wu
de,
Wenxin
Niu
*de,
Jing Long
Han
*fg and
Ai Jie
Wang
fg
aSchool of Science, Harbin Institute of Technology, Shenzhen, 518055, China. E-mail: zhangling2018@hit.edu.cn
bShandong Hynar Water Environmental Protection Co., Ltd, Heze, 274400, China
cHynar Water Group Co., Ltd, Shenzhen, 518052, China
dState Key Laboratory of Electroanalytical Chemistry, Changchun Institute of Applied Chemistry, Chinese Academy of Sciences, Changchun, 130022, China. E-mail: niuwx@ciac.ac.cn
eUniversity of Science and Technology of China, Anhui 230026, China
fSchool of Civil and Environmental Engineering, Harbin Institute of Technology, Shenzhen, 518055, China. E-mail: hanjinglong@yeah.net
gState Key Laboratory of Urban Water Resource and Environment (Shenzhen), Harbin Institute of Technology, Shenzhen, 518055, China
First published on 25th April 2023
Abstract
The key to the application of direct methanol fuel cells is to improve the activity and durability of Pt-based catalysts. Based on the upshift of the d-band centre and exposure to more Pt active sites, Pt3PdTe0.2 catalysts with significantly enhanced electrocatalytic performance for the methanol oxidation reaction (MOR) were designed in this study. A series of different Pt3PdTex (x = 0.2, 0.35, and 0.4) alloy nanocages with hollow and hierarchical structures were synthesized using cubic Pd nanoparticles as sacrificial templates and PtCl62− and TeO32− metal precursors as oxidative etching agents. The Pd nanocubes were oxidized into an ionic complex, which was further co-reduced with Pt and Te precursors by reducing agents to form the hollow Pt3PdTex alloy nanocages with a face-centred cubic lattice. The sizes of the nanocages were around 30–40 nm, which were larger than the Pd templates (18 nm) and the thicknesses of the walls were 7–9 nm. The Pt3PdTe0.2 alloy nanocages exhibited the highest catalytic activities and stabilities toward the MOR after electrochemical activation in sulfuric acid solution. CO-stripping tests suggested the enhanced CO-tolerant ability due to the doping of Te. The specific activity of Pt3PdTe0.2 for the MOR reached 2.71 mA cm−2 in acidic conditions, which was higher than those of Pd@Pt core–shell and PtPd1.5 alloy nanoparticles and commercial Pt/C. A DMFC with Pt3PdTe0.2 as the anodic catalyst output a higher power density by 2.6 times than that of commercial Pt/C, demonstrating its practicable application in clean energy conversions. Density functional theory (DFT) confirmed that the alloyed Te atoms altered the electron distributions of Pt3PdTe0.2, which could lower the Gibbs free energy of the rate-determining methanol dehydrogenation step and greatly improve the MOR catalytic activity and durability.
1. Introduction
Direct methanol fuel cells (DMFCs) are considered high-profile renewable and clean energy conversion devices that could help solve the energy and environmental crises thanks to their high conversion efficiency, large safety factor, non-pollution emission, and durable power generation.1–5 Because of the slow reaction kinetics of the anodic methanol oxidation reaction (MOR), developing efficient anodic electrocatalysts for the MOR is the key to improving the performances of DMFCs.6 Pt is recognized as a highly efficient electrocatalyst toward the MOR due to its good performance, but the activity sites of Pt can typically get occupied by the CO* intermediates during the catalytic process, leading to a decline in its surface activity or catalytic activity.7–10 On the other hand, the high price of Pt limits the commercial applications of DMFCs. Therefore, strategies to improve the catalytic activity and CO* anti-poisoning ability of Pt to reduce the usage are urgently needed. Various studies have shown that the MOR catalytic performance of Pt catalysts can be significantly improved by alloying a second or third foreign metal and non-metal elements (e.g., Au, Pd, Rh, Ni, Co, Cu, Sn, Te, P, N) and through adopting unique structures.11–26The use of special defective structures and alloying of oxophilic atoms (Rh, Ir, Pt, Cu, Te, etc.) can dramatically weaken the CO* intermediates from methanol and enhance the OH* adsorptions from water molecules, thus benefiting the oxidation of methanol into CO2 and avoiding the poisoning of the Pt active sites.8,11,13,15,27,28 Meanwhile, the d-centre of Pt can be lowered dramatically and the electronic environment optimized with synergistic effects achieved to further improve the catalytic activities and durability of Pt-based catalysts. For example, disordered Pt3Sn nanocubes,8 Cu-incorporated PtBi intermetallic nanofiber bundles,11 defect-rich PtTeCo nanorods,13 ultrathin PtNiRh nanowires,15 and Pt–Ni–P mesoporous nanocages with high surface porosity18 have been synthesized with the typical solvothermal, hydrothermal, and template-sacrifice methods. All these nanocomposites showed much higher electrocatalytic activities and stabilities towards the MOR than those of commercial Pt/C catalysts due to the optimized electronic structures of the Pt sites from the strain and ligand effects of the defective and alloying structures.18
Nanocages are considered among the most highly efficient structures and can greatly improve the utilization of the costly noble metal catalysts.18,19,29 Their ultrathin walls, rich surface porosities, and hollow structures endow nanocages with large surface areas, short charge-transport distances, and fast mass-transport processes. Up to now, Pt-based nanocage catalysts have been achieved by template-sacrifice,18 acidic etchings,19,29,30 and galvanic replacement reactions.31,32 Te nanowires and nanosheets are usually as the templates to obtain Pt- and Pd-based alloy hollow and porous nanostructures or ultrathin nanowires through galvanic replacement reactions.21,33,34 The final PtTe relevant alloy nanostructures exhibited unique electrocatalytic activities towards the MOR, hydrogen evolution reaction (HER), and oxygen reduction reaction (OER). Moreover, it was demonstrated by density functional theory (DFT) calculations that Te could help to activate OH− and promote Pt to more easily oxidize the CO* intermediates to CO2 during the formic acid electrooxidation.35 Thus, developing Te-alloyed Pt-based electrocatalysts with high surface areas and porosity would greatly promote their MOR electrocatalytic activities and durability.
In this regard, we developed a new strategy to obtain Pt3PdTex (x = 0.2, 0.35, and 0.4) trimetallic cubic alloy nanocages with porous and hollow structures by the self-diffusion of Pd atoms. As a test, H2PtCl6 and Na2TeO3 were reduced by ascorbic acid in the presence of the as-prepared 18 nm Pd cubes and cetyltrimethylammonium bromide (CTAB) at 60 °C. The Pd cubes were oxidatively etched in this condition and face-centred cubic (fcc) Pt3PdTex alloy nanocages sized around 30–40 nm were automatically formed. The thicknesses of the nanocages were in the range of 7–9 nm, depending on the components of Te in the alloy nanocages. The reported synthetic method avoids the traditional need for harsh reaction conditions, e.g., high pressure, high temperature, and toxic reagents.10,33,36 Thanks to the alloy, and porous and hollow structures, the obtained Pt3PdTe0.2 nanocages showed much higher MOR electrocatalytic activities, durability, and anti-fouling ability than those of Pd@Pt, PtPd1.5, and the commercial Pt/C. DFT calculations demonstrated that the rate-limiting step of the Pt3PdTe0.2 nanocages in the MOR process was breaking the C–H bond of methanol to form *CH2OH, for which the reaction free energy was much lower than those for Pt and Pt3Pd. The d-band centre of Pt3PdTe0.2 was the closest to the Fermi level, further demonstrating the good durability of the Pt3PdTe0.2 catalysts.
2. Experimental section
2.1 Reagents
H2PtCl6·6H2O (Reagent grade), KOH (BC grade, ≥85%), and PdCl2 (BC grade) were purchased from Sangon Biotech (Shanghai) Co., Ltd. Cetyltrimethylammonium bromide (≥98%) and L-ascorbic acid (Reagent grade, ≥98%) were obtained from Sigma-Aldrich. Na2TeO3 (Reagent grade, ≥98%) and methanol (≥99%) were purchased from Adamas Co., Ltd. Sulfuric acid (Reagent grade, 95–98%) and hydrochloric acid (Ultrapure, 36–38%) were obtained from Tansole Co., Ltd (Shanghai). Commercial Pt/C (Pt loading, 20 wt%) was obtained from Macklin. All the chemicals were used without further purification. Ultrapure water (18.2 MΩ cm) was used throughout the experiments. The H2PdCl4 mother solution (10 mM) was prepared by dissolving 0.1773 g of PdCl2 powders in 10 mL of 0.2 M HCl aqueous solution and further diluting to 100 mL with ultrapure water.2.2 Instruments
Scanning electron microscopy (SEM) characterizations were performed on an Hitachi SU8010 field-emission microscope operated at 5 kV. Transmission electron microscopy (TEM) characterizations, high-resolution TEM (HR-TEM), high-angle annular dark-field scanning transmission electron microscopy (HAADF-STEM), energy dispersive spectrometry (EDS), and elemental mapping analyses were performed on a JEOL JEM-3200FS microscope at 300 kV. X-Ray diffraction (XRD) patterns were collected on a Rigaku SmartLab system (Cu Kα radiation). Inductively coupled plasma-optical emission spectrometry (ICP-OES) data for the weight concentrations of the metal elements of the as-produced solutions were obtained on a Spectro Arcos II MV instrument. X-Ray photoelectron spectroscopy (XPS) measurements were conducted on an ESCALAB-MKII spectrometer (VG Co., United Kingdom) with Al Kα X-ray radiation as the X-ray source for excitation.2.3 Synthesis of the cubic Pd templates
Pd cubes with sizes of 17.8 ± 2.0 nm were synthesized according to a previous method.37 Briefly, 0.5 mL of 10 mM H2PdCl4 solution was added to 10 mL of 12.5 mM CTAB solution under stirring and refluxing at 95 °C in an oil bath. After 5 min, 80 μL of 100 mM ascorbic acid solution was added quickly. The reaction proceeded for 30 min. Finally, the solution of Pd cubes was kept at 30 °C for future use.2.4 Synthesis of Pt3PdTex porous alloy nanocages
In a typical synthesis, 100 μL of 1 M HCl solution, 100 μL of 10 mM H2PtCl6, and 0.72 mL of Pd cubes solution were added into 8 mL of 50 mM CTAB solution in multiple vessels and parallelly kept in a water bath at 60 °C. After shaking up and standing for 5 min, 20, 40, and 100 μL of 10 mM Na2TeO3 solution was added into each vessel to produce Pt3PdTe0.2, Pt3PdTe0.35, and Pt3PdTe0.4 porous alloy nanocages, respectively. Then, 0.3 mL of 0.1 M ascorbic acid solution was added, and the solutions were shaken up gently and allowed to stand for reacting. After 6 h, the as-products were collected and washed with hydro–alcohol (1![[thin space (1/6-em)]](https://www.rsc.org/images/entities/char_2009.gif) :1) mixture solution by centrifugations (12000 rpm, 5 min) five times. The final products were dispersed in 200 μL hydro–alcohol (1:1) solution for the electrocatalytic experiments, respectively.
:1) mixture solution by centrifugations (12000 rpm, 5 min) five times. The final products were dispersed in 200 μL hydro–alcohol (1:1) solution for the electrocatalytic experiments, respectively.
Pd@Pt core–shell nanoparticles were produced by following the similar steps as for Pt3PdTex, except that Na2TeO3 precursor solutions were not introduced. PtPd1.5 alloy nanoparticles were also produced by following similar steps as for Pt3PdTex except that 100 μL of 10 mM H2PdCl4 aliquot was added to replace the cubic Pd templates and the Na2TeO3 precursors were not added. The weights of Pt and Pd elements in the as-produced dispersion solutions were measured by ICP-OES.
2.5 Electrochemical measurements
The electrochemical measurements were conducted on a CHI 760E electrochemical workstation (Shanghai Chenhua Instrument Co., Ltd, China). Briefly, in a three-electrode system, Ag/AgCl (saturated KCl) was used as the reference electrode, Pt piece as the counter electrode, and the catalyst-coated glassy carbon electrode (GCE) with a diameter of 4 mm was used as the working electrode. For preparations of the working electrodes, the GCE was first polished with 0.3 and 0.05 μm Al2O3 slurries and sonicated in water, respectively. After drying, 12 μL of the Pt3PdTex, Pd@Pt, and PtPd, and Pt/C catalysts inks were cast onto the GCE and room-dried for the MOR and CO-stripping experiments, respectively.The electrochemically active surface area (ECSA, cm2) was determined by integrating the monolayer hydrogen adsorption peaks at 0.05–0.35 V vs. RHE in the cyclic voltammograms (CVs) in 0.5 M H2SO4 solutions according to eqn (1),38
 | (1) |
CO-stripping experiments were performed in 0.5 M H2SO4. First, the electrocatalyst-modified GCEs were electrochemically activated in 0.5 M H2SO4 for 20 cycles by sweeping in the potential range of 0–1.2 V (vs. RHE). Second, the electrolytes for CO stripping were bubbled with CO for 15 min. Third, CO adlayers were formed by applying −0.3 V (vs. RHE) for 15 min to the electrocatalyst-modified GCEs under a CO atmosphere. Fourth, N2 was bubbled into the electrolyte for 10 min. Finally, the GCEs were swept in the range of 0–1.2 V (vs. RHE) to achieve CO-stripping curves. The relative adsorption amounts of the CO adlayer on the electrocatalysts (p, %) were calculated using eqn (2),
 | (2) |
Toray carbon papers and 1 mg cm−2 Pt particles-loaded carbon papers (10 cm × 10 cm × 0.19 mm) were purchased to fabricate DMFC. Pt3PdTe0.2 (x = 0.2, 0.35, and 0.4) and commercial Pt/C were used as anodic catalysts to promote the MOR. The commercial Pt particles-loaded carbon papers were used as cathodes to catalyse the ORR. Briefly, the carbon papers were cut into smaller sizes with a length × width of 1.5 × 1 cm. Next, 80 μL electrocatalysts was cast onto the carbon papers with area of 0.5 × 1 cm, which were room-dried and swept in the range of 0–1.25 V (vs. RHE) in 0.5 M H2SO4 for 50 cycles to be used as anodes. The length × width of the part immersed into the electrolytes were 0.5 × 1 cm. Also, 0.1 M HClO4 was used as the electrolytes in DMFC, and the anodic and cathodic chambers were separated by a Nafion film. The electrolytes in the cathodic chamber were bubbled with O2 for 30 min before the tests and the flow was controlled above the liquid surface to maintain an O2 atmosphere during the tests.
2.6 Computational methods
We employed the plane-wave code Vienna ab initio simulation package (VASP) program to perform all the spin-polarized DFT calculations within the generalized gradient approximation (GGA) using the Perdew–Burke–Ernzerhof (PBE) formulation.39–41 We chose the projected augmented wave (PAW) potentials to describe the ionic cores and took the valence electrons into account by using a plane-wave basis set with a kinetic energy cut-off of 500 eV.42,43 The valence electron configurations applied in this work were 1s1(H), 2s22p2(C), 2s22p4(O), 5s24d9(Pd), 5s25p4(Te), and 6s15d9(Pt), respectively. Partial occupancies of the Kohn–Sham orbitals were allowed using the Gaussian smearing method and a width of 0.02 eV. The electronic energy was considered self-consistent when the energy change was smaller than 10−6 eV.The equilibrium lattice constants of the [Pt] unit cell were optimized using an 8 × 8 × 8 Monkhorst–Pack k-point grid for Brillouin zone sampling as a = b = c = 3.91643 Å. These lattice constants were used to build the Pt(111) surface slab with 4 atomic layers, which contained 64 Pt atoms. The surfaces mentioned above were chosen since these surfaces were exposed on the surface of the materials, as confirmed by the HRTEM studies. This slab was separated by a 15 Å vacuum layer in the z direction between the slab and its periodic images. During structural optimization of all the surface models, a 3 × 3 × 1 gamma-point centred k-point grid for the Brillouin zone was used. Also, all the atomic layers were allowed to fully relax. In addition, the Pd and Te atoms were located in the Pt structure to consider the effect of the Pd and Te.
The Gibbs free energy (G, eV) at 298 K was calculated by eqn (3),
| G = H − TΔS = EDFT + EZPE – TS | (3) |
3. Results and discussion
3.1 Synthesis and structural characterizations of the porous Pt3PdTex nanocages
In a typical synthesis, Pt3PdTex (x = 0.2, 0.35, and 0.4) nanocages having a hollow structure were synthesized with Pd cubes (17.8 ± 2.0 nm, Fig. S1†) as sacrificial templates, H2PtCl6 and Na2TeO3 as chemical corrosion agents, and CTAB as a capping agent (Scheme 1). Both H2PtCl6 and Na2TeO3 etched Pd cubes into PdBr42− complex anions. Meanwhile, all the PtCl62−, TeO32−, and PdBr42− complexes were reduced by ascorbic acid, so that Pt3PdTex alloy nanoparticles with hollow structures and porous surfaces were produced. The as-produced compounds all exhibited cubic shapes the same as the Pd templates (Fig. 1a and S2–S4†). The atomic ratios of Pt and Pd and Te elements in the products were calculated from the ICP-OES results (Table S1†). The sizes of the Pt3PdTe0.2 nanocages were measured to be 29.2 ± 4.7 nm and the thickness of the nanocages was estimated to be 7.3 nm (Fig. 1b). Apparently hollow structures were observed from the TEM analysis (Fig. 1) From the local amplified area, the lattice spacing of the Pt3PdTe0.2 nanocages was measured to be 0.209 nm, which was close to those of the (100) facets of the face-centred cubic (fcc) Pt and Pd (Fig. 1c and d). The hollow structures of Pt3PdTe0.2 were also confirmed by EDS and line-scanning elemental analysis (Fig. 1e and f). There were little elemental signals for Pt, Pd, and Te in the middle parts in the EDS images, and the signals in the middle were smaller than those at the edges of Pt3PdTe0.2 in the line-scanning profiles. | ||
| Scheme 1 Synthetic process diagram of Pt3PdTex alloy nanocages and Pd@Pt core–shell nanoparticles. | ||
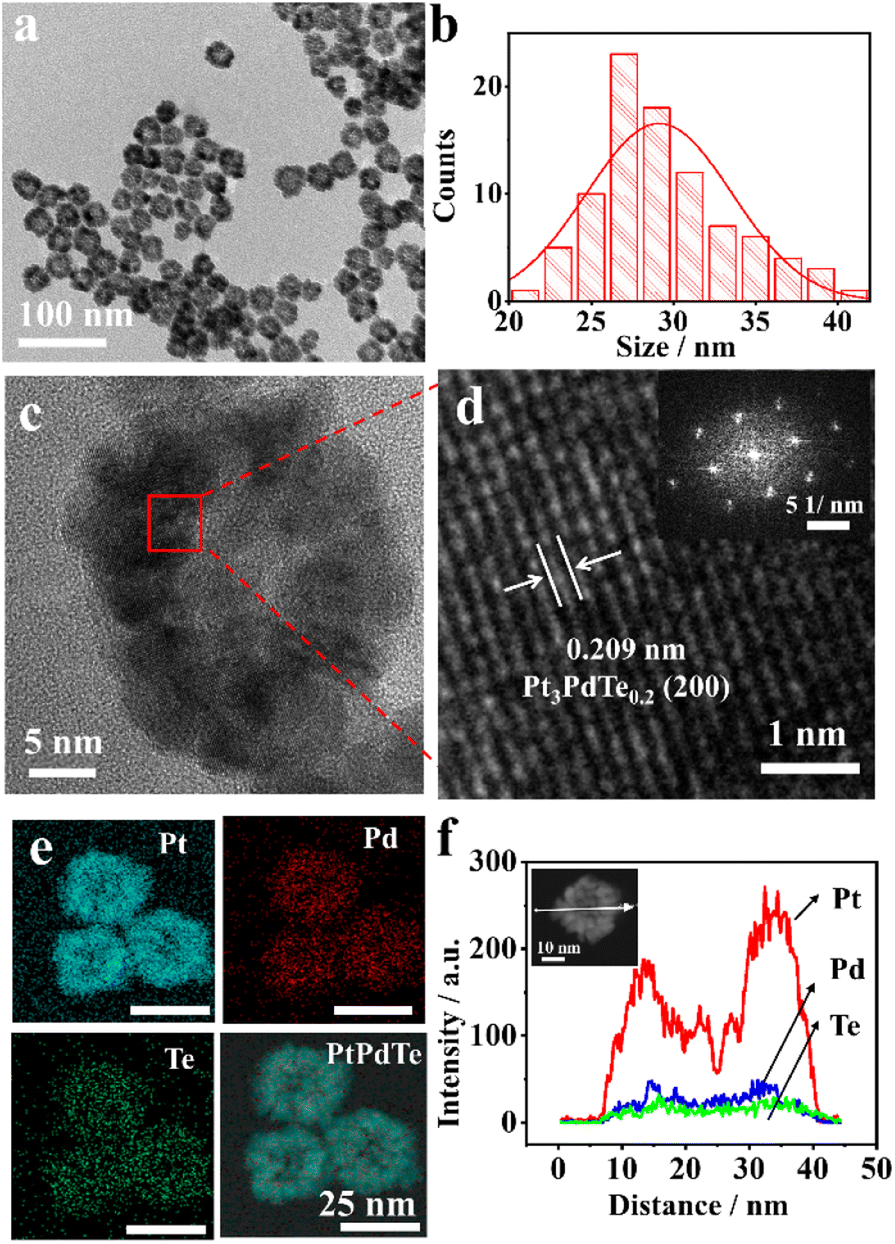 | ||
| Fig. 1 TEM image (a) and size distribution (b), HRTEM images (c and d), and EDS elemental mappings (e) of Pt3PdTe0.2 nanocages. Inset of (d), corresponding FFT (fast Fourier transform) pattern. (f) Elemental line-scanning profile across the white arrow of an individual Pt3PdTe0.2 nanocage (inset). | ||
The content of elemental Te in the as-produced compounds was affected by the amount of Na2TeO3 introduced into the growth solution. With the volume of 10 mM Na2TeO3 aliquots added increasing from 20 μL to 40 and 100 μL, the ratio of Te in the as-produced compounds increased. The as-produced compounds were Pt3PdTe0.35 and Pt3PdTe0.4, respectively (Fig. S3 and S4†). The same hollow structures were formed. The sizes of the nanocages were 42.5 ± 8.6 and 28.4 ± 4.5 nm, and the thicknesses were 8.5 and 6.7 nm for Pt3PdTe0.35 and Pt3PdTe0.4, respectively. The alloying of low contents of Te (4.1–6.4 wt%, Table S1†) did not alter the crystal structures or lattice spacings of the alloy nanocages apparently. All three kinds of Pt3PdTex nanocages belonged to fcc noble metal crystal structures. The lattice spacings of Pt3PdTe0.35 and Pt3PdTe0.4 were measured to be 0.205 nm, and could be fitted to the (100) facets of fcc Pt and Pd (Fig. S3e and S4e†).
Thanks to the presence of TeO32− ions in the growth solutions, Pt3PdTex alloy structures could be formed. Without TeO32−, the products were cubic core–shell nanoparticles composed of cubic Pd cores and Pt shells (Fig. S5†). The Pd cubes could not be etched in the absence of TeO32−. The lattice spacing of the Pt shell was measured to be 0.226 nm, which could be fitted to Pt(111) (Fig. S5d†). Cubic Pd centres were clearly exhibited in the EDS images (Fig. S5e†). Pt shells were formed around Pd, exhibiting strong EDS signals in the outer part. Also, the Pd signals were stronger than those of Pt in the middle part of the nanoparticles in the line-scanning profiles, further confirming the core–shell structures (Fig. S5f†). The sizes of the Pd@Pt core–shell nanoparticles were 36.8 ± 6.8 nm, while the thickness of the Pt shells was estimated to be 9.5 nm according to the TEM results. These results indicated that TeO32− was important to induce the etching process of the Pd cubes and the formations of Pt3PdTex alloy nanoparticles with hollow structures. This may be due to the oxidative properties of Te, which probably vulcanized Pd and Pt somehow, resulting in the etching process of the Pd cubes.
The XRD characterizations further reflected the crystalline structures of Pt3PdTex alloy nanocages and Pd@Pt core–shell nanoparticles (Fig. 2). Typical peaks for the (111), (200), (220), and (311) facets of fcc noble metal nanocrystals were clearly exhibited (Pt pdf #04-0802, Pd JCPDS no. 05-0681).44,45 The incorporation of Te into PtPd alloy crystals induced small negative offsets in the peak positions due to the lower diffraction angles of Te with a trigonal phase (JCPDS no. 85-0554) than those of Pt and Pd.46 This indicated that Pt3PdTex alloyed nanostructures were formed successfully by the self-diffusion of Pd atoms.
 | ||
| Fig. 2 XRD patterns of Pt3PdTex nanocages and Pd@Pt core–shell nanoparticles. | ||
To analyze the structures and valences of the surface chemical elements of the catalysts, XPS characterizations were conducted (Fig. 3). The main peaks at 73.9 and 70.5 eV could be fitted to Pt 4f5/2 and Pt 4f7/2 energy levels, respectively (Fig. 3a). Interestingly, shoulder peaks at 74.9 and 71.6 eV were found for all the Pt3PdTex alloy and Pd@Pt core–shell nanoparticles, which were attributed to Pt(II) 4f5/2 and Pt(II) 4f7/2 valence states, respectively. Such XPS peaks for the Pt(II) valence states were also reportedly observed for PtPdCu particles previously, which may be due to the formation of micro PtO and Pt(OH)2.22 Compared with Pd@Pt core–shell nanoparticles, the binding energies of Pt 4f for the three kinds of Pt3PdTex alloy nanocages were all shifted positively, for which Pt3PdTe0.2 exhibited the greatest positive change (about 0.25 eV). Additionally, trace charge transfer occurred when Te was incorporated into the PtPd bimetallic alloy nanostructures, thus leading to the enhanced peak area ratios of Pt(II)/Pt(0) and the transitions from Pt(0) to Pt(II).47 Regarding the XPS of the surface Te composites of Pt3PdTex (Fig. 3b), the Te(IV) valence states predominated. Also, the main peaks at 586.3 and 575.9 eV could be fitted to Te(IV) 3d3/2 and 3d5/2 energy levels, while the shoulder peaks at 583.6 and 573.1 eV belonged to Te(0) 3d5/2 and 3d5/2, respectively.13 The observation of peaks for Pd(0) 3d3/2 and 3d5/2 clearly indicated Pt3PdTex alloy nanocages, while there were no XPS signals suggesting Pd@Pt core–shell nanoparticles. The XPS results suggested the vulcanizations of Pt and Pd by Te and the presence of tellurides in the noble metal-based alloy nanocrystals.
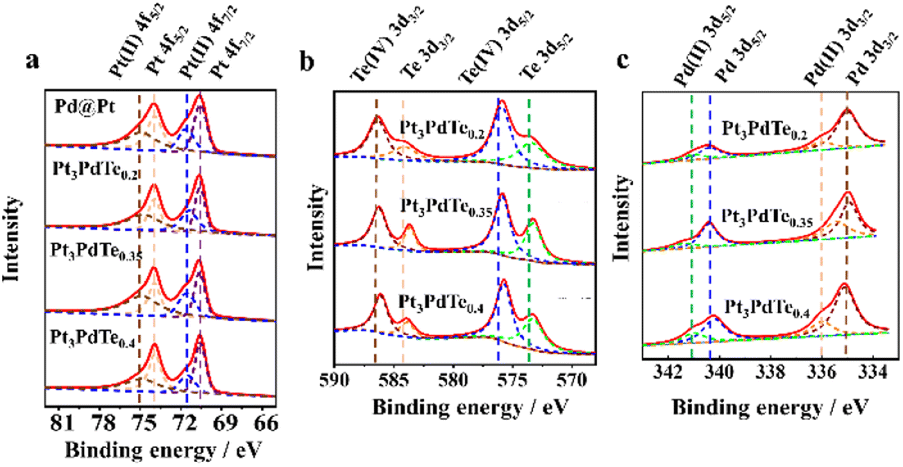 | ||
| Fig. 3 XPS spectra of Pt (a), Te (b), and Pd (c) elements of Pt3PdTex nanocages and Pd@Pt core–shell nanoparticles. | ||
3.2 Reconstitutions of Pt3PdTex by electrochemical activation
Before the electrocatalytic studies for the MOR, PtxPdTey alloy nanocages, Pd@Pt core–shell, PtPd1.5 alloy (55.4 ± 9.6 nm, Fig. S6†), and commercial Pt/C catalysts were electrochemically activated in 0.5 M H2SO4 solution to obtain clean surfaces (Fig. 4a and S7†). The hydrogen adsorption/desorption peaks located in 0.05–0.35 V vs. RHE for the Pt3PdTex alloy nanocages started to form in the second CV cycle, which became larger with activation and became stable up to the 50th CV cycle (Fig. S7a–c†). Regarding Pd@Pt, PtPd1.5, and Pt/C, there were obvious hydrogen adsorption/desorption peaks in the first CV cycle, which differed from those in PtxPdTey (Fig. S7d–f†). This difference may be due to some Te atoms blocking the active sites of Pt, which were then dissolved in the electrolyte solutions after the electrochemical activation in the acidic medium. TEM-EDS elemental analysis demonstrated that some Te was lost after this process (Table S2†). After the electrochemical activation, Pt3PdTex alloy nanocages were stable and feasible to be applied as electrocatalysts.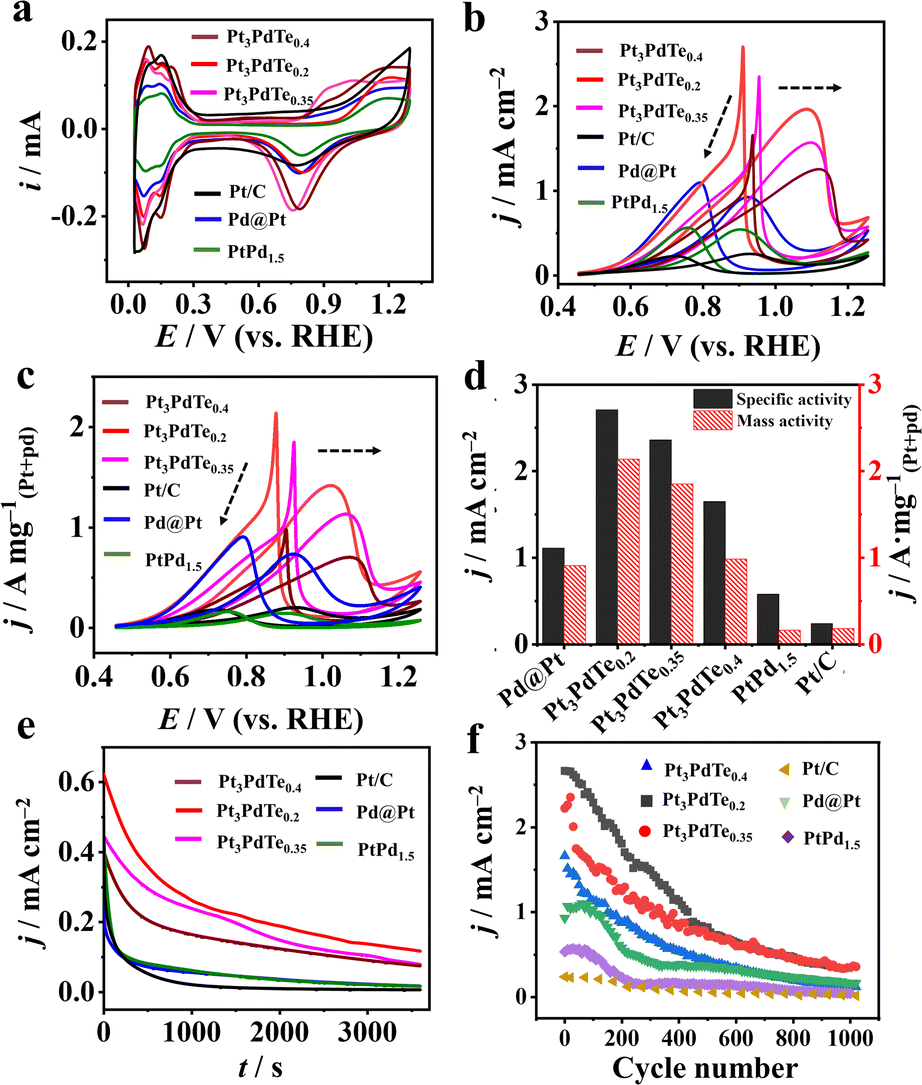 | ||
| Fig. 4 (a) CVs after 50 cycles of different catalyst-modified GCEs in 0.5 M H2SO4 in an Ar atmosphere. Scanning rates, 50 mV s–1. (b and c) Specific activities and mass activity curves of different catalysts towards the electrooxidation of 1 M methanol in 0.1 M HClO4. Scanning rate of 50 mV s–1. (d) Maximum specific activities and mass activities in the backward scans of different catalysts. Durability tests towards the electrooxidation of 1 M methanol by chronoamperometry at 0.76 V for 3600 s (e) and cyclic voltammetry for 1000 cycles (f). | ||
3.3 MOR catalytic behaviours
The electrocatalytic performances of Pt3PdTex, Pd@Pt, PtPd1.5, and Pt/C catalysts towards the MOR were investigated in 0.1 M HClO4 medium. Stronger specific activities and mass activities of the three kinds of Pt3PdTex alloy nanocages were observed than those for Pd@Pt, PtPd1.5, and Pt/C (Fig. 4b and c). The catalytic activity and Pt and Pd utilization efficiencies of Pt3PdTe0.2 were the best. The specific activities of Pt3PdTe0.2, Pt3PdTe0.35, Pt3PdTe0.4, Pd@Pt, PtPd1.5, and Pt/C at 0.76 V vs. RHE were 2.71, 2.36, 1.65, 1.11, 0.58, and 0.24 mA cm−2 in the backward scan, respectively (Fig. 4d and Table S3†), and the mass activities were 2.14, 1.85, 0.98, 0.91, 0.16 and 0.18 A mgPt+Pd−1, respectively (Fig. 4d and Table S3†). It can be inferred that the alloying of Te into PtPd and the formation of a hollow structure with a porous surface greatly enhanced the electrocatalytic activity towards the MOR. More importantly, Pt3PdTex alloy nanocages had higher ratios of the backward peak currents to the forward peak currents (Ib/If), indicating the good anti-poisoning ability towards CO intermediates during the MOR (Table S3†). The CO-stripping experiments indicated the better CO-tolerance properties of the Te-doped Pt nanocages (Fig. 5).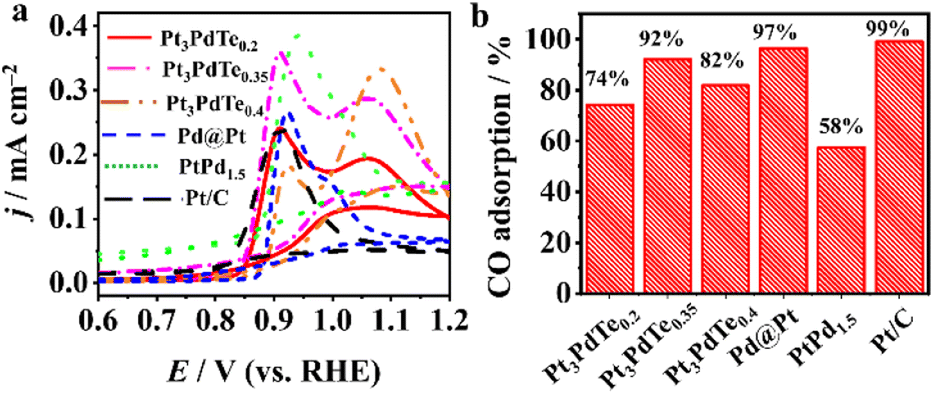 | ||
| Fig. 5 (a) CO-stripping curves of different electrocatalysts in 0.5 M H2SO4. Scanning rate, 50 mV s–1. (b) Relative adsorption amounts of CO on the electrocatalysts calculated by eqn (2). | ||
Regarding Pt3PdTex, there were two CO oxidation peaks, and the peaks located around 0.86–0.88 V vs. RHE were induced by the presence of Te (Fig. 5a). The relative amounts of adsorbed CO on Pt3PdTex were lower than those of Pd@Pt and Pt/C (eqn (2), Fig. 5b and S8†). Compared to the previous reports, the Pt3PdTe0.2 alloy nanocages showed better specific catalytic activity and mass activity than those of most PtTe-based alloy nanowires/nanotubes and PtPd-based alloy nanowires/dendrites (Table S4†).10,21,48–51 It was demonstrated that both the alloyed Te composites and hollowed structures of Pt3PdTe0.2 developed in this work were important to improve the MOR catalytic activity.
Moreover, the Pt3PdTe0.2 nanocages exhibited the best durability among the Pt, PtPd, and Pt3PdTex related catalysts. After 3600 s at 0.76 V, the MOR specific activity was the highest and could be maintained at 23% of the initial activity (Fig. 4e and S9a†). After 1000 cycles in 1 M methanol, Pt3PdTe0.2 maintained 14% specific activity and mass activity. These activities were higher than those of Pd@Pt core–shell, PtPd1.5 alloy, and commercial Pt/C catalysts by 1.27, 7.67, and 20.94 times, respectively (Fig. 4f and S9b†). The Pt3PdTe0.2 nanocages had stable structures after the durability tests in acidic medium (Table S2†). The mass percentage of Te in Pt3PdTe0.2 was not decreased, and the hollowed nanocage structures were well maintained (Fig. 6). To demonstrate the practicability of the Pt3PdTe0.2 nanocages for producing clean energy, DMFCs were fabricated with Pt3PdTe0.2 as the anodic catalyst. The output voltage for the DMFC with Pt3PdTe0.2 was 0.2 V, which was larger than that of commercial Pt/C by 50 mV. The maximum output power density for Pt3PdTe0.2 were 17.8 μW cm−2, which were higher than those of Pt/C by 2.6 times (Fig. 7).
 | ||
| Fig. 6 TEM images (a1 and a2), STEM image (b1), and EDS elemental mapping (b2–b5) of Pt3PdTe0.2 catalysts after the durability test in 0.1 M HClO4 towards the MOR. | ||
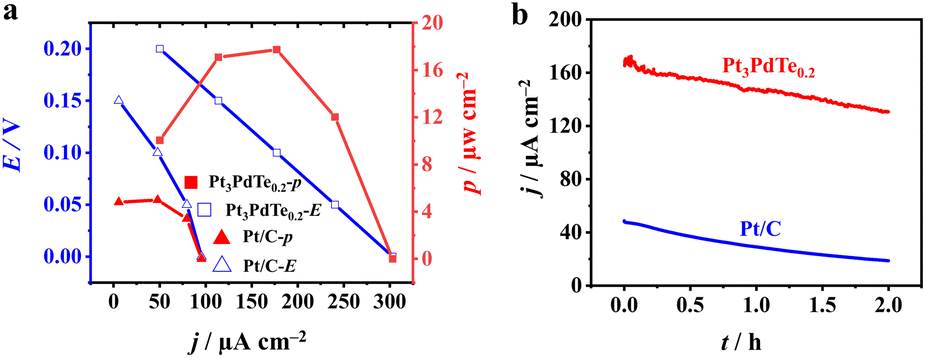 | ||
| Fig. 7 (a) Output voltage (left axis) and power density (right axis) of fuel cells with Pt3PdTe0.2 and Pt/C catalysts as anodic catalysts. (b) Stability of fuel cells running at 0.1 V vs. RHE. Anode, 1 M methanol; cathode, O2 atmosphere; electrolytes, 0.1 M HClO4. | ||
Furthermore, the stabilities of the DMFCs with Pt3PdTe0.2 catalysts were better than those of Pt/C, whereby the output current densities could be maintained at 80 and 40% in 2 h at 0.1 V, respectively.
3.4 DFT calculations
Based on the experimental data from the structural and compositional analyses, DFT computational models for Pt, Pt3Pd alloy, and Pt3PdTe0.2 alloy were established, which were used to further elucidate the mechanism of the MOR. We constructed a complete reaction network, including the activation energies and all the optimized structures of the intermediates to investigate the preferred pathway for the process from methanol to CO2. Gibbs free energy curves of the preferred reaction paths were drawn according to the calculated data (Fig. 8). The interacting atoms of the –OH*-containing intermediates (CH2OH*, CHOH*, COH*) with sites in the three catalysts were the C atoms, rather than the O atoms for the –O*-containing intermediates (CO*, CH3O*, CH2O*, CHO*), as shown in Fig. 9 and S10–S12.† It was found that on the sites of Pt, Pt3Pd, and Pt3PdTe0.2, methanol was more inclined to break the C–H bonds producing CH2OH* than the O–H bonds producing CH3O* first (Fig. 8 and 9). Then, H atoms were removed from the unsaturated C sites of CH2OH* intermediates one by one. Finally, CO* intermediates were produced and oxidized into CO2 products (Fig. 10a). The preferred paths were CH3OH → CH2OH* → CHOH* → COH* → CO* → CO2. The rate-limiting step for the three catalysts in the MOR process were all the breaking of the C–H bonds of methanol to generate *CH2OH, for which the energy barriers were significantly higher than those of the other basic steps. | ||
| Fig. 8 Reaction networks of the MOR for Pt (a), Pt3Pd (b), and Pt3PdTe0.2 (c). | ||
 | ||
| Fig. 9 Configurations of the three kinds of catalysts and Gibbs free energy change diagrams of the first step of the MOR. | ||
 | ||
| Fig. 10 (a) Gibbs free energy change diagrams of the MOR process on Pt, Pt3Pd, and Pt3PdTe0.2 (U = 0.624 V). (b) PDOS and εd of Pt, Pt3Pd, and Pt3PdTe0.2, with EF set to zero. | ||
Moreover, the reaction activity of this rate-determination step catalyzed by the Pt3PdTe0.2 alloy (ΔG, −1.05 eV) was calculated to be higher than with the Pt3Pd alloy (ΔG, −0.93 eV) and Pt (ΔG, −0.82 eV), indicating the excellent performance of the Te-alloyed PtPd in the MOR. In the CO* oxidation process, O* began to form on the surface of catalysts and coupled with CO* to finally produce CO2.
The partial density of states (PDOS) and d-band centre (εd) were calculated to demonstrate the change in the electronic structure for Pt, Pt3Pd, and Pt3PdTe0.2 (Fig. 10b). The d-band centre of Pt3PdTe0.2 was closer to its Fermi level (EF) compared with Pt and Pt3Pd, indicating that when it adsorbs intermediates, less electrons will be filled into the antibonding orbitals.52 Thus, the intermediates on the Pt3PdTe0.2 catalysts were easier to be oxidized during the MOR, explaining the better activity and durability of Pt3PdTe0.2 than those of Pt and PtPd related catalysts.
4. Conclusion
To summarize, a new method for preparing Pt3PdTex hollow nanocages was proposed. Differing from the previous reports, it employed a Pd nanocubes template instead of Te nanowires template, avoiding the need for harsh synthetic conditions. The obtained Pt3PdTe0.2 nanocages displayed much higher electrocatalytic specific and mass activities and stabilities than those of Pt and PtPd reference electrocatalysts towards the MOR in acidic medium after electrochemical activation. Thanks to the hollow structures and porous surfaces and the alloying effect of oxophilic Te atoms, the Pt3PdTe0.2 alloy nanocages exhibited much better catalytic performance. DFT studies confirmed that the Gibbs free energy of the rate-determining step of the MOR catalyzed by Pt3PdTe0.2 was lowered and the d-band centre of Pt3PdTe0.2 was shifted to EF, leading to the great catalytic activity and durability. Thus, the study is important to improve the Pt utilization in DMFCs and shows the importance of optimizing the shapes and performance of hollow PtPdTe electrocatalysts.Author contributions
Yuhe Shi undertook the experiments and processed the data. Yuhe Shi and Ling Zhang conceived the idea and wrote the original draft. Ling Zhang, Wenxin Niu, Jing Long Han, and Ai Jie Wang supervised and revised the paper. All the authors discussed the result, revised the paper, and approved the final version.Conflicts of interest
There are no conflicts to declare.Acknowledgements
This work was kindly supported by the National Natural Science Foundation of China (22004024), Shandong Provincial Key Research and Development Program (2020CXGC011202-001), Shenzhen College Stability Support Plan (GXWD20201230155427003-20200821182144001), and Starting Research Grant for High-Level Personnel Overseas of Shenzhen City (Peacock Plan).Notes and references
- E. Antolini, Appl. Catal., B, 2018, 237, 491–503 CrossRef CAS.
- H. Xu, H. Shang, C. Wang and Y. Du, Adv. Funct. Mater., 2020, 30, 2000793 CrossRef CAS.
- W. Li, D. Wang, Y. Zhang, L. Tao, T. Wang, Y. Zou, Y. Wang, R. Chen and S. Wang, Adv. Mater., 2020, 32, 1907879 CrossRef CAS PubMed.
- X. Yang, Y. Wang, X. Tong and N. Yang, Adv. Energy Mater., 2021, 12, 2102261 CrossRef.
- Y. Zhang, D. Wang and S. Wang, Small, 2021, 18, 2104339 CrossRef PubMed.
- F. Lyu, M. Cao, A. Mahsud and Q. Zhang, J. Mater. Chem. A, 2020, 8, 15445–15457 RSC.
- M. Li, Z. Zhao, W. Zhang, M. Luo, L. Tao, Y. Sun, Z. Xia, Y. Chao, K. Yin, Q. Zhang, L. Gu, W. Yang, Y. Yu, G. Lu and S. Guo, Adv. Mater., 2021, 33, 2103762 CrossRef CAS.
- H.-S. Chen, T. M. Benedetti, J. Lian, S. Cheong, P. B. O'Mara, K. O. Sulaiman, C. H. W. Kelly, R. W. J. Scott, J. J. Gooding and R. D. Tilley, ACS Catal., 2021, 11, 2235–2243 CrossRef CAS.
- M. Luo, Y. Sun, X. Zhang, Y. Qin, M. Li, Y. Li, C. Li, Y. Yang, L. Wang, P. Gao, G. Lu and S. Guo, Adv. Mater., 2018, 30, 1705515 CrossRef PubMed.
- S. Y. Ma, H. H. Li, B. C. Hu, X. Cheng, Q. Q. Fu and S. H. Yu, J. Am. Chem. Soc., 2017, 139, 5890–5895 CrossRef CAS PubMed.
- J. Zhang, M. Yuan, T. Zhao, W. Wang, H. Huang, K. Cui, Z. Liu, S. Li, Z. Li and G. Zhang, J. Mater. Chem. A, 2021, 9, 20676–20684 RSC.
- Y. Zuo, D. Rao, S. Li, T. Li, G. Zhu, S. Chen, L. Song, Y. Chai and H. Han, Adv. Mater., 2018, 30, 1704171 CrossRef PubMed.
- J. Li, C. Wang, H. Shang, Y. Wang, H. You, H. Xu and Y. Du, Chem. Eng. J., 2021, 424, 130319 CrossRef CAS.
- G. Hu, L. Shang, T. Sheng, Y. Chen and L. Wang, Adv. Funct. Mater., 2020, 30, 2002281 CrossRef CAS.
- W. Zhang, Y. Yang, B. Huang, F. Lv, K. Wang, N. Li, M. Luo, Y. Chao, Y. Li, Y. Sun, Z. Xu, Y. Qin, W. Yang, J. Zhou, Y. Du, D. Su and S. Guo, Adv. Mater., 2019, 31, 1805833 CrossRef PubMed.
- W. Liang, Y. Wang, L. Zhao, W. Guo, D. Li, W. Qin, H. Wu, Y. Sun and L. Jiang, Adv. Mater., 2021, 33, 2100713 CrossRef CAS PubMed.
- N. Wang, Y. Xu, Y. Han, C. Gao and X. Cao, Nano Energy, 2015, 17, 111–119 CrossRef CAS.
- K. Deng, Y. Xu, D. Yang, X. Qian, Z. Dai, Z. Wang, X. Li, L. Wang and H. Wang, J. Mater. Chem. A, 2019, 7, 9791–9797 RSC.
- H. Ma, Z. Zheng, H. Zhao, C. Shen, H. Chen, H. Li, Z. Cao, Q. Kuang, H. Lin and Z. Xie, J. Mater. Chem. A, 2021, 9, 23444–23450 RSC.
- R. Chang, L. Zheng, C. Wang, D. Yang, G. Zhang and S. Sun, Appl. Catal., B, 2017, 211, 205–211 CrossRef CAS.
- H. H. Li, S. Zhao, M. Gong, C. H. Cui, D. He, H. W. Liang, L. Wu and S. H. Yu, Angew. Chem., Int. Ed., 2013, 52, 7472–7476 CrossRef CAS PubMed.
- Y. X. Xiao, J. Ying, G. Tian, X. Yang, Y. X. Zhang, J. B. Chen, Y. Wang, M. D. Symes, K. I. Ozoemena, J. Wu and X. Y. Yang, Nano Lett., 2021, 21, 7870–7878 CrossRef CAS PubMed.
- Y. Ouyang, H. Cao, H. Wu, D. Wu, F. Wang, X. Fan, W. Yuan, M. He, L. Y. Zhang and C. M. Li, Appl. Catal., B, 2020, 265, 118606 CrossRef CAS.
- L. Huang, J. Zou, J. Y. Ye, Z. Y. Zhou, Z. Lin, X. Kang, P. K. Jain and S. Chen, Angew. Chem., Int. Ed., 2019, 58, 8794–8798 CrossRef CAS PubMed.
- J. Li, S. Z. Jilani, H. Lin, X. Liu, K. Wei, Y. Jia, P. Zhang, M. Chi, Y. J. Tong, Z. Xi and S. Sun, Angew. Chem., Int. Ed., 2019, 58, 11527–11533 CrossRef CAS PubMed.
- C. Li, X. Chen, L. Zhang, S. Yan, A. Sharma, B. Zhao, A. Kumbhar, G. Zhou and J. Fang, Angew. Chem., Int. Ed., 2021, 60, 7675–7680 CrossRef CAS PubMed.
- F. X. Wu, L. Zhang, J. P. Lai, R. Luque, W. X. Niu and G. B. Xu, Nano Today, 2019, 29, 100802 CrossRef CAS.
- X. D. Yang, J. Xue and L. G. Feng, Chem. Commun., 2019, 55, 11247–11250 RSC.
- L. Zhang, L. T. Roling, X. Wang, M. Vara, M. Chi, J. Liu, S.-I. Choi, J. Park, J. A. Herron, Z. Xie, M. Mavrikakis and Y. Xia, Science, 2015, 349, 412–416 CrossRef CAS PubMed.
- D. S. He, D. He, J. Wang, Y. Lin, P. Yin, X. Hong, Y. Wu and Y. Li, J. Am. Chem. Soc., 2016, 138, 1494–1497 CrossRef CAS PubMed.
- X. Bai, J. Geng, S. Zhao, H. Li and F. Li, ACS Appl. Mater. Interfaces, 2020, 12, 23046–23050 CrossRef CAS PubMed.
- Z. Cao, H. Li, C. Zhan, J. Zhang, W. Wang, B. Xu, F. Lu, Y. Jiang, Z. Xie and L. Zheng, Nanoscale, 2018, 10, 5072–5077 RSC.
- W. C. Geng, Y. J. Zhang, L. Yu, J. J. Li, J. L. Sang and Y. J. Li, Small, 2021, 17, 2101499 CrossRef CAS PubMed.
- F. L. Zhao, L. R. Zheng, Q. Yuan, X. T. Yang, Q. H. Zhang, H. Xu, Y. L. Guo, S. Yang, Z. Y. Zhou, L. Gu and X. Wang, Adv. Mater., 2021, 33, 2103383 CrossRef CAS PubMed.
- L. An, H. J. Yan, B. Li, J. Ma, H. Wei and D. G. Xia, Nano Energy, 2015, 15, 24–32 CrossRef CAS.
- Z. Wang, H. Zhang, S. Yin, S. Liu, Z. Dai, Y. Xu, X. Li, L. Wang and H. Wang, Sustainable Energy Fuels, 2020, 4, 2950–2955 RSC.
- W. Niu, Z.-Y. Li, L. Shi, X. Liu, H. Li, S. Han, J. Chen and G. Xu, Cryst. Growth Des., 2008, 8, 4440–4444 CrossRef CAS.
- F. Zhao, L. Zheng, Q. Yuan, X. Yang, Q. Zhang, H. Xu, Y. Guo, S. Yang, Z. Zhou, L. Gu and X. Wang, Adv. Mater., 2021, 33, 2103383 CrossRef CAS PubMed.
- G. Kresse and J. Furthmuller, Comput. Mater. Sci., 1996, 6, 15–50 CrossRef CAS.
- G. Kresse and J. Furthmuller, Phys. Rev. B: Condens. Matter Mater. Phys., 1996, 54, 11169–11186 CrossRef CAS PubMed.
- J. P. Perdew, K. Burke and M. Ernzerhof, Phys. Rev. Lett., 1996, 77, 3865–3868 CrossRef CAS PubMed.
- G. Kresse and D. Joubert, Phys. Rev. B: Condens. Matter Mater. Phys., 1999, 59, 1758–1775 CrossRef CAS.
- P. E. Blochl, Phys. Rev. B: Condens. Matter Mater. Phys., 1994, 50, 17953–17979 CrossRef PubMed.
- J. Yang, R. Hübner, J. Zhang, H. Wan, Y. Zheng, H. Wang, H. Qi, L. He, Y. Li, A. A. Dubale, Y. Sun, Y. Liu, D. Peng, Y. Meng, Z. Zheng, J. Rossmeisl and W. Liu, Angew. Chem., Int. Ed., 2021, 60, 9590–9597 CrossRef CAS PubMed.
- L. Zhang, W. Niu and G. Xu, Nanoscale, 2011, 3, 678–682 RSC.
- B. Zhang, W. Hou, X. Ye, S. Fu and Y. Xie, Adv. Funct. Mater., 2007, 17, 486–492 CrossRef CAS.
- J. Chen, M. Qin, S. Ma, R. Fan, X. Zheng, S. Mao, C. Chen and Y. Wang, Appl. Catal., B, 2021, 299, 120640 CrossRef CAS.
- Y. Hao, Y. Yang, L. Hong, J. Yuan, L. Niu and Y. Gui, ACS Appl. Mater. Interfaces, 2014, 6, 21986–21994 CrossRef CAS PubMed.
- C. Shang, Y. Guo and E. Wang, Nano Res., 2018, 11, 4348–4355 CrossRef CAS.
- L. Wang and Y. Yamauchi, J. Am. Chem. Soc., 2013, 135, 16762–16765 CrossRef CAS PubMed.
- L. Huang, X. Zhang, Q. Wang, Y. Han, Y. Fang and S. Dong, J. Am. Chem. Soc., 2018, 140, 1142–1147 CrossRef CAS.
- W. Yao, X. Jiang, M. Li, Y. Li, Y. Liu, X. Zhan, G. Fu and Y. Tang, Appl. Catal., B, 2021, 282, 119595 CrossRef CAS.
Footnotes |
| † Electronic supplementary information (ESI) available: ICP-OES, TEM, DFT data. See DOI: https://doi.org/10.1039/d2na00576j |
| ‡ These authors contributed equally. |
| This journal is © The Royal Society of Chemistry 2023 |