
 Open Access Article
 This Open Access Article is licensed under a Creative Commons Attribution-Non Commercial 3.0 Unported Licence
Painless and sensitive pepsinogen I detection: an electrochemical immunosensor based on rhombic dodecahedral Cu3Pt and MoS2 NFs†
Shanshan
Wei
 a,
Shiyong
Li
a,
Haolin
Xiao
ab,
Feijun
Zhao
b,
Jianming
Zhu
b,
Zhencheng
Chen
*ab and
Liangli
Cao
*b
a,
Shiyong
Li
a,
Haolin
Xiao
ab,
Feijun
Zhao
b,
Jianming
Zhu
b,
Zhencheng
Chen
*ab and
Liangli
Cao
*b
aSchool of Electronic Engineering and Automation, Guilin University of Electronic Technology, Guilin 541004, China. E-mail: chenzhcheng@163.com
bSchool of Life and Environmental Sciences, Guilin University of Electronic Technology, Guilin 541004, China. E-mail: caoliangli216@163.com
First published on 30th November 2022
Abstract
Gastric cancer (GC) is a common malignant tumour of the digestive tract with a high mortality rate worldwide. However, many patients delay treatment due to the avoidance of the costly and painful procedure of gastroscopy. Therefore, an early convenient screening method is essential to improve the survival rate of GC patients. To address this issue, we constructed an electrochemical immunosensor supported by rhombohedral Cu3Pt and MoS2 nanoflowers (MoS2 NFs) for rapid, painless and quantitative detection of the GC biomarker in vitro. Here, pepsinogen I was employed as a model protein biomarker to analyse the performance of the immunosensor. The rhombohedral dodecahedral Cu3Pt nanoparticles decorated with MoS2-NFs were further functionalized; this allowed the constructed sensor to possess more nano- or micro-structures, thereby improving the detection sensitivity. In specific applications, the corresponding bioactive molecules can be flexibly captured. Under optimal conditions, the immunoassay showed a wide linear range from 500 pg mL−1 to 400 ng mL−1 and a low detection limit of 167 pg mL−1 (S/N = 3). This covers the critical value of 70 ng mL−1, and the results obtained from the analysis of human serum samples were on par with those from the enzyme immunoassay, suggesting significant potential for this new method in daily diagnosis.
1 Introduction
Nowadays, with the increasing pressure of social competition, fast-paced lifestyles, and heavy mental pressure, more and more people suffer from digestive problems due to their inability to rest.1,2 Gastric cancer (GC), in particular, has become a common and high-mortality malignant tumour of the digestive tract worldwide.3–5 Therefore, the detection of early GC through mass screening is an effective way to improve patient survival rates. Pepsinogen (PG) is the inactive precursor of pepsin.6,7 Since PG is secreted by the stomach, and it cannot be affected by short-term diet or other external conditions, and enters the bloodstream through the gastric mucosa. Therefore, the PG level in the serum of each independent individual is relatively stable and can accurately reflect the state of the gastric mucosa.8,9 Previous clinical studies have found a gradual decrease in serum PG I as the disease worsens and have established 70 ng mL−1 as an alert value.10–12 Therefore, a sensitive and rapid detection of samples below the threshold could help patients to seek medical attention quickly and thus manage their condition.There are several assays available that can detect PG, such as chemiluminescent immunoassays (CLEIA), enzyme-linked immunosorbent assays (ELISAs), enzyme immunoassays (EIAs), and fluorescent immunochromatographic assay (FM-LFIA).13–16 However, although these methods are capable of detecting PG, they are not suitable for daily use. Gastroscopy is the gold standard for detecting gastric disorders, but the high cost and invasive nature of the procedure make it unappealing to patients.17 Electrochemical methods have attracted a great deal of attention due to their good physicochemical properties and the advantages of simplicity of operation, high population acceptance and reproducibility.18,19 Moreover, there are no published studies on the detection of PG in serum via electrochemical methods. Therefore, it is necessary to develop an electrochemical biosensor for PG I detection.
Electrochemical immunosensors are used for real-time detection of target antigens through antibody-based specific recognition and measurement of electrical signal changes caused by antigen–antibody interactions.20,21 However, the electrical signal generated by the electrochemical immunosensors is very weak; the signal can be amplified by modifying nanomaterials on the working electrode surface of the immunosensor. Polyaniline (PANI) has been widely used in the field of electrochemical sensors due to its excellent redox properties, rapid preparation, and high adhesion to electrode surfaces.22–24 In addition, MoS2, a graphene-like nanomaterial with a typical sandwich structure, can be used as a substrate to enhance the stability and electrochemical performance of PANI by exploiting the structural stability of these nanomaterials.25,26 This offers excellent biocompatibility due to the many specific active sites on its surface, making it more amenable to functional modification.27 However, it cannot interact with biomolecules directly. Normally, MoS2 is functionalised using different noble metal nanoparticles to improve this problem.28 Notably, Pt-based nanocrystals have gained a lot of attention due to their excellent catalytic properties.29,30 Various shapes of Pt-based nanocrystals have been synthesised, such as, spherical, cubic, octahedral and icosahedral.31,32 However, the electrochemical properties of platinum-based nanocrystals are more influenced by the internal crystal properties than by the exposed crystalline surfaces.33 After considering various factors, we prepared rhombic dodecahedral PtCu nanoparticles (PtCu NPs) by a solvothermal method.
In this study, we developed a novel electrochemical immunosensor based on rhombohedral Cu3Pt and MoS2 NFs for PG I detection. First, aniline was immobilised onto a screen-printed electrode (SPE) surface by electrodeposition to form a sensitive PANI layer. Then, MoS2@Cu3Pt NPs were added dropwise to the modified electrode. The Cu3Pt NPs integrated on MoS2 NFs provided a suitable platform for immobilising biomolecules via Cu–S and Pt–S bonds and accelerated electron transfer. The detection mechanism was based on monitoring the changes in the peak current response caused by the specific recognition between antibodies and antigens. In brief, the value of the electrochemical signal decreases when the antigen concentration increases in this signal amplification strategy. Therefore, the proposed immunosensor can effectively detect the target analyte (PG I).
2 Experimental methods
2.1 Materials
K3Fe(CN)6, (NH4)6Mo7O24·4H2O, aniline, CuCl2·2H2O, and Pt(acac)2 were purchased from Aladdin Company (Shanghai, China). FeCl3·6H2O, sodium citrate, oleylamine (OAm), and HCl were acquired from Xilong Scientific Company (Guangdong, China). Bovine serum albumin (BSA), carcinoembryonic (CEA), A-fetoprotein (AFP), and human serum albumin (HSA) were obtained from Sangon Biotech (Shanghai, China). PG I and anti-PG I were purchased from BioCare Diagnostics Ltd (Guangdong, China). All other chemicals employed were analytical grade and double-distilled water was used in all experiments.2.2 Apparatus
Cyclic voltammetry (CV), differential pulse voltammetry (DPV) and electrochemical impedance spectroscopy (EIS) were performed on a CHI660D electrochemical workstation (Chenhua Instrument Co. Ltd, Shanghai, China). The transmission electron microscope (TEM) image was obtained using a Tecnai G220 electron microscope, and the scanning electron microscope (SEM) image was obtained from a QUANTA430 (FEI, American). A conventional SPE with a three-electrode system was used for all electrochemical measurements. The pH measurements were carried out on a PHS-3E (Shanghai INESA Scientific Instrument CO. Ltd, China). All centrifugations were accomplished by using a high-speed freezing centrifuge TGL-20M (Hunan Xiangyi Development Co. Ltd, China).2.3 Preparation of MoS2 NFs
The MoS2 NFs were synthesised following the procedures reported in a previous study with minor changes.32,34 First, 1.24 g of (NH4)6Mo7O24·4H2O was dissolved in 15 mL of water, and then 1.67 g of aniline was added (pH 4–5, adjusted with HCl). After reacting at 50 °C for 2 h, the resulting mixture was filtered and washed several times with ethanol. The resulting product was dried at 50 °C to obtain MoO3. Subsequently, 0.1 g of the obtained product was homogeneously dispersed into 20 mL of deionized water, and then 0.28 g of L-cys was dissolved into the solution stirring continuously. The mixture was heated to 200 °C for 14 h in a Teflon-lined autoclave. Finally, the MoS2 NFs were centrifuged and washed several times and then dried for further use.2.4 Preparation of Cu3Pt NPs
Cu3Pt NPs were prepared according to the published literature.35,36 Briefly, 160 mg of CTAC, 16 mg of Pt(acac)2 and 7 mg of CuCl2·2H2O were sequentially added to OAm (20 mL) under constant stirring at 60 °C to obtain a homogeneous suspension. Then, 61 mg of Tris was added into the above solution, causing the color to change from yellow to blue-green. Subsequently, the homogeneous solution was solvothermally treated in a Teflon-lined stainless-steel autoclave at 180 °C for 12 h. The treated solution was then removed from the furnace and allowed to cool to ambient temperature before being opened. The resulting products were collected and thoroughly washed with an ethanol/cyclohexane mixture by centrifugation, and then dried in a vacuum at 60 °C.2.5 Preparation of MoS2@Cu3Pt NPs
For the preparation of the MoS2@Cu3Pt NPs, 2 mL of MoS2 NFs was added one drop at a time to 4 mL of Cu3Pt NPs and stirred at room temperature for 24 h. After that, the MoS2@Cu3Pt NPs were centrifuged by washing three times with distilled water. Finally, the obtained nanocomposite was stored at 4 °C for further use.2.6 Fabrication of the immunosensor
Fig. 1 shows the fabrication procedure of the proposed label-free electrochemical immunosensor. The electrodeposition of aniline onto the SPE was conducted using CV in an electrolyte solution containing 0.15 M aniline and 0.5 M H2SO4. The potential, scan rate and cycles of the synthesized PANI were −0.2 V to 1.1 V, 50 mV s−1 and 15 cycles, respectively. Then, 1.5 μL of MoS2@Cu3Pt NPs was added to the surface of the modified SPE and dried at 25 °C. Afterwards, 5.0 μL of anti-PG I (200 μg mL−1) were applied to the modified electrode and incubated at 4 °C for 12 h. After that, 10 μL BSA (1 wt%) was coated onto the surface of the modified electrode to block non-specific active sites. Finally, the fabricated immunosensor was washed with phosphate-buffered saline (PBS) and dried at room temperature.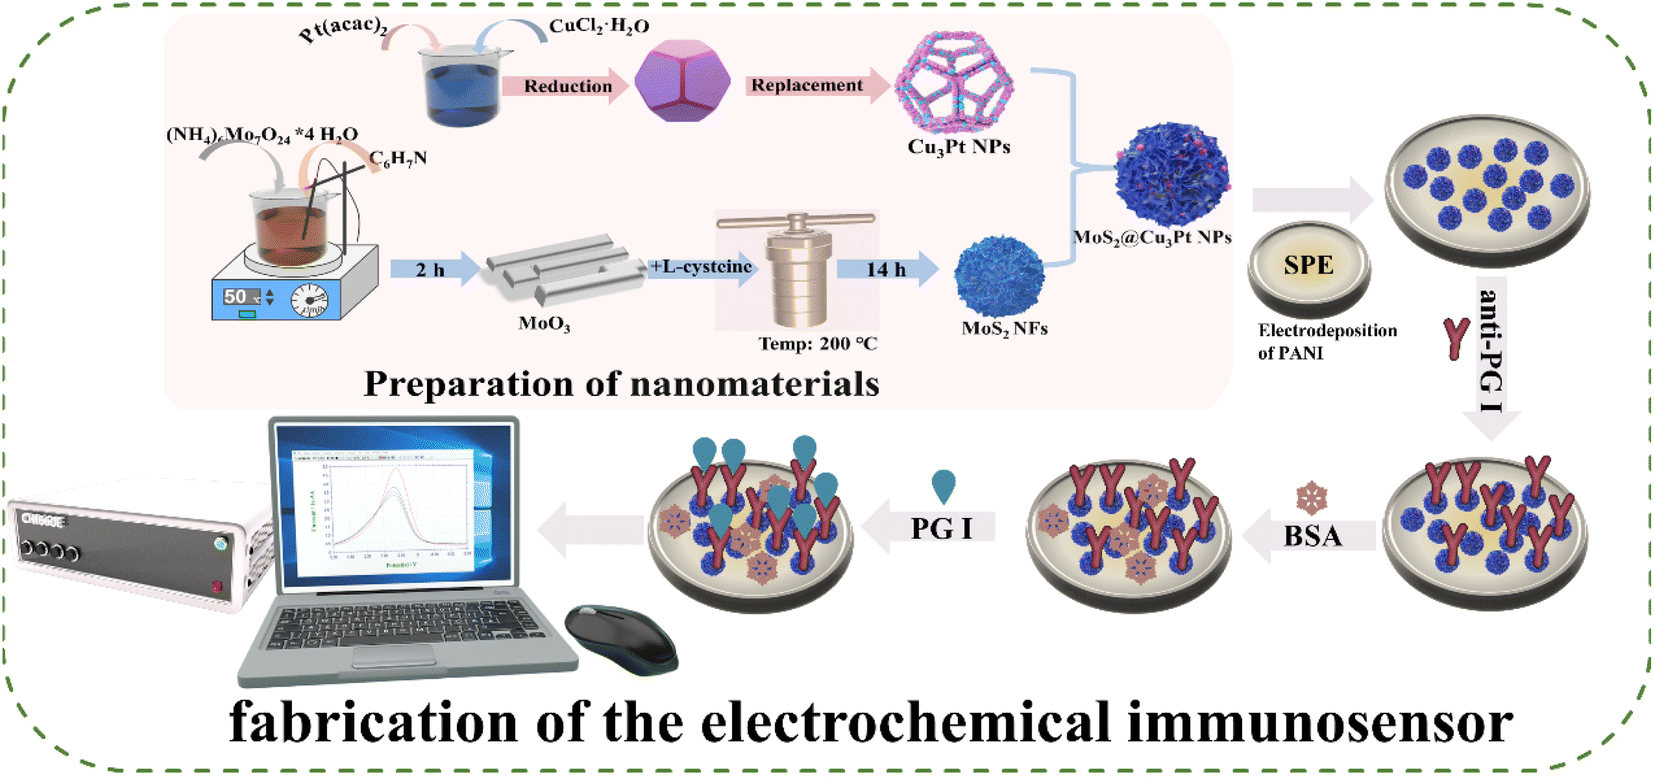 | ||
| Fig. 1 Schematic illustration of the fabrication of the electrochemical immunosensor. | ||
2.7 Electrochemical measurements
The prepared immunosensor was incubated with 5.0 μL of various concentrations of PG I at 25 °C for 20 min to ensure that the immunoreaction between PG I and anti-PG I occurred. Then, the immunosensor was washed with PBS to remove any unbound PG I. Next, the electrochemical measurements were conducted in 50 μL [Fe(CN)6]3−/4− at room temperature. CV was performed in a potential range of −0.5–0.7 V with a scan rate of 110 mV s−1. DPV was conducted in a potential range from −0.3–0.5 V with a pulse period of 0.2 s and an amplitude of 25 mV. EIS was performed with a frequency range of 0.05–100![[thin space (1/6-em)]](https://www.rsc.org/images/entities/char_2009.gif) 000 Hz.
000 Hz.
3 Results and discussion
3.1 Detection methods and principles
Fig. 1 illustrates the preparation procedure for the MoS2@Cu3Pt NPs and label-free electrochemical immunosensor. Significantly, MoS2 NFs with petal-like structures were used as support materials. In addition, the abundance of unsaturated sulphur and the large accessible surface area provided opportunities for functionalisation with noble metal nanoparticles. Cu3Pt NPs were uniformly grown on the surface of MoS2 NFs without using a reducing agent, and the combination provided plenty of binding sites for anti-PG I. Then, BSA solution was applied to the electrode to block the non-specific binding sites. Subsequently, PBS was used to rinse the electrode to eliminate the remaining BSA. After that, the fabricated electrochemical immunosensors were incubated with 5 μL of various concentrations of PG I for specific immunoreaction.3.2 Characterization of MoS2@Cu3Pt nanocomposites
The morphological characteristics and structure of the nanocomposites were characterized by SEM and TEM. As shown in Fig. 2A, the synthesized PANI appears as relatively large clusters with regular shapes and a rough morphology, allowing a stronger affinity for immobilization. Fig. 2B shows the SEM of MoO3, in which some large lumpy products appear. MoS2 (Fig. 2C) displays a typical petal-like hierarchical architecture composed of layered MoS2 nanosheets. This structure improves porosity and provides structural stability to the composite. Fig. 2D shows the MoS2@Cu3Pt NPs, and the Cu3Pt NPs are irregularly distributed on MoS2 NFs, with an average particle size of 30 nm. As shown at different magnifications (Fig. 2E and F), the Cu3Pt NPs in the sample are numerous and well dispersed, and the high-resolution TEM image indicates that the Cu3Pt NPs have a rhombic dodecahedral morphology.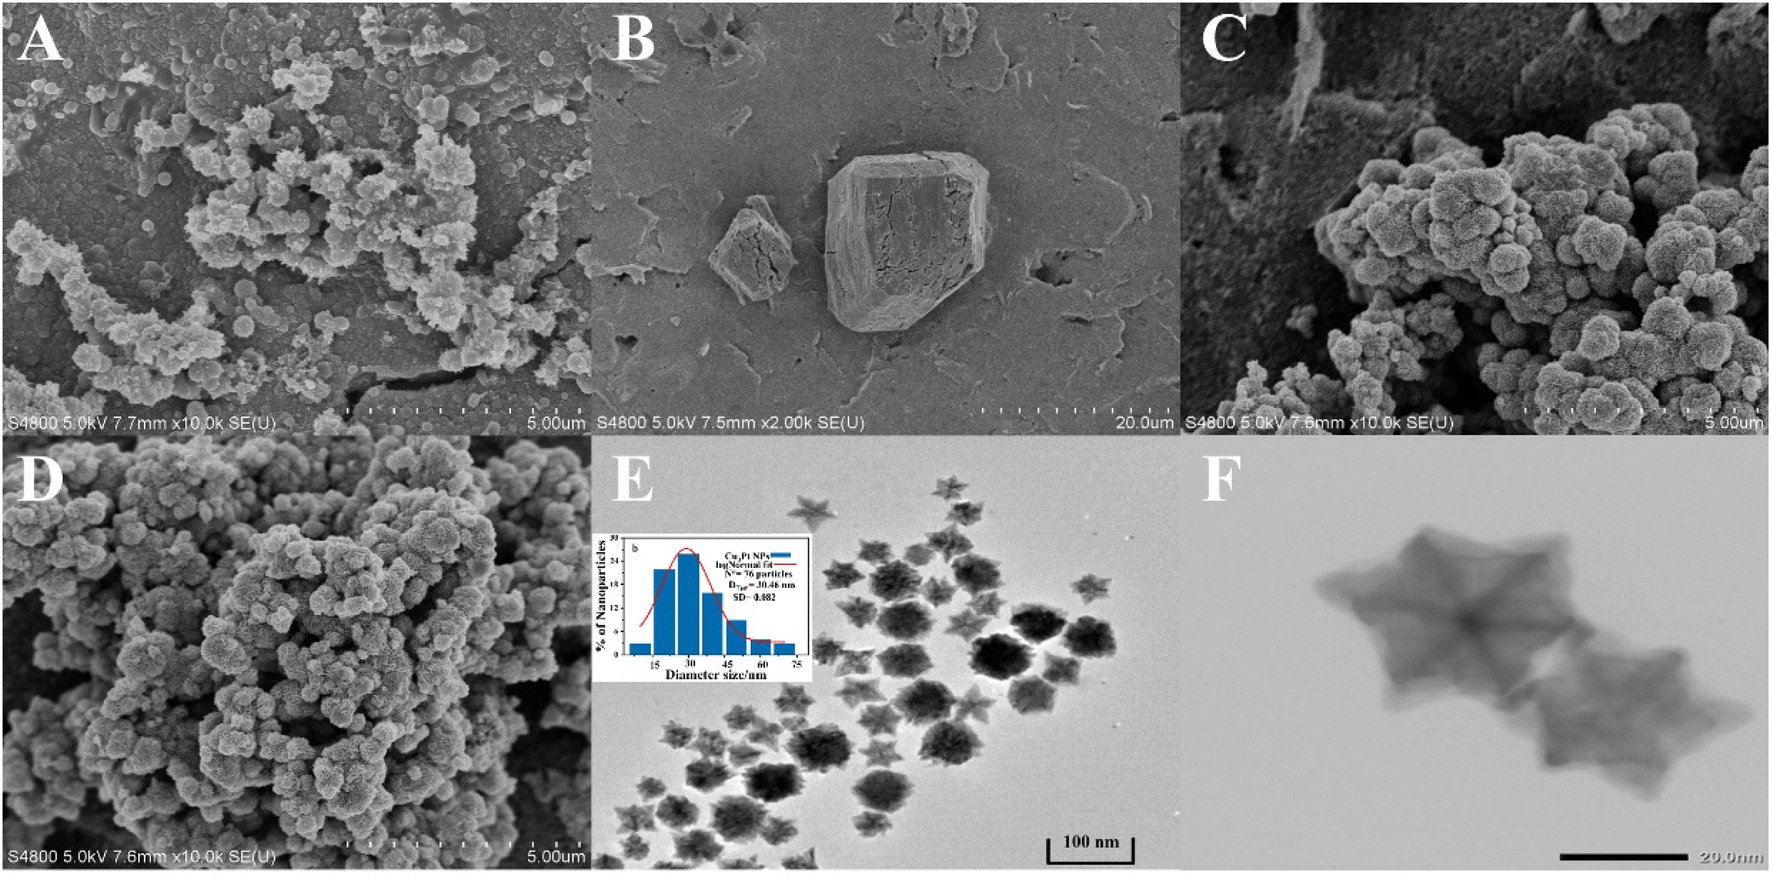 | ||
| Fig. 2 SEM images of (A) PANI, (B) MoO3, (C) MoS2 NFs and (D) MoS2@Cu3Pt NPs, (E) TEM image of Cu3Pt NPs (inset: log-normal size distribution of Cu3Pt NPs) and (F) HR-TEM image of Cu3Pt NPs. | ||
The structures of the MoS2@Cu3Pt NPs were further performed by energy-dispersive X-ray spectroscopy (EDS) (Fig. 3A) and EDS elemental mapping (Fig. 3D). As shown in Fig. 3A, the elements of Mo, S, Cu and Pt are present in the EDS spectrum, implying successful loading of the Cu3Pt NPs onto the MoS2 nanosheet. Fig. 3D shows that Pt and Cu appear homogeneously throughout the whole particle, which further demonstrates the alloy nature of Cu3Pt NPs.
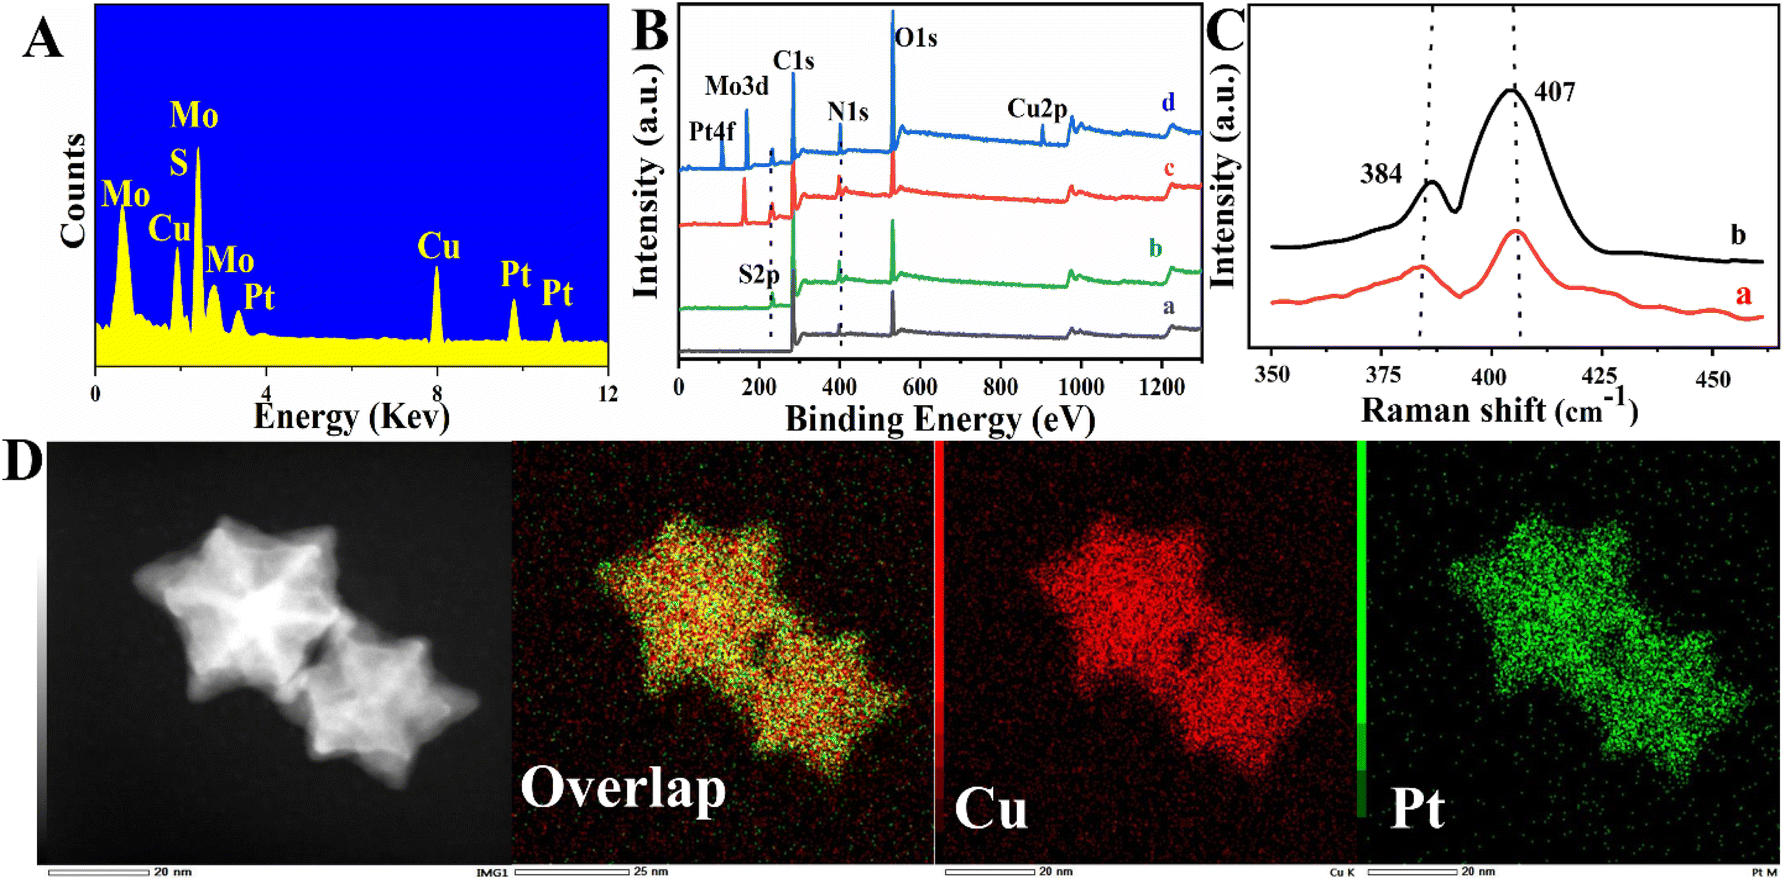 | ||
| Fig. 3 (A) EDS spectrum of MoS2@Cu3Pt nanocomposites; (B) XPS spectrum of the bare SPE (a), SPE/PANI (b), SPE/PANI/MoS2 NFs (c) and SPE/PANI/MoS2@Cu3Pt NPs (d); (C) the Raman spectra of MoS2 NFs (a) and MoS2@Cu3Pt NPs (b); (D) TEM image of Cu3Pt NPs and the elemental mapping images of Cu3Pt NPs. | ||
Additionally, X-ray photoelectron spectroscopy (XPS) and Raman were employed for elemental analysis to further confirm the successful synthesis of the MoS2@Cu3Pt nanocomposites. As shown in Fig. 3B, three predominant peaks are present in the XPS spectrum, 284.5 eV (C 1s), 532.3 eV (O 1s) and 399.3 eV (N 1s), when no loading material was present on the working electrode surface (curve a). In comparison, a new peak S 2p (226.7 eV) is seen after the electrodeposition of the PANI nanocomposite (curve b), suggesting that the PANI has been successfully immobilized. After loading the MoS2 NFs onto the modified electrode, an additional peak, Mo 3d (171.2 eV), was detected (curve c). Curve d shows two more additional peaks, Pt 4f (109.9 eV) and Cu 2p (904.3 eV), supporting that the Cu3Pt NPs were successfully modified. Fig. 3C shows the Raman spectra of the MoS2 NFs (curve a) and MoS2@ Cu3Pt NPs (curve b); two characteristic peaks (the D-band at 384 cm−1 and the G-band at 407 cm−1) were observed. Comparing curves a and b, the peak intensity increased notably after modification with Cu3Pt NPs, which may be caused by the interaction between the MoS2 NFs and the metal atoms. Overall, these results demonstrated the successful synthesis of the MoS2@Cu3Pt nanocomposites.
3.3 Electrochemical characterisation
To further verify the stepwise modification processes, EIS was used to characterise the immunosensors (Fig. 4B). The EIS image of the bare SPE shows a semicircle with a relatively large radius (curve a). When PANI was modified onto the electrode, the semicircle diameter decreased significantly (curve b), since it can improve the electrode's specific surface area, enhancing electrochemical sensitivity. After immobilising MoS2 NFs, the semicircle diameter decreased dramatically (curve c). When the MoS2@Cu3Pt nanocomposites modified the electrode surface, the impedance value was further reduced (curve b), indicating that the nanocomposites were conducive to the transmission of electrons. However, when anti-PG I was immobilised on the surface of the modified electrode, the semicircle diameter increased significantly (curve e). The resistance further increased when the non-specific sites on the electrode surface were blocked with the non-conductive BSA (curve f). Furthermore, resistance increased when the modified electrode was incubated with PG I (curve g). All of the above phenomena were explained by the efficiency of electron transfer being hindered by the bioactive substances produced by the specific antigen–antibody reaction. In addition, the results obtained support the successful construction of the biosensor.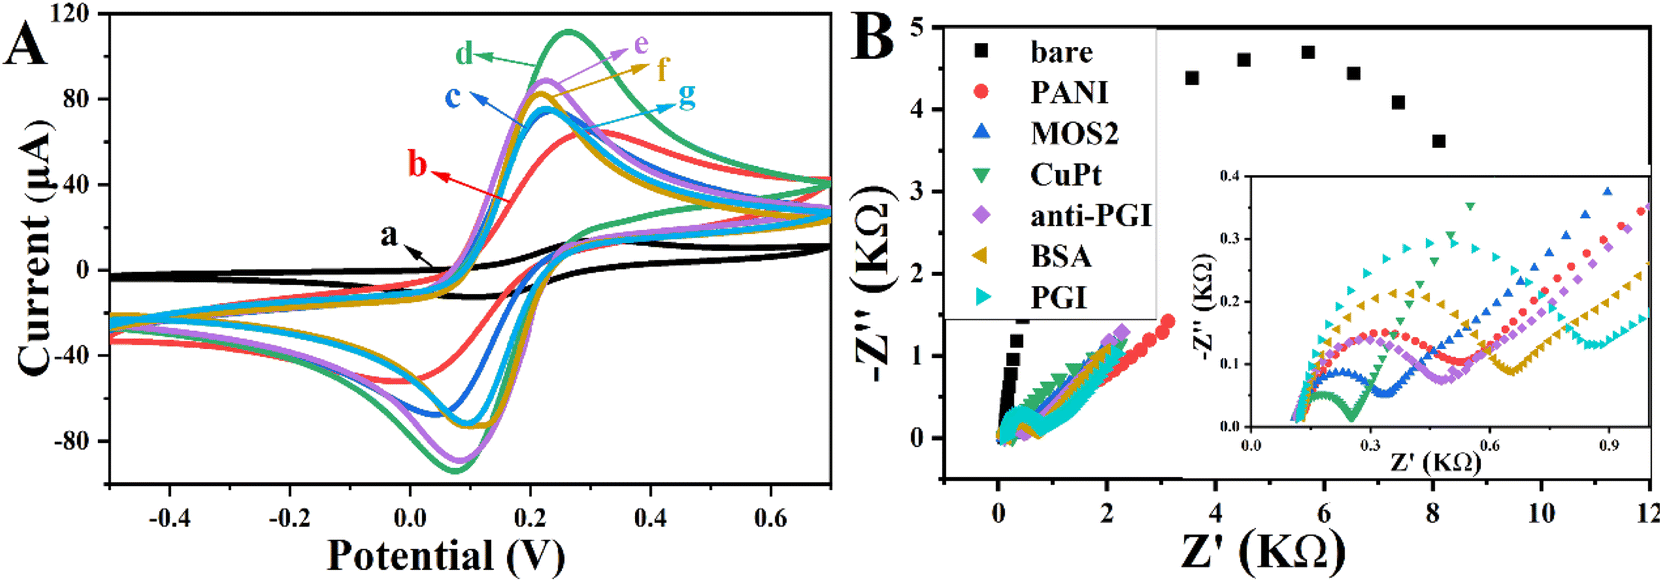 | ||
| Fig. 4 (A) CVs and (B) EIS of different modified electrodes in a 5 mM Fe(CN)63−/4− solution: (a) bare SPE, (b) SPE/PANI, (c) SPE/PANI/MoS2, (d) SPE/PANI/MoS2@Cu3Pt, (e) SPE/PANI/MoS2 @Cu3Pt/anti-PG I, (f) SPE/PANI/MoS2@Cu3Pt/anti-PG I/BSA and (g) SPE/PANI/MoS2 @Cu3Pt/anti-PG I/BSA/PG I. | ||
The step-by-step manufacturing process of the biosensor was characterised by CV and EIS in a 5 mM [Fe (CN)6]3−/4− solution. The results of the CV are shown in Fig. 4A, and the curve of the bare SPE (curve a) exhibits two characteristic redox peaks at 0.15 V and 0.29 V. This is because the [Fe (CN)6]3−/4− electron pair induced a redox reaction after applying voltage. After electrode modification with PANI, the peak current was obviously increased (curve b). The peak current increased when MoS2 NFs were deposited on the electrode surface (curve c). When MoS2@Cu3Pt nanocomposites were added, the electrochemical response increased markedly (curve d) because Cu3Pt NPs have excellent conductivity and enhance the transmission of electrical signals. However, after being combined with anti-PG I (curve e), BSA (curve f) and PG I (curve e), a further decrease can be observed in the peak current because the bioactive substances greatly inhibited electron transfer efficiency.
Fig. S1† shows the CV diagram of PANI/MoS2@Cu3Pt nanocomposite-modified electrodes performed at different scan rates (10–230 mV s−1). As shown in Fig. S1A,† both the anodic peak current (Ipa) and cathodic peak currents (Ipc) increased proportionally with an increased scan rate. Fig. S1B† shows the two linear regression equations for the peak currents and scan rates: Ipa (μA) = 34.64 + 0.26x (R2 = 0.978) and Ipc (μA) = −28.65–0.22x (R2 = 0.976). These results demonstrate that the redox reaction on the modified electrode was a diffusion-controlled process.
3.4 Optimisation of experimental conditions
The electrochemical performance of the immunosensors is influenced by several factors. To improve the catalytic efficiency and obtain a high sensitivity electrochemical sensor, we chose to optimise several experimental conditions.The amount of antigen captured by the antibody immobilised on the surface has a significant effect on the peak electrochemical response of the immunosensor. Anti-PG I was tested in the range of 100–250 μg mL−1 at a determined antigen concentration. Fig. S2A† shows that the peak current gradually decreased as the anti-PG I concentration increased and stabilised at 200 μg mL−1. Therefore, the optimal concentration of anti-PG I was determined to be 200 μg mL−1.
As shown in Fig. S2B,† with the incubation time increasing, the current response of the oxidation peak decreased and stabilised at 40 min. Therefore, 40 min was chosen as the optimal incubation time for the subsequent experiment.
The effect of incubation temperature on the peak currents was examined at 10–50 °C, as shown in Fig. S3C.† And the results show that the electrochemical signal decreases rapidly as the incubation temperature increases and then remains stable at 30 °C, indicating a favourable effect of increasing temperature on the immune response over a range of temperatures. However, when the temperature exceeded 50 °C, the peak current increased rapidly, suggesting that the electrode's immune response may be disrupted at higher temperatures. Therefore, 30 °C was chosen as the optimum incubation temperature.
Additionally, the immunosensor's sensitivity was investigated by varying the volume ratios of Cu3Pt NPs and MoS2 NFs in the nanocomposite. Fig. S3D† shows that for certain MoS2 NFs, the electrochemical signal increased rapidly as the proportion of Cu3Pt NPs in the composite increased. When the volume ratio of Cu3Pt NPs to MoS2 NFs in the composite reached 2:1, the increase in the electrical signal almost stopped. Therefore, we chose a volume ratio of 2:1 between Cu3Pt NPs and MoS2 NFs.
3.5 Stability, specificity and reproducibility of the immunosensor
The stability is an important analytical parameter for monitoring the performance of the designed electrochemical immunosensor. The prepared immunosensor was incubated at 4 °C. After 30 days of storage, no significant change in the electrochemical signal response was observed, and the same concentration of PG I was detected, indicating that the prepared immunosensor has good stability (Fig. 5A).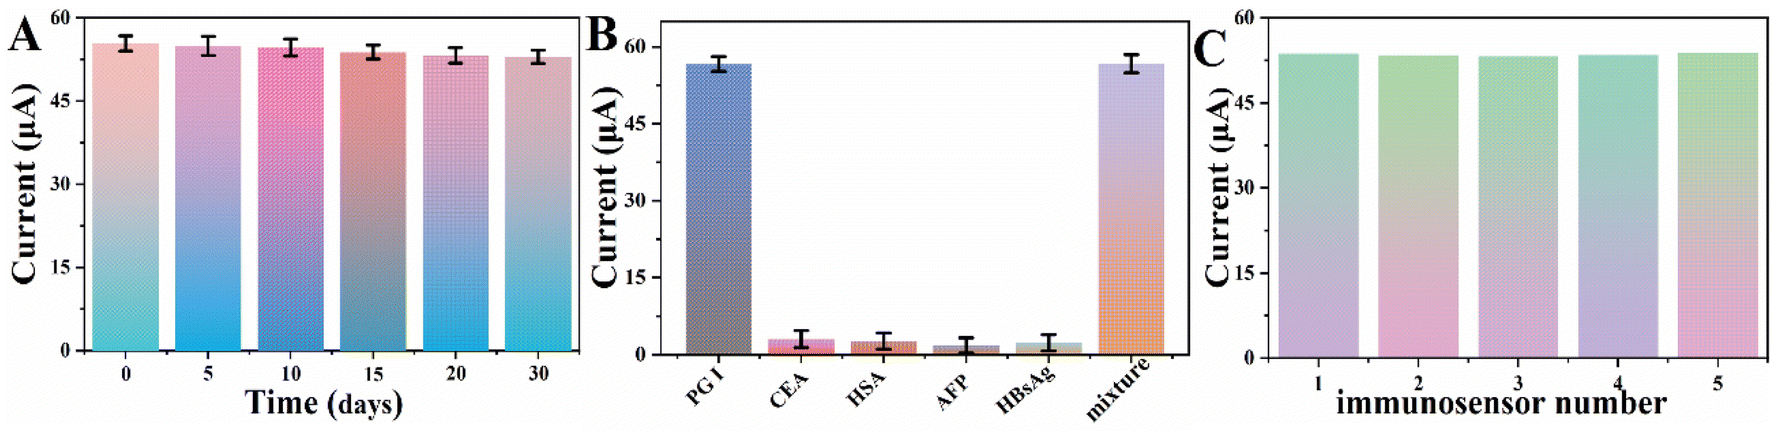 | ||
| Fig. 5 (A) Stability of the immunosensor at 0, 5, 10, 15, 20 and 30 days at 4 °C; (B) selectivity of the immunosensor with 100 ng per mL PG I, 100 ng per mL CEA, 100 ng per mL HSA, 100 ng per mL AFP, and 100 ng per mL HBsAg; (C) reproducibility of the five different immunosensors modified with 100 ng per mL PG I. | ||
To evaluate the specificity of the immunosensor, we conducted experiments with several common and highly interfering substances, such as CEA, HSA, AFP and HBsAg. Under the same experimental conditions, we also additionally set up a comparison experiment group to be tested containing only PG I and a group containing all of the above four interfering substances mixed with PG I. Fig. 5B shows the histogram of the peak currents corresponding to the detection results for the different samples, indicating that the immunosensor has good selectivity.
To analyse the reproducibility of the proposed immunosensor, PG I (100 ng mL−1) was detected by using five prepared immunosensors (Fig. 5C). The relative standard deviation (RSD) obtained for repeated measurements was 3.1%, suggesting that the designed immunosensor has good reproducibility.
3.6 Analytical performance
To verify the analytical detection performance of the immunosensor, electrochemical detection of PG I at different concentrations was carried out using DPV under optimal experimental conditions. As illustrated in Fig. 6A, the peak response decreased with increasing PG I concentration, with a detection range from 0.5 ng mL−1 to 400 ng mL−1. The linear relationship between the logarithmic value of PG I concentration and the current response is illustrated in Fig. 6B, and the regression equation is I (μA) = −7.81logcPGI (pg mL−1) +89.79, with a correlation coefficient of 0.983 and a limit of detection of 166.67 pg mL−1 (S/N = 3). The results show that the detection range far exceeds the warning value range, which is due to the excellent electrochemical performance of the as-prepared 3D nanocomposites. Compared with the reported methods (Table 1), the prepared immunosensor showed a wide linear range and a high sensitivity. Moreover, as this biosensor is prepared by an electrochemical method, it has better cost performance and a simpler preparation process, which also makes it more suitable for large-scale use.
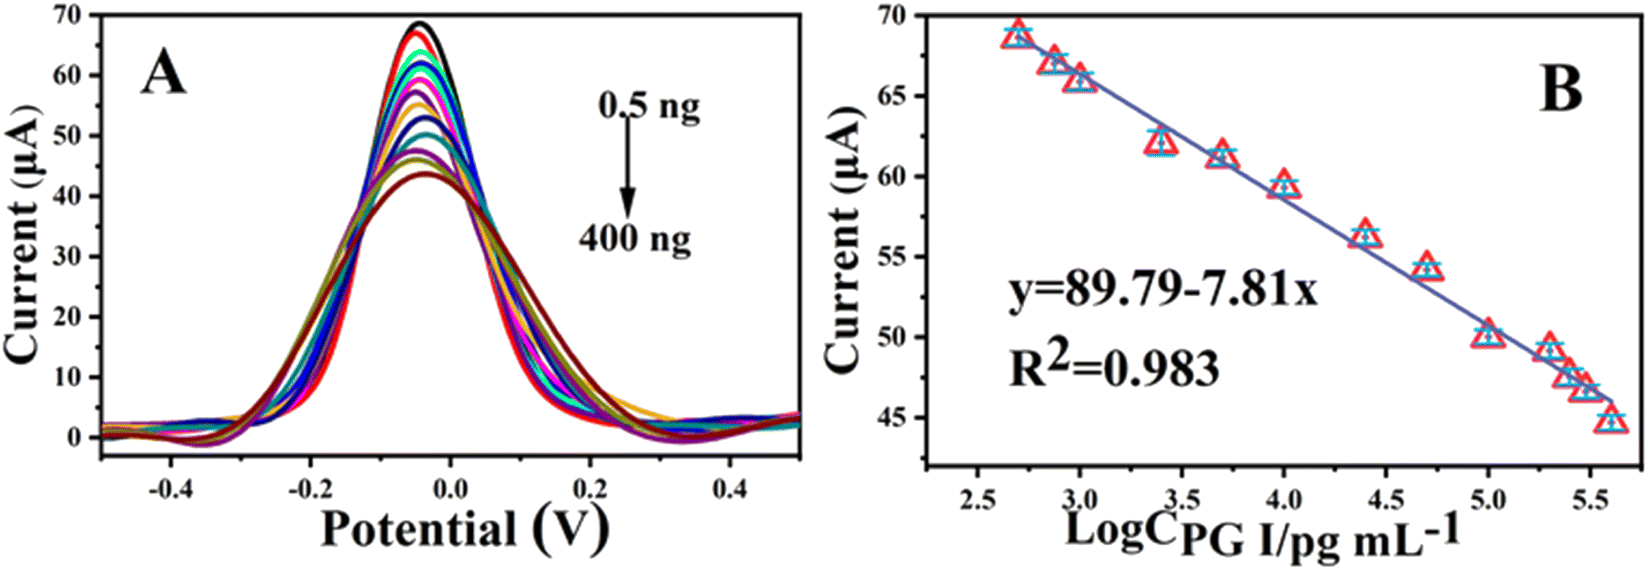 | ||
| Fig. 6 (A) DPV response of the immunosensor incubated with different concentrations of PG I: 0.5, 0.75, 1, 2.5, 5, 10, 25, 50, 100, 200, 250, 300 and 400 ng mL−1 in pH = 7.4 PBS; (B) the linear relationship between the current response and concentration of PG I. | ||
3.7 Analysis of real samples
To investigate the precision and accuracy of the proposed immunosensor in clinical practice, PG I in human serum samples from healthy individuals (sample 3) and patients (Table 2, samples 1, 2, 4 and 5) was assayed. The results were compared with those of EIAs, which are commonly used in clinical practice to detect and quantify PG I (reference method). The relative error between the two methods ranged from −15.07% to 5.76%. These data indicate good agreement between the two analytical methods and suggest that the designed immunosensor has potential for clinical use in detecting PG I.| Sample No. | Proposed method (ng mL−1) (n = 5) | Reference method (ng mL−1) | Relative error (%) |
|---|---|---|---|
| 1 | 6.2 | 7.3 | −15.07 |
| 2 | 18.89 | 20.27 | −6.81 |
| 3 | 125.63 | 118.19 | 5.76 |
| 4 | 41.2 | 43.32 | 4.91 |
| 5 | 50.13 | 52.18 | 3.93 |
4 Conclusions
In this study, an electrochemical biosensor was developed for the efficient detection of PG I. PANI contains many amino groups, which can significantly accelerate electron transfer. Furthermore, Cu3Pt NPs could be uniformly coordinated with MoS2 NFs, providing better conductivity and active sites for the immobilisation of anti-PG I. Thus, the developed biosensor exhibits a wide detection range, a low detection limit, excellent selectivity and efficient anti-interference capability. In particular, the constructed sensor can identify samples with concentrations in and around the alert range, which can greatly accelerate the screening process for patients. However, as only PG I was quantified in this study, PG II was not measured. And the PG II concentration is a key clinical criterion for doctors to assess the health of a patient's stomach. In future research, we will strive to overcome this problem and develop a highly sensitive sensor that can detect PG I and PG II simultaneously.Conflicts of interest
The authors declare that they have no known competing financial interests or personal relationships that could affect the work reported in this paper. This article does not contain any studies with human participants performed by any of the authors.Acknowledgements
This work was financially supported by the National Natural Science Foundation of China (81873913), Natural Science Foundation of Guangxi (2021GXNSFBA220051), and Guangxi one thousand young and middle-aged college and university backbone teachers’ cultivation program.References
- C. L. Vecchia, S. E. MunOz, C. Braga and E. Fernandez, Diet Diversity and Gastric Cancer, Int. J. Cancer, 1998, 72, 255–257 CrossRef.
- P. Chen, Y. L. Lin, K. C. Zheng, B. Y. Liu and C. Wu, Risk Factors of Gastric Cancer in High-Risk Region of China: A Population-Based Case-control Study, Asian Pac. J. Cancer Prev., 2019, 20, 775–781 CrossRef PubMed.
- H. Suzuki, E. Iwasaki and T. Hibi, Helicobacter Pylori and Gastric Cancer, Gastric Cancer, 2011, 12, 83–97 Search PubMed.
- H. Yoon and N. Kim, Diagnosis and Management of High Risk Group for Gastric Cancer, Gut Liver, 2015, 9, 5–17 CrossRef.
- X. Q. Liang, Z. Wang, H. T. Li, G. Ma, W. W. Yu, H. C. Zhou and H. B. Liu, Indication for Endoscopic Treatment Based on the Risk of Lymph Node Metastasis in Patients with Undifferentiated Early Gastric Cancer, As. J. Surg., 2020, 43, 973–977 CrossRef PubMed.
- H. S. Ahn, Y. S. Shin, P. J. Park, K. N. Kang, Y. Kim, H. J. Lee, H. K. Yang and C. W. Kim, Serum Biomarker Panels for the Diagnosis of Gastric Adenocarcinoma, Br. J. Cancer, 2012, 106, 733–739 CrossRef CAS PubMed.
- H. Tu, L. Sun, X. Dong, Y. Gong, Q. Xu, J. Jing, R. M. Bostick, X. Wu and Y. Yuan, A Serological Biopsy Using Five Stomach-Specific Circulating Biomarkers for Gastric Cancer Risk Assessment: A Multi-Phase Study, Am. J. Gastroenterol., 2017, 112, 704–715 CrossRef PubMed.
- E.-J. Cho, H.-K. Kim, T.-D. Jeong, D.-H. Ko, S. E. Bae, J.-S. Lee, W. Lee, J. W. Choe, S. Chun, H.-Y. Jung and W.-K. Min, Method Evaluation of Pepsinogen I/II Assay Based on Chemiluminescent Immunoassays and Comparison With Other Test Methods, Clin. Chim. Acta, 2016, 452, 149–154 CrossRef CAS PubMed.
- F. Mansour-Ghanaei, F. Joukar, M. Baghaee, M. Sepehrimanesh and A. Hojati, Only Serum Pepsinogen I and Pepsinogen I/II Ratio are Specific and Sensitive Biomarkers for Screening of Gastric Cancer, Biomol. Concepts, 2019, 10, 82–90 CAS.
- G. T. Kawai T, Moriyasu F Pepsinogen, Atrophic Gastritis and Gastric Cancer, Japanese journal of MHTS, 2014, 41, 303–307 Search PubMed.
- E. H. Kim, H. Kang, C. H. Park, H. S. Choi, D. H. Jung, H. Chung, J. C. Park, S. K. Shin, S. K. Lee and Y. C. Lee, The Optimal Serum Pepsinogen Cut-Off Value for Predicting Histologically Confirmed Atrophic Gastritis, Dig. Liver Dis., 2015, 47, 663–668 CrossRef CAS PubMed.
- K. K. Kitahara F, T. Sato, Y. Kojima and T. Araki, Accuracy of Screening for Gastric Cancer Using Serum Pepsinogen Concentrations, Gut, 1999, 44, 693–697 CrossRef PubMed.
- E. Cho, H. Kim, T. Jeong, D. Ko, S. E. Bae, J. S. Lee, W. Lee, J. W. Choe, S. Chun, H. Y. Jung and W. K. Min, Method Evaluation of Pepsinogen I/II Assay Based on Chemiluminescent Immunoassays and Comparison with Other Test Methods, Clin. Chim. Acta, 2016, 452, 149–154 CrossRef CAS PubMed.
- K. Li, X. Li, Y. Fan, C. Yang and X. Lv, Simultaneous Detection of Gastric Cancer Screening Biomarkers Plasma Pepsinogen I/II Using Fluorescent Immunochromatographic Strip Coupled with a Miniature Analytical Device, Sens. Actuators, B, 2019, 286, 272–281 CrossRef CAS.
- N. Konishi, K. Matsumoto, Y. Hiasa, Y. Kitahori, I. Hayashi and H. Matsuda, Tissue and Serum Pepsinogen I and II in Gastric Cancer Identified Using Immunohistochemistry and Rapid ELISA, J. Clin. Pathol., 1995, 48, 364–367 CrossRef CAS PubMed.
- T. Yasukawa, Y. Hirano, N. Motochi, H. Shiku and T. Matsue, Enzyme Immunosensing of Pepsinogens 1 and 2 by Scanning Electrochemical Microscopy, Biosens. Bioelectron., 2007, 22, 3099–3104 CrossRef CAS PubMed.
- F. Liu, J. Zou, X. Luo, Y. Liu, C. Huang, X. He and Y. Wang, A Point-of-Care Chemiluminescence Immunoassay for Pepsinogen I Enables Large-Scale Community Health Screening, Anal. Bioanal. Chem., 2021, 413, 4493–4500 CrossRef CAS PubMed.
- X. Wang, Y. Feng, A. Wang, L. Mei, P. Yuan, X. Luo and J. Feng, A Facile Ratiometric Electrochemical Strategy for Ultrasensitive Monitoring HER2 Using Polydopamine-Grafted-Ferrocene/Reduced Graphene Oxide, Au@Ag Nanoshuttles and Hollow Ni@PtNi Yolk-Shell Nanocages, Sens. Actuators, B, 2021, 331, 129460 CrossRef CAS.
- S. Cen, Y. Feng, J. Zhu, X. Wang, A. Wang, X. Luo and J. Feng, Eco-Friendly One-Pot Aqueous Synthesis of Ultra-Thin AuPdCu Alloyed Nanowire-like Networks for Highly Sensitive Immunoassay of Creatine kinase-MB, Sens. Actuators, B, 2021, 333, 129573 CrossRef CAS.
- S. Wei, H. Xiao, M. Gu, Z. Chen and L. Cao, Ultrasensitive Label-Free Electrochemical Immunosensor Based on Core-Shell Au@PtNPs Functionalized rGO-TEPA/PB Nanocomposite for HBsAg Detection, J. Electroanal. Chem., 2021, 890, 115216 CrossRef CAS.
- Y. Feng, J. He, L. Jiang, D. Chen, A. Wang and J. Feng, Novel Sandwich-Typed Electrochemical Immunosensing of C-Reactive Protein Using Multiply Twinned AuPtRh Nanobead Chains and Nitrogen-Rich Porous Carbon Nanospheres Decorated with Au Nanoparticles, Sens. Actuators, B, 2022, 358, 131518 CrossRef CAS.
- D. K. Bandgar, G. D. Khuspe, R. C. Pawar, C. S. Lee and V. B. Patil, Facile and Novel Route for Preparation of Nanostructured Polyaniline (PANi) Thin Films, Appl. Nanosci., 2012, 4, 27–36 CrossRef.
- G. Wang, A. Morrin, M. Li, N. Liu and X. Luo, Nanomaterial-Doped Conducting Polymers for Electrochemical Sensors and Biosensors, J. Mater. Chem. B, 2018, 6, 4173–4190 RSC.
- J. Yukird, O. Chailapakul and N. Rodthongkum, Label-Free Anti-Mullerian Hormone Sensor Based on Polyaniline Micellar Modified Electrode, Talanta, 2021, 222, 121561 CrossRef CAS PubMed.
- Y. Song, K. Cao, W. Li, C. Ma, X. Qiao, H. Li and C. Hong, Optimal Film Thickness of rGO/MoS2 @ Polyaniline Nanosheets of 3D Arrays for Carcinoembryonic Antigen High Sensitivity Detection, Microchem. J., 2020, 155, 104694 CrossRef CAS.
- Z. Gao, Y. Li, C. Zhang, S. Zhang, F. Li, P. Wang, H. Wang and Q. Wei, Label-Free Electrochemical Immunosensor for Insulin Detection by High-Efficiency Synergy Strategy of Pd NPs@3D MoSx Towards H2O2, Biosens. Bioelectron., 2019, 126, 108–114 CrossRef CAS PubMed.
- P. Yaiwong, N. Semakul, S. Bamrungsap, J. Jakmunee and K. Ounnunkad, Electrochemical Detection of Matrix Metalloproteinase-7 Using an Immunoassay on a Methylene Blue/2D MoS2/Graphene Oxide Electrode, Bioelectrochemistry, 2021, 142, 107944 CrossRef CAS PubMed.
- S. S. Singha, S. Mondal, T. S. Bhattacharya, L. Das, K. Sen, B. Satpati, K. Das and A. Singha, Au Nanoparticles Functionalized 3D-MoS2 Nanoflower: An Efficient SERS Matrix for Biomolecule Sensing, Biosens. Bioelectron., 2018, 119, 10–17 CrossRef CAS PubMed.
- D. Lin, Z. Su and G. Wei, Three-Dimensional Porous Reduced Graphene Oxide Decorated with MoS2 Quantum Dots for Electrochemical Determination of Hydrogen Peroxide, Mater. Today Chem., 2018, 7, 76–83 CrossRef CAS.
- S. Asaithambi, P. Sakthivel, M. Karuppaiah, K. Balamurugan, R. Yuvakkumar, M. Thambidurai and G. Ravi, Synthesis and Characterization of Various Transition Metals Doped SnO2@MoS2 Composites for Supercapacitor and Photocatalytic Applications, J. Alloys Compd., 2021, 853, 157060 CrossRef CAS.
- A. S. Pavlets, A. A. Alekseenko, N. Y. Tabachkova, O. I. Safronenko, A. Y. Nikulin, D. V. Alekseenko and V. E. Guterman, A Novel Strategy for the Synthesis of Pt–Cu Uneven Nanoparticles as an Efficient Electrocatalyst Toward Oxygen Reduction, Int. J. Hydrogen Energy, 2021, 46, 5355–5368 CrossRef CAS.
- E. Ma, P. Wang, Q. Yang, H. Yu, F. Pei, Y. Li, Q. Liu and Y. Dong, Electrochemical Immunosensor Based on MoS2 NFs/Au@AgPt YNCs as Signal Amplification Label for Sensitive Detection of CEA, Biosens. Bioelectron., 2019, 142, 111580 CrossRef CAS.
- X. Sun, K. Jiang, N. Zhang, S. Guo and X. Huang, Crystalline Control of {111} Bounded Pt3Cu Nanocrystals: Multiply-Twinned Pt3Cu Icosahedra with Enhanced Electrocatalytic Properties, Acs Nano, 2015, 9, 7634–7640 CrossRef CAS PubMed.
- Q. Gao, S. Wang, H. Fang, J. Weng, Y. Zhang, J. Mao and Y. Tang, One-Dimensional Growth of MoOx-Based Organic–Inorganic Hybrid Nanowires with Tunable Photochromic Properties, J. Mater. Chem., 2012, 22, 4709 RSC.
- Y. Chen, P. X. Yuan, A. J. Wang, X. Luo, Y. Xue, L. Zhang and J. J. Feng, A Novel Electrochemical Immunosensor for Highly Sensitive Detection of Prostate-Specific Antigen Using 3D Open-Structured PtCu Nanoframes for Signal Amplification, Biosens. Bioelectron., 2019, 126, 187–192 CrossRef CAS PubMed.
- B. Y. Xia, H. B. Wu, X. Wang and X. W. Lou, One-Pot Synthesis of Cubic PtCu3 Nanocages with Enhanced Electrocatalytic Activity for the Methanol Oxidation Reaction, J. Am. Chem. Soc., 2012, 134, 13934–13937 CrossRef CAS PubMed.
- W. Wei, W. Zhang, C. Li, H. Kong, Z. Guo, Z. Zhang, F. Bastien, Y. Gong, H. Wang and L. Zhou, Label-Free Detection of Pepsinogen 1 and 2 by Polyethylene Coating Lamb Microfluidic Device, Biosens. Bioelectron., 2019, 129, 231–237 CrossRef CAS PubMed.
- F. Wu, M. Mao, Y. Cen, H. Yang, Z. Qin and L. Ma, Copolymerization of Eu(TTA)3Phen Doped Styrene and Methyl Methacrylate Nanoparticles and Use in Quantitative Detection of Pepsinogen, RSC Adv., 2017, 7, 12217–12223 RSC.
- Y. Xie, X. Zhi, H. Su, K. Wang, Z. Yan, N. He, J. Zhang, D. Chen and D. Cui, A Novel Electrochemical Microfluidic Chip Combined with Multiple Biomarkers for Early Diagnosis of Gastric Cancer, Nanoscale Res. Lett., 2015, 10, 477 CrossRef.
Footnote |
| † Electronic supplementary information (ESI) available. See DOI: https://doi.org/10.1039/d2na00556e |
| This journal is © The Royal Society of Chemistry 2023 |