
 Open Access Article
 This Open Access Article is licensed under a Creative Commons Attribution-Non Commercial 3.0 Unported Licence
Integrated proteomic and metabolomic profiling of urine of renal anemia patients uncovers the molecular mechanisms of roxadustat†
Xiaoe
You‡
 a,
Baochun
Guo‡
abc,
Zhen
Wang
abc,
Hualin
Ma
abc,
Lixia
Liu
abc,
Ru
Zhou
abc,
Yaxuan
Zheng
a and
Xinzhou
Zhang
*abc
a,
Baochun
Guo‡
abc,
Zhen
Wang
abc,
Hualin
Ma
abc,
Lixia
Liu
abc,
Ru
Zhou
abc,
Yaxuan
Zheng
a and
Xinzhou
Zhang
*abc
aThe Second Clinical Medical College, Jinan University (Shenzhen People's Hospital), Shenzhen 518020, Guangdong, China. E-mail: xin.zhou2@qq.com
bDepartment of Nephrology, Shenzhen Peoples Hospital (The Second Clinical Medical College, Jinan University, The First Affiliated Hospital, Southern University of Science and Technology), Shenzhen 518020, Guangdong, China
cShenzhen Key Laboratory of Kidney Diseases, Shenzhen People's Hospital (The Second Clinical Medical College, Jinan University, The First Affiliated Hospital, Southern University of Science and Technology), Shenzhen 518055, Guangdong, China
First published on 20th March 2023
Abstract
Roxadustat (FG-4592) is a hypoxia-inducible factor prolyl hydroxylase inhibitor (HIF-PHI) prescribed to patients with low hemoglobin associated with chronic kidney disease. Due to the various HIF-mediated adaptive responses, FG-4592 has attracted significant interest for therapeutic use against various diseases. However, the clinical application of Roxadustat remains limited due to a lack of understanding of its underlying mechanisms. Herein, we performed label-free quantitative liquid chromatography with tandem mass spectrometry (LC-MS–MS) proteomics and un-targeted metabolomics to study the protein and metabolite alterations in the urine of renal anemia patients before and after Roxadustat therapy. The results were validated by parallel reaction monitoring (PRM). A total of 46 proteins (including 15 upregulated and 31 downregulated proteins) and 207 metabolites were significantly altered after Roxadustat treatment in urine samples obtained from renal anemia patients. Then, the altered proteins were further validated by PRM. Finally, proteomics combined with metabolomics analysis revealed that the Ras signalling pathway, cysteine and methionine metabolism, arginine and proline metabolism, and cholesterol metabolism were the main pathways altered by Roxadustat treatment. The multi-omics analysis revealed that Roxadustat could alter the protein expression and reverse the potential metabolic changes to exert hypotensive, lipid metabolic regulation, and renoprotective effects in clinical practice.
1 Introduction
Roxadustat is a specific hypoxia-inducible factor prolyl hydroxylase inhibitor (HIF-PHI) that has been approved for renal anemia treatment in dialysis and non-dialysis patients mediated by inhibiting the activity of prolyl hydroxylase domain (PHD) protein under normoxic conditions, which in turn, lead to the stabilization of hypoxia-inducible factors (HIF).1 It has been shown that HIF regulates the expression of erythropoietin (EPO), hepcidin, and other associated factors to promote erythropoiesis at multiple levels.2 Roxadustat has been widely used in clinical practice due to its advantages, including safety and clinical curative effect.3 Moreover, it is widely thought that this agent may have consequences beyond correcting renal anemia owing to the variety of HIF-regulated adaptive responses.4 There is an increasing consensus that Roxadustat is a promising candidate for treating a variety of diseases beyond anemia,5 including hyperlipidemia,6,7 kidney injury,8 and hypertension.9Roxadustat has been identified as a promising therapeutic drug used for dyslipidemia in many randomized controlled trials (RCTs). In this respect, during a phase 3 trial conducted at 29 sites in China, the reduction from baseline in the total cholesterol level was 40.6 mg per deciliter after Roxadustat treatment and 7.7 mg per deciliter in the placebo group.10 Wu et al. demonstrated that the Roxadustat treatment group decreased the total cholesterol and LDL levels compared with the placebo group. Back in 2007, it was reported that HIF mediated an increase in the amount of Insig-1 and Insig-2, which accelerated the degradation of 3-hydroxy-3-methylglutaryl-CoA reductase, and finally slowed down the rate-determining step of cholesterol synthesis,11 suggesting a potential role for Roxadustat in serum lipid metabolism, although the underlying mechanism remains unknown.
The reno-protective effect of Roxadustat has been verified via in vitro and in vivo experiments. A huge number of independent studies have demonstrated that Roxadustat can act as a potential therapeutic agent for different types of acute kidney injury (AKI) in humans by potential mechanisms that are involved in diminishing tubular epithelial cell (TEC) injury, suppressing sequence inflammatory responses, etc.8,12–14 At the same time, Roxadustat can reportedly delay the AKI to chronic kidney disease (CKD) transition by improving vascular regeneration and anti-oxidative capabilities.15 Notwithstanding that previous studies have demonstrated the roles of Roxadustat on AKI, it remains unclear whether similar protective roles against CKD exist, warranting further exploration.
Long-term high blood pressure is one of the major risks for CKD pathogenesis. A previous study demonstrated that conditional deletion of HIF1α in mice models from vascular smooth muscle cells (VSMCs) enhanced the systolic, diastolic, and mean arterial pressure (MAP) of mice.16 Jing Yu et al. demonstrated that systemic administration of the HIFα stabilizer FG-4592 reversed the hypertension phenotype and organ injury induced by angiotensin II (Ang II) by enhancing endothelial NO synthase (eNOS) and differentially regulating angiotensin receptor type 1 (AGTR1) and AGTR2 in the vasculature.9 Besides, overexpression of HIF2α exacerbating pulmonary hypertension has been reported.17,18 Even though the correlation between Roxadustat and HIF in blood pressure has been established, the interplay and mechanisms among Roxadustat, HIF, blood pressure regulation, and associated networks warrant further investigation. At the same time, most studies as mentioned above are focused on a preclinical trail without a detailed mechanistic demonstration, and it will be necessary to digest the deep molecular event of Roxadustat at multiple levels using different models.
Proteomics and metabolomics are popular platforms used for clinical diagnosis and therapeutics-target screening, which have been extensively utilized in identifying diagnostic biomarkers and exploring the pathophysiological mechanisms of various diseases.19 Proteomics has been mainly used to identify significantly altered proteins in biological tissue, while metabolomics refers to the comprehensive and quantitative analysis of all metabolites in complex biochemical mixtures, characterizing biological systems. Meanwhile, mass spectrometry (MS)-based proteomics and metabolomics are powerful technologies that are widely applied in molecular biology.
Urine is derived from peripheral circulation and is a more accessible source for diagnosing several diseases, especially kidney disease.20–22 Herein we employed label-free quantitative proteomic and non-targeted metabolomic methods to investigate the molecular alterations in urine obtained from renal anemia patients that receive Roxadustat treatment. Parallel reaction monitoring (PRM) further validated the significantly altered proteins. By co-analysing the proteomics and metabolomics data, we further revealed the regulatory network involved in these two approaches. To our knowledge, this is the first report utilizing a multi-omics approach to investigate the global response of urine proteins and urine metabolites in renal anemia due to Roxadustat treatment. Importantly, our findings provide new insights into understanding the potential mechanism of Roxadustat during clinical practice.
2 Materials and methods
2.1 Patient assessments and sample collection
12 urine samples were retrieved from 6 patients with renal anemia at the Shenzhen People's Hospital. Patients with anemia due to other causes or severe comorbidities, such as cardiovascular, anaphylactoid purpura, liver diseases, urinary tract infection, and serious gynecological disorders, were excluded. The study was conducted in accordance with the principles of the Declaration of Helsinki and approved by the Ethics Committee of the Second Clinical Medical College (Shenzhen People's Hospital) of Jinan University. All subjects provided informed consent.The urine samples (50 mL for each patient before and after 1 month of medication, 6 patients in total) were centrifuged at 4 °C for approximately 10 min at 1000g (Centrifuge 5427 R, Eppendorf), and the supernatant was transferred to new tubes and stored at −80 °C. At the same time, details on the clinical characteristics of patients were collected.
2.2 Proteomics analysis
![[thin space (1/6-em)]](https://www.rsc.org/images/entities/char_2009.gif) 000 × g, 4 °C) for 10 min and, after an equal volume (2 mL) of methanol and a 1/4 volume (0.5 mL) of chloroform were added, was vortexed vigorously for 15 s and placed at room temperature for 5 min. After centrifugation at 12000 × g for 10min, the supernatant was discarded, then an equal volume (2 mL) of methanol was added and shaken for 15 sec. The previous step was repeated, and 80 μL lysate (containing 1% SDC) was added. Finally, the protein concentration was quantified using a BCA kit (Beyotime, P0010) according to the manufacturer's instructions.
:50 trypsin-to-protein mass ratio for the first digestion overnight and a 1:100 trypsin-to-protein mass ratio for a second 4 h-digestion. After the second 4 h enzymatic hydrolysis, the reaction was terminated by adding 10% trifluoroacetic acid (TFA) solution and adjusting the pH to 2–3. Then, the peptides were desalted by solid phase extraction (SPE strata-X, Phenomenex, 8B-S100-AAK). The desalted peptides were dried by vacuum centrifuging and dissolved by mass spectrometry mobile phase A. The sample injection volume was 3 μL.
000 resolutions, and the m/z range for the MS scans was 400–1200. The secondary mass spectrometry scan range had a fixed starting point of 110 m/z, and the secondary scan resolution was set to 30000. TurboTMT was set to Off. The data acquisition mode was based on the data-dependent scan (DDA) mode. To improve the effective utilization of the mass spectrum, the automatic gain control (AGC) was set at 75%, then the signal threshold was set to 10000 ions per s, and the maximum injection time was set to 100 ms with 30.0 s dynamic exclusion.
< 0.05 were considered significant and were separated into individual categories. All differentially expressed protein accession numbers or sequences were examined thoroughly by the STRING database (version 10.5) for visualization in a protein–protein interaction network.
500. Data were acquired using the data-independent acquisition (DIA) mode. For HCD, the normalized collision energy was set to 28. The automatic gain control (AGC) was set at 3E6 mode for the whole MS, and 5E4 mode was specified for MS/MS. The maximum IT was set at 50 milliseconds for full MS and 142 ms for MS/MS. The isolation window was set to 2.0 m/z for MS/MS. The resulting MS data were processed using Skyline (v.21.1). The peptide settings were as follows: the enzyme was set to Trypsin [KR/P], the maximum missed cleavage was set to 0, the peptide length was set to 7–25, and cysteine alkylation was set as a fixed modification. Transition settings: precursor charges were set as 2, 3, ion charges were set as 1, and ion types were set as b, y. The product ions ranged from ion 3 to the last ion, and the ion match tolerance was set as 0.02 Da.
000 × g, 4 °C) for 10 min and, after an equal volume (2 mL) of methanol and a 1/4 volume (0.5 mL) of chloroform were added, was vortexed vigorously for 15 s and placed at room temperature for 5 min. After centrifugation at 12000 × g for 10min, the supernatant was discarded, then an equal volume (2 mL) of methanol was added and shaken for 15 sec. The previous step was repeated, and 80 μL lysate (containing 1% SDC) was added. Finally, the protein concentration was quantified using a BCA kit (Beyotime, P0010) according to the manufacturer's instructions.
:50 trypsin-to-protein mass ratio for the first digestion overnight and a 1:100 trypsin-to-protein mass ratio for a second 4 h-digestion. After the second 4 h enzymatic hydrolysis, the reaction was terminated by adding 10% trifluoroacetic acid (TFA) solution and adjusting the pH to 2–3. Then, the peptides were desalted by solid phase extraction (SPE strata-X, Phenomenex, 8B-S100-AAK). The desalted peptides were dried by vacuum centrifuging and dissolved by mass spectrometry mobile phase A. The sample injection volume was 3 μL.
000 resolutions, and the m/z range for the MS scans was 400–1200. The secondary mass spectrometry scan range had a fixed starting point of 110 m/z, and the secondary scan resolution was set to 30000. TurboTMT was set to Off. The data acquisition mode was based on the data-dependent scan (DDA) mode. To improve the effective utilization of the mass spectrum, the automatic gain control (AGC) was set at 75%, then the signal threshold was set to 10000 ions per s, and the maximum injection time was set to 100 ms with 30.0 s dynamic exclusion.
< 0.05 were considered significant and were separated into individual categories. All differentially expressed protein accession numbers or sequences were examined thoroughly by the STRING database (version 10.5) for visualization in a protein–protein interaction network.
500. Data were acquired using the data-independent acquisition (DIA) mode. For HCD, the normalized collision energy was set to 28. The automatic gain control (AGC) was set at 3E6 mode for the whole MS, and 5E4 mode was specified for MS/MS. The maximum IT was set at 50 milliseconds for full MS and 142 ms for MS/MS. The isolation window was set to 2.0 m/z for MS/MS. The resulting MS data were processed using Skyline (v.21.1). The peptide settings were as follows: the enzyme was set to Trypsin [KR/P], the maximum missed cleavage was set to 0, the peptide length was set to 7–25, and cysteine alkylation was set as a fixed modification. Transition settings: precursor charges were set as 2, 3, ion charges were set as 1, and ion types were set as b, y. The product ions ranged from ion 3 to the last ion, and the ion match tolerance was set as 0.02 Da.
2.3 Metabolomics analysis
:1 (stored at 20 °C) was added and vortexed for 1 min. Finally, after centrifugation for 10 min at 12000 rpm and 4 °C, the supernatant was filtered with a 0.22 μm membrane and transferred into the detection bottle for LC-MS detection. A high speed freezing centrifuge was obtained from Hunan Xiangyi Experi ment Equipment Co., Ltd (Hunan, China). A vortex mixer was obtained from Haimen Kylin-bell Lab Instruments Co., Ltd. (Haimen, China). Microporous membrane filters (0.22 pim) were purchased from Tianjin Jinteng Experiment Equipment Co., Ltd (Tianjin, China). LC-MS grade methanol (MeOH) was purchased from Fisher Scientific (Loughborough, UK). 2-Amino-3-(2-chloro-phenyl)-propionic acid was obtained from Aladdin (Shanghai, China). Ultrapure water was generated using a Milli-Q system (Millipore, Bedford, USA).
Mass spectrum conditions: Mass spectrometric detection of metabolites was performed on Q Exactive (Thermo Fisher Scientific, USA) with an ESI ion source. Simultaneous MS1 and MS/MS (Full MS-ddMS2 mode, data-dependent MS/MS) acquisition was used. The parameters were as follows: sheath gas pressure, 30 arb; aux gas flow, 10 arb; spray voltage, 3.50 kV and −2.50 kV for ESI(+) and ESI(−), respectively; capillary temperature, 325 °C; MS1 range, m/z 81–1000; MS1 resolving power, 70000 FWHM; number of data dependent scans per cycle, 10; MS/MS resolving power, 17500 FWHM; normalized collision energy, 30%; dynamic exclusion time, automatic.24
30 ppm) and MS/MS data which were matched with HMDB (https://www.hmdb.ca), MassBank (https://www.massbank.jp/), Lipid Maps (https://www.lipidmaps.org), mzCloud (https://www.mzcloud.org) and KEGG (https://www.genome.jp/kegg/). The robust LOESS signal correction (QC-RLSC) was applied for data normalization to correct any systematic bias. After normalization, only ion peaks with relative standard deviations (RSDs) less than 30% in QC were kept ensuring appropriate metabolite identification. The ropls R package was used for all multivariate data analyses and modeling. After scaling the data, models were built on principal component analysis (PCA), orthogonal partial least-square discriminant analysis (PLS-DA) and orthogonal partial least-square discriminant analysis (OPLS-DA). The metabolic profiles were visualized as score plots, where each point represents a sample. The corresponding loading plot and S-plot were generated to provide information on the metabolites that influence the clustering of the samples. All the models evaluated were tested for overfitting with methods of permutation tests. OPLS-DA allowed the determination of discriminating metabolites using the variable importance on projection (VIP). The P value, VIP produced by OPLS-DA, and fold change (FC) were applied to identify significant variables for classification. Finally, P values< 0.05 and VIP values > 1 were used as the threshold criteria for identifying statistically significant metabolites.
2.4 Integrated analysis of metabolomics and proteomics
We conducted proteomic and metabolomic association analyses for the CKD patients before and after Roxadustat treatment. We calculated all proteins and differentially expressed metabolites and compared their correlations by Spearman rank to analyse the differently expressed metabolites and proteins. Meanwhile, we screened the significantly related differential proteins and metabolites with a Spearman correlation coefficient threshold of >0.8 and generated a co-expression network using Cytoscape software.2.5 Statistical analysis
SPSS17.0 software was used for data processing and analysis. The measurement data were expressed as mean ± standard error of the mean (SEM). A paired-sample t-test was used for the characteristics of the samples between the two groups. A P-value < 0.05 was statistically significant.3 Result
3.1 Participant characteristics and changes in the biochemical indicators
As stated previously, 6 patients with renal anemia treated with Roxadustat were included in this study. The clinical characteristics of these patients are described in Table 1. We found that Roxadustat significantly increased the mean hemoglobin levels (82.67 vs. 90.67 g dl−1, P = 0.05), further validating the effect of FG-4592 on renal anemia. Meanwhile, improvement in lipids demonstrated the potential lipid-lowering effects of Roxadustat. However, there were no significant differences in serum creatinine or the estimated glomerular filtration rate before and after therapy, which may be due to the dynamic changes in serum creatinine and may be controlled by various factors. Patients with renal anemia often have other comorbidities which confer a particularly high risk of CKD progression. No significant change in patient blood pressure was observed (data not shown), which might be explained by the routine clinical administration of angiotensin-converting enzyme inhibitor (ACEI) or angiotensin receptor blocker (ARB) drugs in CKD patients. Furthermore, the low number of participants and the short follow-up period are non-negligible factors.| Before treatment | After treatment | P value | |
|---|---|---|---|
| Demographics | |||
| Age (mean ± SD) | 49.67 ± 18.82 | 49.67 ± 18.82 | — |
| Gender (male/female) | 1/5 | 1/5 | |
| Physical exam | |||
| Hemoglobin (g l−1) | 82.67 ± 12.04 | 90.67 ± 15.80 | 0.05 |
| Low-density lipoprotein (mmol l−1) | 2.12 ± 0.53 | 1.45 ± 0.57 | 0.02 |
| Triglycerides (mmol l−1) | 2.44 ± 1.66 | 1.78 ± 1.6 | 0.10 |
| Total cholesterol (mmol l−1) | 3.91 ± 0.56 | 2.66 ± 0.45 | 0.07 |
| Serum creatinine (SCr) | 636.07 ± 322.13 | 622.61 ± 232.92 | 0.924 |
3.2 Effect of roxadustat on the urine proteomics of patients
 | ||
| Fig. 1 GO and KEGG analysis of the differential expression of proteins. (A) Molecular function of DEPs. (B) Cellular component of DEPs. (C) Biological process of DEPs. (D) KEGG pathway. | ||
3.3 Effect of Roxadustat on the urine metabolomics of patients
 | ||
| Fig. 2 The typical base peak intensity chromatograms: (A) positive ion mode; (B) negative ion mode. The OPLA-DA and PLS-DA score map of the quality control samples: (C) OPLA-DA score map; (D) PLS-DA score map. | ||
A VIP score > 1 and P < 0.05 was set as the criteria for differential metabolite screening. In total, 207 differential metabolites were identified, with 58 upregulated and 149 downregulated metabolites (ESI†). To further understand the metabolic changes, heatmaps were used to visualize the change after Roxadustat treatment (Fig. 3A). The significantly upregulated metabolites included uric acid, L-tryptophan, histamine, and choline. The significantly downregulated metabolites contained nicotinic acid, citric acid, succinic acid, L-leucine, butyric acid, and pyruvic acid (Fig. 4). KEGG analysis showed that these differentially expressed metabolites were significantly enriched in central carbon metabolism in cancer, protein digestion and absorption, valine, leucine and isoleucine biosynthesis, phenylalanine, tyrosine and tryptophan biosynthesis, the citrate cycle (TCA cycle), etc (Fig. 3B). These above-mentioned pathway alterations revealed that Roxadustat caused significant metabolite changes in the urine of renal anemia patients.
 | ||
| Fig. 3 Differential metabolites and their corresponding pathways. (A) Heatmap of the intensities of differential metabolites before and after medication. The degree of change is marked with different colours: red indicates upregulation, and blue represents downregulation. Each column represents an individual sample, and each row represents a metabolite. (B) The bubble chart of KEGG pathway enrichment. | ||
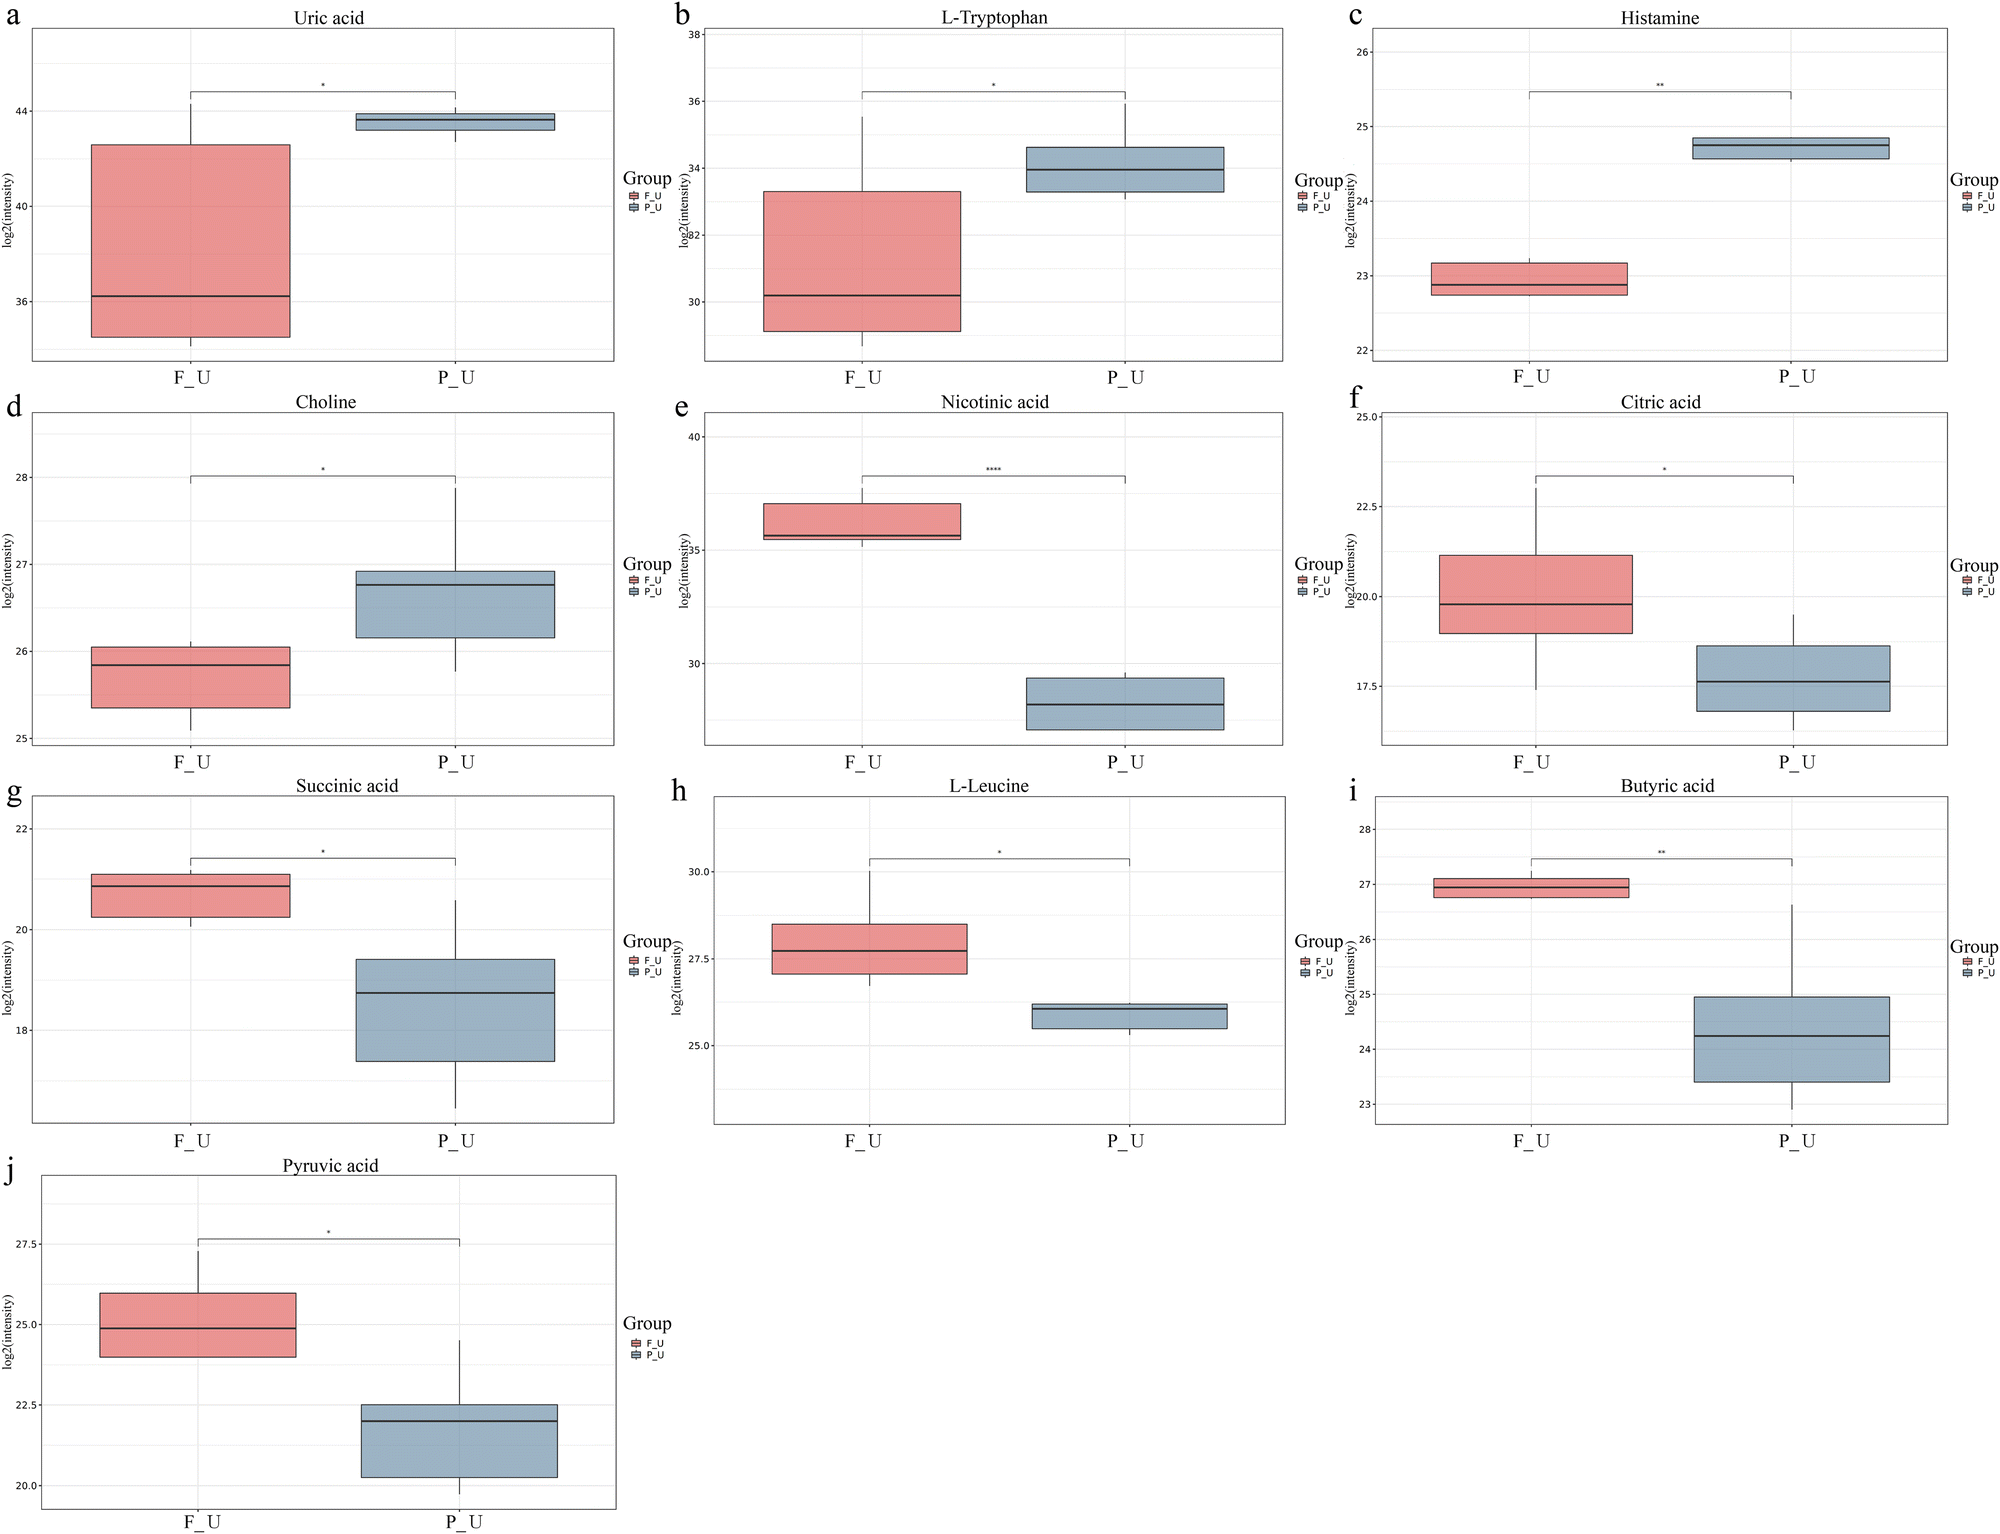 | ||
| Fig. 4 The distribution of differences is visualized in a box plot. Each plot represents a different metabolite: (a) uric acid; (b) L-Tryptophan; (c) histamine; (d) choline; (e) nicotinic acid; (f) citric acid; (g) succinic acid; (h) L-Leucine; (i) butyric acid; (j) pyruvic acid. | ||
 | ||
| Fig. 5 The graph was obtained by plotting on the y-axis the −log of p-values from the pathway enrichment analysis and on the x-axis the pathway impact values derived from the pathway topology analysis. Colour intensity (white to red) reflects increasing statistical significance, while the circle diameter covaries with pathway impact. | ||
3.4 Correlation analysis between proteomics and metabolomics
As stated above, we identified all differentially expressed proteins and metabolites and assessed their relationship by Spearman rank correlation analysis. The correlation coefficient is presented in a heatmap in ESI.† The high similarity between them was demonstrated by the cluster branches (the red colour indicates positive, and the blue colour means negative correlation). Spearman correlation analysis was conducted to screen significant differential proteins and metabolites with a Spearman correlation coefficient >0.8 or < −0.8, and a co-expression network was generated. The network was visualized using Cytoscape software (ESI†). Then, we conducted KEGG pathway analysis of the differential proteins and metabolites to assess the potential relationship between differential proteins and differential metabolites (Fig. 6). It was found that the Ras signalling pathway, tryptophan metabolism, cholesterol metabolism, glycerophospholipid metabolism, and arginine and proline metabolism were significantly enriched.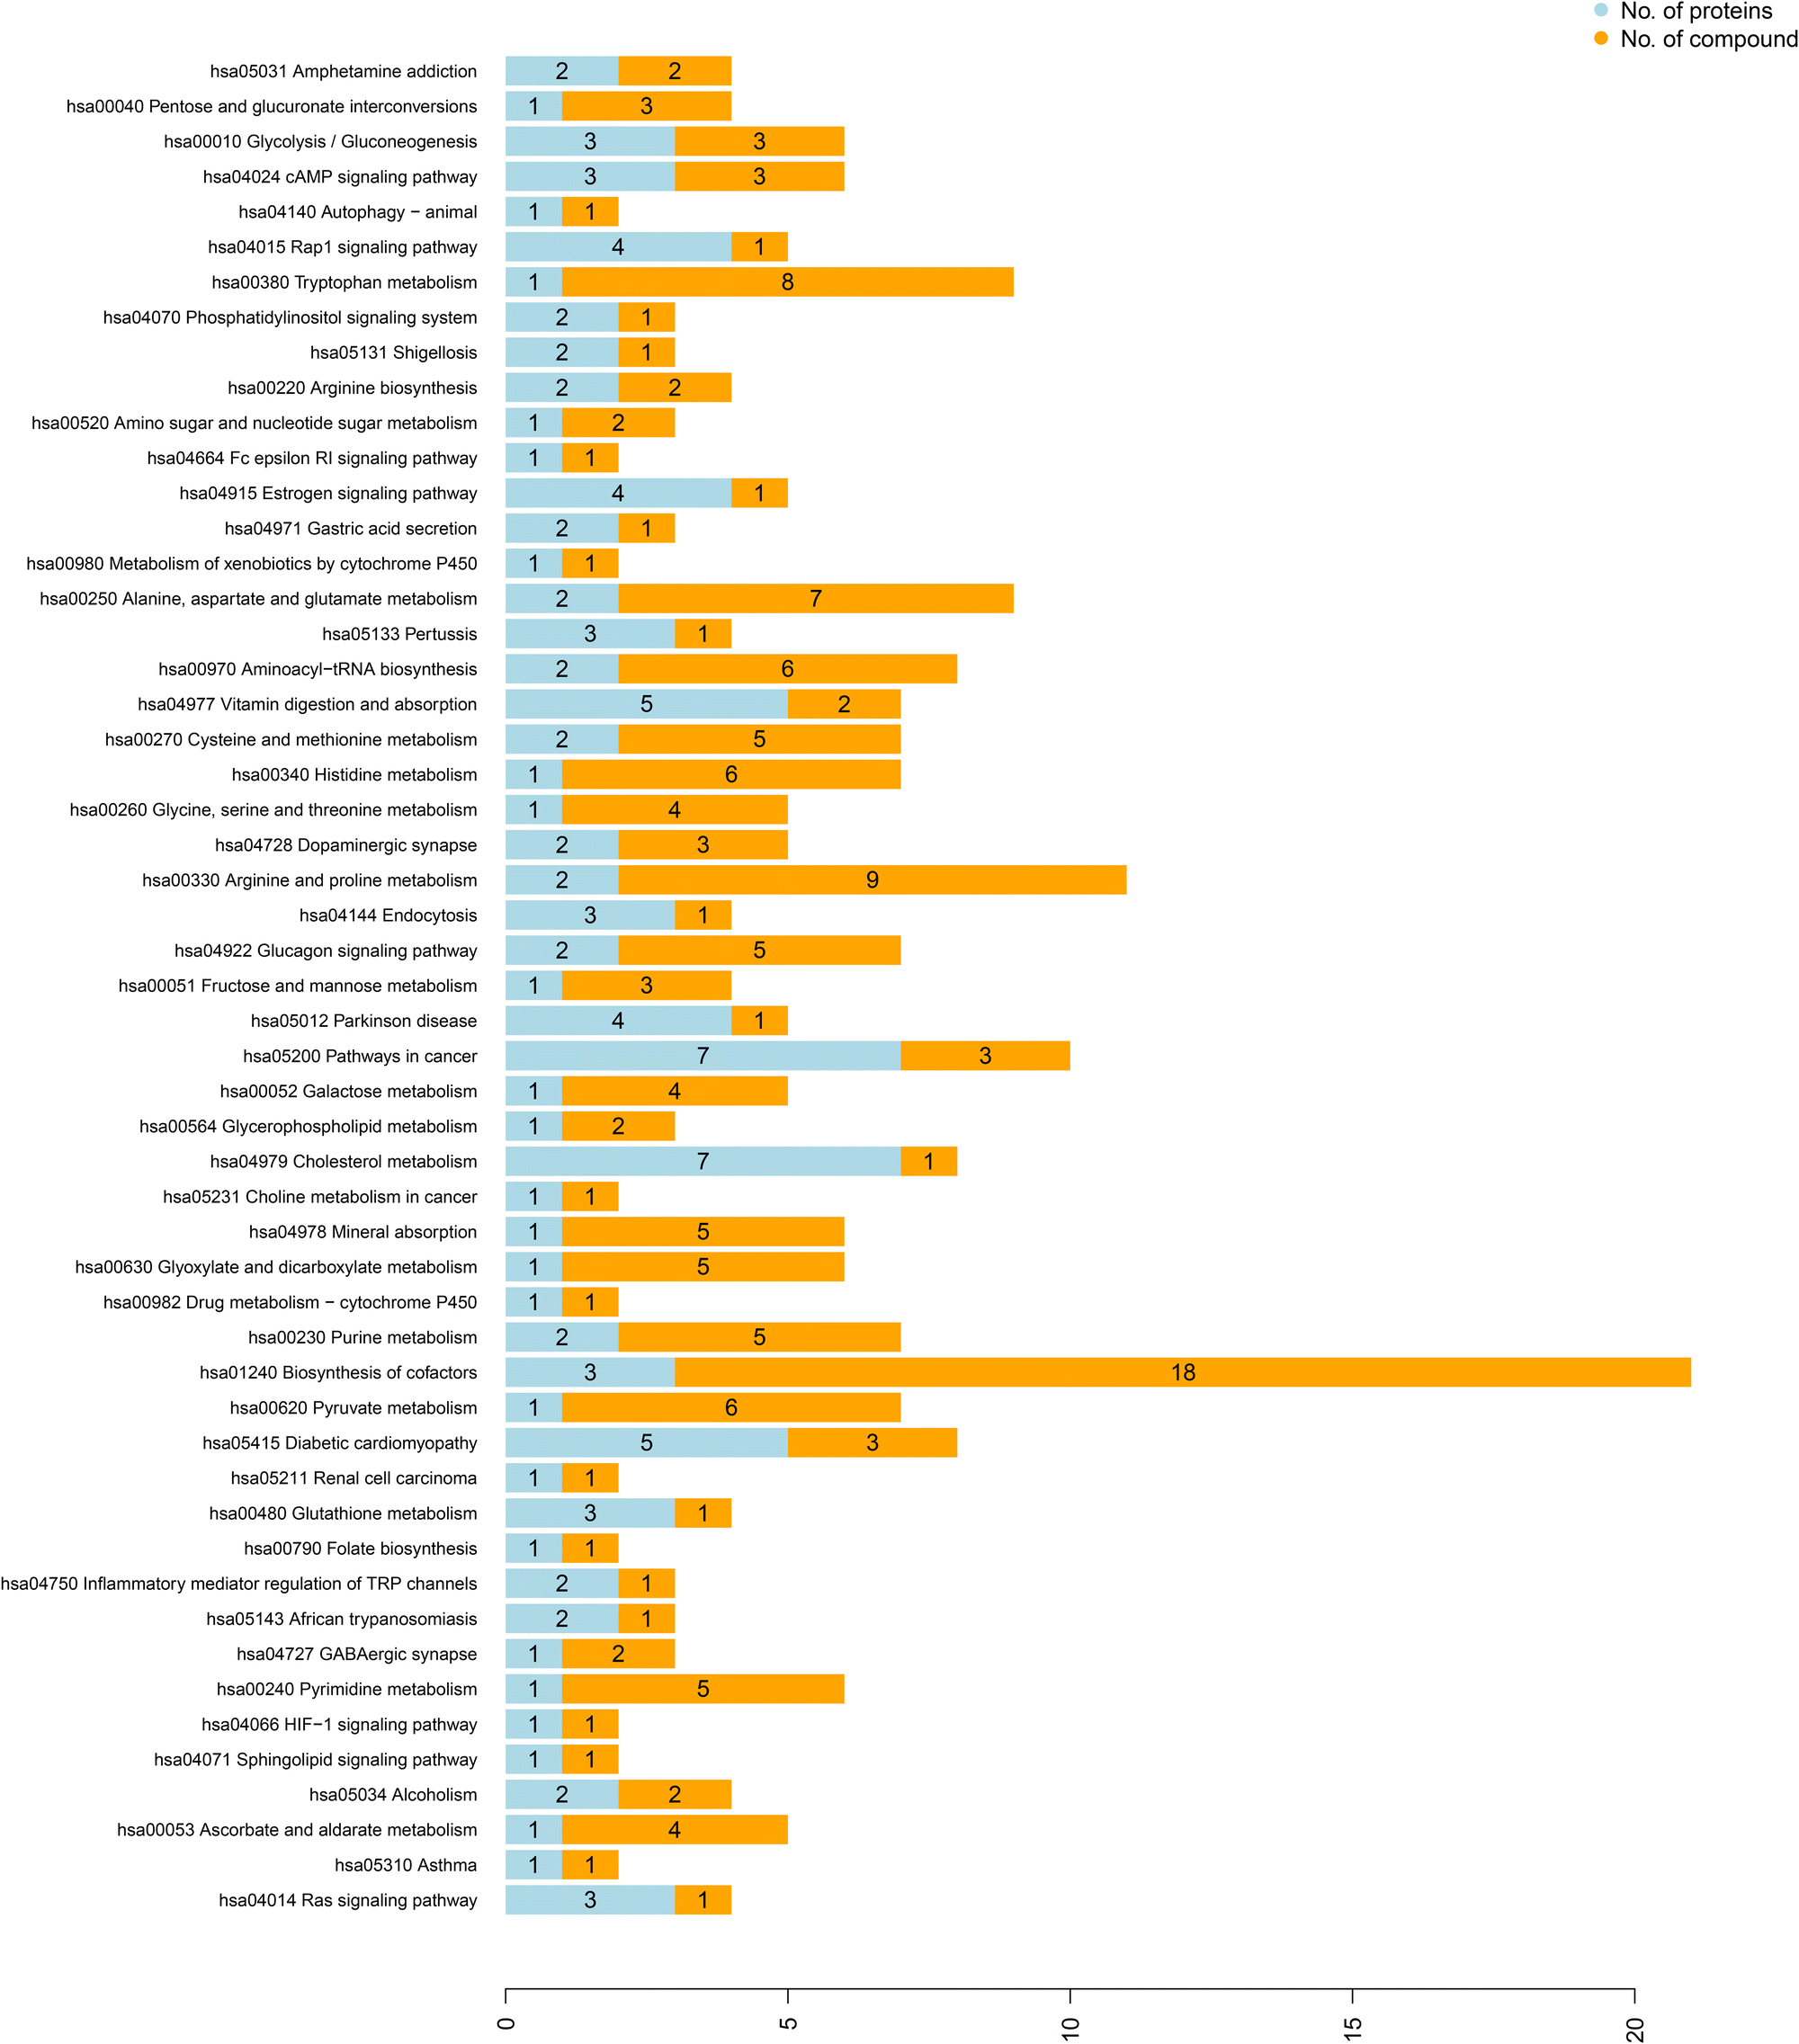 | ||
| Fig. 6 KEGG pathway annotation of differential proteins and differential metabolites. | ||
4 Discussion
In the present study, using label-free quantitative proteomics and untargeted metabolomics, we identified the alterations in both proteins and metabolites that mediate the therapeutic effect of Roxadustat in renal anemia patients clinically. We identified 28 proteins and 207 metabolites that were significantly altered under Roxadustat treatment and are widely thought to be linked to lipid metabolism, kidney injury, and hypertension. To our knowledge, this is the first study investigating urine proteomics and metabolomics associated with Roxadustat.4.1 The lipid-lowering effect of Roxadustat
As shown in ESI,† the NENF protein expression significantly increased after Roxadustat treatment. Studies on 3T3-L1 murine adipocytes showed that interference with the NENF gene significantly inhibited the mitogen-activated protein kinase (MAPK) pathway activation and promoted lipogenesis, suggesting that NENF is a potential negative regulator of early adipogenesis.25 The above studies suggested that Roxadustat can suppress fat accumulation by upregulation of NENF expression. Moreover, Roxadustat may activate lipolysis by increasing IGFBP5 levels, which was validated with decreasing lipid levels in a previous study.26 Our metabolomics analysis also demonstrated the lipid-lowering effect of FG-4572. Metabolomics-based investigations revealed that Roxadustat changed the levels of urine metabolites related to fat metabolism, such as quercetin and L-leucine. A previous study showed that quercetin transiently increased energy expenditure in mice,27 and L-leucine was closely connected with energy balance.28,29 Consistent with the literature, we found that “cholesterol metabolism (hsa04979)” and “glycerophospholipid metabolism (hsa00564)” were enriched during the integrated proteomics and metabolomics analysis. Taken together, our observations suggest that Roxadustat may regulate blood lipid levels by controlling the lipid metabolic pathways in renal anemia patients.4.2 Renoprotective effect of Roxadustat
It is well-established that the inflammatory response is one of the key factors leading to kidney injury. In the present study, we found that after Roxadustat therapy, the significantly altered pathways in urine were those closely associated with inflammation and oxidative stress. For instance, we found a significant decrease in succinic acid, an important intermediate of alanine, proline, and arginine metabolism and the TCA cycle involved in ROS generation in the mitochondria. Ample evidence suggests that treatment with sodium succinate could significantly decrease ROS levels and improve renal function.30,31 Moreover, current evidence suggests that succinate acts as a metabolite in innate immune signalling to enhance inflammatory factors such as interleukin-1B via HIF-1α.32 Therefore, it is highly conceivable that Roxadustat exerts its protective effects on chronic kidney disease by reducing succinic acid levels. Furthermore, based on previous studies and our metabolic screening, we speculate succinic may serve as a potential metabolite marker for excessive oxidative stress and inflammation-induced kidney damage.Moreover, we found that arginine and proline metabolism networks were markedly altered. It has been shown that arginine is directly related to the production of nitric oxide in the body and participates in the regulation of end-stage renal degeneration.30 Growing literature suggests that arginine is the only substrate for NO synthase with multiple functions in physiology,33–35 including increasing the in vivo NO content, causing intrarenal vasodilation, improving hypoxia, increasing ATP supply, and improving renal tubular function. Similarly, we found that tryptophan and its derived metabolites increased after Roxadustat administration. Current evidence suggests that tryptophan levels are related to a rapid decline in eGFR,36 suggesting that restoration of tryptophan metabolism may play an important role in Roxadustat's effects, and this hypothesis was confirmed and validated by our integrated proteomics and metabolomics analysis.
4.2 The antihypertensive effect of Roxadustat
Our integrated proteomics and metabolomics analysis found that the Ras signalling pathway (hsa04014) was significantly enriched after Roxadustat administration, consistent with the literature.9 It is well-established that RAS signalling controls blood pressure (BP), body fluid balance, and tissue homeostasis.37 Accordingly, dysregulation of RAS leads to BP elevation and plays a causative role in developing chronic kidney and cardiovascular disease.38 Based on the above-mentioned theory, our study further corroborated that Roxadustat has huge prospects as a therapeutic target for hypertension associated with high RAS activity. Meanwhile, our study identified several proteins related to regulating blood vessel diameter after Roxadustat treatment, including CHGA, KLK1, and AGT, further suggesting that Roxadustat could directly control blood pressure levels by regulating the blood vessel diameter.However, there were still some limitations in our study. First, the limited number of renal anemia patients, gender disbalance, and differences in the age range are the main factors that limit the generalizability of our findings. Moreover, the follow-up duration was limited and may affect the broad evaluation of the therapy outcomes. Therefore, more samples with long-term follow-up of Roxadustat treatment in CKD are needed. Besides, our findings are only preliminary; the universality and complexity of the HIF-1α pathway remain a huge challenge for investigators, warranting further research.
5 Conclusions
This is the first study of integrated proteomic and metabolomic analysis in the urine of patients with chronic kidney disease. We provide compelling evidence that Roxadustat plays a role in regulating blood lipid and blood pressure and protecting renal function by mediating protein expression and influencing metabolism.List of abbreviations
| HIF-PHI | Hypoxia-inducible factor prolyl hydroxylase inhibitor; |
| PHD | Prolyl hydroxylase domain |
| HIF | Hypoxia-inducible factors |
| EPO | Erythropoietin |
| RCTs | Randomized controlled trials |
| AKI | Acute kidney injury |
| TECs | Tubular epithelial cells |
| CKD | Chronic kidney disease |
| VSMCs | Vascular smooth muscle cells |
| MAP | Mean arterial pressure |
| Ang II | Angiotensin II |
| AGTR1 | Angiotensin receptor type 1 |
| PRM | Parallel reaction monitoring |
| TEAB | Triethylammonium bicarbonate |
| TFA | Trifluoroacetic acid |
| DDA | Data-dependent scan |
| AGC | The automatic gain control |
| GO | Gene ontology |
| KEGG | Kyoto Encyclopedia of Genes and Genomes |
| DIA | Data-independent acquisition |
| AGC | Automatic gain control |
| PCA | Principal component analysis |
| PLS-DA | Partial least-square discriminant analysis |
| OPLS-DA | Orthogonal partial least-square discriminant analysis |
| VIP | Variable importance on projection |
| FC | Fold change |
| SEM | Standard error of the mean |
| ACEI | Angiotensin-converting enzyme inhibitor |
| ARB | Angiotensin receptor blocker |
| DEPs | Differentially expressed proteins |
| TIC | Total ion chromatograms |
| QC | Quality control |
| BPC | Base peak chromatogram |
| MAPK | Mitogen-activated protein kinase. |
Author contributions
Data curation: XY, RZ and LL; formal analysis: XY and HM; methodology: BG and LL; software: XY and BG; supervision: XZ; visualization: ZW; writing – original draft: XY and BG; writing – review & editing: XZ.Data availability
The mass spectrometry proteomics data have been deposited to the PRIDE Archive (https://www.ebi.ac.uk/pride/archive/) via the PRIDE partner repository with the data set identifier PXD037002 (Project Webpage: https://www.ebi.ac.uk/pride/archive/projects/PXD037002, FTP Download: https://ftp.pride.ebi.ac.uk/pride/data/archive/2023/03/PXD037002). Metabolomics data have been deposited to the EMBL-EBI MetaboLights database (https://doi.org/10.1093/nar/gkz1019, PMID:31691833) with the identifier MTBLS7359.Conflicts of interest
There are no conflicts to declare.Acknowledgements
This work was supported by the Shenzhen Fund for Guangdong Provincial High-level Clinical Key Specialties (NO. SZGSP001), the Shenzhen Governmental Sustainable Development Fund (KCXFZ20201221173612034), and the Shenzhen Key Laboratory of Kidney Diseases (ZDSYS201504301616234).Notes and references
- S. Dhillon, Drugs, 2019, 79, 563–572 CrossRef CAS PubMed.
- Z. Yan and G. Xu, Front. Med., 2020, 7, 393 CrossRef PubMed.
- Q. Zheng, H. Yang, X. Fu, Y. Huang, R. Wei, Y. Wang, Y. N. Liu and W. J. Liu, Nephrol., Dial., Transplant., 2021, 36, 1603–1615 CrossRef CAS PubMed.
- H. S. Ban, Y. Uto and H. Nakamura, Expert Opin. Ther. Pat., 2021, 31, 387–397 CrossRef CAS PubMed.
- K. Su, Z. Li, Y. Yu and X. Zhang, Drug Discovery Today, 2020, 25, 1262–1269 CrossRef CAS PubMed.
- X. Zhang, Y. Zhang, P. Wang, S. Y. Zhang, Y. Dong, G. Zeng, Y. Yan, L. Sun, Q. Wu, H. Liu, B. Liu, W. Kong, X. Wang and C. Jiang, Cell Metab., 2019, 30(937–951), e935 Search PubMed.
- W. Li, A. Duan, Y. Xing, L. Xu and J. Yang, Front. Cell Dev. Biol., 2021, 9, 690079 CrossRef PubMed.
- A. F. Miao, J. X. Liang, L. Yao, J. L. Han and L. J. Zhou, Renal Failure, 2021, 43, 803–810 CrossRef CAS PubMed.
- J. Yu, S. Wang, W. Shi, W. Zhou, Y. Niu, S. Huang, Y. Zhang, A. Zhang and Z. Jia, JCI Insight, 2021, 6(18), e133690 CrossRef PubMed.
- N. Chen, C. Hao, X. Peng, H. Lin, A. Yin, L. Hao, Y. Tao, X. Liang, Z. Liu, C. Xing, J. Chen, L. Luo, L. Zuo, Y. Liao, B. C. Liu, R. Leong, C. Wang, C. Liu, T. Neff, L. Szczech and K. P. Yu, N. Engl. J. Med., 2019, 381, 1001–1010 CrossRef CAS PubMed.
- A. D. Nguyen, J. G. McDonald, R. K. Bruick and R. A. DeBose-Boyd, J. Biol. Chem., 2007, 282, 27436–27446 CrossRef CAS PubMed.
- Y. Yang, X. Yu, Y. Zhang, G. Ding, C. Zhu, S. Huang, Z. Jia and A. Zhang, Clin. Sci., 2018, 132, 825–838 CrossRef CAS PubMed.
- Q. Lin, S. Li, N. Jiang, H. Jin, X. Shao, X. Zhu, J. Wu, M. Zhang, Z. Zhang, J. Shen, W. Zhou, L. Gu, R. Lu and Z. Ni, Autophagy, 2020, 1–16, DOI:10.1080/15548627.2020.1848971.
- M. Zhang, R. Dong, J. Yuan, J. Da, Y. Zha and Y. Long, Clin. Exp. Pharmacol. Physiol., 2022, 49, 311–318 CrossRef CAS PubMed.
- M. Wu, W. Chen, M. Miao, Q. Jin, S. Zhang, M. Bai, J. Fan, Y. Zhang, A. Zhang, Z. Jia and S. Huang, Clin. Sci., 2021, 135, 1707–1726 CrossRef CAS PubMed.
- Y. Huang, A. Di Lorenzo, W. Jiang, A. Cantalupo, W. C. Sessa and F. J. Giordano, Hypertension, 2013, 62, 634–640 CrossRef CAS PubMed.
- D. P. Gale, S. K. Harten, C. D. Reid, E. G. Tuddenham and P. H. Maxwell, Blood, 2008, 112, 919–921 CrossRef CAS PubMed.
- M. M. Hickey, T. Richardson, T. Wang, M. Mosqueira, E. Arguiri, H. Yu, Q. C. Yu, C. C. Solomides, E. E. Morrisey, T. S. Khurana, M. Christofidou-Solomidou and M. C. Simon, J. Clin. Invest., 2010, 120, 827–839 CrossRef CAS PubMed.
- R. F. Dubin and E. P. Rhee, Clin. J. Am. Soc. Nephrol., 2020, 15, 404–411 CrossRef CAS PubMed.
- J. Barratt and P. Topham, Can. Med. Assoc. J., 2007, 177, 361–368 CrossRef PubMed.
- M. Cañadas-Garre, K. Anderson, J. McGoldrick, A. P. Maxwell and A. J. McKnight, J. Proteomics, 2019, 193, 93–122 CrossRef PubMed.
- V. Thongboonkerd, Proteomics Clin Appl, 2007, 1, 780–791 CrossRef CAS PubMed.
- E. Zelena, W. B. Dunn, D. Broadhurst, S. Francis-McIntyre, K. M. Carroll, P. Begley, S. O'Hagan, J. D. Knowles, A. Halsall, I. D. Wilson and D. B. Kell, Anal. Chem., 2009, 81, 1357–1364 CrossRef CAS PubMed.
- E. J. Want, P. Masson, F. Michopoulos, I. D. Wilson, G. Theodoridis, R. S. Plumb, J. Shockcor, N. Loftus, E. Holmes and J. K. Nicholson, Nat. Protoc., 2013, 8, 17–32 CrossRef CAS PubMed.
- I. Kimura, M. Konishi, T. Asaki, N. Furukawa, K. Ukai, M. Mori, A. Hirasawa, G. Tsujimoto, M. Ohta, N. Itoh and M. Fujimoto, Biochem. Biophys. Res. Commun., 2009, 381, 75–80 CrossRef CAS PubMed.
- A. Xiang, G. Chu, Y. Zhu, G. Ma, G. Yang and S. Sun, J. Cell Physiol., 2019, 234(9), 15288–15298 CrossRef CAS PubMed.
- L. K. Stewart, J. L. Soileau, D. Ribnicky, Z. Q. Wang, I. Raskin, A. Poulev, M. Majewski, W. T. Cefalu and T. W. Gettys, Metab., Clin. Exp., 2008, 57, S39–46 CrossRef CAS PubMed.
- T. T. Zampieri, F. L. Torres-Leal, A. B. Campaña, F. B. Lima and J. Donato, Nutrients, 2014, 6, 1364–1373 CrossRef CAS PubMed.
- Y. Zeng, T. Huang, N. Wang, Y. Xu, C. Sun, M. Huang, C. Chen, B. G. Oliver, C. Yi and H. Chen, Front. Physiol., 2021, 12, 700246 CrossRef PubMed.
- S. P. Chapela, I. Burgos, C. Congost, R. Canzonieri, A. Muryan, M. Alonso and C. A. Stella, Oxid. Med. Cell. Longevity, 2018, 2018, 1928945 Search PubMed.
- T. N. Andrienko, P. Pasdois, G. C. Pereira, M. J. Ovens and A. P. Halestrap, J. Mol. Cell. Cardiol., 2017, 110, 1–14 CrossRef CAS PubMed.
- G. M. Tannahill, A. M. Curtis, J. Adamik, E. M. Palsson-McDermott, A. F. McGettrick, G. Goel, C. Frezza, N. J. Bernard, B. Kelly, N. H. Foley, L. Zheng, A. Gardet, Z. Tong, S. S. Jany, S. C. Corr, M. Haneklaus, B. E. Caffrey, K. Pierce, S. Walmsley, F. C. Beasley, E. Cummins, V. Nizet, M. Whyte, C. T. Taylor, H. Lin, S. L. Masters, E. Gottlieb, V. P. Kelly, C. Clish, P. E. Auron, R. J. Xavier and L. A. O'Neill, Nature, 2013, 496, 238–242 CrossRef CAS PubMed.
- A. Popolo, S. Adesso, A. Pinto, G. Autore and S. Marzocco, Amino Acids, 2014, 46, 2271–2286 CrossRef CAS PubMed.
- B. Toczylowska, E. Zieminska, P. Senator and J. W. Lazarewicz, Mol. Neurobiol., 2020, 57, 3089–3105 CrossRef CAS PubMed.
- L. Gonzalez-Calero, M. Martin-Lorenzo, P. J. Martínez, M. Baldan-Martin, G. Ruiz-Hurtado, J. Segura, F. de la Cuesta, M. G. Barderas, L. M. Ruilope, F. Vivanco and G. Alvarez-Llamas, Transl. Res., 2016, 178, 25–37.e27 CrossRef CAS PubMed.
- C. A. Chou, C. N. Lin, D. T. Chiu, I. W. Chen and S. T. Chen, J. Diabetes Invest., 2018, 9, 366–374 CrossRef CAS PubMed.
- S. D. Crowley and T. M. Coffman, Exp. Cell Res., 2012, 318, 1049–1056 CrossRef CAS PubMed.
- S. B. Gurley, A. D. M. Riquier-Brison, J. Schnermann, M. A. Sparks, A. M. Allen, V. H. Haase, J. N. Snouwaert, T. H. Le, A. A. McDonough, B. H. Koller and T. M. Coffman, Cell Metab., 2011, 13, 469–475 CrossRef CAS PubMed.
Footnotes |
| † Electronic supplementary information (ESI) available: Supplementary file 1: List of total proteins in urine between CKD patients before and after Roxadustat treatment. Supplementary file 2: Table comparing the DEPs verified by PRM assay and label-free quantitative proteomics analysis. Supplementary file 3: List of total metabolites in urine between CKD patients before and after Roxadustat treatment. Supplementary file 4: The correlation between differential protein expression and metabolite levels was visualized in a heatmap. The horizontal axis is the clustering of differential proteins, and the vertical axis is the clustering of differential metabolites. Supplementary file 5: Co-expression network of differential proteins and metabolites. The blue circle is the metabolite, and the red circle is the protein. The green line indicates that there is a negative regulatory relationship, and the orange line indicates that there is a positive regulatory relationship between protein and metabolite. The size of the circle indicates the degree of the protein or metabolite in the network (the regulatory efficiency was represented by the size of the nodes). See DOI: https://doi.org/10.1039/d3mo00015j |
| ‡ Xiaoe You and Baochun Guo contributed equally to this work and share the first authorship. |
| This journal is © The Royal Society of Chemistry 2023 |