
 Open Access Article
 This Open Access Article is licensed under a
 Creative Commons Attribution 3.0 Unported Licence
Dynamic light scattering and transmission electron microscopy in drug delivery: a roadmap for correct characterization of nanoparticles and interpretation of results
Sergey K.
Filippov
 *ab,
Ramil
Khusnutdinov
c,
Anastasiia
Murmiliuk
d,
Wali
Inam
b,
Lucia Ya.
Zakharova
e,
Hongbo
Zhang
bf and
Vitaliy V.
Khutoryanskiy
a
*ab,
Ramil
Khusnutdinov
c,
Anastasiia
Murmiliuk
d,
Wali
Inam
b,
Lucia Ya.
Zakharova
e,
Hongbo
Zhang
bf and
Vitaliy V.
Khutoryanskiy
a
aSchool of Pharmacy, University of Reading, Whiteknights, RG6 6DX Reading, UK. E-mail: sfill225@gmail.com
bPharmaceutical Sciences Laboratory, Faculty of Science and Engineering, Åbo Akademi University, 20520 Turku, Finland
cInstitute of Pharmacy, Kazan State Medical University, 16 Fatykh Amirkhan, 420126 Kazan, Russian Federation
dDepartment of Physical and Macromolecular Chemistry, Faculty of Science, Charles University, Hlavova 8, 128 00 Prague 2, Czech Republic
eArbuzov Institute of Organic and Physical Chemistry, FRC Kazan Scientific Center of RAS, 8 Arbuzov Str., 420088 Kazan, Russian Federation
fTurku Bioscience Centre, University of Turku and Åbo Akademi University, 20520 Turku, Finland
First published on 26th September 2023
Abstract
In this focus article, we provide a scrutinizing analysis of transmission electron microscopy (TEM) and dynamic light scattering (DLS) as the two common methods to study the sizes of nanoparticles with focus on the application in pharmaceutics and drug delivery. Control over the size and shape of nanoparticles is one of the key factors for many biomedical systems. Particle size will substantially affect their permeation through biological membranes. For example, an enhanced permeation and retention effect requires a very narrow range of sizes of nanoparticles (50–200 nm) and even a minor deviation from these values will substantially affect the delivery of drug nanocarriers to the tumour. However, amazingly a great number of research papers in pharmaceutics and drug delivery report a striking difference in nanoparticle size measured by the two most popular experimental techniques (TEM and DLS). In some cases, this difference was reported to be 200–300%, raising the question of which size measurement result is more trustworthy. In this focus article, we primarily focus on the physical aspects that are responsible for the routinely observed mismatch between TEM and DLS results. Some of these factors such as concentration and angle dependencies are commonly underestimated and misinterpreted. We convincingly show that correctly used experimental procedures and a thorough analysis of results generated using both methods can eliminate the DLS and TEM data mismatch completely or will make the results much closer to each other. Also, we provide a clear roadmap for drug delivery and pharmaceutical researchers to conduct reliable DLS measurements.
 Sergey K. Filippov | Sergey K. Filippov received a BS, MSc with honors and PhD in polymer physics from the University of Saint-Petersburg, Russia. His PhD thesis was devoted to polymeric liquid crystals. During his PhD studies he spent one year at Oxford University in the group of Prof. Steve Elston. Between 1999 and 2001, he was employed as a postdoctoral researcher at Puerto Rico University, where he used dynamic light scattering and broadband dielectric spectroscopy to study polymers and confined liquid crystals. In 2002 he re-joined the Saint-Petersburg State University as an assistant professor. His major field of expertise was dynamic light scattering in polymer solutions. In 2007, he joined the Institute of Macromolecular Chemistry in Prague, Czech Republic, as a research scientist in the Department of Supramolecular Polymer Systems. In 2014, he became a senior research scientist in the same department. He was a Fulbright professor (Harvard University, 2018–2019), and now he is a Leverhulme professor at Reading University, UK. Prof. Filippov's main research interests are dynamic light scattering, small-angle X-ray and neutron scattering, and isothermal titration calorimetry in application to self-assembling systems in soft matter. |
 Ramil Khusnutdinov | Ramil Khusnutdinov received his degree in pharmacy, equivalent to a Doctor of Pharmacy, from Kazan State Medical University in 2015. His research interests focus on cancer biology, especially drug resistance and carcinogenesis, and polymer-based drug delivery systems. |
 Anastasiia Murmiliuk | Anastasiia Murmiliuk received her MSc in Chemistry with honors in 2016 from Saint Petersburg State University and PhD in Physical Chemistry in 2021 from Charles University in Prague, Czech Republic. Focusing on drug delivery applications, her primary research interests revolve around polymer assembly with proteins and peptides, interaction with lipid membranes, drug encapsulation and controlled release. She possesses expertise in dynamic light scattering, small-angle neutron and X-ray scattering, transmission electron microscopy, and atomic force microscopy, all applied to the characterization of polymers and proteins. |
 Wali Inam | Wali Inam is carrying out his PhD under the supervision of Professor Hongbo Zhang and Jessica Rosenholm at Pharmaceutical Sciences Laboratory, Åbo Akademi University. He has a keen interest in microfluidics assisted nanoprecipitation, particle encapsulation, electrokinetic properties of polymeric particles and dynamics light scattering. |
 Lucia Ya. Zakharova | Lucia Zakharova received her graduate degree from Kazan State Technological Institute in 1976, Candidate of science degree in 1990 and Doctor of science degree in 2005. Since 1976 she has been working at the A. E. Arbuzov Institute of Organic & Physical Chemistry, as a laboratory assistant (1976), junior researcher (1986), researcher (1994), senior researcher (1997), and head of laboratory (from 2008 to the present day). Concurrently she holds a position in Kazan National Research Technological University, department of Organic Chemistry as an associate professor (2002) and Professor (from 2007 to the present day). Lucia Zakharova received several awards including the State science and technology award of Republic of Tatarstan (2017); she was granted the title of honored worker of science of Republic of Tatarstan (2010). Professor Zakharova's current research interests focus on (i) self-organization of amphiphilic compounds and their complexes with polymers and macrocycles; (ii) design of nanocontainers for drug and gene delivery; (iii) development of supramolecular catalytic systems. |
 Hongbo Zhang | Hongbo Zhang received his bachelor's degree in biology from Fudan University and PhD degree in Pharmacy from University of Helsinki (2012) and did his Postdoc in Harvard University. In 2016, he was appointed as Tenure Track Assistant Professor in Åbo Akademi University, and he became Full Professor (Tenure) in 2023. He was an Academy of Finland Postdoc Fellow between 2016 and 2019 and Research Fellow between 2019–2024. He is also a docent in Pharmaceutical Technology in University of Helsinki. His research focus is functional materials in biomedical applications and their potential for the clinical translation. |
 Vitaliy V. Khutoryanskiy | Prof Vitaliy Khutoryanskiy has been a Professor of Formulation Science since 2014, having previously been Associate Professor in Pharmaceutical Materials (2010–2014) and Lecturer in Pharmaceutics (2005–2010) at Reading School of Pharmacy, University of Reading (UK). He has also been a Royal Society Industry Fellow since March 2023. He has researched broadly in the area of new biomaterials for pharmaceutical and biomedical applications, with a particular emphasis on drug delivery, mucoadhesive materials, hydrogels, nanomaterials and stimuli-responsive polymers. He was the recipient of the 2012 McBain Medal from the Society of Chemical Industry (SCI) and Royal Society of Chemistry (RSC) for his imaginative use of colloid, polymer and interface science in the development of novel biomedical materials; he also received the PhD Supervisor of the Year Postgrad Award (2020) from FindAPhD and Innovative Science Award from the Academy of Pharmaceutical Sciences (2022). Prof Khutoryanskiy has published over 200 original research articles, reviews, and book chapters. |
Introduction
Modern pharmaceutics has very strict regulatory requirements for thorough characterization of formulations used for drug delivery. Nanomedicine is a rapidly growing area of pharmaceutical research, which is focused on the use of nanoparticles for drug delivery and diagnostics. Nanoparticles are increasingly being included in pharmaceutical formulations as they provide many beneficial effects such as improved drug bioavailability, possibility of targeting particular organs in the body, reduced side effects, and prolonged pharmacological effects. Information about the nanoparticle size and shape is very important since these two parameters directly affect the functionality of nanocarriers and their fate in the body.1,2 For example, the size of nanocarriers in the range of 50–200 nm is an advantage for passive drug delivery in cancer therapy.1,3,4 Recent studies give evidence that nanoparticles with cylindrical morphology have enhanced tumor accumulation5,6 and improved circulation time in the blood stream in comparison with spherical nanoparticles.7,8Dynamic light scattering (DLS) and transmission electron microscopy (TEM) are the two experimental techniques most commonly used to study nanoparticle size and shape. Recent technological advancements resulted in the availability of affordable DLS and TEM instruments leading to a significant breakthrough in the development of numerous nano-formulations. However, if TEM instruments are usually exploited by trained operators, DLS equipment is routinely used worldwide by researchers, who are commonly unfamiliar with the science behind these measurements. This is particularly true for pharmaceutical and drug delivery science. In addition, some of the DLS instruments from Malvern Panalytical Ltd or Anton Paar manufacturers resemble an easy-to-deal “one-button” box, giving a false impression about the simplicity of the data analysis resulting from these measurements. Nowadays, scientists often tend to take DLS data as is, without critical analysis and understanding the principles of this complex physicochemical technique. Unsurprisingly, due to this lack of understanding, many authors do not even publish DLS raw data such as correlation functions when reporting their findings. Many papers report hydrodynamic diameters or radius values only, without inclusion of polydispersity indices (PDI) and distribution functions. As a result, there are a significant number of papers on pharmaceutics, biochemistry, food and nutritional science, and drug delivery where some substantial discrepancies between DLS and TEM data are reported.
Fig. 1 presents the analysis of the discrepancy between the nanoparticle sizes reported by different authors using TEM and DLS measurements, when investigating various pharmaceutical carriers.
 | ||
| Fig. 1 Correlation between particle sizes determined using DLS and TEM for pharmaceutical nanoparticles reported in the literature. Every point on the figure represents a particular pharmaceutical system reported in the literature where DLS and TEM sizes are provided. The bisector shows the perfect case when two sizes match each other. Three areas of mismatch are highlighted that could result from some physical factors discussed in the paper. The yellow area represents mostly the case when the intensity-weighted numbers were taken into consideration for moderately and highly polydisperse nanoparticles. The magenta area represents mostly the cases where the influence of shape, angle-dependence, and charge factors is significant, whereas the light-green area shows the zone where contrast factors might be important. Concentration dependence, radiation damage, and bad quality DLS experiments could contribute to the data discrepancy in any of these areas. | ||
The discrepancy could be in the range from a few nanometers up to several hundred nanometers (Fig. 1). In the vast majority of these publications the observed discrepancy was either not discussed at all or was attributed to the existence of a nanoparticle hydration shell in solution.9–16 However, in our opinion, for most of the cases, these discrepancies come from either poor-quality experiments or misunderstanding of the physical phenomena that lie behind DLS or TEM experiments.
Below we have highlighted several possible physical aspects that have to be taken into consideration when dealing with DLS and TEM data analysis: (1) poor quality DLS experiment and misinterpretation of the reported results; (2) shape factor; (3) angle dependence factor; (4) concentration factor; (5) charge factor (polyelectrolytes and a double layer); (6) contrast factor; (7) particle aggregation; (8) size-weighting factor (number vs intensity weighted) and small peak suppression; and (9) radiation damage in TEM experiments.
We are not going to provide a comprehensive theory of DLS or TEM since it is out of the scope of this focus article. For those who are interested in learning the fundamentals of DLS or TEM, we recommend reading the comprehensive books of Berne & Pecora17 or Williams & Carter.18
As mentioned above, the main problem that faces researchers dealing with dynamic light scattering experiments is the lack of understanding of the fundamental principles of this method. They often assume that the size of nanoparticles, such as hydrodynamic diameter (Dh) or radius (Rh), is directly measured in DLS experiments. In reality, it is calculated from the value of the translational diffusion coefficient and such calculations are based on several assumptions that are not always valid for a particular pharmaceutical system. Moreover, extraction of the translational diffusion coefficient value from a correlation function could be very challenging and not always achievable in a single DLS experiment. Thus, it is a multi-step process in which a scientist should verify first the validity of the translational diffusion coefficient and hydrodynamic diameter value calculations prior to drawing any conclusions on the size of nanoparticles. However, the first step, without any doubt, should be the collection of a reliable correlation function. It is a correlation function that is directly recorded in a DLS experiment, and not a translational diffusion coefficient or a hydrodynamic diameter. Anyone aiming to obtain reliable DLS data should concentrate primarily on the quality of a correlation function. Below we will provide convincing arguments on the importance of the accumulation of a correlation function of good quality.
Bad quality DLS experiment and misinterpretation of the reported results
The major issue which should always be remembered is that any large particles, dust or large inhomogeneities that were not removed by filtration, will aggravate a count rate and thus amend a correlation function by showing an additional decay (Fig. 2, left). This artificial decay will also manifest on a hydrodynamic size distribution function as an additional peak that could be misinterpreted as the presence of nanoparticles with different size (Fig. 2C, left). The presence of large-micron size particles sometimes leads to continuous sedimentation that is visible as oscillations on the correlation function (Fig. 2, right). This is the worst scenario since the distribution function calculation does not make any sense in this case and provides unreasonable data. In general, any sub-nano or above-micron size results that come from a DLS report should not be trusted even though some commercial DLS instruments claim an applicability size range of 0.3 nm–10 μm. Extreme sub-nano or above-micron size DLS experiments require extra efforts for sample preparation such as thorough sample filtration, high concentration for sub-nano size samples, and appropriate solvent selection for micron size particles together with verification by complementary sizing techniques. Extra care should be taken for turbid samples; we strongly recommend dilution or sample filtration in this case. Filtering samples from large dust particles critically affects the correlation function and improves the agreement between DLS and TEM results.19,20 Currently, there are several types of commercially available filters (PTFE, PVDF, PES, Nylon) that can be used to remove dust from solutions. Before filtering the solution, it is important to make sure that the filter does not interact with the solvent. Otherwise, unwanted consequences are possible in the form of dissolution of the filter material or its swelling. | ||
| Fig. 2 Example of poor-quality measurements: typical count rate (A), correlation function (B), and Dh distribution function (C) for samples containing dust or large aggregates (left); and for even the worst case of system sedimentation (right). | ||
The solute can also interact with the filter material. This is especially important if a protein solution is to be filtered. We strongly recommend that you select filters with the label “low protein binding”. This guarantees against unwanted sample loss during filtration. If you want to make sure that there is no loss of sample during filtration, it makes sense to use a good refractometer, if available, and measure the refractive index of the solution before and after filtration. Modern refractometers allow measurements of the refractive index up to the fifth decimal place. In the case of measuring a protein solution, we recommend recording their UV-vis spectra and calculating the protein concentration before and after filtration.
It must be remembered that any filter has an internal volume. The larger the filter diameter, the larger this volume. Therefore, with a small volume of solution, it is recommended to use filters of a smaller diameter. The internal volume can be from 5 to 100 μL.
The existence of an internal volume is also important if the same filter is used multiple times. This is not supposed to be done; one filter should ideally be used for filtering ONLY once, but filters are expensive, and not every laboratory can afford to buy filters in large quantities. Therefore, when filtering a series of concentrations, it must be remembered that a small amount of the previous solution remains inside the filter. When filtering a series of solutions from dilute to more concentrated, there will be a slight dilution of the solution. When filtering from more concentrated to more dilute, the opposite will occur – an increase in the concentration of the solution. If you do not know which filter to use for solution filtration, it is recommended to cross-check with a filter compatibility chart available from a filter manufacturer's website. It is also advised to discard the first couple of drops if a filter is not sterile. However, filtration itself might cause the formation of micro- and nanobubbles in the solution, which should also be taken into account.21 Because of their small size, such bubbles are stable in solution and often cannot be removed by sample equilibration only, and additional approaches are required such as centrifugation, heating or ultrasonication.
Speaking more broadly, DLS is very sensitive to any motion in a sample, not just to Brownian motion of nanoparticles. Any fluctuations of polarizability α that show how a material reacts to an applied external electrical field give a decay in a correlation function.17,22 There are a number of different dynamic processes that can be “seen” by DLS; these include rotational diffusion of rod-like particles, internal motion of long flexible macromolecules, gel mesh size fluctuations, and hydrodynamic modes in a plain solvent (Fig. 3).
 | ||
| Fig. 3 Different types of relaxation processes. (A) Rotational diffusion of rod-like particles along minor semi-axes; (B) internal motion of long flexible macromolecules; (C) gel mesh size fluctuations; (D) hydrodynamic modes in a plain solvent. | ||
One should always keep in mind that most instruments’ software assumes translational diffusion of nanoparticles as the only reason for any decay in correlation function by default. In most cases, this assumption is valid, especially when the studied system is a diluted solution of non-ionic or weakly charged nanoparticles. However, any more or less complex system might present one or several peaks of non-diffusion nature in the distribution function.
Another classical example of a non-diffusional process is liquid crystals. The reorientation of ordered liquid crystalline molecules in time gives rise to fluctuations in polarizability α, and therefore, scattered light intensity fluctuations.23 As a result, DLS experiments will show a decay in a correlation function with a peak in a correlation/relaxation time distribution function.24 The vast majority of DLS software automatically converts the distribution function over correlation times τ to the distribution over translational diffusion coefficient Dt, assuming a diffusion nature (1/τ ∼ Dtq2) of any relaxation process, where q is a scattering vector related to a scattering angle and laser wavelength. The distribution over hydrodynamic sizes using the Stokes–Einstein equation,  , will be calculated as the last step. Thus, a nematic liquid crystal examined by the DLS method will manifest a peak located in the 50–100 nm range even though there are no nanoparticles in the system but just plain bulk material. Of course, it is very unlikely that a pharmaceutical or drug delivery scientist will have the task of investigating bulk liquid crystals, although such cases can be found in the literature.25 Block copolymers do have several relaxation processes that potentially could be seen in a distribution function.26–28 The interchain dynamics27 and compositional heterogeneity29,30 are examples of such relaxation processes. It should be pointed out here that for a single DLS experiment there is no possibility to identify the nature of the process visible in a correlation function. Multi-angle experiments or complementary methods are needed to shed light on the nature of the process.
In view of all of the above, it is clear that it is necessary to include the correlation function in a paper (perhaps in the supplementary information) similarly to the inclusion of TEM micrographs that are commonly presented in many publications. This allows the readers to understand whether the DLS analysis was conducted correctly. However, after analyzing over 500 articles, we determined that the correlation function was included in less than 5% of the publications. Moreover, not all authors present the distribution function, while around 50% of the analyzed articles presented the values of the hydrodynamic radius or diameter only.31–37 In our opinion, this practice is very poor, since DLS does not measure the particle size directly, but calculates it from the correlation function, so the primary data should be presented, at least in the supplementary information. When both the distribution function and the correlation function are presented in the article, one can confidently evaluate the results presented to see whether these correlate well with the microscopy results.38
Misleading DLS results can also be generated from a selection of incorrect instrument parameters. It is important to specify the conditions and parameters of the instrument under which the measurements were performed. Most of the DLS instruments require presetting parameters such as “material”, “refractive index”, “solvent viscosity”, “temperature”, “number of runs”, and “accumulation time”. This information will allow readers to fully evaluate the correct choice of parameters based on the particles/solvent system being analyzed.39 The selection of accumulation time could be done manually or automatically when the software determines the time required to collect a good quality correlation curve. If an experimentalist sets the accumulation time in a manual mode, we suggest that the number of collected counts during the experiment should be close to 1![[thin space (1/6-em)]](https://www.rsc.org/images/entities/char_2009.gif) 000000. Thus, for a hypothetical sample scattering 50000 counts per second, the accumulation time should be 200 seconds. This rule of thumb should be kept in mind when pH or ionic strength is varied for the same sample. Changes in ionization might also cause a significant drop in the scattering intensity making the correlation function very noisy.
000000. Thus, for a hypothetical sample scattering 50000 counts per second, the accumulation time should be 200 seconds. This rule of thumb should be kept in mind when pH or ionic strength is varied for the same sample. Changes in ionization might also cause a significant drop in the scattering intensity making the correlation function very noisy.
The selection of solvent viscosity value is also very critical, especially for cases of mixed solvents. Binary or ternary solvent mixtures are widely used in pharmaceutics to improve the solubility of active pharmaceutical ingredients (API); the viscosity of mixtures such as water-/dimethyl sulfoxide (DMSO), water/DMSO/ethanol is a non-monotonous function of solvent composition. The viscosity of water/DMSO mixtures is the subject of 4-fold changes with increasing water content from 0 to 100%,40 and thus incorrect selection of the solvent viscosity could be the reason for substantial discrepancy between TEM and DLS data.
Fig. 4 shows the general roadmap that must be used for generating reliable DLS data. Solution filtration should be mandatory prior to any DLS measurements. The experimenters should make sure that the filter porosity is higher than the possible nanoparticle size. They should use 0.45 μm or 1.2 μm filters if not sure. Alternatively, for a low amount of sample or if some specific interactions with the filter material are expected, the solvent used for the preparation of samples should be filtered. At the end of each experiment the count rate and the correlation function should be inspected. No spikes, trends, or oscillations should be present on count rate as a function of time (Fig. 2 and 4). Also, the correlation functions should not have any jumps and oscillations. Each sizing experiment should be repeated several times. The correlation functions should be identical between these repeats. The intensity-weighted distribution function should be inspected as the next step. The distributions should also be identical between the repeated experiments. If these are not identical then sizing experiments should be repeated with the increased accumulation time. Following these experiments, the intensity-weighted distribution should be converted to volume and number-weighted distributions. The number-weighted values of Dh should then be compared with TEM data if these are available. Having established a mismatch, the researchers should think critically, and check for possible sources of discrepancy such as concentration, charge, shape, angle dependence, and radiation damage factors (Fig. 4). Potentially, solutions could be diluted, or the charges present could be neutralized by changing pH, making sure that the correct solvent is selected in the measurement settings.
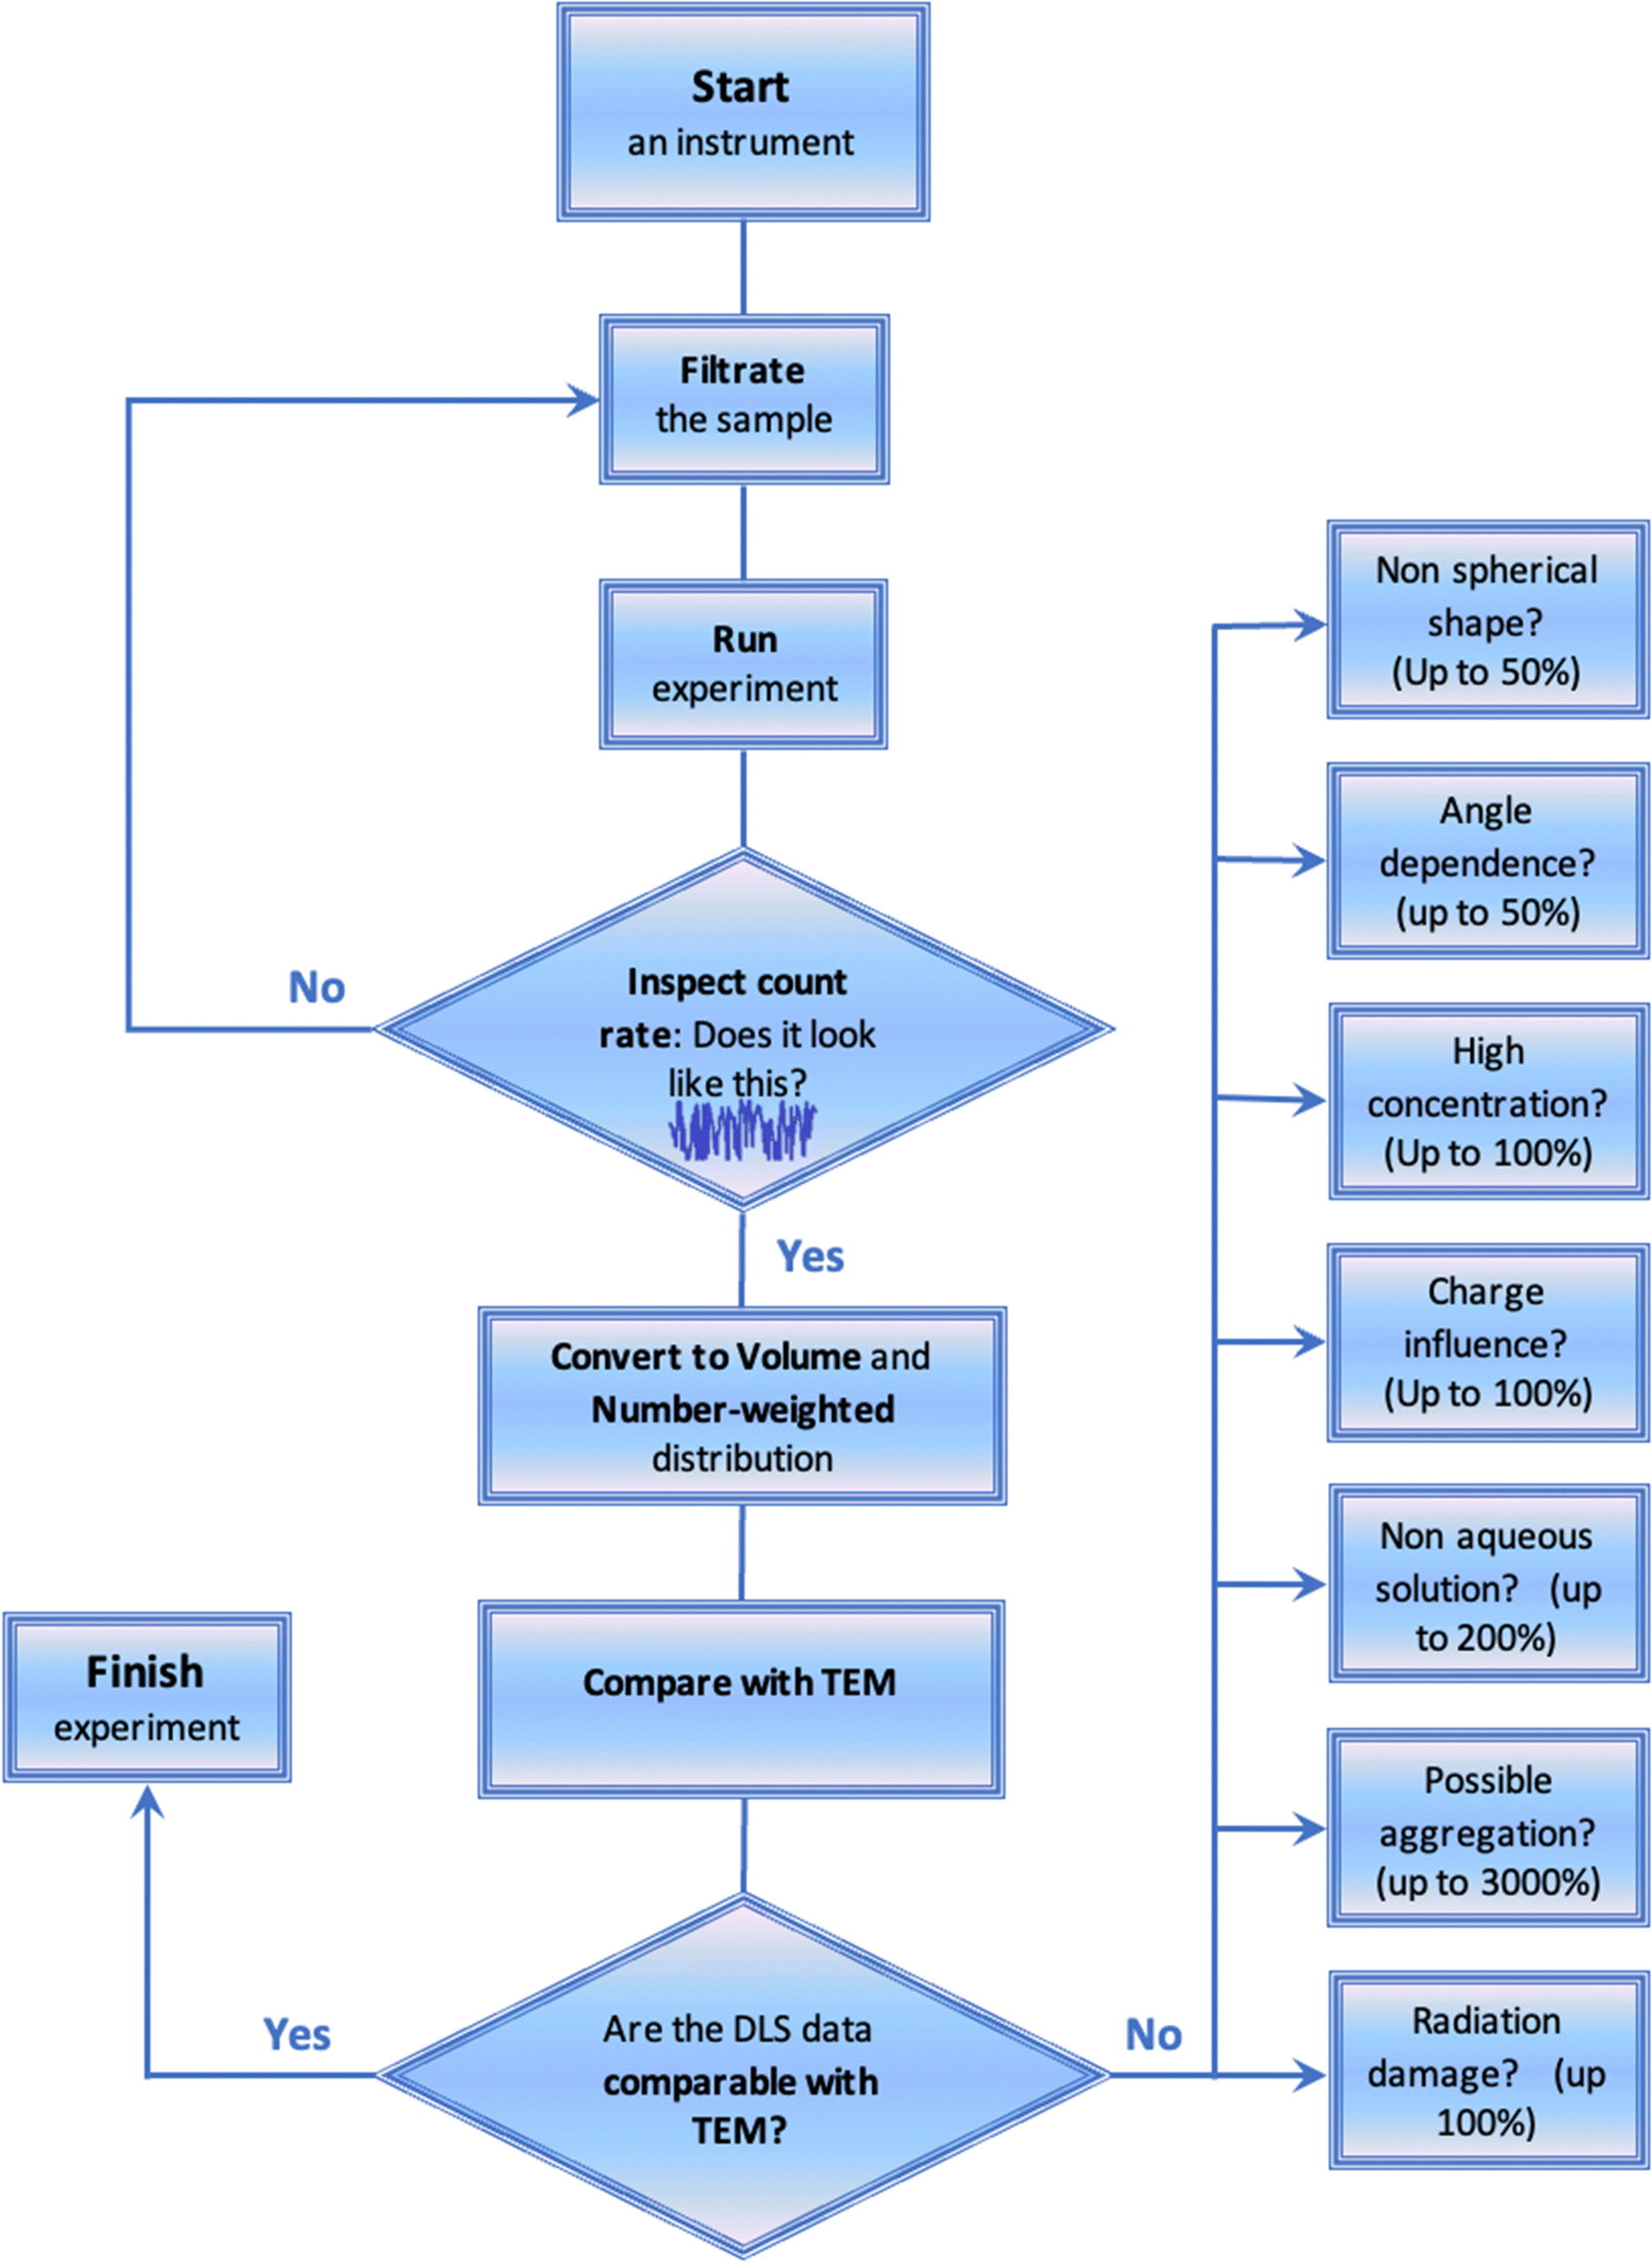 | ||
| Fig. 4 The roadmap for a good quality DLS experiment and data assessment. | ||
Shape factor
The assumption of the nanoparticle's spherical shape is another simplification embedded in DLS software to calculate their size. The Stokes–Einstein equation allows calculation of the diffusion coefficient assuming that particles are rigid and have a spherical shape. For a real drug delivery system, the mismatch between nanoparticle perimeter and the hydrodynamic diameter value could be quite significant (Fig. 5).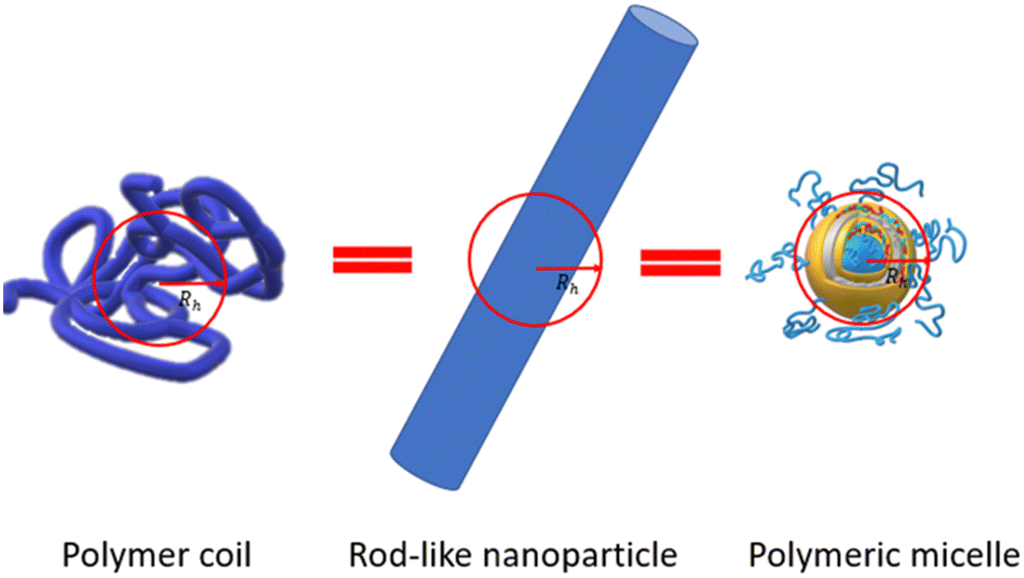 | ||
| Fig. 5 Red circle represents hydrodynamic size as seen by DLS. Three different nano-objects with highly distinctive morphologies such as a polymer coil, rod-like nanoparticle, and a polymeric micelle have the same hydrodynamic size. This cartoon represents the fact that DLS is a “blind” method that provides the value of a diffusion coefficient converted later to hydrodynamic size. The mismatch depends on architecture and draining of the nanoparticles. | ||
Fig. 5 shows an example of how very distinctly different nano-objects such as a polymer coil, rod-like nanoparticles, and polymeric micelles might have the same hydrodynamic diameter Dh if simply measured using DLS.
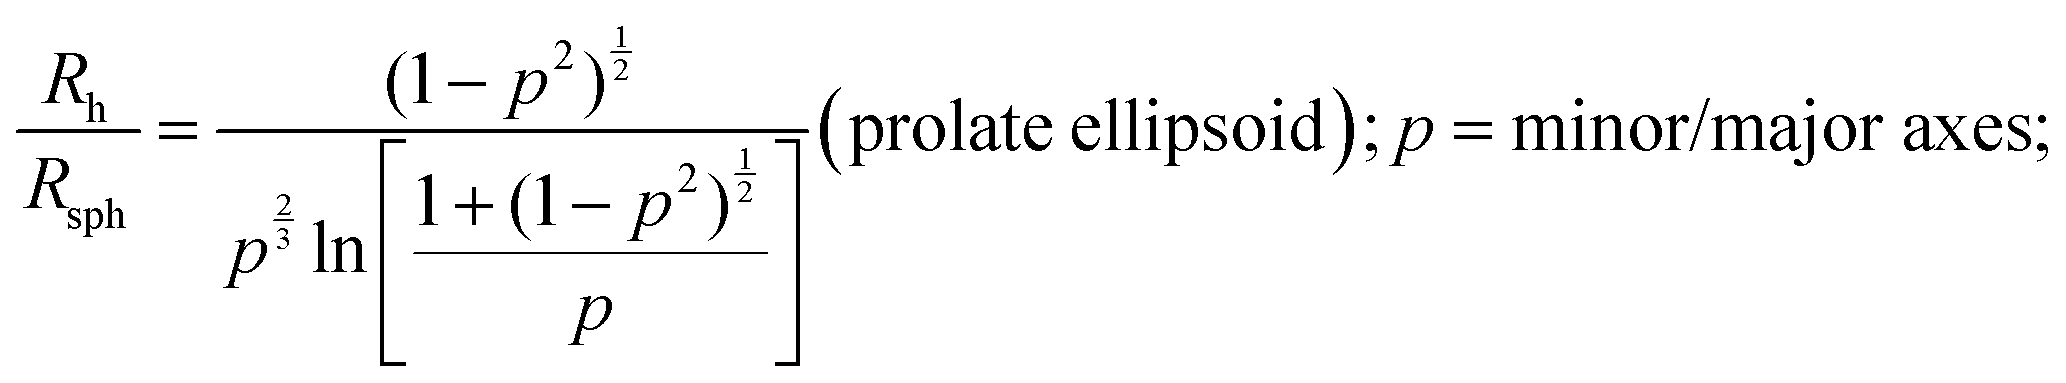
When particles with the shape of a solid sphere are analyzed, the dimensions measured by DLS are the most accurate and the sizing results are very close to the size data generated using microscopy techniques.38,41–48 However, there are many articles reporting the analysis of particles with different shapes, including studies of elongated spheres, cylinders, tubes, etc.49 Unfortunately, the authors often use the same DLS settings and equations to calculate the particle sizes, as in the case of spherical particles. A typical situation is the measurement of long nanotubes with a high asymmetry ratio using DLS. The diffusion of these nanotubes is a combination of translational diffusion along two principal major axes. The averaged translational diffusion coefficient will be a subject of cylinder length (L), their thickness (d) and asymmetry ratio p = L/d (see eqn (1). The deviation of the diffusion coefficient value from the value typical for a hard sphere will obey the p2/3/lnp law. In general, the higher the nanoparticle asymmetry, the greater the mismatch between the nanoparticle's outer sizes and calculated value of hydrodynamic radius we can expect from the DLS measurements. In some cases, the correlation curve always has two decays: a fast one and a slow one, which look like separate peaks in the distribution curve corresponding to the particles of different sizes. The second decay usually corresponds to the rotational diffusion of the tube around a short axis (Fig. 3A).50–52 As we stated above, multi-angle DLS experiments or complementary techniques are needed to attribute a peak to a non-translational diffusion process.
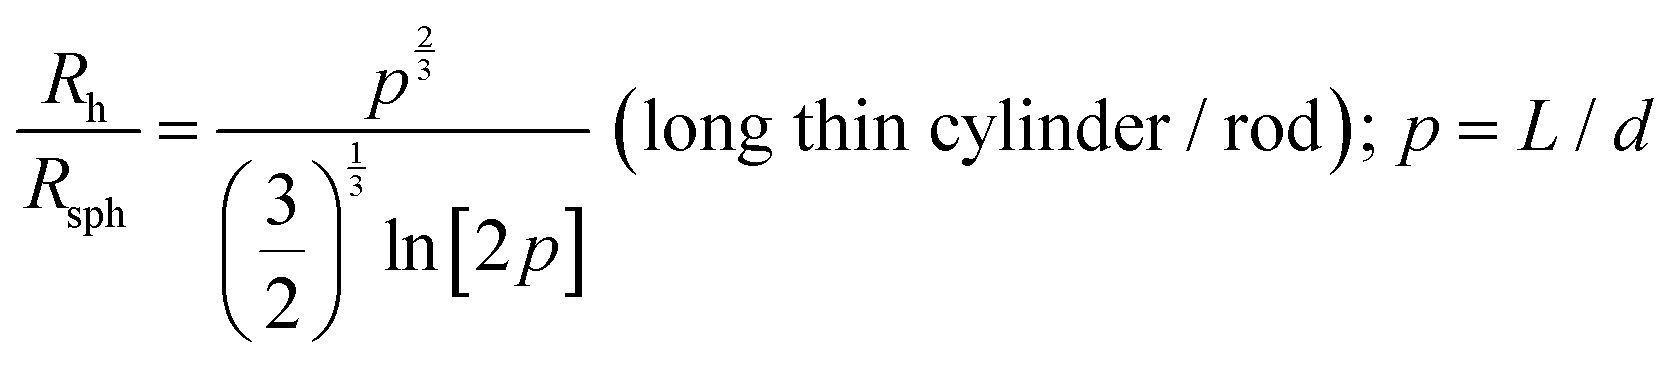 | (1) |
 | (2) |
| Rh = 3R/2[(1 + d2/4R2)1/2 + (2R/d)ln(1 + d2/4R2)1/2]−1 (disk) | (3) |
Angle dependence factor
As mentioned above, commercially available DLS software automatically assumes that any peak on a distribution function is associated with a translational diffusion. There are several dynamic processes that can lead to the appearance of a decay on a correlation function (Fig. 3). It is not straightforward to determine the nature of a process to prove the diffusive nature of a peak. However, there is a pattern for any translational diffusion process that should be followed: inverse correlation/relaxation time is proportional to the second order of a scattering vector (1/τ ∼ Dtq2) (Fig. 6A and B). This dependence is a direct consequence of the first Fick's law that describes the diffusion motion of a nanoparticle in solution.17 In general, it means that the time needed for a diffusing nanoparticle to “swipe” is proportional to the area of diffusing place (Fig. 6C). Since the change in the scattering vector q2 is related to a change in the probing area, it will result in a change of the diffusion time visible as a change in the correlation time. Thus the correct approach to determine the value of the translation diffusion coefficient Dt is to calculate it from the slope of linear dependence of the reverse correlation time 1/τ versus the scattering vector squared, q254–58 (Fig. 6C). For DLS instruments, where a photodetector is mounted on a goniometer, or multi-angle detector setups, the information on 1/τ = f(q2) dependence gives a significant advantage due to the possibility of verifying the diffusive nature of every process visible on a distribution function (Fig. 6B). Only peaks that obey 1/τ = Dtq2 behavior could be attributed to nanoparticles. Other relaxation processes such as rotational diffusion of rod-like particles, internal motion of long flexible macromolecules, gel mesh size fluctuations, and hydrodynamic modes (Fig. 3) will either be insensitive to the variation in q or obey a different power law as a function of q.59–61
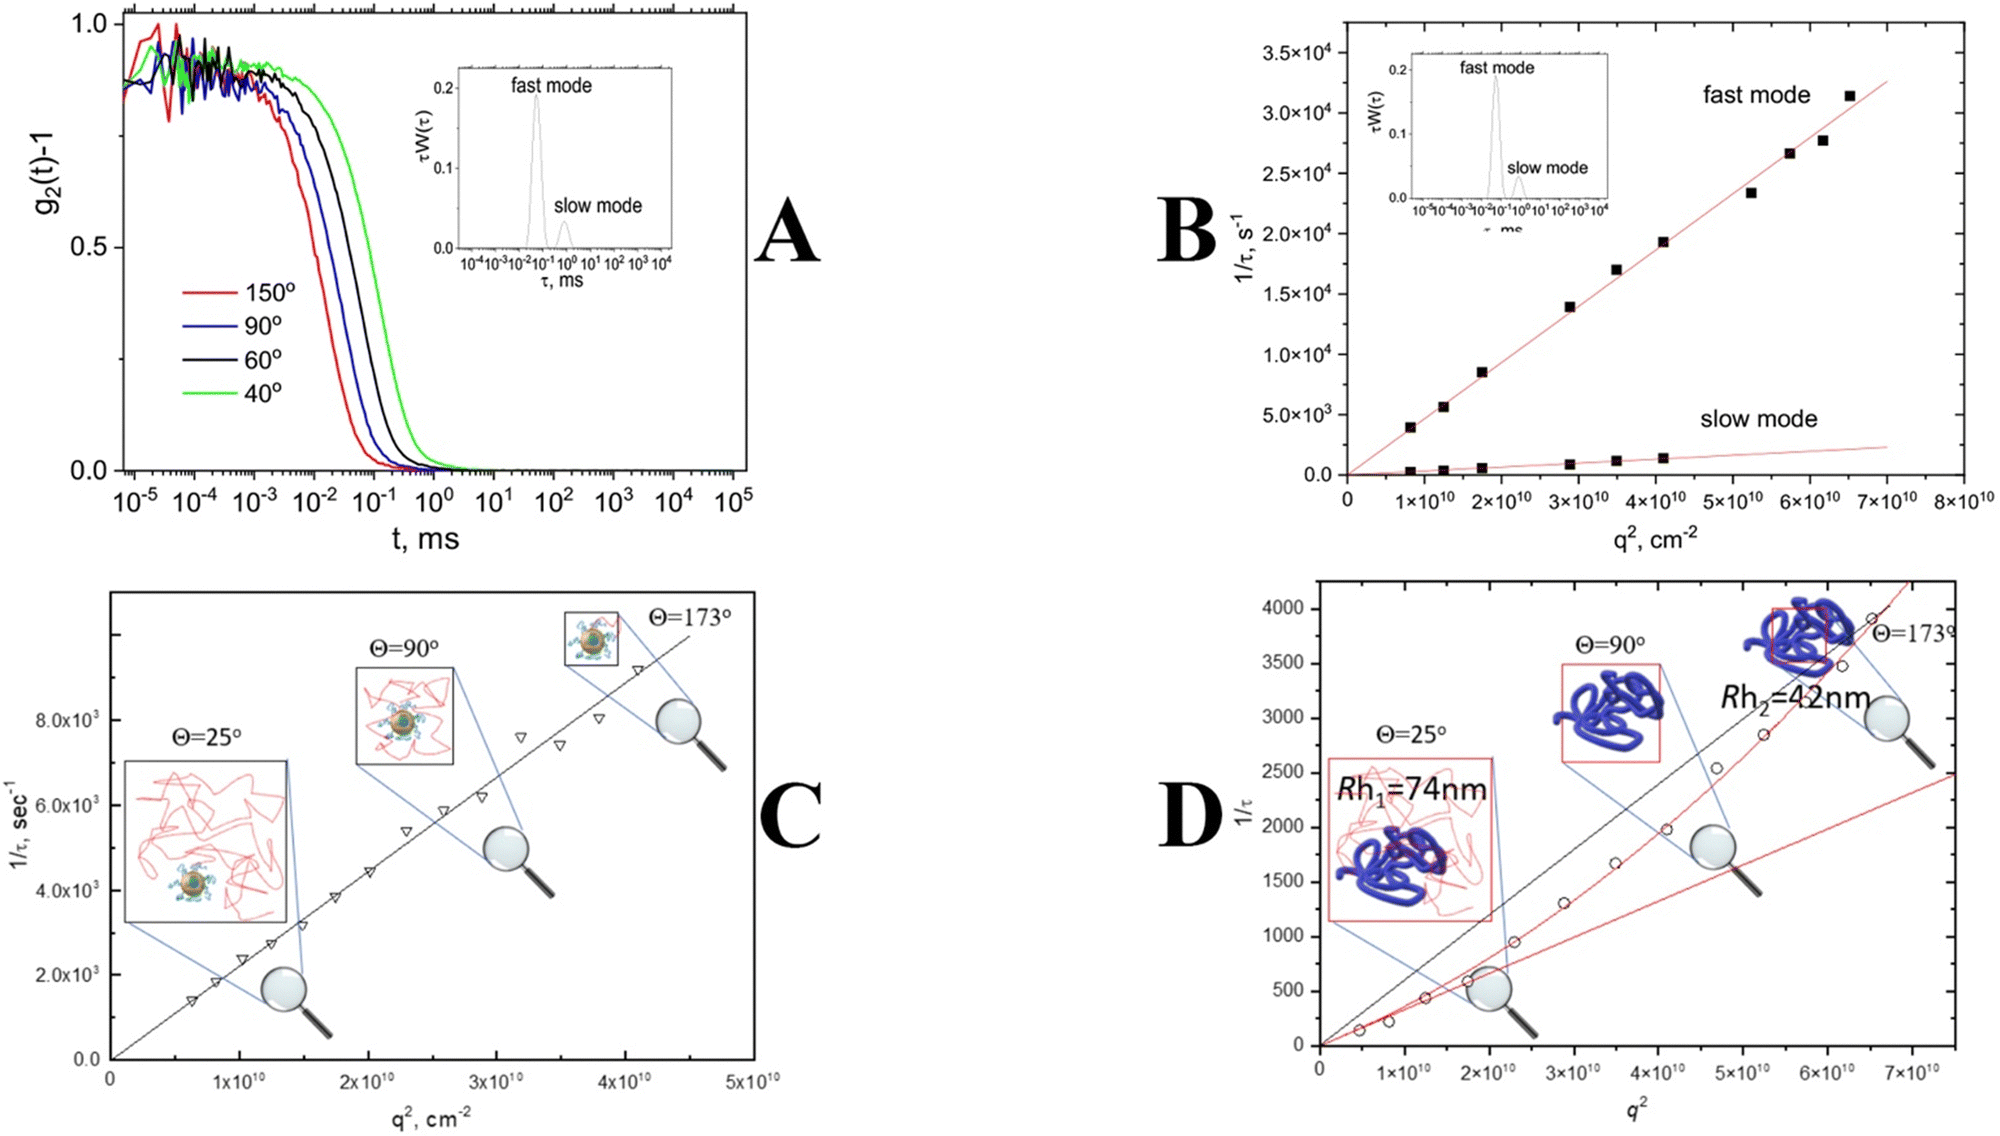 | ||
| Fig. 6 Angle dependence of the correlation function; inset: bimodal distribution function (A). q2 dependence of inverse correlation/decay time for fast and slow modes obtained from a distribution function (B); q2 dependence of inverse correlation/decay time for small nanoparticles (C); q2 dependence of inverse correlation/decay time for large nanoparticles. The red solid line represents the fitting with eqn (4) (D). | ||
Another important issue is that DLS experiments conducted at high scattering angles can manifest deviation from q2 behavior for large particles compatible with the incident wavelength due to the probing of internal nanoparticle dynamics rather than nanoparticle diffusion motion (Fig. 6D). A corrected equation was suggested to describe this phenomenon.
| 1/τ ∼ D0 (1 + Cq2)q2 | (4) |
Concentration factor
Those who are using DLS should remember that, in contrast to TEM, this method gives information from myriads of particles in solution; it is impossible to measure the scattering from a single nanoparticle using commercial instruments, although some papers reported such experiments using a state-of-the-art setup.62 A finite, non-zero nanoparticle concentration is another important source of possible mismatch in the sizing results. As we pointed out earlier, the value of hydrodynamic size is calculated from the translational diffusion coefficient value and is not measured directly. The diffusion of nanoparticles, in turn, is the subject of numerous types of interactions present in solution: nanoparticle–nanoparticle, nanoparticle–solvent, and solvent–solvent. Depending on the nature of nanoparticles, the presence of charges, and the thermodynamic quality of a solvent, the measured, also called apparent diffusion coefficient value, may grow or decrease with increasing concentration. Thus, this coefficient will be different from the true value of the diffusion coefficient, D0.It is known63,64 that in a dilute regime the concentration dependence of an apparent translation diffusion coefficient can be written as
| Dt,app(c) = D0(1 + kDc) | (5) |
| kD = 2A2Mw − kf − υ | (6) |
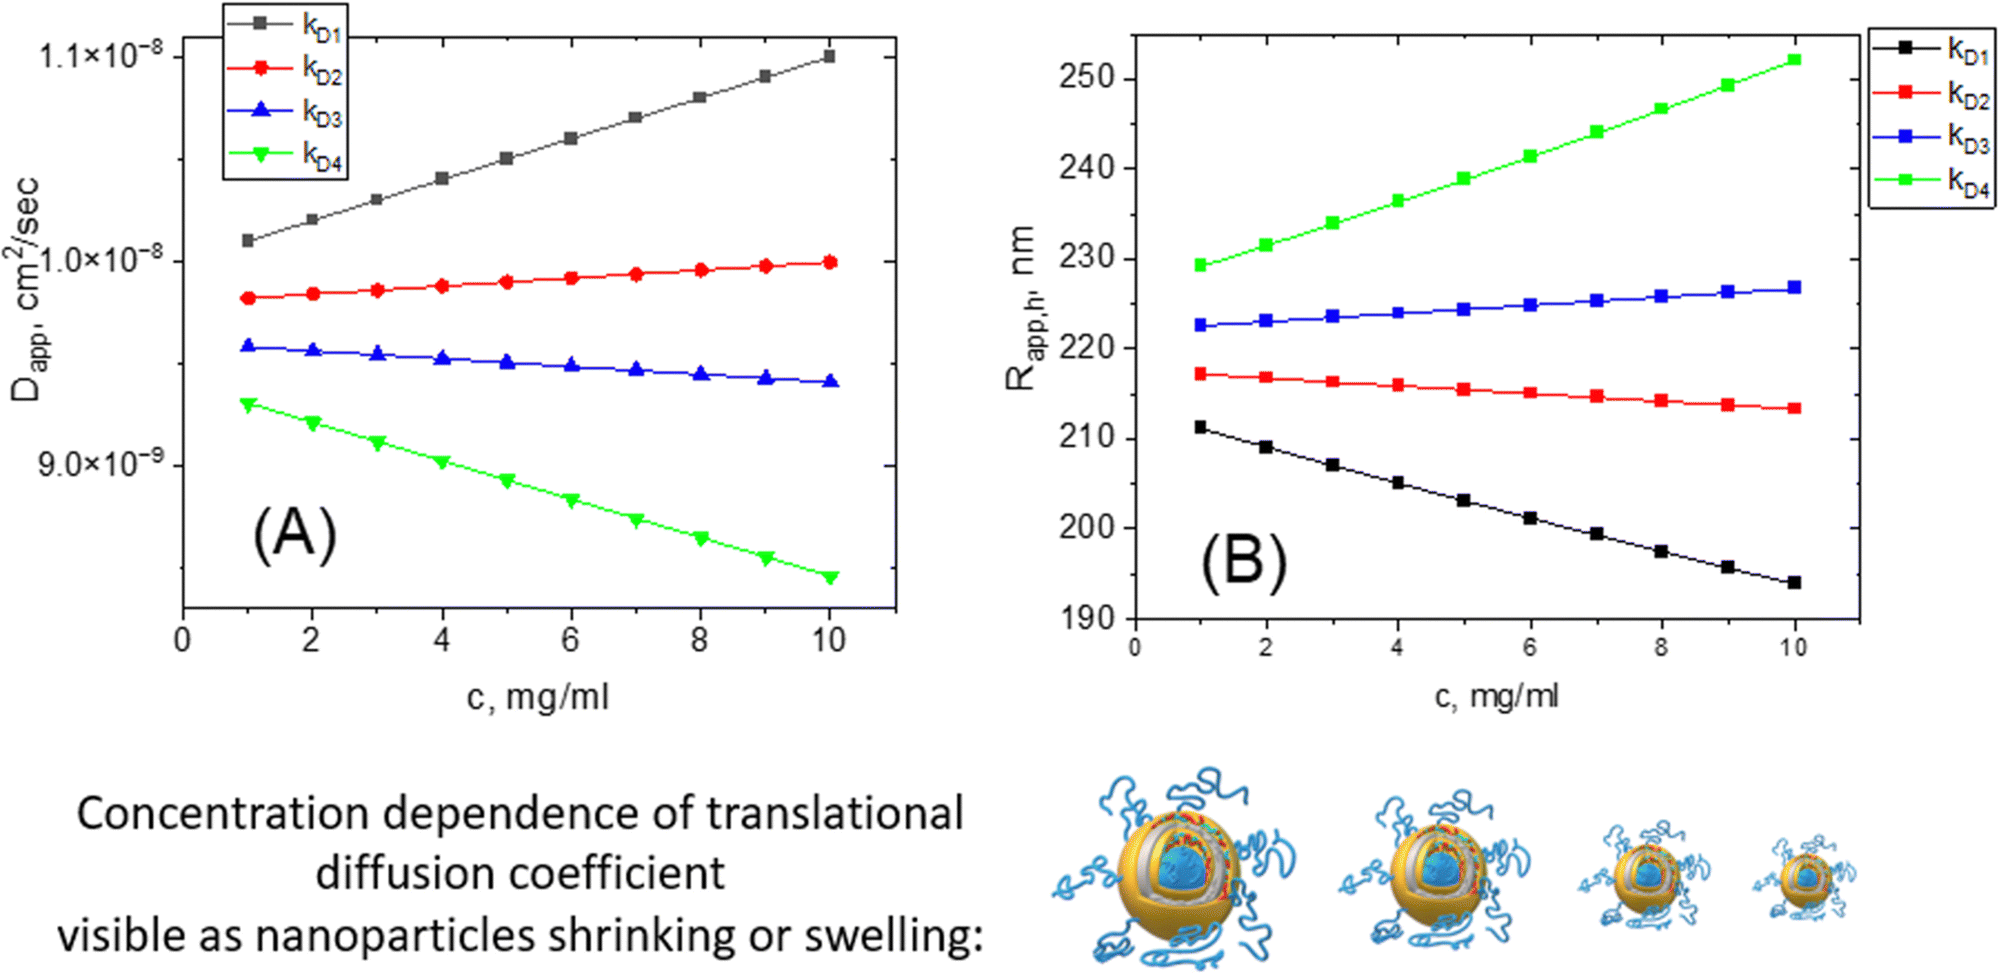 | ||
| Fig. 7 The example of concentration dependence of apparent translational diffusion coefficient for different kD values (A); the concentration dependence of apparent hydrodynamic radii calculated from Dt (B). | ||
We must point out that such concentration dependence of the translational diffusion coefficient has nothing to do with the nanoparticle size changing. Nanoparticles are not shrinking or growing with changes in their concentration even though their hydrodynamic size is changing.
It is very hard to predict the value of hydrodynamic virial coefficient kDa priori since it is a combination of A2, Mw, kf, and υ. The kD value is extremely sensitive to the presence of charges in a system (see the section “charge factor”). As a rule of thumb, we recommend the dilution of a sample to verify the lack of concentration dependence. If the apparent Rh value shows sensitivity to concentration, we suggest making a series of concentrations with further extrapolation of Rh to an infinite dilution (c = 0). The discrepancy between the true and apparent sizes could be up to 100% on average. This should be kept in mind when working with concentrated solutions.
The concentration dependence of apparent Rh value can be observed in diluted transparent solutions and is different from multiple scattering phenomenon observed only in concentrated turbid solutions. Indeed, increasing the concentration of the solution leads to an increase in the number of particles in the sample, due to which the number of light scattering centers increases dramatically. Thus, a photon scattered from one particle before reaching the photodetector will be scattered from another particle and so on. This is called the multiple light scattering process. A photon reaching the detector after multiple scattering is recognized by the instrument as a single scattering, and the resulting correlation function decays faster and the average particle size indicated by the instrument decreases, with an increase in polydispersity.67 Many commercial DLS instruments have a back scattering setup that successfully eliminates the multiple scattering contribution. At back scatter geometry, the correlation function is measured at 173° scattering angle. For turbid systems we strongly recommend using a back scattering geometry.
The role of particle concentration in the solution is intensified in the case of unstable particles that aggregate with each other. Here the primary error factor is not the multiple scattering, but the size of the conglomerates. In this case, as the concentration of the substance increases, the size of the particles displayed by the DLS will increase.68
Charge factor (polyelectrolytes and double layer)
Electrostatic interactions are the strongest between other intermolecular forces such as van der Waals, hydrogen bonding, and hydrophobic interactions. The presence of charge could affect the Brownian diffusion of nanoparticles since attractive or repulsive electrostatic forces will retard or accelerate the motion. Mathematically speaking, it happens due to electrostatic contribution to the kD value in eqn (5), which modifies the apparent Dt value significantly, making DLS experiments very challenging. In principle, any nanoparticle might have a charge due to the formation of a double layer (Fig. 8).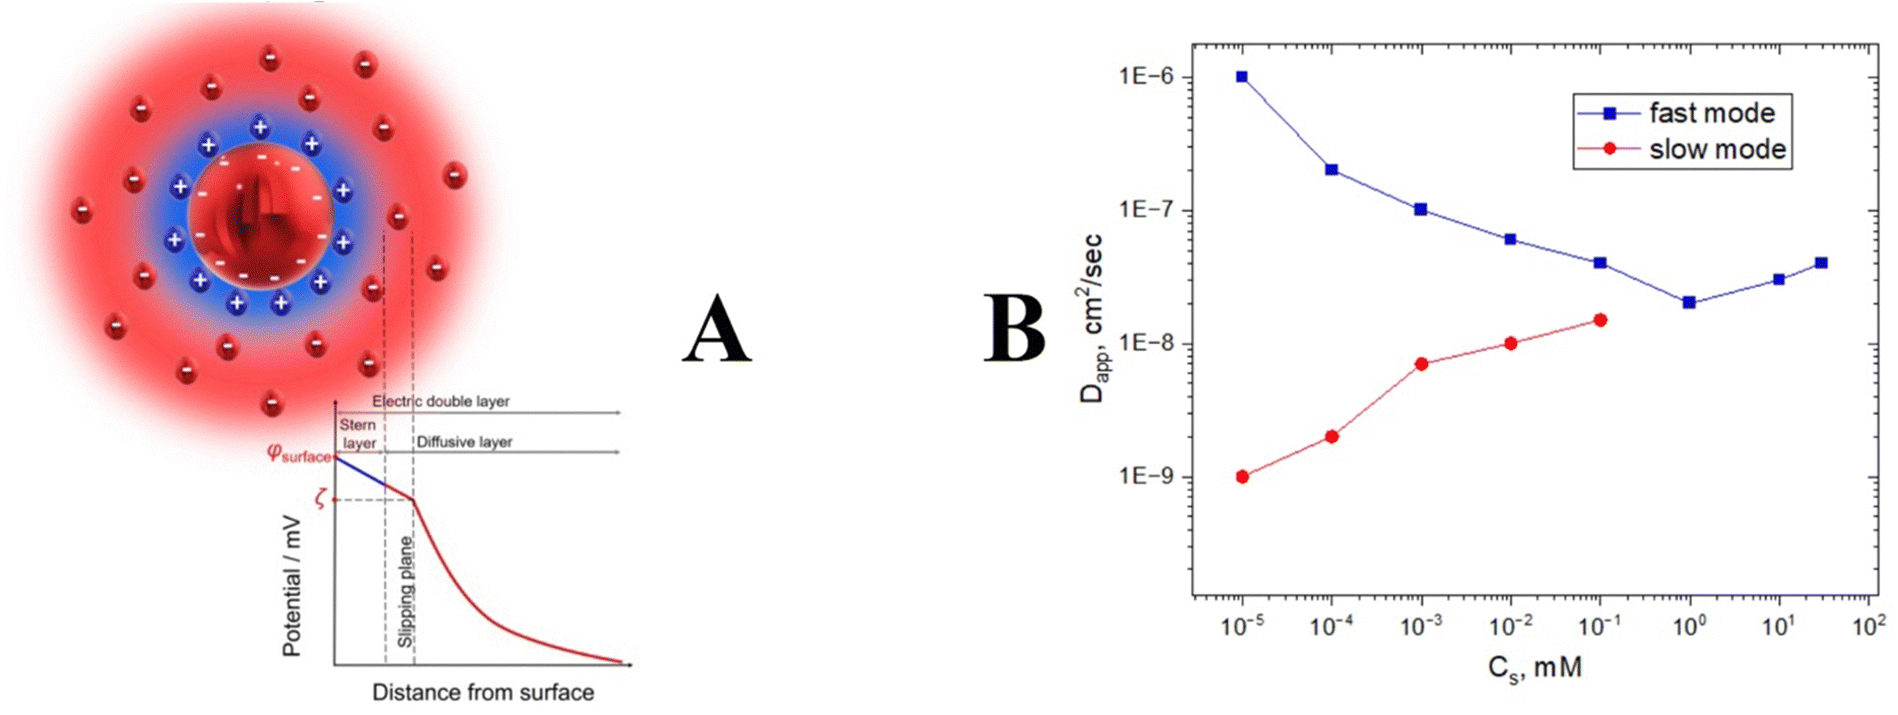 | ||
| Fig. 8 The general structure of a double layer (A). Relaxation time splitting for polyelectrolyte solution as a function of salt concentration (B). | ||
Charged particles attract counterions from the solution, which form a Stern layer of tightly bound ions around particles. At the same time, oppositely charged ions are attracted by ions in the Stern layer and form an outer diffuse layer. Thus, each charged particle is surrounded by an electrical double layer that moves together with the particle during its translational motion (Fig. 8). Between the surface of the charged particle and solution, there is an electrostatic potential that depends on the distance from the surface. In the vicinity of the particle, the potential decreases linearly with the distance, and further from the surface it decays exponentially within the diffusive layer. Electrostatic potential can be screened out by adding salt. It will diminish the strong electrostatic kD contribution and allow measurement of a realistic diffusion coefficient that can be used for the calculation of nanoparticle sizes. However, in salt-free conditions the hydrodynamic motion is extremely complicated. Unscreened electrostatic interactions together with the cloud of counter- and co-ions result in the appearance of an extra peak on the correlation function. This problem is known as a “slow mode dilemma”. This is especially true for polyelectrolytes.69–71 Many biological polymers with pharmaceutical applications such as DNA, RNA, and polylysine display evidence of bimodal distribution for salt-free conditions (Fig. 8).72,73 In general, none of the peaks provide a clue to the nanoparticle size in a salt-free environment. We recommend adding salt for highly charged samples; in general, 0.1 M should be enough to suppress electrostatic charges.
Contrast factor and resolution
Another source of discrepancy between TEM and DLS might come from different contrasts of these two methods. Indeed, electrons and photons interact with matter differently. In TEM any object is visualized by a difference in the absorption of electrons by nanoparticles and the environment. Electron absorption is proportional to the material density and element atomic number. With all other parameters equal, iron oxide nanoparticles will give a better contrast in comparison with organic-based nanoparticles of similar size. This is why in cryo-TEM experiments the outer layer of polymeric nanoparticles composed of hydrophilic polymer highly swelled in water is less visible in comparison with a denser nanoparticle core. As a rule of thumb, a human eye cannot distinguish the intensity of pixels that differ by less than 10%. However, digital analysis can go beyond this limit. Another opportunity to improve the contrast is by using a phase plate to give a phase-based contrast that is more sensitive than the intensity-based one.74 For samples analyzed by the ordinary TEM method where the sample is dried on a copper grid, changes in nanoparticles sizes could be possible due to solvent evaporation. Nanogels are an example where sample drying is the major reason for the true discrepancy between DLS and TEM. However, this possibility should be taken with caution. Many researchers explain the discrepancy between TEM and DLS by the dry state of nanoparticles. Researchers should always rely on common sense in this issue; for example, a collapsed dry polymer shell in a polymer core–shell nanoparticle cannot explain a two-three fold difference between TEM and DLS results.10,75–82 The contrast in light scattering experiments is based on the difference in refractive indices. The physical phenomenon behind light scattering is the refraction, and not its absorption. The key parameter here is the refractive index increment dn/dc, which is roughly proportional to the difference in refractive indices of material and media. For aqueous solutions the dn/dc value is always non-zero since water has one of the lowest refractive indices between solvents (1.33) and it is lower than a refractive index value of materials used for the design of nanoparticles in drug delivery. However, some organic solvents could have the refractive index value quite close to the refractive index of a matrix. It is known from theory that light scattering intensity is proportional to the second power of dn/dc, and nanoparticles will be “invisible” in solution since the dn/dc value will be close to zero. DLS experiments will show nothing for such cases. Thus, different electron contrasts of nanoparticle hydrophobic and hydrophilic compartments in TEM, and refractive index increment in non-aqueous solutions should be taken into consideration when DLS and TEM data are compared.We should also point out here that TEM and DLS are quite different in resolution. The DLS method cannot resolve the difference between the nanoparticles with sizes differing by less than 3 times. For example, a 1:1:1 mixture of latex nanoparticles with a diameter 220, 330, and 440 nm will be seen as one broad single peak.
Particle aggregation
Particle aggregation is one of the prevalent factors that may result in the difference between DLS and TEM data. The reason for aggregation could be the high concentration of particles in the sample, the charge of particles in the solution, or the non-filtered sample, as we mentioned above. The presence of any aggregate in the solution can dramatically affect the results of DLS measurements. In the case of perfectly spherically shaped nanoparticles, it is possible to influence this factor by changing the conditions and achieving ideal conditions for the measurements. However, in certain instances it is necessary to measure the aggregates themselves, for example, to characterize proteins, immune complexes, DNA clusters, and other biological objects. In this case, the question of how to achieve the best results may arise. In the next chapter, we will propose a possible solution to this problem.Size-weighting factor (number vs. volume vs. intensity weighted) and small peak suppression
The substantial difference between DLS and Cryo-TEM results to characterize aggregate sizes mostly comes from different weighting procedures. This difference can be eliminated by the conversion of the intensity-weighted aggregates distribution function obtained by DLS to a volume-weighted83 or number-weighted one, which shifts the distribution maximum to lower Rh values.58 The sizes measured by TEM are much better coincided with number-weighted distribution data (Fig. 9). When the particles present in solution have low inherent dispersity this will reduce the effects of size-weighting factors and small peak suppression, and will likely result in a smaller difference between the results generated using DLS and TEM.84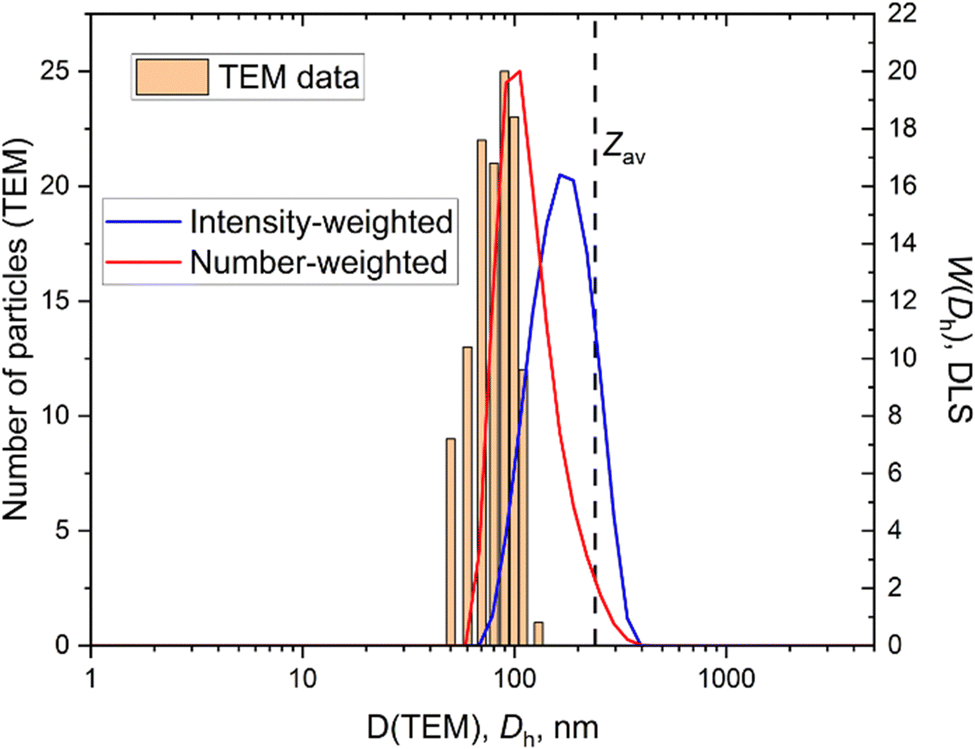 | ||
| Fig. 9 Combined TEM and DLS data for mesoporous silica. Number-weighted and intensity weighted distributions are presented for DLS data. | ||
Some commercial software provide additional, however, old-fashioned information on nanoparticle size and polydispersity based on cumulant analysis. Namely, Z averaged size, Zav, and polydispersity index, PDI. Both parameters should be taken with precaution. Many scientists pay attention to Zav and PDI values only. We strongly suggest using distribution-based values instead of a Zav one. For single mode distribution function Z averaged size is quite close to the intensity-weighted value (Fig. 9), however, for multiple mode distributions, Zav quite often gives absurd results. The PDI value often receives greater importance than it deserves. Many papers have stated that a PDI value below 0.3 stands for low polydispersity of nanoparticles. There are no scientifically established criteria for PDI values above 0.1. There is no sense of comparing PDI values for the samples of different nature. The monodisperse standard PDI values are lower than 0.1 and we suggest that only PDI values below 0.1 can be treated as low polydispersity. Higher values should be regarded as significant dispersity. Of course, the PDI value could be informative dealing with nanoparticles of the same nature to follow changes in homogeneity.
Another example of a mistake is measuring the size of particles that aggregate in solution. The DLS method, unlike microscopy, does not allow measurement of the size of individual particles within aggregates. Therefore, very often in such cases the dimensions of the hydrodynamic radius determined by the DLS method are tens of times larger than the dimensions of the particles determined by TEM. In this case changing the distribution function can help.68,85,86 Since DLS is more sensitive to larger particles, the scattering intensity will be proportional to the sixth power of their radius. In this case the larger particles, whose concentration in solution will be much lower, will still mask the presence of the smaller particles, which may be present in much greater numbers. A volume and number-weighted distribution functions would then help to identify the smaller particles in the solution.87 However, in the case of studying the kinetics of aggregation using DLS, this approach is not suitable. Intensity-weighted functions are best suited for this purpose.68 It is strongly suggested to include all types of distribution functions/Rh values, intensity, volume and number-weighted in the manuscripts for publication, since it gives the most detailed description of solution dispersity.
Radiation damage of samples in TEM experiments
Electron microscopy and light scattering are substantially different in the energy used to generate information. An electron gun in an electron microscope emits electrons with the energy varying in the range of 50–500 keV, whereas the visible light used in most of the DLS instrument lasers have 4 orders of magnitude lower energy of 2–2.5 eV. This difference is directly related to the problem of radiation damage. Indeed, the electrons can break the matter of a specimen, causing radiation damage. In extreme cases, the damage might cause the appearance of artefacts resembling nanoparticles.Fig. 10 shows typical examples of radiation damage artefacts observed in a drug delivery system. The artefacts usually have a circular shape with a contrast rim. The structure of artefacts depends on the specimen preparation. For Cryo-TEM, a specimen is a vitrified solution obtained by rapid plunging in liquid ethane. The first type of artefacts observed commonly in micrographs is melting of vitrified solution due to the heating by the electron beam. The melted areas of specimen quickly disappear in high vacuum resulting in the holes formation. This is especially true in the case of organic solvents or mixed solvents such as H2O/dimethyl sulphoxide. The cavities formed could be erroneously treated as liposomal or spherical-like particles (Fig. 11).89
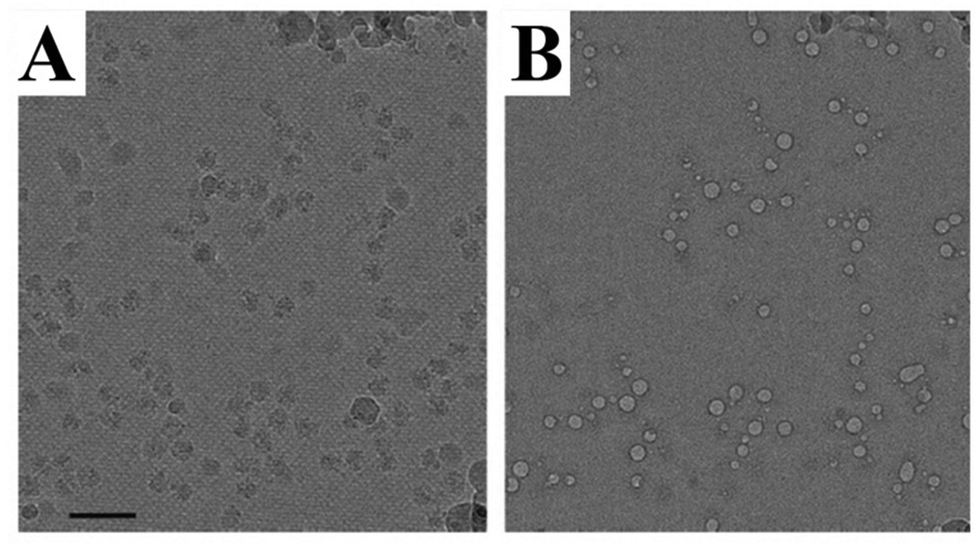 | ||
| Fig. 10 An example of TEM artefacts. Ribosome particles (A) and bubbles (B). Taken from the ref. 88 with permission from Elsevier and IUCr. | ||
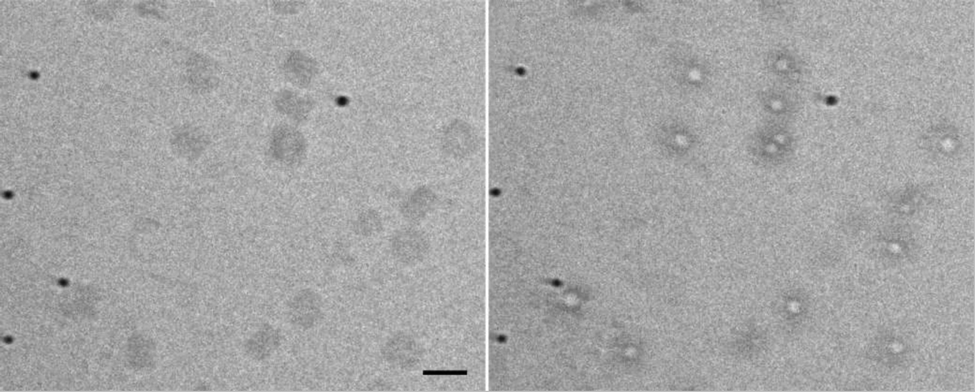 | ||
| Fig. 11 An example of TEM artefacts. Taken from the ref. 89 with permission from Elsevier and IUCr. | ||
The size of the cavity is usually governed by the time of illumination and beam energy; the longer the area of interest was affected by the electron beam, the greater will be the pores formed. If the specimen is characterised using the TEM method the solution is preliminarily dried on a copper grid. The artefacts generated in this case are generally caused by the destruction of nanoparticles.
Samples can be damaged during cryo-TEM experiments even by quite a low electron exposure, which makes high-resolution imaging of a specimen impossible. This problem is especially crucial for biological samples, such as proteins and DNA, for which ionizing radiation can cause breaks of strands and changes in molecular structure. Moreover, a long exposure time can lead to the formation of microbubbles of hydrogen gas as a result of the radiolysis of proteins or water (Fig. 12).88,90
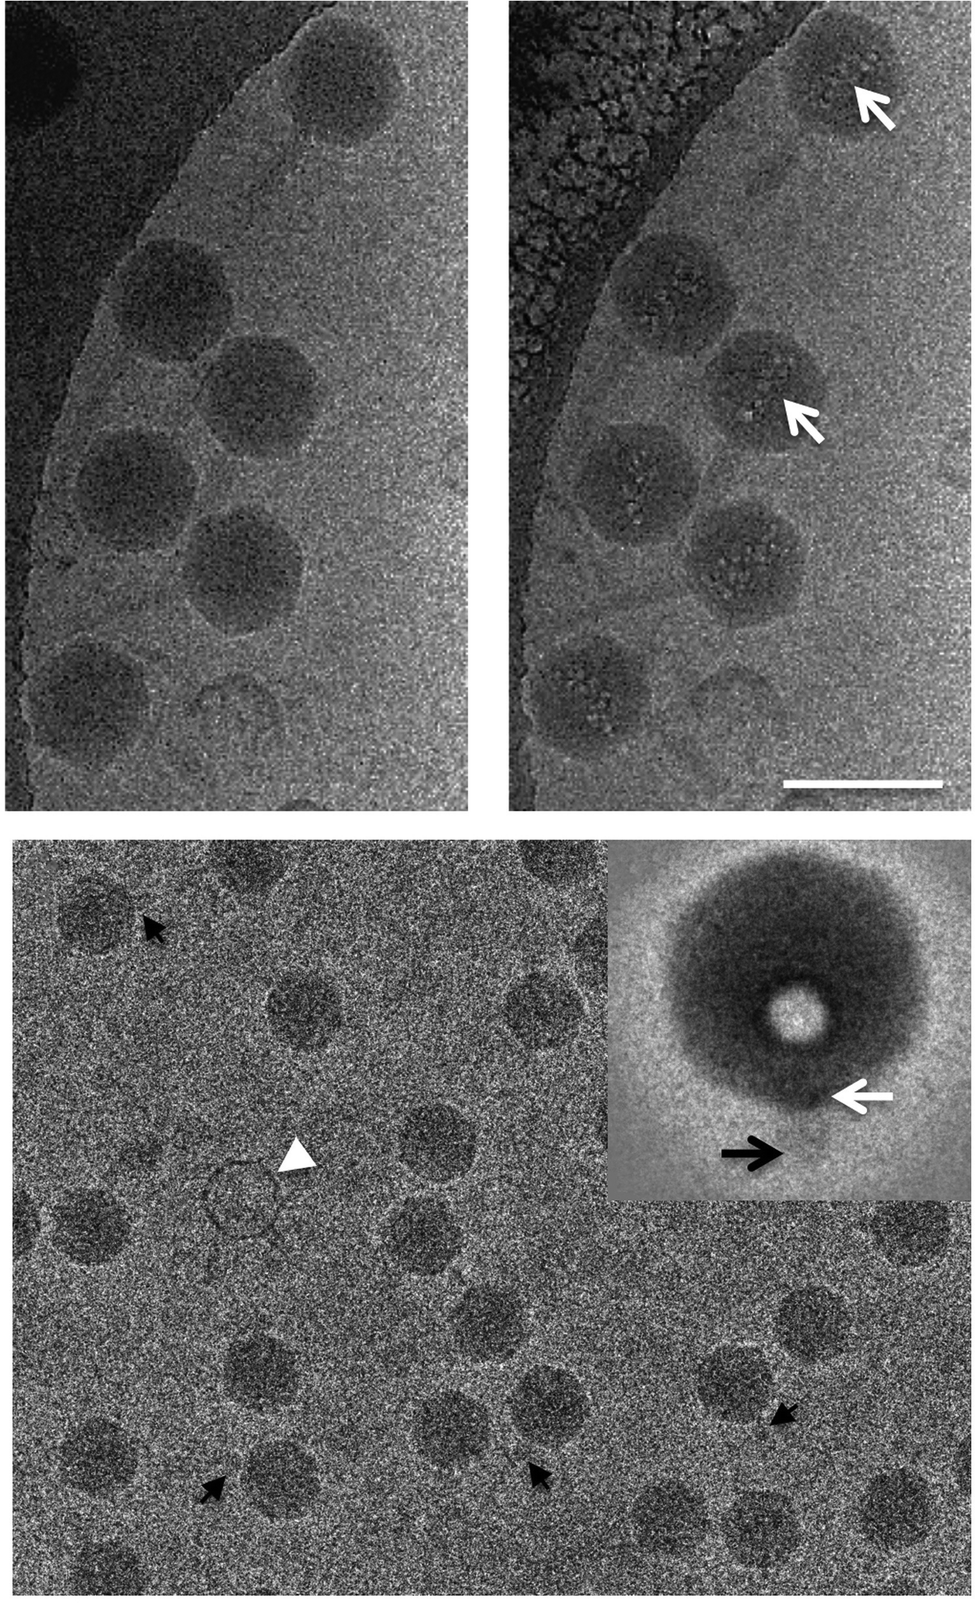 | ||
| Fig. 12 An example of radiolysis in cryo-TEM images. Taken from the ref. 90 with permission from Elsevier and IUCr. | ||
As one can expect, there will be no correlation between the sizes of the artefacts and the hydrodynamic size values obtained from DLS. As a rule of thumb, we always suggest making several images of the same spot of interest. If the images show significant changes during the consequent images, you can suspect the effects of the radiation damage. We highly recommend working with low doses of electrons to reduce possible radiation damage.
Conclusions
This comprehensive focus article highlights the physical aspects that are responsible for the routinely observed mismatch between TEM and DLS results and provides an intuitively clear roadmap for researchers specializing in drug delivery and the pharmaceutical community on reliable DLS measurements. We highlight that concentration, difference in contrasts, charge, and shape of nanoparticles are important issues that should be taken into consideration when sizes of nanoparticles measured by DLS and TEM methods have to be compared. Many cases of reported mismatches between TEM and DLS can be eliminated by correct analysis of the data.We have provided some important advice that will help scientists to characterize nanoparticles in drug delivery by DLS and TEM experiments appropriately and how to correctly interpret their data.
Author contributions
Sergey K. Filippov: conceptualization, visualization, supervision, writing – original draft, and writing – review & editing. Ramil Khusnutdinov: data curation, writing – original draft, and writing – review & editing. Anastasiia Murmiliuk: data curation, writing – original draft, and writing – review & editing. Wali Inam: data curation, writing – original draft, and writing – review & editing. Lucia Ya. Zakharova: writing – review & editing. Hongbo Zhang: funding acquisition, writing – review & editing. Vitaliy V. Khutoryanskiy: funding acquisition, writing – original draft preparation, and writing – review & editing.Conflicts of interest
There are no conflicts to declare.Acknowledgements
SKF and VVK are grateful to the Leverhulme Trust (UK) for the visiting professorship grant (VP2-2020-013). This work was financially supported by the Russian Science Foundation (RSF) in the framework of research project No. 20-65-46007. We acknowledge the financial support from Academy of Finland (328933, 337531). LYZ is grateful for financial support from the government assignment for FRC Kazan Scientific Center of RAS. VVK is also grateful to the Royal Society (UK) for his industry fellowship (IF\R2\222031). HZ acknowledges the financial support from the Academy of Finland (353146, 347897, 336355, 337531).References
- H. Maeda, The 35th anniversary of the discovery of EPR effect: A new wave of nanomedicines for tumor-targeted drug delivery-personal remarks and future prospects, J. Pers. Med., 2021, 11(3), 229 CrossRef PubMed.
- M. J. Mitchell, M. M. Billingsley, R. M. Haley, M. E. Wechsler, N. A. Peppas and R. Langer, Engineering precision nanoparticles for drug delivery, Nat. Rev. Drug Discovery, 2021, 20(2), 101–124 CrossRef CAS PubMed.
- K. Ulbrich, T. Etrych, P. Chytil, M. Jelínková and B. ŘíHová, HPMA copolymers with pH-controlled release of doxorubicin, J. Controlled Release, 2003, 87(1–3), 33–47 CrossRef CAS PubMed.
- S. K. Filippov, P. Chytil, P. V. Konarev, M. Dyakonova, C. M. Papadakis and A. Zhigunov, et al., Macromolecular HPMA-based nanoparticles with cholesterol for solid-tumor targeting: detailed study of the inner structure of a highly efficient drug delivery system, Biomacromolecules, 2012, 13(8), 2594–2604 CrossRef CAS PubMed.
- A. Da Silva-Candal, T. Brown, V. Krishnan, I. Lopez-Loureiro, P. Ávila-Gómez and A. Pusuluri, et al., Shape effect in active targeting of nanoparticles to inflamed cerebral endothelium under static and flow conditions, J. Controlled Release, 2019, 309, 94–105 CrossRef CAS PubMed.
- J. Zhao and M. H. Stenzel, Entry of nanoparticles into cells: The importance of nanoparticle properties, Polym. Chem., 2018, 9(3), 259–272 RSC.
- Y. Xiao, A. Tan, A. W. Jackson and B. J. Boyd, Nonspherical Nanocapsules as Long-Circulating Drug Delivery Systems, Chem. Mater., 2022, 34, 2503–2530 CrossRef CAS.
- N. Kapate, J. R. Clegg and S. Mitragotri, Non-spherical micro- and nanoparticles for drug delivery: Progress over 15 years, Adv. Drug Delivery Rev., 2021, 177, 113807 CrossRef CAS PubMed.
- J. Yan, X. Xu, J. Zhou, C. Liu, L. Zhang and D. Wang, et al., Fabrication of a pH/Redox-Triggered Mesoporous Silica-Based Nanoparticle with Microfluidics for Anticancer Drugs Doxorubicin and Paclitaxel Codelivery, ACS Appl. Bio Mater., 2020, 3(2), 1216–1225 CrossRef CAS PubMed.
- T. M. M. Ways, S. K. Filippov, S. Maji, M. Glassner, M. Cegłowski and R. Hoogenboom, et al., Mucus-penetrating nanoparticles based on chitosan grafted with various non-ionic polymers: Synthesis, structural characterisation and diffusion studies, J. Colloid Interface Sci., 2022, 626, 251–264 CrossRef CAS PubMed.
- R. Cheng, F. Fontana, J. Xiao, Z. Liu, P. Figueiredo and M. A. Shahbazi, et al., Recombination Monophosphoryl Lipid A-Derived Vacosome for the Development of Preventive Cancer Vaccines, ACS Appl. Mater. Interfaces, 2020, 12(40), 44554–44562 CrossRef CAS PubMed.
- T. Bauleth-Ramos, M. A. Shahbazi, D. Liu, F. Fontana, A. Correia and P. Figueiredo, et al., Nutlin-3a and Cytokine Co-loaded Spermine-Modified Acetalated Dextran Nanoparticles for Cancer Chemo-Immunotherapy, Adv. Funct. Mater., 2017, 27(42), 1703303 CrossRef.
- Y. Ye, J. He, Y. Qiao, Y. Qi, H. Zhang and H. A. Santos, et al., Mild temperature photothermal assisted anti-bacterial and anti-inflammatory nanosystem for synergistic treatment of post-cataract surgery endophthalmitis, Theranostics, 2020, 10(19), 8541–8557 CrossRef CAS PubMed.
- H. Zheng, C. W. Tai, J. Su, X. Zou and F. Gao, Ultra-small mesoporous silica nanoparticles as efficient carriers for pH responsive releases of anti-cancer drugs, Dalton Trans., 2015, 44(46), 20186–20192 RSC.
- K. Ma, H. Sai and U. Wiesner, Ultrasmall Sub-10 nm Near-Infrared Fluorescent Mesoporous Silica Nanoparticles, J. Am. Chem. Soc., 2012, 134, 13180–13183 CrossRef CAS PubMed.
- S. K. Mann, A. Dufour, J. J. Glass, R. De Rose, S. J. Kent and G. K. Such, et al., Tuning the properties of pH responsive nanoparticles to control cellular interactions in vitro and ex vivo, Polym. Chem., 2016, 7(38), 6015–6024 RSC.
- B. J. Berne and R. Pecora, Dynamic light scattering with applications to chemistry, biology and physics, Dover Publications Inc., 2003, p. 384 Search PubMed.
- D. B. Williams and C. B. Carter, Transmission Electron Microscopy. Transmission Electron Microscopy, A Textbook for Materials Science, David B. Williams, C. Barry Carter, Springer Science & Business Media, 2009, p. 775 Search PubMed.
- C. Ullmann, F. Babick and M. Stintz, Microfiltration of Submicron-Sized and Nano-Sized Suspensions for Particle Size Determination by Dynamic Light Scattering, Nanomaterials, 2019, 9(6), 829 CrossRef CAS PubMed.
- A. E. S. Van Driessche, W. L. Ling, G. Schoehn and M. Sleutel, Nucleation of glucose isomerase protein crystals in a nonclassical disguise: The role of crystalline precursors, Proc. Natl. Acad. Sci. U. S. A., 2022, 119(7), e2108674119 CrossRef CAS PubMed.
- M. Zhang, S. Cao, A. Liu, J. J. L. M. Cornelissen and S. G. Lemay, Self-Assembly of Viral Capsid Proteins Driven by Compressible Nanobubbles, J. Phys. Chem. Lett., 2020, 11(24), 10421–10424 CrossRef CAS PubMed.
- R. Pecora, Dynamic Light Scsttering, ed. R. Pecora, Plenum Press, New York and London, 1985 Search PubMed.
- Y. P. Panarin, C. Rosenblatt and F. M. Aliev, Appearance of Ferrielectric Phases in a Confined Liquid Crystal Investigated by Photon Correlation Spectroscopy, Phys. Rev. Lett., 1998, 81(13), 2699–2702 CrossRef CAS.
- M. Čopič and A. Mertelj, Reorientation in Random Potential: A Model for Glasslike Dynamics in Confined Liquid Crystals, Phys. Rev. Lett., 1998, 80(7), 1449–1452 CrossRef.
- F. D. Victorelli, L. S. Manni, S. Biffi, B. Bortot, H. H. Buzzá and V. Lutz-Bueno, et al., Potential of curcumin-loaded cubosomes for topical treatment of cervical cancer, J. Colloid Interface Sci., 2022, 620, 419–430 CrossRef CAS PubMed.
- S. H. Anastasiadis, Diblock copolymer dynamics, Curr. Opin. Colloid Interface Sci., 2000, 5(5–6), 323–332 CrossRef.
- P. Stepanek and T. P. Lodge, Dynamic Light Scattering from Block Copolymer Melts near the Order−Disorder Transition, Macromolecules, 1996, 29(4), 1244–1251 CrossRef CAS.
- C. M. Papadakis, K. Almdal, K. Mortensen, F. Rittig, G. Fleischer and P. Stepanek, The bulk dynamics of a compositionally asymmetric diblock copolymer studied using dynamic light scattering, Eur. Phys. J. E: Soft Matter Biol. Phys., 2000, 283, 275–283 CrossRef.
- T. Jian, S. H. Anastasiadis, A. N. Semenov, G. Fytas, G. Fleischer and A. D. Vilesov, Interdiffusion and Composition Polydispersity in Diblock Copolymers above the Ordering Transition, Macromolecules, 1995, 28, 2439–2449 CrossRef CAS.
- Č. Koňák and G. Fleischer, Dynamics of composition fluctuations in statistical copolymer solutions, Macromolecules, 1997, 30(5), 1457–1462 CrossRef.
- J. Yan, C. Liu, Q. Wu, J. Zhou, X. Xu and L. Zhang, et al., Mineralization of pH-sensitive doxorubicin prodrug in ZIF-8 to enable targeted delivery to solid tumors, Anal. Chem., 2020, 92, 11453–11461 CrossRef CAS PubMed.
- D. Liu, H. Zhang, S. Cito, J. Fan, E. Makila and J. Salonen, et al., Core/Shell Nanocomposites Produced by Superfast Sequential Microfluidic Nanoprecipitation, Nano Lett., 2017, 17(2), 606–614 CrossRef CAS PubMed.
- F. Zhang, A. Correia, E. Mäkilä, W. Li, J. Salonen and J. J. Hirvonen, et al., Receptor-Mediated Surface Charge Inversion Platform Based on Porous Silicon Nanoparticles for Efficient Cancer Cell Recognition and Combination Therapy, ACS Appl. Mater. Interfaces, 2017, 9(11), 10034–10046 CrossRef CAS PubMed.
- D. Liu, E. Mäkilä, H. Zhang, B. Herranz, M. Kaasalainen and P. Kinnari, et al., Nanostructured Porous Silicon-Solid Lipid Nanocomposite: Towards Enhanced Cytocompatibility and Stability, Reduced Cellular Association, and Prolonged Drug Release, Adv. Funct. Mater., 2013, 23(15), 1893–1902 CrossRef CAS.
- H. Zhang, D. Liu, L. Wang, Z. Liu, R. Wu and A. Janoniene, et al., Microfluidic Encapsulation of Prickly Zinc-Doped Copper Oxide Nanoparticles with VD1142 Modified Spermine Acetalated Dextran for Efficient Cancer Therapy, Adv. Healthcare Mater., 2017, 6(11), 1601406 CrossRef PubMed.
- H. Zhang, X. Qu, H. Chen, H. Kong, R. Ding and D. Chen, et al., Fabrication of Calcium Phosphate-Based Nanocomposites Incorporating DNA Origami, Gold Nanorods, and Anticancer Drugs for Biomedical Applications, Adv. Healthcare Mater., 2017, 6(20), 1700664 CrossRef PubMed.
- F. Fontana, M. A. Shahbazi, D. Liu, H. Zhang, E. Mäkilä and J. Salonen, et al., Multistaged Nanovaccines Based on Porous Silicon@Acetalated Dextran@Cancer Cell Membrane for Cancer Immunotherapy, Adv. Mater., 2017, 29(7), 1603239 CrossRef PubMed.
- F. Selmin, U. M. Musazzi, S. Franzè, E. Scarpa, L. Rizzello and P. Procacci, et al., Pre-Drawn Syringes of Comirnaty for an Efficient COVID-19 Mass Vaccination: Demonstration of Stability, Pharmaceutics, 2021, 13(7), 1029 CrossRef CAS PubMed.
- D. Suresh, A. Suresh and R. Kannan, Engineering biomolecular systems: Controlling the self-assembly of gelatin to form ultra-small bioactive nanomaterials, Bioact. Mater., 2022, 18, 321–336 CAS.
- R. G. Lebel and D. A. I. Goring, Density, Viscosity, Refractive Index, and Hygroscopicity of Mixtures of Water and Dimethyl Sulfoxide, J. Chem. Eng. Data, 1962, 7(1), 100–101 CrossRef CAS.
- H. Luo, L. Kong, F. Zhang, C. Huang, J. Chen and H. Zhang, et al., Light-Controlled Nanosystem with Size-Flexibility Improves Targeted Retention for Tumor Suppression, Adv. Funct. Mater., 2021, 31(27), 2101262 CrossRef CAS.
- X. Ma, E. Özliseli, Y. Zhang, G. Pan, D. Wang and H. Zhang, Fabrication of redox-responsive doxorubicin and paclitaxel prodrug nanoparticles with microfluidics for selective cancer therapy, Biomater. Sci., 2019, 7(2), 634–644 RSC.
- X. Xu, O. Koivisto, C. Liu, J. Zhou, M. Miihkinen and G. Jacquemet, et al., Effective Delivery of the CRISPR/Cas9 System Enabled by Functionalized Mesoporous Silica Nanoparticles for GFP-Tagged Paxillin Knock-In, Adv. Ther., 2021, 4(1), 1–12 Search PubMed.
- K. Ma, U. Werner-Zwanziger, J. Zwanziger and U. Wiesner, Controlling Growth of Ultrasmall Sub-10 nm Fluorescent Mesoporous Silica Nanoparticles, Chem. Mater., 2013, 25(5), 677–691 CrossRef CAS.
- W. Feng, X. Zhou, C. He, K. Qiu, W. Nie and L. Chen, et al., Polyelectrolyte multilayer functionalized mesoporous silica nanoparticles for pH-responsive drug delivery: layer thickness-dependent release profiles and biocompatibility, J. Mater. Chem. B, 2013, 1(43), 5886–5898 RSC.
- I. L. Hsiao, A. M. Gramatke, R. Joksimovic, M. Sokolowski, M. Gradzielski and A. Haase, Size and cell type dependent uptake of silica nanoparticles, J. Nanomed. Nanotechnol., 2014, 5, 6 Search PubMed.
- P. Tallury, S. Kar, S. Bamrungsap, Y. F. Huang, W. Tan and S. Santra, Ultra-small water-dispersible fluorescent chitosan nanoparticles: synthesis, characterization and specific targeting, Chem. Commun., 2009, 2347–2349 RSC.
- A. Saneja, R. Kumar, M. J. Mintoo, R. D. Dubey, P. L. Sangwan and D. M. Mondhe, et al., Gemcitabine and betulinic acid co-encapsulated PLGA-PEG polymer nanoparticles for improved efficacy of cancer chemotherapy, Mater. Sci. Eng., C, 2019, 98, 764–771 CrossRef CAS PubMed.
- D. S. Karaman, D. Desai, R. Senthilkumar, E. M. Johansson, N. Råtts and M. Odén, et al., Shape engineering vs organic modification of inorganic nanoparticles as a tool for enhancing cellular internalization, Nanoscale Res. Lett., 2012, 7(1), 358 CrossRef PubMed.
- T. Tian, S. Yin, S. Tu, C. L. Weindl, K. S. Wienhold and S. Liang, et al., Morphology Transformation Pathway of Block Copolymer-Directed Cooperative Self-Assembly of ZnO Hybrid Films Monitored In Situ during Slot-Die Coating, Adv. Funct. Mater., 2021, 31(46), 2105644 CrossRef CAS.
- A. Jagusiak, K. Chlopas, G. Zemanek, P. Wolski and T. Panczyk, Controlled Release of Doxorubicin from the Drug Delivery Formulation Composed of Single-Walled Carbon Nanotubes and Congo Red: A Molecular Dynamics Study and Dynamic Light Scattering Analysis, Pharmaceutics, 2020, 12(7), 622 CrossRef CAS PubMed.
- M. Ghosh, D. Öner, R. C. Duca, B. Bekaert, J. A. J. Vanoirbeek and L. Godderis, et al., Single-walled and multi-walled carbon nanotubes induce sequence-specific epigenetic alterations in 16 HBE cells, Oncotarget, 2018, 9(29), 20351–20365 CrossRef PubMed.
- E. Vicente-Alique, R. Núñez-Ramírez, J. F. Vega, P. Hu and J. Martínez-Salazar, Size and conformational features of ErbB2 and ErbB3 receptors: A TEM and DLS comparative study, Eur. Biophys. J., 2011, 40(7), 835–842 CrossRef CAS PubMed.
- S. Rangelov, M. Almgren, K. Edwards and C. Tsvetanov, Formation of Normal and Reverse Bilayer Structures by Self-Assembly of Nonionic Block Copolymers Bearing Lipid-Mimetic Units, J. Phys. Chem. B, 2004, 108(23), 7542–7552 CrossRef CAS.
- M. Almgren and S. Rangelov, Spontaneously formed nonequilibrium vesicles of cetyltrimethylammonium bromide and sodium octyl sulfate in aqueous dispersions, Langmuir, 2004, 20(16), 6611–6618 CrossRef CAS PubMed.
- N. S. Domnina, O. Y. Sergeeva, A. N. Koroleva, O. V. Rakitina, L. A. Dobrun and S. K. Filippov, et al., Molecular properties of conjugates formed by synthetic hydrophilic polymers and sterically hindered phenols, Polym. Sci., Ser. A, 2010, 52(9), 900–906 CrossRef.
- N. V. Tsvetkov, S. K. Filippov, T. M. Kudryavtseva, V. O. Ivanova, Z. B. Shifrina and M. S. Averina, et al., Hydrodynamic properties of rigid pyridine-containing poly(phenylene) dendrimers in solutions, Polym. Sci., Ser. A, 2006, 48(4), 450–455 CrossRef.
- S. K. Filippov, A. V. Lezov, O. Yu Sergeeva, A. S. Olifirenko, S. B. Lesnichin and N. S. Domnina, et al., Aggregation of dextran hydrophobically modified by sterically-hindered phenols in aqueous solutions: Aggregates vs. single molecules, Eur. Polym. J., 2008, 44(10), 3361–3369 CrossRef CAS.
- J. Langowski, U. Giesen and C. Lehmann, Dynamics of superhelical DNA studied by photon correlation spectroscopy, Biophys. Chem., 1986, 25, 191–200 CrossRef CAS PubMed.
- J. Langowski, Salt effects on internal motions of superhelical and linear pUC8 DNA. Dynamic light scattering studies, Biophys. Chem., 1987, 27(3), 263–271 CrossRef CAS PubMed.
- R. J. Lewis, J. H. Huang and R. Pecora, Rotational and translational motion of supercoiled plasmids in solution, Macromolecules, 1985, 18(5), 944–948 CrossRef CAS.
- L. F. Guerra, T. W. Muir and H. Yang, Single-Particle Dynamic Light Scattering: Shapes of Individual Nanoparticles, Nano Lett., 2019, 19(8), 5530–5536 CrossRef CAS PubMed.
- K. Nishinari, K. Kohyama, P. A. Williams, G. O. Phillips, W. Burchard and K. Ogino, Solution properties of pullulan, Macromolecules, 1991, 24(20), 5590–5593 CrossRef CAS.
- G. Orts Gil, S. Prévost, M. Łosik, F. Hermes, H. Schlaad and T. Hellweg, Polypeptide hybrid copolymers as selective micellar nanocarriers in nonaqueous media, Colloid Polym. Sci., 2009, 287(11), 1295–1304 CrossRef CAS.
- M. Corti and V. Degiorgio, Quasi-Elastic Light Scattering Study of Intermicellar Interactions in Aqueous Sodlum Dodecyl Sulfate Solutions, J. Phys. Chem., 1981, 85(6), 711–717 CrossRef CAS.
- S. K. Filippov, B. Porsch, O. Y. Sergeeva, A. S. Olifirenko, S. B. Lesnichin and N. S. Domnina, et al., Molecular properties of hybrid macromolecular antioxidants: Dextran hydrophobically modified by sterically hindered phenols, Eur. Phys. J. E: Soft Matter Biol. Phys., 2011, 34(11), 123 CrossRef CAS PubMed.
- R. Ragheb and U. Nobbmann, Multiple scattering effects on intercept, size, polydispersity index, and intensity for parallel (VV) and perpendicular (VH) polarization detection in photon correlation spectroscopy, Sci. Rep., 2020, 10(1), 21768 CrossRef CAS PubMed.
- S. P. Yeap, J. Lim, H. P. Ngang, B. S. Ooi and A. L. Ahmad, Role of Particle–Particle Interaction Towards Effective Interpretation of Z -Average and Particle Size Distributions from Dynamic Light Scattering (DLS) Analysis, J. Nanosci. Nanotechnol., 2018, 18(10), 6957–6964 CrossRef CAS PubMed.
- S. K. Filippov, T. A. P. Seery, J. Kříž, M. Hruby, P. Černoch and O. Sedláček, et al., Collective polyelectrolyte diffusion as a function of counterion size and dielectric constant, Polym. Int., 2013, 62(9), 1271–1276 CrossRef CAS.
- L. Skibinska, J. Gapinski, H. Liu, A. Patkowski, E. W. Fischer and R. Pecora, Effect of electrostatic interactions on the structure and dynamics of a model polyelectrolyte. II. Intermolecular correlations, J. Chem. Phys., 1999, 110(3), 1794–1800 CrossRef CAS.
- J. Bodycomb and M. Hara, Light Scattering Study of Ionomers in Solution. 5. CONTIN Analysis of Dynamic Scattering Data from Sulfonated Polystyrene Ionomer in a Polar Solvent (Dimethylformamide), Macromolecules, 1996, 28(24), 8190–8197 CrossRef.
- K. S. Schmitz, M. Lu, N. Singh and D. J. Ramsay, Comments on the “Ordinary-Extraordinary Phase Transition” of Poly(1ysine), Biopolymers, 1984, 23, 1637–1646 CrossRef CAS.
- R. Borsali, H. Nguyen and R. Pecora, Small-Angle Neutron Scattering and Dynamic Light Scattering from a Polyelectrolyte Solution: DNA, Macromolecules, 1998, 31(5), 1548–1555 CrossRef CAS.
- N. Koifman and Y. Talmon, Cryogenic electron microscopy methodologies as analytical tools for the study of self-assembled pharmaceutics, Pharmaceutics, 2021, 13, 1015 CrossRef CAS PubMed.
- D. E. Zhunuspayev, G. A. Mun and V. V. Khutoryanskiy, Temperature-responsive properties and drug solubilization capacity of amphiphilic copolymers based on N-vinylpyrrolidone and vinyl propyl ether, Langmuir, 2010, 26(10), 7590–7597 CrossRef CAS PubMed.
- S. Zhang, N. Guo, G. Wan, T. Zhang, C. Li and Y. Wang, et al., pH and redox dual-responsive nanoparticles based on disulfide-containing poly(β-amino ester) for combining chemotherapy and COX-2 inhibitor to overcome drug resistance in breast cancer, J Nanobiotechnol., 2019, 17, 109 CrossRef PubMed.
- J. He, Y. Qiao, H. Zhang, J. Zhao, W. Li and T. Xie, et al., Gold–silver nanoshells promote wound healing from drug-resistant bacteria infection and enable monitoring via surface-enhanced Raman scattering imaging, Biomaterials, 2020, 234, 119763 CrossRef CAS PubMed.
- Q. Wei, H. Arami, H. A. Santos, H. Zhang, Y. Li and J. He, et al., Intraoperative Assessment and Photothermal Ablation of the Tumor Margins Using Gold Nanoparticles. Advanced, Science, 2021, 8(5), 2002788 CAS.
- J. Zou, G. Jafr, E. Themistou, Y. Yap, Z. A. P. Wintrob and P. Alexandridis, et al., pH-Sensitive brush polymer-drug conjugates by ring-opening metathesis copolymerization, Chem. Commun., 2011, 47(15), 4493–4495 RSC.
- A. M. Chen, M. Zhang, D. Wei, D. Stueber, O. Taratula and T. Minko, et al., Co-delivery of doxorubicin and Bcl-2 siRNA by mesoporous silica nanoparticles enhances the efficacy of chemotherapy in multidrug-resistant cancer cells, Small, 2009, 5(23), 2673–2677 CrossRef CAS PubMed.
- F. Gao, J. Zhang, C. Fu, X. Xie, F. Peng and J. You, et al., iRGD-modified lipid-polymer hybrid nanoparticles loaded with isoliquiritigenin to enhance anti-breast cancer effect and tumor-targeting ability, Int. J. Nanomed., 2017, 12, 4147–4162 CrossRef CAS PubMed.
- G. Mandriota, R. Di Corato, M. Benedetti, F. De Castro, F. P. Fanizzi and R. Rinaldi, Design and Application of Cisplatin-Loaded Magnetic Nanoparticle Clusters for Smart Chemotherapy, ACS Appl. Mater. Interfaces, 2019, 11(2), 1864–1875 CrossRef CAS PubMed.
- C. Wong, T. Stylianopoulos, J. Cui, J. Martin, V. P. Chauhan and W. Jiang, et al., Multistage nanoparticle delivery system for deep penetration into tumor tissue, Proc. Natl. Acad. Sci. U. S. A., 2011, 108(6), 2426–2431 CrossRef CAS PubMed.
- W. Anderson, D. Kozak, V. A. Coleman, Å. K. Jämting and M. Trau, A comparative study of submicron particle sizing platforms: accuracy, precision and resolution analysis of polydisperse particle size distributions, J. Colloid Interface Sci., 2013, 405, 322–330 CrossRef CAS PubMed.
- M. Moghtaderi, A. Mirzaie, N. Zabet, A. Moammeri, A. Mansoori-Kermani and I. Akbarzadeh, et al., Enhanced Antibacterial Activity of Echinacea angustifolia Extract against Multidrug-Resistant Klebsiella pneumoniae through Niosome Encapsulation, Nanomaterials, 2021, 11(6), 1573 CrossRef CAS PubMed.
- A. Hemben, I. Chianella and G. J. T. Leighton, Surface Engineered Iron Oxide Nanoparticles Generated by Inert Gas Condensation for Biomedical Applications, Bioengineering, 2021, 8(3), 38 CrossRef CAS PubMed.
- A. Casillo, A. Fabozzi, I. R. Krauss, E. Parrilli, C. I. Biggs and M. I. Gibson, et al., Physicochemical Approach to Understanding the Structure, Conformation, and Activity of Mannan Polysaccharides, Biomacromolecules, 2021, 22(4), 1445–1457 CrossRef CAS PubMed.
- R. M. Glaeser, Specimen Behavior in the Electron Beam, Methods in Enzymology, Elsevier Inc., 1st edn, 2016, vol. 579, pp. 19–50 Search PubMed.
- M. Karuppasamy, F. Karimi Nejadasl, M. Vulovic, A. J. Koster and R. B. G. Ravelli, Radiation damage in single-particle cryo-electron microscopy: Effects of dose and dose rate, J. Synchrotron Radiat., 2011, 18(3), 398–412 CrossRef CAS PubMed.
- M. Mishyna, O. Volokh, Y. Danilova, N. Gerasimova, E. Pechnikova and O. S. Sokolova, Effects of radiation damage in studies of protein-DNA complexes by cryo-EM, Micron, 2017, 96, 57–64 CrossRef CAS PubMed.
| This journal is © The Royal Society of Chemistry 2023 |