
 Open Access Article
 This Open Access Article is licensed under a
 Creative Commons Attribution 3.0 Unported Licence
Anomalously abrupt switching of wurtzite-structured ferroelectrics: simultaneous non-linear nucleation and growth model†
Keisuke
Yazawa
 *ab,
John
Hayden
c,
Jon-Paul
Maria
c,
Wanlin
Zhu
c,
Susan
Trolier-McKinstry
c,
Andriy
Zakutayev
a and
Geoff L.
Brennecka
*b
*ab,
John
Hayden
c,
Jon-Paul
Maria
c,
Wanlin
Zhu
c,
Susan
Trolier-McKinstry
c,
Andriy
Zakutayev
a and
Geoff L.
Brennecka
*b
aMaterials Science Center, National Renewable Energy Laboratory, Golden, Colorado 80401, USA. E-mail: Yazawa@nrel.gov
bDepartment of Metallurgical and Materials Engineering, Colorado School of Mines, Golden, Colorado 80401, USA. E-mail: geoff.brennecka@mines.edu
cDepartment of Materials Science and Engineering and the Materials Research Institute, The Pennsylvania State University, University Park, Pennsylvania 16802, USA
First published on 3rd May 2023
Abstract
Ferroelectric polarization switching is one common example of a process that occurs via nucleation and growth, and understanding switching kinetics is crucial for applications such as ferroelectric memory. Here we describe and interpret anomalous switching dynamics in the wurtzite-structured nitride thin film ferroelectrics Al0.7Sc0.3N and Al0.94B0.06N using a general model that can be directly applied to other abrupt transitions that proceed via nucleation and growth. When substantial growth and impingement occur while nucleation rate is increasing, such as in these wurtzite-structured ferroelectrics under high electric fields, abrupt polarization reversal leads to very large Avrami coefficients (e.g., n = 11), inspiring an extension of the KAI (Kolmogorov–Avrami–Ishibashi) model. We apply this extended model to two related but distinct scenarios that crossover between (typical) behavior described by sequential nucleation and growth and a more abrupt transition arising from significant growth prior to peak nucleation rate. This work therefore provides a more complete description of general nucleation and growth kinetics applicable to any system while specifically addressing the anomalously abrupt polarization reversal behavior in new wurtzite-structured ferroelectrics.
New conceptsNucleation and growth processes are fundamental across materials science, from microstructure control in materials, cloud formation, and pharmaceutical manufacturing, to pollutant adsorption. Conventional nucleation and growth kinetics models provide growth dimensionality information under widely accepted nucleation scenarios (pre-existing nuclei, constant rate, or declining nucleation rate). Here we demonstrate a non-physical growth dimensionality >10 for polarization reversal of wurtzite ferroelectrics according to the conventional model. We introduce a new scenario that substantial growth and impingement occur while nucleation rate is increasing towards nucleation rate peak, which inspires an extension of the conventional model with incorporating peak nucleation rate. The extended model enables rational description of the anomalously abrupt polarization reversal observed in wurtzite ferroelectrics as well as traditional transitions depending on the peak nucleation rate time relative to growth. The concept is applicable to any other nucleation – growth systems, thereby offering a new comprehensive interpretation of the transition kinetics that is one of the fundamental processes across many fields of materials science. |
Introduction
The kinetic description of phase transformations via nucleation and growth represents one of the most fundamental concepts across many branches of science. More than 80 years ago, the equations now collectively referred to as Johnson–Mehl–Avrami–Kolmogorov (JMAK) were developed to describe and interpret the kinetics of isothermal crystallization via nucleation and growth.1–5 The predictable sigmoidal transition from state A to state B enables descriptions of inherently local phenomena of nucleation and impingement-limited growth from global measurements; this has been applied to a broad class of problems including microstructure development in high strength steels,6 cloud formation and weather forecasting,7,8 pharmaceutical manufacturing,9 pollution adsorption,10 and many others. In applying the same approach to ferroelectric switching, Ishibashi expressed what is now referred to as the Kolmogorov–Avrami–Ishibashi (KAI) model:11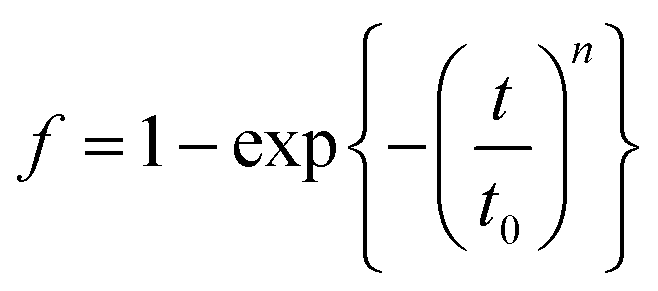 | (1) |
While Ishibashi explicitly addressed only two simple cases for nucleation during ferroelectric switching-either pre-existing nuclei (Avrami exponent, n, equals growth dimensionality, D) or a constant continuous nucleation rate as a result of concurrent nucleation and growth (n = 1 + D)12-the KAI model has been used extensively in the past five decades to interpret ferroelectric switching data in terms of nucleation rates and growth velocities, in many cases without explicit acknowledgement of the boundary conditions (the nucleation scenarios) associated with the original derivation.13–16 Indeed, in treating nucleation and growth as independent processes, there are three possible sequences (Fig. 1): (A) the nucleation-limited switching (NLS) model with no significant domain growth, (B) the KAI model governed by domain growth from pre-existing nuclei followed by impingement, and (C) a scenario in which nucleation rate peaks significantly after the onset of growth and impingement. Tagantsev, et al. rationalized n < 1 via the NLS model17–20 represented schematically in Fig. 1a. Such behavior, seen exclusively in ferroelectric switching, has been ascribed to a broad distribution of coercive fields resulting from a distribution of polarization directions relative to the applied electric field and/or a broad distribution of pinning depths for interface motion.21 Scenarios consistent with the KAI model, where nucleation dominates early-time processes followed by domain growth and impingement in 1, 2, or 3 dimensions, are represented in Fig. 1b. Several scanning probe studies15,22–25 have reported time-varying nucleation rates inconsistent with Ishibashi's assumptions, but no work has yet addressed the scenario shown in Fig. 1c in which significant growth occurs prior to and throughout a peak in nucleation rate.
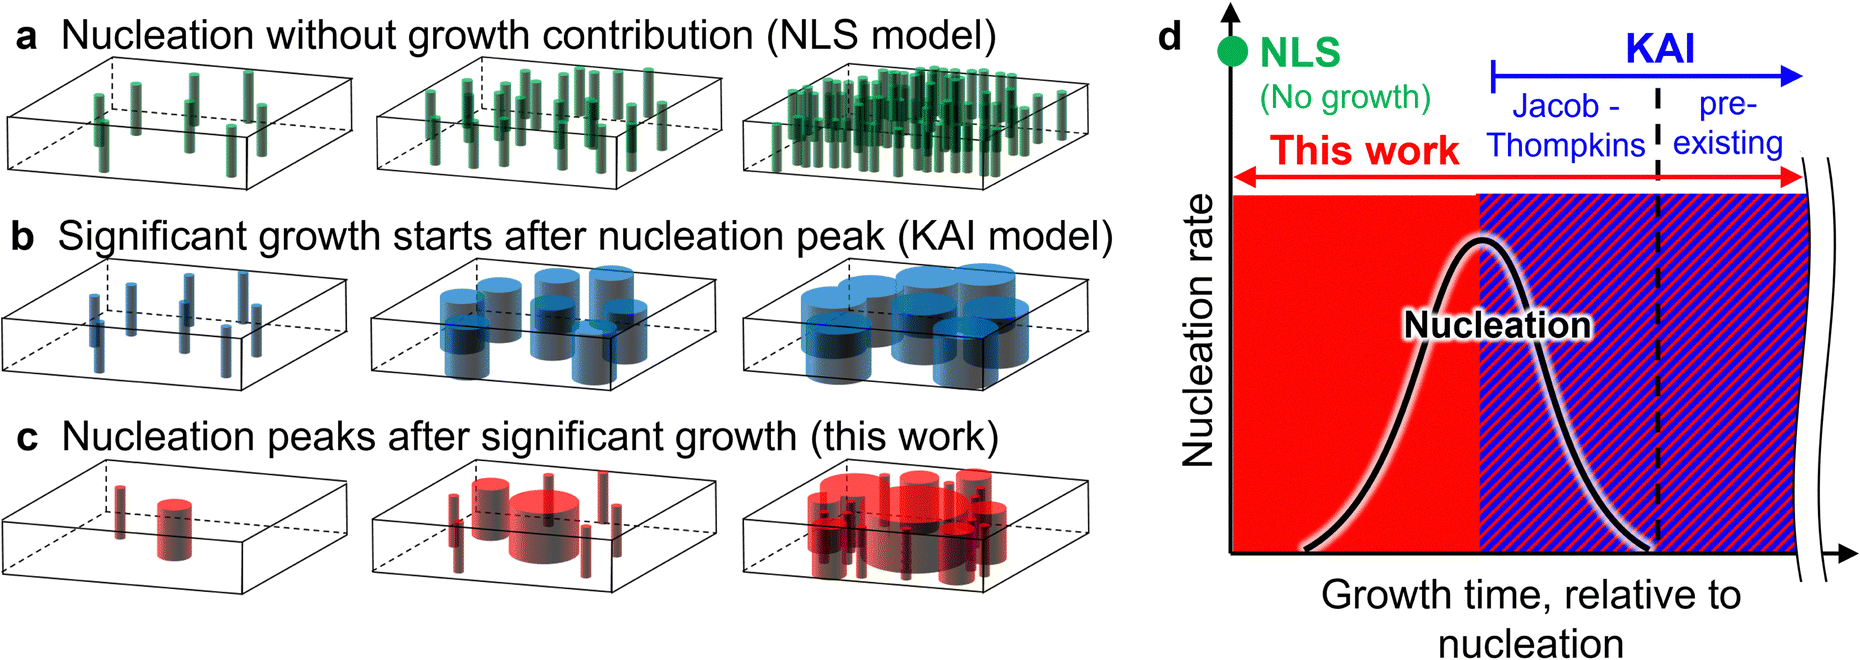 | ||
| Fig. 1 Prior work has successfully described the ferroelectric switching process according to (a) nucleation-limited switching with no significant domain growth, (b) the KAI model in which nucleation can be described by a population of pre-existing nuclei and/or a (Jacob–Thompkins) decreasing nucleation rate followed by growth and impingement. (c) Here, the KAI model is extended to include scenarios in which nucleation rate peaks significantly after the onset of growth. This is done by (d) describing all nucleation processes according to a power law distribution and relaxing the assumptions that restrict the KAI model to specific cases in which nucleation rate peaks prior to the onset of significant growth. | ||
As Cahn noted in his classic rederivation,26 the JMAK model itself has no restrictions against time-varying nucleation and growth rates, but n is often overinterpreted as necessarily being equal to either the dimensionality of growth (n = D) or one plus the dimensionality of growth (n = 1 + D). A decaying nucleation rate following the Jacobs–Thompkins equation27 has been shown to be consistent with a mixed scenario (D ≤ n ≤ 1 + D) and is commonly applied to solid state chemistry and crystal growth,28,29 but examples requiring a more nuanced description of nucleation contributions have been limited,25,30–33 such that the D ≤ n ≤ 1 + D interpretation is pervasive. Elaboration of nucleation and growth kinetics beyond D ≤ n ≤ 1 + D is required to capture the scenario shown in Fig. 1c.
We show here that the switching of Al0.7Sc0.3N and Al0.94B0.06N wurtzite-structured ferroelectrics can contradict the D ≤ n ≤ 1 + D interpretation of the Avrami exponent, as this would require growth in as many as 10 dimensions to fit measured data, which is clearly non-physical. Moreover, by extending the KAI model to account for a time-varying nucleation rate described with a derivative of a sigmoid function (Fig. 1d), both this abrupt response and those well-described by the KAI model can be fit and physically interpreted, regardless of whether the transformation in question is ferroelectric switching, solidification, cloud formation, pharmaceutical manufacturing, or any other example of nucleation and growth.
Results
Anomalous switching kinetics and model extension
Wurtzite-structured nitride ferroelectrics often exhibit square hysteresis loops,34–37 a characteristic known to relate to switching kinetics.38Fig. 2a plots the normalized polarization (P/Pr, where Pr is remanent polarization) vs. normalized field (E/Ec, where Ec is coercive field) for the prototype ferroelectrics (blue) single crystal LiTaO3 and (green) polycrystalline thin film PbZr0.53Ti0.47O3 (PZT) against polycrystalline (orange) Al0.7Sc0.3N and (red) Al0.94B0.06N thin films (see Methods).37,39 As shown in Fig. 2b, the polarization evolution with time for each of these samples results in excellent fits to the data with Avrami exponents n = 2 for LiTaO3 (traditional KAI),40n < 1 for PZT (NLS),19 and n > 4 for Al0.7Sc0.3N and Al0.94B0.06N. Forcing n = 2 or 4 (Fig. 2c and d) for Al0.7Sc0.3N and Al0.94B0.06N clearly results in unacceptable fits, but n > 4 defies direct physical interpretation using the common D ≤ n ≤ 1 + D modality of the KAI model. | ||
| Fig. 2 New wurtzite-structured ferroelectrics require an update to switching models. (a) Recently discovered wurtzite-structured nitride ferroelectrics exhibit hysteresis loops that are far more square than those of prototype ferroelectrics such as single crystal LiTaO3 and thin film PZT. (b) While polarization evolution of a LiTaO3 crystal and PZT thin film can be fit with KAI and NLS interpretations, respectively,19,40 the Avrami exponent required to fit the data for Al0.7Sc0.3N and Al0.94B0.06N has no physical interpretation according to existing models. (c) Avrami exponent to fit Al0.7Sc0.3N data is 7. (d) Avrami exponent to fit Al0.94B0.06N data is 11. | ||
We therefore revisit the classic JMAK model without forcing adherence to either the coalescence-dominated KAI model (1 < n < 4) or the nucleation-limited NLS model (n < 1). Based on the assumption of an infinite system with growth ending by impingement, the transformed fraction as a function of time t can be represented as,3
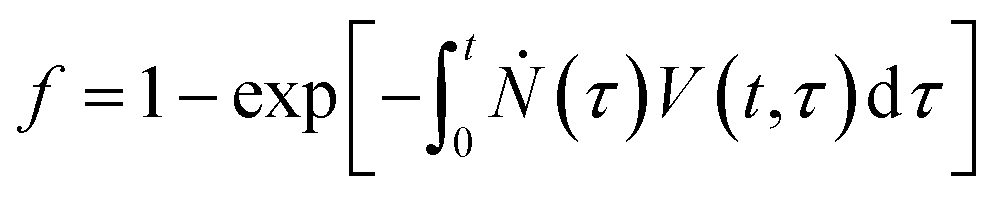 | (2) |
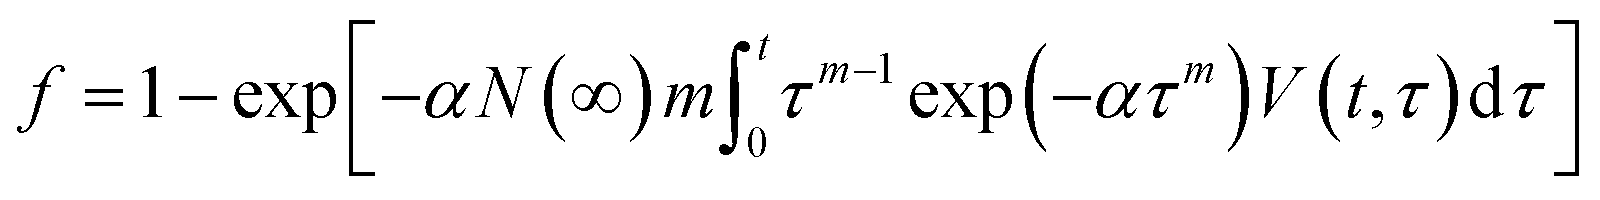
To incorporate a nucleation rate peak as discussed above (Fig. 1d), we employ a saturation function including the mth order nucleation rate as a function of time (See Methods):
| Ṅ(τ) = αN(∞)mτm−1exp(−ατm) | (3) |
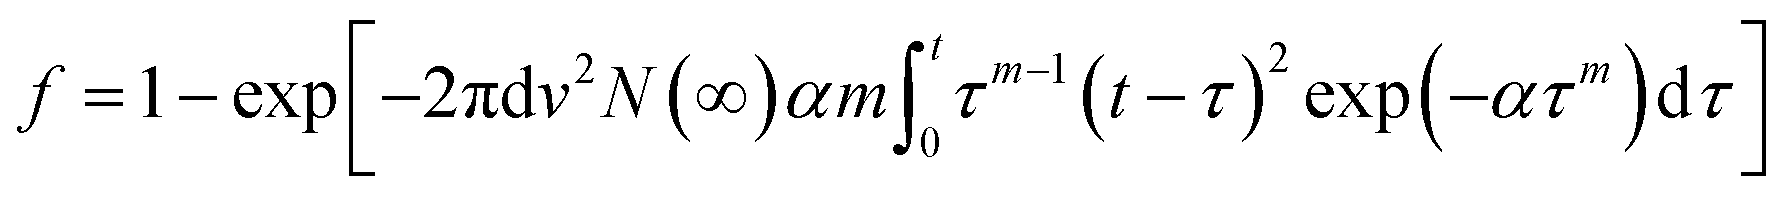 | (4) |
The time evolution of switching can then be fitted using parameters v, α and m, which describe the growth speed, nucleation rate peak position and shape, respectively. As shown in eqn (4), it is not necessary to decouple the growth velocity from the saturated density of nuclei, so a coupled variable vN(∞)1/2 is employed for calculation. A qualitative exploration of the effects of each of these parameters independently offers helpful insights. Changes in growth speed shift the polarization evolution curve along the logarithmic time axis; this is similar to the effects of an electric field on t0 in the classic KAI model. The constant α determines the nucleation peak position. The exponent m stands for the mth order nucleation rate, which represents the experimentally observed nucleation rate peak, not considered in previous KAI and KAI-derived models.13,44,45 From the fitted parameters vN(∞)1/2, α and m, two characteristic times, which are the nucleation peak time τpeak and average impingement time ![[t with combining macron]](https://www.rsc.org/images/entities/i_char_0074_0304.gif) imp due to domain growth, can be calculated (see Methods).
imp due to domain growth, can be calculated (see Methods).
Electric field dependent nucleation vs. growth competition
Experimental results of electric field dependence of polarization evolution for Al0.7Sc0.3N and Al0.94B0.06N thin films validate the extended model (Fig. 3). The polarization evolution curves shift to faster times with larger applied electric field (Fig. 3a and b), conceptually consistent with Merz's law46 and in a manner similar to comparable studies on perovskite oxide ferroelectric thin films.19,25,47 In addition to the shift, the slope of the polarization increase steepens with increasing applied electric field for both materials. This slope change is also seen in conventional ferroelectrics,19,47 though only the recent study from Nath, et al., has reported n values >3.25 In contrast, the KAI fitted Avrami exponents of Al0.7Sc0.3N and Al0.94B0.06N films reach 7 and 11, respectively, at high electric fields (Fig. 2c, d).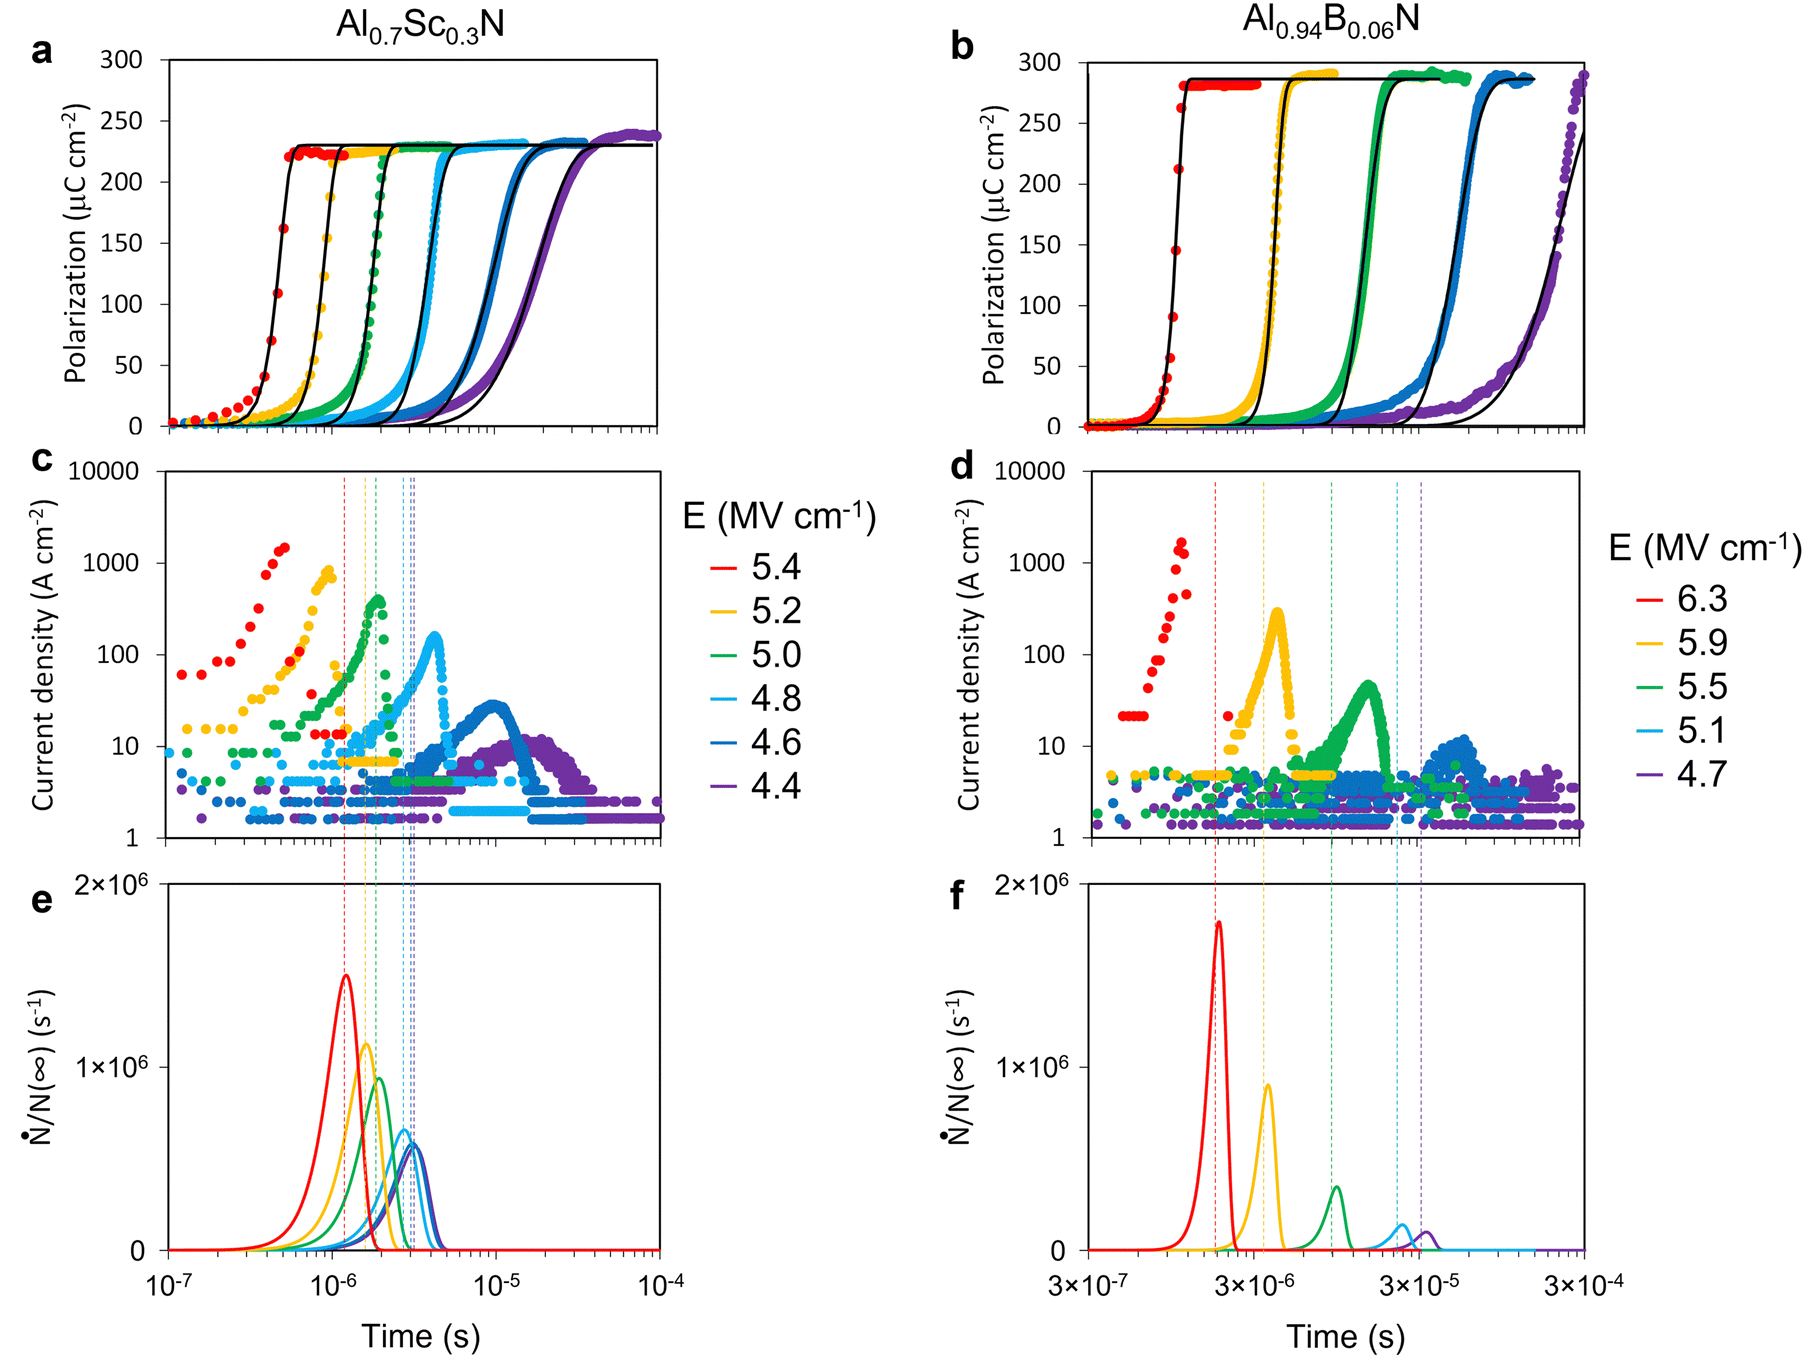 | ||
| Fig. 3 Evolution of switched polarization under various driving electric fields. (a) Electric field dependence of the polarization vs. time curves for Al0.7Sc0.3N and (b) for Al0.94B0.06N. Colored data points in the polarization – time curves represent measured data; black lines represent simulated results using the extended KAI model with m = 5 for Al0.7Sc0.3N and m = 9 for Al0.94B0.06N. Switching current vs. time curve for (c) Al0.7Sc0.3N and (d) for Al0.94B0.06N. Normalized nucleation rate curves used for the simulation for (c) Al0.7Sc0.3N and (d) Al0.94B0.06N. The nucleation peak positions are highlighted to compare to the current peak positions. | ||
Our extended model describes both abrupt transitions (n > 4) seen in the wurtzite-structured ferroelectrics and conventional KAI transitions (1 < n < 4). The black solid lines in Fig. 3a and b are numerically simulated curves (see Methods) based on the extended model for each applied electric field. The value of m is set equal to 5 for Al0.7Sc0.3N and 9 for Al0.94B0.06N in the simulation. Note that the m values represent the order of nucleation rate, different from the n values that are fitted with the classic KAI model. As noted earlier, the model assumes 2-dimensional growth, so without resorting to non-physical growth dimensionality, the extended model accounts for and provides mechanistic information about the steep evolution of the polarization reversal process via the non-linear nucleation rate.
The competition between nucleation and growth is illuminated in the electric field dependence of the kinetics. The actual charge flows (switching current density) attributed to the ferroelectric switching for Al0.7Sc0.3N and Al0.94B0.06N are shown in Fig. 3c and d, representing the significant growth event. Normalized nucleation rate curves used for the simulations, which are determined by α (see Methods), are shown in Fig. 3e and f. The coupled variable vN(∞)1/2 related to domain wall (growth) velocity is chosen to fit the experimental curves (see Methods). At higher electric fields, the nucleation peak (dotted line) occurs after the switching current peak; in other words, significant 2-dimensional lateral domain growth and coalescence occur while the nucleation rate is increasing. Simultaneous nucleation and growth produce the abrupt transition of the model, fitting the steep slope observed under high electric fields. Conversely, under lower electric fields, the nucleation rate peaks before the switching current peak, equivalent to the presence of preexisting nuclei before significant domain growth, precisely as assumed in the KAI model. In such cases, any value of m produces the same overall result because the shape of the time-varying nucleation peak is irrelevant if growth is insignificant while nucleation is occurring. Thus, when nucleation peaks prior to the onset of significant growth, the extended model collapses to precisely the delta (n = D) or Jacobs–Thompkins decay (n = 1 + D) of the KAI model. Between these extremes of complete transition prior to peak nucleation and peak nucleation well before substantial growth, there is a gradual change in the slope of the polarization reversal as there is a crossover in the relative positions of the nucleation peak and the switching current peak.
The crossover can be visualized in terms of the characteristic times for both nucleation and growth: the nucleation peak time τpeak and average impingement time imp. Each experimental result can be fit with a range of τpeak (or α) and imp (or vN(∞)1/2); i.e., different pairs of τpeak and imp can produce the same simulation curve (Fig. S1, ESI†). Fig. S2 (ESI†) shows the fittable range of τpeak and imp for each experimental result. A slower τpeak needs a faster imp to fit the experimental curves, and such fits agree well at higher electric fields, while faster τpeak and slower imp pairs fit better for lower electric fields. The condition τpeak < imp means that significant growth and impingement happen after peak nucleation, corresponding to the assumptions of the traditional KAI model, but τpeak > imp is not covered in earlier models. Our extended model covers both regions. Domain wall velocities calculated from the fitted range of imp (or vN(∞)1/2) can have reasonable values (less than the speed of sound in AlN48) at any possible nucleation density from a single nucleation site in a 1960 μm2 device measured here (50 μm diameter) to a nucleation site for each unit cell (Fig. S3 and S4, ESI†).
Cycle dependent nucleation vs. growth competition
The need to extend the classic KAI model to address abrupt switching and competition between nucleation vs. growth dominance is further validated by a closer look at the previously-described wakeup process of Al0.94B0.06N.49 The Al0.94B0.06N film examined here exhibits comparable wakeup behavior (Fig. S5, ESI†). The successive PUND sequences are applied through the top electrode (Fig. S6, ESI†). Polarization evolution curves show no switching in the first cycle, partial switching at lower fields for the 2nd cycle, and gradually later initiation of a more abrupt transition for cycles >3 (Fig. 4a). As the slope of the curve gets steeper, the KAI n also increases from 2 (2nd cycle) to 11 (20th cycle). The fittable range of τpeak, represented as brown bars in Fig. 4b, is extracted from the polarization evolution and shifts slower as cycle number increases. More importantly, the transition from τpeak <imp (KAI) to τpeak > imp (beyond KAI) occurs with increasing cycles as seen in the fitting quality map as a function of fitting parameters τpeak and imp (Fig. S7, ESI†), which is the root cause of the change in the transition curve slope.
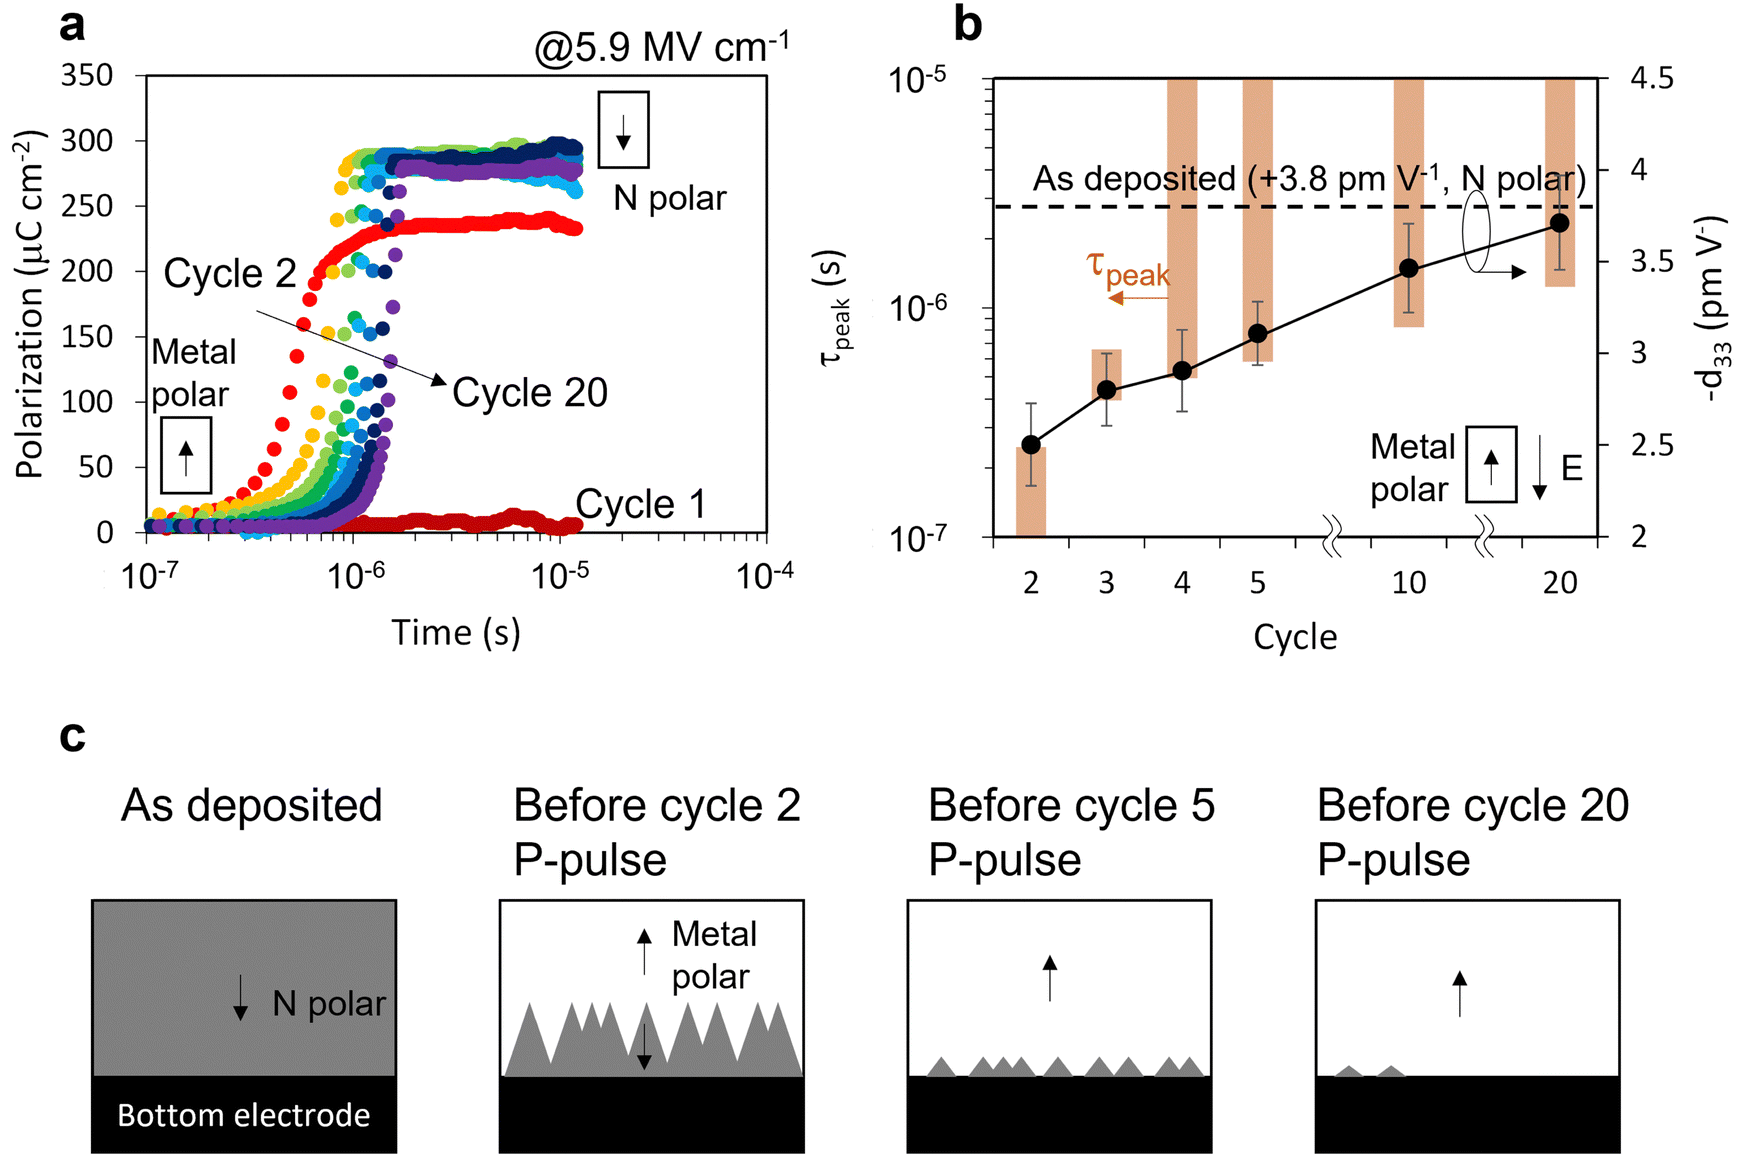 | ||
| Fig. 4 Kinetics during wakeup process in Al0.94B0.06N. (a) Polarization evolution obtained from P–U pulses. Curve shift and slope change are observed. (b) Fittable range of τpeak from polarization evolution curves using extended KAI model (brown bars) and piezoelectric coefficient d33 (black dots) for each cycle before switching dynamics measurement. Error bars in d33 represent a standard deviation of successive 20 measurements. At fewer cycle, d33 decreases (mixed polarity) and τpeak gets earlier (instant nucleation). (c) Schematic of domain evolution with number of cycles. Opposite polarity mixing seen at 2nd cycles relieves with cycles. The pre-existing opposite polarity works as nuclei, corresponding to early τpeak at fewer cycles. | ||
The change in τpeak with cycling is key to the wakeup behavior and is verified through the evolution of N-polar and metal-polar mixing. These films were N-polar as deposited; the PUND pre-pulse to the top electrode is intended to set the sample to metal-polar, then application of a P pulse switches the film (back) to the N-polar (downward polarization) state. Piezoelectric d33 measurements prior to each P pulse confirm the polarity and show an intermediate-magnitude response consistent with incomplete poling in the film (see Methods and Fig. S6, ESI†). The magnitude of d33 measured prior to the P pulse gradually increases with cycle number as overlaid in Fig. 4b, direct evidence of the existence and decreasing volume fraction of N-polar regions even before the P pulse application. Such N-polar regions function as pre-existing nucleation sites for switching to the N-polar state during a P pulse, hence the earlier τpeak. With increasing cycles, the volume fraction of residual N-polar regions decreases and d33 approaches that of the as-deposited film (schematic in Fig. 4c).
Discussion
Transitions that occur via nucleation and growth can be dominated by either growth speed or nucleation rate. When the activation field for nucleation is smaller than that for growth, abrupt transitions can defy the traditional KAI model. It is noteworthy that the model presented in this study illuminates the characteristic times for nucleation (τpeak) and growth (imp), which are often convoluted and difficult to separate. The discussion here uses the language of ferroelectric switching, but just like the JMAK foundation on which it is based, the model and interpretation are equally valid for any form of phase transition that meets the underlying assumptions and boundary conditions; for the examples described here, those are simply isotropic 2-dimensional growth within an infinite system with growth ending by impingement.
It has been reported that the activation field of nucleation is smaller than that of growth for switching in Pb(Zr,Ti)O3,23 and peaking nucleation rates have also been reported in both Pb(Zr,Ti)O315,22,23 and Y:HfO2.24 Indeed, it has commonly been seen that n increases with higher electric field in perovskite ferroelectric switching,19,25,47 which can be interpreted as a sign of approaching the crossover point. Avrami exponents n > 4 were reported in one such study but mechanistic discussion was limited.25 To observe n > 4, the crossover point must be in the measurement time range. Although the origin of the slow crossover point in the wurtzite-structured ferroelectrics is not known, nucleation may be hindered by the large interfacial energy of head-to-head polar boundaries due to the large spontaneous polarization (∼110 μC cm−2 for Al0.7Sc0.3N and ∼140 μC cm−2 for Al0.94B0.06N as seen in Fig. 3a and b), and/or a strong bond to be broken to initiate nucleation. The fact that the crossover point of Al0.7Sc0.3N (2 μs seen in Fig. S2a, ESI†) is earlier in time than Al0.94B0.06N (5 μs seen in Fig. S2b, ESI†) is consistent with the head-to-head interfacial energy discussion attributed to the large remanent polarization. This could also explain why, despite significantly faster switching of perovskite oxide films,50,51 only a single study has observed similar behavior.25 Slow nucleation coupled with rapid transition is analogous to supercooling a liquid to induce fast crystallization52 or dendritic growth, though without diffusion-limited kinetics. Thus, the phenomenon can be generalized to any nucleation-growth scenario with slow nucleation caused by a large nucleation energy barrier or limited diffusion.
Few studies of nucleation-growth kinetics have reported n > 4 in any phase transformation system. Toth reported n values as high as 4.87 for the crystallization of a quenched and reheated Metglas 2605 alloy (iron-based alloy with silicon and boron additives) and interpreted this value as indicative of simultaneous nucleation and growth with a nucleation rate that increased with time.30 Pradell et al. reported values of n that slightly exceeded 4 only in the very early stages of the primary crystallization of Fe78Si22 from amorphous Fe73.5Si17.5CuNb3B5.31 Jeon et al. demonstrated two step phase transition kinetics with n = 5.75 for the first step of the Ge2Sb2Te5 crystallization process. Those papers briefly noted the importance of nucleation contribution to the n > 4 values, and an analysis of a nucleation effect on the Ge2Sb2Te5 crystallization kinetics exists,53 but no rational explanation and formulation of this abrupt transition had been explored. Recent work from Nath et al. reported n > 4 values for select regions of epitaxial PZT thin films via scanning probe and connected the large n values with a lack of existing nucleation sites, but further mechanistic discussion was limited.25 The extended model demonstrated in this work rationalizes the phenomena of such rapid transitions via characteristic nucleation and growth times and is also applicable to the nucleation–growth mechanism in crystallization processes beyond ferroelectric switching.
Conclusions
In summary, we measured rapid polarization reversal in new wurtzite-structured ferroelectrics, which manifests as large Avrami exponents that are non-physical based upon the common (over) interpretation of the traditional KAI model. An extension to the KAI model is proposed that incorporates non-linear time-varying nucleation rates such as those that have been experimentally reported. This extended model captures the switching behavior of both the new wurtzite-structured ferroelectrics as well as conventional ferroelectrics, highlighting the distinct nucleation and growth events and competition between them. When peak nucleation occurs prior to significant growth, our extended KAI model collapses to the original KAI model. However, the extended model also covers regimes where significant growth occurs while the nucleation rate is still increasing, corresponding to a larger activation field for growth than for nucleation. This work explains both the abrupt switching behavior and wakeup behavior of the new wurtzite-structured nitrides using an extension of the classic KAI model that offers a framework for better understanding nucleation and growth kinetics in general.Methods
Kinetics model
Ishibashi approximated nucleation using either (Fig. 1d, pre-existing) a delta function at t = 0 or (Fig. 1d, Ishibashi) a constant. Deutscher later extended this29 to describe a decreasing nucleation rate with time (Fig. 1d, Jacob–Tompkins) using the Jacob–Tompkins equation27| N(τ) = N(∞){1 − exp(−ατ)} | (5) |
| Ṅ(τ) = αN(∞)exp(−ατ) | (6) |
To realize the peaked nucleation rate seen in the experimental results, a non-linear nucleation rate at the beginning with subsequent decay is employed, namely
| (τ) = N(∞)[1 − exp(−ατm)] | (7) |
Incorporating this form of the nucleation rate into the original JMAK model, eqn (2), the volume fraction transformed can be expressed as:
 | (8) |
| V(t, τ) = 2πdv2(t − τ)2 | (9) |
Nucleation peak time and average impingement time
The nucleation rate peak time τpeak can be derived simply from the derivative of the nucleation rate (eqn (3)): | (10) |
A solution of the equation can be expressed as:
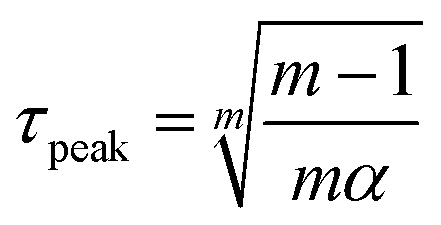 | (11) |
The average impingement time can be elucidated from the fitted velocity v and N(∞). In the case of 2-dimensional growth, it is convenient to consider the areal nucleus density N(∞)2D, which is expressed as:
| N2D(∞) = dN(∞) | (12) |
![[l with combining macron]](https://www.rsc.org/images/entities/i_char_006c_0304.gif) nearest is:
nearest is: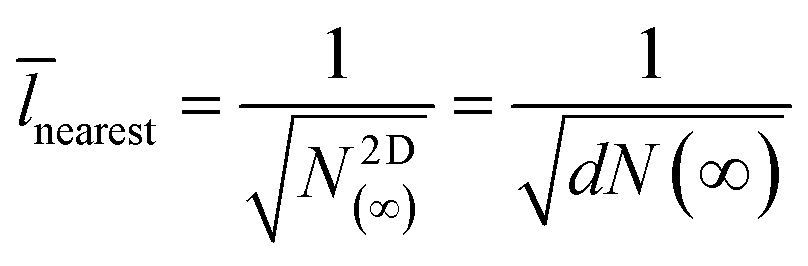 | (13) |
Therefore, the average impingement time imp can be expressed as:
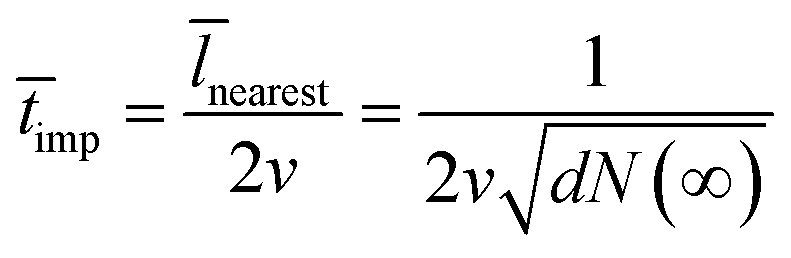 | (14) |
Numerical calculation and fitting
The simulated kinetic curves were generated using the Riemann sum method based on the extended KAI model, eqn (4). The subinterval width was consistent with the sampling width of experimental acquisition (40 ns) to enable direct comparison. The simulation – experimental curve fitting was conducted with the generalized reduced gradient method to seek the minimal sum of squares error, with variables α and vN(∞)1/2.Sample synthesis
The 250 nm Al0.7Sc0.3N film was deposited on Pt/TiOx/SiO2/Si substrate55via reactive RF magnetron sputtering using the following growth conditions: 2 mTorr of Ar/N2 (15/5 sccm flow), and a target power density of 6.6 W cm−2 on a 2′′ diameter Al0.7Sc0.3 alloy target (Stanford Advanced Materials). The substrate was rotated and heated to 400 °C during deposition. The base pressure, partial oxygen and water vapor pressure at 400 °C were < 2 × 10⁻⁷ torr, PO2 < 2 × 10⁻⁸ torr and PH2O < 1 × 10⁻⁷ torr, respectively. The film shows (001) textured wurtzite phase without any secondary crystalline phases or orientations (Fig S8a, ESI†).The 250 nm Al0.94B0.06N film was deposited on W/c-sapphire via magnetron co-sputtering using the following growth conditions: 2 mTorr of Ar/N2 (5/15 sccm flow), with target power densities of 12.5 W cm−2 (pulsed DC) on a 2′′ diameter Al target (Kurt J. Lesker) and 4.75 W cm−2 (RF) on a 2′′ diameter BN target (Kurt J. Lesker). The substrate was rotated and heated to 325 °C during deposition. The chamber base pressure at deposition temperature was < 5 × 10⁻⁷ torr. The film shows (001) textured wurtzite phase without any secondary crystalline phases or orientations (Fig S8b, ESI†).
Top Au (100nm)/Ti (5 nm) contacts 50 and 200 μm in diameter were deposited on the Al0.7Sc0.3N and Al0.94B0.06N films via electron beam evaporation through a photolithographically patterned mask.
Measurements
Ferroelectric polarization – electric field hysteresis loop measurements were taken with a Precision Multiferroic system from Radiant Technologies. The frequency of the applied triangle excitation voltage was 10 kHz.The polarization switching kinetics were determined with the switching current extracted by positive – up – negative – down (PUND) measurements,56 namely by subtracting the current signal associated with the second same-polarity pulse (including capacitive current and resistive current) from that of the first pulse (including switching current, capacitive current and resistive current). The system was designed to cover <±200 V and >200 ns measurement range to observe sample limited ferroelectric switching in sub-microsecond order for 250 nm thick wurtzite-structured ferroelectric films. The data were compared to that for a LiTaO3 single crystal, whose switching kinetics are known to follow the KAI model,14 it was found that the Avrami exponent for the LiTaO3 sample remains 2 across all measurement conditions, consistent with prior studies40
Cycling dependence of switching kinetics, piezoelectric properties, and etching effects were compiled after applying different numbers of PUND pulses (Fig. S6, ESI†) to otherwise identical electrodes across the same specimen using a non-sequential pattern. Polarization evolution curves were determined from the P–U pulses of each cycle. Piezoelectric coefficients d33 were measured using a double beam laser interferometer from aixACCT prior to the P pulse for each PUND cycle.
Data and materials availability
The data affiliated with this study are available from the corresponding author upon reasonable request. The views expressed in the article do not necessarily represent the views of the DOE or the U.S. Government.Author contributions
KY conceived the study and carried out Al0.7Sc0.3N film synthesis, all the characterization, measurement system development, kinetic model development, simulation, and analysis. JH and JPM synthesized Al0.94B0.06N film. WZ synthesized the Pt/TiOx/SiO2/Si substrates. KY, GLB, AZ and STM conducted data interpretation. KY and GLB created effective visualization. GLB and AZ supervised KY. KY, GLB, STM, and AZ composed the original manuscript. All authors contributed to the discussion and reviewing and editing the manuscript.Conflicts of interest
There are no conflicts to declare.Acknowledgements
This work was co-authored by Colorado School of Mines and the National Renewable Energy Laboratory, operated by the Alliance for Sustainable Energy, LLC, for the U.S. Department of Energy (DOE) under Contract No. DE-AC36-08GO28308. Funding was provided by the DARPA Tunable Ferroelectric Nitrides (TUFEN) program (DARPA-PA-19-04-03) as a part of Development and Exploration of FerroElectric Nitride Semiconductors (DEFENSE) project (electrical characterization), by the Office of Science (SC), Office of Basic Energy Sciences (BES) as part of the Early Career Award “Kinetic Synthesis of Metastable Nitrides” (AlScN material synthesis), and by the National Science Foundation under Grant No. DMR-2119281 (data analysis, and manuscript preparation). Development of the Al1-xBxN film growth methods was supported by grants DARPA grants HR0011-20-9-0047 and W911NF-20-20274, while the film deposition was supported as part of the center for 3D Ferroelectric Microelectronics (3DFeM), an Energy Frontier Research Center funded by the U.S. Department of Energy (DOE), Office of Science, Basic Energy Sciences under Award Number DE-SC0021118. We also thank Dr Kevin Talley of Mines and NREL and Danny Drury of Mines, NREL, and the Army Research Laboratory for their assistance with sputtering system modification and setup.References
- A. N. Kolmogorov, Izv. Kazan. Fil. Akad. Nauk SSSR, Ser. Fiz.-Mat. Tekh. Nauk, 1937, 3, 355–359 Search PubMed.
- W. Johnson and R. F. Mehl, Trans. Am. Inst. Min. Eng, 1939, 135, 416–458 Search PubMed.
- M. Avrami, J. Chem. Phys., 1939, 7, 1103–1112 CrossRef CAS.
- M. Avrami, J. Chem. Phys., 1940, 8, 212–224 CrossRef CAS.
- M. Avrami, J. Chem. Phys., 1941, 9, 177–184 CrossRef CAS.
- E. S. Davenport and E. C. Bain, Metall. Trans., 1930, 1, 3503–3530 CrossRef.
- R. Zhang, A. Khalizov, L. Wang, M. Hu and W. Xu, Chem. Rev., 2012, 112, 1957–2011 CrossRef CAS PubMed.
- V. I. Khvorostyanov and J. Curry, Khvorostyanov and Curry's (2014) book Frontmatter, 2014.
- X. Wang, J. M. Gillian and D. J. Kirwan, Cryst. Growth Des., 2006, 6, 2214–2227 CrossRef CAS.
- A. Maged, P. D. Dissanayake, X. Yang, C. Pathirannahalage, A. Bhatnagar and Y. S. Ok, Environ. Res., 2021, 202, 111693 CrossRef CAS PubMed.
- Y. Ishibashi and Y. Takagi, J. Phys. Soc. Jpn., 1971, 31, 506–510 CrossRef CAS.
- R. W. Balluffi, S. M. Allen and W. C. Carter, Kinetics of Materials, Wiley, 2005 Search PubMed.
- V. Shur, E. Rumyantsev and S. Makarov, J. Appl. Phys., 1998, 84, 445–451 CrossRef CAS.
- V. Y. Shur, E. V. Nikolaeva, E. I. Shishkin, V. L. Kozhevnikov, A. P. Chernykh, K. Terabe and K. Kitamura, Appl. Phys. Lett., 2001, 79, 3146–3148 CrossRef CAS.
- A. Gruverman, B. J. Rodriguez, C. Dehoff, J. D. Waldrep, A. I. Kingon, R. J. Nemanich and J. S. Cross, Appl. Phys. Lett., 2005, 87, 082902 CrossRef.
- J. E. Daniels, C. Cozzan, S. Ukritnukun, G. Tutuncu, J. Andrieux, J. Glaum, C. Dosch, W. Jo and J. L. Jones, J. Appl. Phys., 2014, 115, 224104 CrossRef.
- A. K. Tagantsev, I. Stolichnov, N. Setter, J. S. Cross and M. Tsukada, Phys. Rev. B, 2002, 66, 214109 CrossRef.
- I. Stolichnov, A. Tagantsev, N. Setter, J. S. Cross and M. Tsukada, Appl. Phys. Lett., 2003, 83, 3362–3364 CrossRef CAS.
- J. Y. Jo, H. S. Han, J. G. Yoon, T. K. Song, S. H. Kim and T. W. Noh, Phys. Rev. Lett., 2007, 99, 267602 CrossRef CAS PubMed.
- P. Buragohain, C. Richter, T. Schenk, H. Lu, T. Mikolajick, U. Schroeder and A. Gruverman, Appl. Phys. Lett., 2018, 112, 222901 CrossRef.
- O. Boser, J. Appl. Phys., 1987, 62, 1344–1348 CrossRef CAS.
- B. D. Huey, R. Nath Premnath, S. Lee and N. A. Polomoff, J. Am. Ceram. Soc., 2012, 95, 1147–1162 CrossRef CAS.
- A. Gruverman, D. Wu and J. F. Scott, Phys. Rev. Lett., 2008, 100, 097601 CrossRef CAS PubMed.
- P. Buragohain, A. Erickson, T. Mimura, T. Shimizu, H. Funakubo and A. Gruverman, Adv. Funct. Mater., 2022, 32, 2108876 CrossRef CAS.
- R. Nath, N. A. Polomoff, J. Song, T. J. Moran, R. Ramesh and B. D. Huey, Adv. Electron. Mater., 2022, 8, 2101389 CrossRef CAS.
- J. W. Cahn, Materials Research Society Symposium - Proceedings, Materials Research Society, vol. 398, 1996, pp. 425–437 Search PubMed.
- P. W. M. Jacobs and F. C. Tompkins, Chemistry of the solid state, Butterworths, London, 1955 Search PubMed.
- A. K. Galwey, R. Spinicci and G. T. Guarini, Proc. R. Soc. London, Ser. A, 1981, 378, 477–505 CAS.
- R. L. Deutscher and S. Fletcher, J. Electroanal. Chem., 1990, 277, 1–18 CrossRef CAS.
- J. Tóth, Mater. Res. Bull., 1978, 13, 691–696 CrossRef.
- T. Pradell, D. Crespo, N. Clavaguera and M. T. Clavaguera-Mora, J. Phys.: Condens. Matter, 1998, 10, 3833–3844 CrossRef CAS.
- T. H. Jeong, M. R. Kim, H. Seo, S. J. Kim and S. Y. Kim, J. Appl. Phys., 1999, 86, 774–778 CrossRef CAS.
- R. A. Livingston, Cem. Concr. Res., 2000, 30, 1853–1860 CrossRef CAS.
- S. Fichtner, N. Wolff, F. Lofink, L. Kienle and B. Wagner, J. Appl. Phys., 2019, 125, 114103 CrossRef.
- K. Yazawa, D. Drury, A. Zakutayev and G. L. Brennecka, Appl. Phys. Lett., 2021, 118, 162903 CrossRef CAS.
- D. Drury, K. Yazawa, A. Mis, K. Talley, A. Zakutayev and G. L. Brennecka, Phys. Status Solidi RRL, 2021, 15, 2100043 CrossRef CAS.
- J. Hayden, M. D. Hossain, Y. Xiong, K. Ferri, W. Zhu, M. V. Imperatore, N. Giebink, S. Trolier-Mckinstry, I. Dabo and J. P. Maria, Phys. Rev. Mater., 2021, 5, 044412 CrossRef CAS.
- Y. Ishibashi and H. Orihara, Integr. Ferroelectr., 1995, 9, 57–61 CrossRef.
- K. Yazawa, D. Drury, A. Zakutayev and G. L. Brennecka, Appl. Phys. Lett., 2021, 118, 162903 CrossRef CAS.
- K. Yazawa, A. Zakutayev and G. L. Brennecka, Sensors, 2022, 22, 9569 CrossRef PubMed.
- B. Shizgal and J. C. Barrett, J. Chem. Phys., 1989, 91, 6505–6518 CrossRef CAS.
- V. Spillar and D. DolejS, J. Pet., 2013, 54, 913–931 CrossRef CAS.
- Z. Ding and J. E. Spruiell, J. Polym. Sci., Part B: Polym. Phys., 1997, 35, 1077–1093 CrossRef CAS.
- Y. A. Genenko, R. Khachaturyan, J. Schultheiß, A. Ossipov, J. E. Daniels and J. Koruza, Phys. Rev. B, 2018, 97, 144101 CrossRef CAS.
- S. Zhou, L. You, A. Chaturvedi, S. A. Morris, J. S. Herrin, N. Zhang, A. Abdelsamie, Y. Hu, J. Chen, Y. Zhou, S. Dong and J. Wang, Mater. Horiz., 2020, 7, 263–274 RSC.
- W. J. Merz, Phys. Rev., 1954, 95, 690–698 CrossRef CAS.
- W. Li and M. Alexe, Appl. Phys. Lett., 2007, 91, 262903 CrossRef.
- D. Gerlich, S. L. Dole and G. A. Slack, J. Phys. Chem. Solids, 1986, 47, 437–441 CrossRef CAS.
- W. Zhu, F. He, J. Hayden, Z. Fan, J. I. Yang, J. Maria and S. Trolier-McKinstry, Adv. Electron. Mater., 2021, 2100931 Search PubMed.
- J. Li, B. Nagaraj, H. Liang, W. Cao, C. H. Lee and R. Ramesh, Appl. Phys. Lett., 2004, 84, 1174–1176 CrossRef CAS.
- A. Grigoriev, D. H. Do, D. M. Kim, C. B. Eom, B. Adams, E. M. Dufresne and P. G. Evans, Phys. Rev. Lett., 2006, 96, 187601 CrossRef PubMed.
- Q. Gao, J. Ai, S. Tang, M. Li, Y. Chen, J. Huang, H. Tong, L. Xu, L. Xu, H. Tanaka and P. Tan, Nat. Mater., 2021, 20, 1431–1439 CrossRef CAS PubMed.
- S. Senkader and C. D. Wright, J. Appl. Phys., 2004, 95, 504–511 CrossRef CAS.
- V. Y. Shur, E. V. Pelegova, A. P. Turygin, M. S. Kosobokov and Y. M. Alikin, J. Appl. Phys., 2021, 129, 044103 CrossRef CAS.
- A. J. Fox, B. Drawl, G. R. Fox, B. J. Gibbons and S. Trolier-Mckinstry, IEEE Trans. Ultrason. Eng., 2015, 62, 56–61 Search PubMed.
- S. Y. Yang, F. Zavaliche, L. Mohaddes-Ardabili, V. Vaithyanathan, D. G. Schlom, Y. J. Lee, Y. H. Chu, M. P. Cruz, Q. Zhan, T. Zhao and R. Ramesh, Appl. Phys. Lett., 2005, 87, 102903 CrossRef.
Footnote |
| † Electronic supplementary information (ESI) available. See DOI: https://doi.org/10.1039/d3mh00365e |
| This journal is © The Royal Society of Chemistry 2023 |