
 Open Access Article
 This Open Access Article is licensed under a Creative Commons Attribution-Non Commercial 3.0 Unported Licence
A systematic DFT screening of cationic faujasite-type zeolites for the adsorption of NO, NO2 and H2O†
Ioannis
Karamanis
ab,
Ayoub
Daouli
 b,
Hubert
Monnier
a,
Marie-Antoinette
Dziurla
c,
Guillaume
Maurin
d and
Michael
Badawi
*bc
b,
Hubert
Monnier
a,
Marie-Antoinette
Dziurla
c,
Guillaume
Maurin
d and
Michael
Badawi
*bc
aInstitut National de Recherche et de Sécurité, 1 Rue du Morvan, CS60027, 54519 Vandœuvre-lès-Nancy Cedex, France
bLaboratoire de Physique et Chimie Théoriques, UMR CNRS 7019, Université de Lorraine, F-54000, Nancy, France. E-mail: michael.badawi@univ-lorraine.fr
cIUT de Moselle-Est, Université de Lorraine, Saint-Avold, France
dICGM, Université de Montpellier, CNRS, ENSCM, Montpellier, France
First published on 12th May 2023
Abstract
The limitation of NO and NO2 (NOx) emissions out of exhaust gases released from diesel engines in confined environments requires efficient adsorbents. Since NOx species are present in trace amounts (50–1000 ppm) in exhaust gases, and always co-exist with a large content of H2O (2–12 wt%), adsorbents need to be highly selective to trap NOx over H2O. To this end, periodic density functional theory (DFT) calculations in combination with dispersion corrections have been used for a systematic screening of monovalent and divalent cation-exchanged faujasite zeolites. The present work investigates the effect of the cation nature and Si/Al ratios (1.4; 2.43; 23; 47), on the adsorption selectivity of faujasite towards NO and NO2 against H2O. Alkali and alkali-earth metals Li(I), Na(I), K(I), Rb(I), Cs(I) and Ca(II), Ba(II), as well as monovalent and divalent transition metals Cu(I), Ag(I), and Zn(II), Pt(II), Pd(II), Cu(II), Fe(II), Co(II), Ni(II) embedded in faujasites, have been explored for their ability to capture NO and NO2. Bond activation of adsorbed gases has also been checked for the most promising materials to assess the tendency of these gases to further react with the adsorption site. Bader charges and charge density difference calculations were carried out for the most effective faujasite structures to assess the bond formation between materials and adsorbed gases. Much weaker interaction energies were predicted for Y vs. X faujasites, which is in favour of the material's regeneration. Cu(I) and Fe (II) based Y zeolites (Si/Al = 2.43) were identified as the most attractive candidates. Nevertheless, iron strongly activated the bonds of NO2 upon adsorption raising doubts about its implementation with faujasite. This is the first time that such a large screening of cationic zeolites has been performed for a separation topic using DFT calculations. In the specific case of NOx/H2O separation, the present work helped to exclude most of the zeolites explored from future theoretical or experimental investigations, highlighting the potential of Cu(I)Y and the promising selectivity that Fe(II) can bestow on a zeolite.
Design, System, ApplicationZeolites are known to be cheap and efficient sorbents for many applications. Emissions of diesel exhaust gas in confined work environments are a major health and safety concern, because of the exposure to nitrogen oxides (NOx). Removal of these pollutants from exhaust gas calls for engineering of an optimum sorbent for the selective trapping of NO and NO2 in the presence of water. To tackle this issue, we have undertaken the most systematic DFT exploration of cationic zeolite formulations ever published considering 16 different cations and 4 different Si/Al ratios to find the one which presents the best affinity for NO and NO2 towards water. We find that Cu(I)Y and Fe(II)Y zeolites are the best candidates for the aimed application, and suggest that further experimental studies can be limited to those systems. |
1. Introduction
Anthropogenic NOx (NO and NO2) sources include biomass burning, fossil fuel and biofuel combustion, and N-fertilized soil emissions.1,2 At the environmental level, NOx even present in trace amounts are known to deteriorate atmospheric chemistry, air quality and climate. NOx are not major greenhouse gases themselves, but they may modify the latter's concentration through complex chemical processes.1 Looking at the atmospheric chemistry, oxidation of NO produces NO2 which favours the formation of tropospheric O3. Although O3 is known to be a greenhouse gas, it is also a precursor of OH radicals, which determine the atmospheric lifetime of other pollutants such as methane, many volatile organic compounds (VOCs) and carbon monoxide.3At the human level, repeated NO2 exposure increases the asthmatic response of individuals.4 Moreover, long-term exposure to particulate matter and NO2 from car exhausts has been linked to the development of heart failure.5 According to a 2011 EU survey,6 non-road diesel engines contribute to 7.3% of the total NOx emissions. Non-road diesel fumes are especially harmful to humans working in confined environments. EU directive 2017/164 limits NO and NO2 exposures per 8 hours (a full-time working day) to 2 and 0.5 ppm, respectively.7 Several strategies exist to handle the strict NOx limits in lean-burn automotive emissions.
Currently NOxstorage reduction (NSR),7,8 and selective catalytic reduction (SCR)9,10 are the main catalytic treatments for the neutralization of NO2. These solutions can be very effective. SCR in particular can reach almost 100% NOx conversion into harmless N2.9 However, these catalytic treatments require high temperatures (above 200 °C) to be efficient, which limits their application for vehicles subjected to discontinuous operation and consequently, to many cold starts.
To this end, an effective adsorbent is needed for the low-temperature selective capture of NO and NO2 in the presence of water. A fine balance between high adsorption selectivity and easy regeneration is desired. This separation has been based on the thermodynamic selectivity throughout the literature. Pt/Pd promoting oxide-traps (CeO2, ZnO2, WO3) subjected to NOx containing gas streams have managed to reduce the outlet NOx concentration.11,12 However, these oxides are prone to sulphur poisoning which deteriorates their structural properties and obstructs their iterating operation. Zeolites were later tested as Pt/Pd promoters and, not only they were found to work selectively but also to be resilient to sulphur poisoning and regenerable.13–15 They were successful in reducing NOx from a gas stream either by passively trapping them at low temperatures and releasing them at higher ones, giving rise to the passive NOxadsorbers (PNA),11–13,16,17 or by catalysing their neutralization at the same time, bearing the cold start concept catalysts.18–20 As Pt and Pd are expensive, this work is part of a bigger cause to find cheaper alternatives to these precious metals for the construction of a PNA based on the framework of faujasite.
NOx always co-exists with large amounts of H2O, which may reach up to 12 wt% of diesel exhaust gases,21 and can inhibit NOx adsorption through competition for active adsorption sites. NOx concentration ranges between 50 and 1000 ppm,22i.e. 100–2000 times lower than the water content. Therefore, the desired zeolitic adsorbents need to be highly selective for NOx in comparison to water. To this end, we strive to identify efficient and selective materials for NOx adsorption in the presence of water. These materials should be able to support diesel exhaust gas pipe conditions of the non-road vehicles, namely they should be hydrothermally and chemically stable, water insoluble, and highly NOx selective.
In the present work, periodic density functional theory was employed to achieve a systematic screening of various faujasite (FAU) formulations regarding their NOx/H2O affinity. These formulations vary from the nature of the cation they promote as well as from the Si/Al ratio (i.e., cation loading). Indeed, the electron structure of the cation is decisive considering its reactivity, and consequently its affinity towards the NOx/H2O.23–25 As the separation in hand is challenging, several cations needed to be considered. On the other hand, lowering the Si/Al ratio increases the cation loading of the zeolite. Cations affect the stabilization of an adsorbed gas even from a distance due to non-bonding interactions.23–25 Since the presence of cations determines the existence of adsorption sites but also has strong effect on the structural properties of the zeolite, their abundancy is imperative for the adsorption capacity. These criteria motivated the exploration of such low Si/Al ratios, but also the framework of faujasite, which can retain its crystallinity in so high Al content.
Two sets of cations have been considered as follows: monovalent (M) = {Li, Na, K, Rb, Cs, Cu, Ag} and divalent (D) = {Ba, Ca, Zn, Cu, Pt, Pd, Fe, Co, Ni}. Their adsorption energies for NOx and H2O were calculated at 0 K. The Si/Al ratios implemented in this work are 47 and 23 for isolated cation cells, 2.43 for Y zeolite and 1.4 for X zeolite. FAU has been chosen for its potential to easily incorporate a large panel of cations. FAU has been used in the past for the selective trapping of gases in general, but also for more relevant investigations like catalytic NO reduction.26–29 DFT has proven its efficiency and usefulness regarding the prediction of adsorption energies for a range of gases on zeolites.30–32 The accuracy and efficiency of specific functionals for the determination of molecular interactions has been commented elsewhere23,33 but the point is that some of them can really stand up to the challenge of producing accurate results for gas–solid interactions, avoiding time and money consuming experiments.
2. Methods and models
2.1 Computational methods
DFT calculations were performed using the Vienna Ab initio Simulation Package (VASP).34 The Perdew Burke Ernzerhof (PBE) exchange–correlation functional in the generalized gradient approximation (GGA) was used.35 The electron-ion interactions were described using the projector augmented plane wave (PAW) method, and the Kohn–Sham equations were solved self-consistently until the energy difference between the cycles was lower than 10−6 eV.36 The plane wave cut-off energy was set at 450 eV. A Gaussian smearing with σ = 0.1 eV was applied to the band occupations in order to improve the total energy convergence. The atomic positions were fully optimized until the force differences between two successive ionic steps were no more than 0.02 eV Å−1 per atom. The sampling of the Brillouin zone was limited to the Γ-point. Due to the local nature of the GGA, dispersion corrections were added separately in order to accurately simulate the adsorption process.23,37 Grimme's D2 scheme has been employed to model the dispersion interactions between atoms. The D2 method is a popular vdW correction approach that considers dispersion interactions as atom-pairwise corrections. In this approach, the C6 coefficients for each atomic species are defined independently of the system, allowing for a more efficient and computationally feasible calculation.38,39 In a previous work, it was demonstrated that various dispersion correction methods of various complexity including D2, TS/HI (Tkatchenko–Scheffler scheme with iterative Hirshfeld partitioning), and FI/MBD (many-body dispersion with its fractionally ionic (FI)),40–42 lead to comparable results for NOx and H2O adsorption on isolated monovalent exchanged FAU with Si/Al of 47. The structures considered there have chemical environments akin to the ones used in this work.43 Hence building on these previous findings we have selected the D2 method for this work, as it is more cost-effective. Furthermore, to investigate the potential impact of many-body effects on the accuracy of our results, we also employed the more advanced MBD correction for the most promising system. This allowed us to cross-evaluate and compare the outcomes obtained with the D2 method.Hubbard's potential U is an add-on to conventional GGA, used to treat the inadequate description of strongly correlated systems.44,45 The U values used in this work, calculated for the transition metals in similar environments, were equal to 6.0, 4.5 and 5.9 eV for Fe, Co and Ni, respectively.46
The interaction energy (ΔEint) at 0 K is determined in 4 steps: 1) the atomic positions and the zeolitic cell parameters are relaxed according to the convergence conditions given above. 2) The relaxed cell parameters are used to optimize the atomic positions of the isolated gases. 3) Placing a relaxed gas close to the desired adsorption site of a zeolite, we relax the atomic positions of the adduct, zeolite-gas. 4) The energy of the interaction is calculated as:
| ΔEint = EFAU–X − EFAU − EX | (1) |
To shed light on the nature of the bonds formed between the gases and the most effective zeolite structures, induced Bader charges47–51 and charge density differences due to adsorption were calculated. Bader charges were first calculated for the complex QFAU–X, the zeolite, QFAU, and the gas, QX, and their differences gave the charge difference due to adsorption ΔQ as:
| ΔQ = QFAU–X − QFAU − QX | (2) |
| Δρ = ρFAU–X − ρFAU − ρX | (3) |
2.2 Faujasite structure
The siliceous structure of FAU crystallizes within the Fd3m symmetry space group.52 FAU consists of a sequence of TO4 where T is an abbreviation for the tetrahedrally coordinated Si and Al atoms – Si(IV) and Al(III) – linked together by oxygen atoms. Their assembly makes a crystal structure. It is uniform, regular, and ordered. In the present study, a primitive rhombohedral cell (1/4 of the conventional cell) was used to reduce the computational effort (Fig. 1). The lattice parameters of the primitive cell after relaxation at the PBE + D2 level of theory were a ≈ b ≈ c ≈ 17 Å and α ≈ β ≈ γ ≈ 60° and the unit cell volume ≈ 3800 Å3. The exact values of the relaxed cell parameters for different cation-exchanged zeolite structures are shown in Table S1 of the ESI.† | ||
| Fig. 1 The rhombohedral cell of a Na–X zeolite is depicted. Its three types of cavities are illustrated, namely the hexagonal prism or D6R (double 6-membered rings), the sodalite cage and the supercage. The adsorption sites are also included (SI and SI′ in the centre and on the facet of a D6R respectively, SII on the facet of a 6MR of a sodalite towards the supercage and SIII′ on the facet of a 4MR of either a D6R or a sodalite facing towards the supercage). Si atoms are coloured in blue, O in red, Al in lightblue and sodium cations in yellow. | ||
FAU comprises hexagonal prisms (D6R), sodalite cages and large supercages with a diameter of about 11 Å (International Zeolite Association 2017) (Fig. 1). The D6R comprises two six membered rings (6MR), where the T atoms of the two rings are bridged through an O atom forming a second type of ring: a 4-membered one (4MR). The sodalite cage is constructed out of eight 6MR, always linked by 4MR.53Fig. 1, not only summarizes these structural elements but also presents the cationic sites.
The openings of the sodalite cage (Fig. 1) do not allow most of the molecules to enter, but tiny ones like dihydrogen,54 except on higher loadings.55,56 On the contrary, supercage gives access to bigger molecules as well. As depicted in Fig. 1, we identify 4 kinds of sites. Site I′ is on the facet of a 6MR belonging to a D6R. A cation occupying this site will always face a sodalite cage and is inaccessible to the gases. The same holds for the cations located in site I which are enclosed in the centre of a D6R. Cations located on site II are placed on a 6MR facet of the sodalite and are accessible to the gases, as they face the supercage. Finally, cations located on site III′ are placed on a 4MR, a facet that might belong either to a sodalite or to a 6MR and has access to the supercage. Based on this analysis we only carry out adsorptions on sites accessible from the supercage namely, site II and III.
The negative charge due to the Al/Si substitutions must be compensated by the addition of a cation. The chemical formula of a FAU mesh is the following:
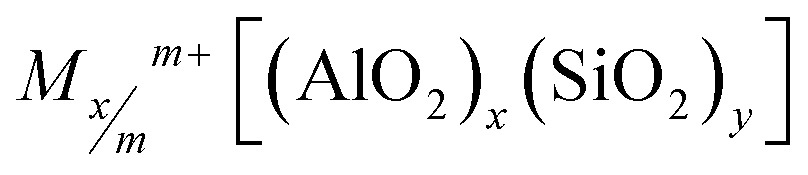 | (4) |
The sequences of T atoms are not randomly set. According to Löwenstein's rule two AlO4− tetrahedra should be interspersed with at least one SiO4. In this work we favour Al–Si–Si–Al sequences over Al–Si–Al whenever possible, as – in principle – dispersing the negative charge stabilizes the system.
The Si/Al ratios considered in this work were: {47, 2.43, 1.4} for monovalent and {23, 2.43, 1.4} for divalent cation exchanged cells. Faujasites with Si/Al ratios of 1.4 and 2.43 are denoted as X and Y zeolites, respectively. In addition, pure silica cell was used.
To achieve realistic zeolite structures, the cation distributions within the considered Y and X zeolites were drawn from T. Frising and P. Leflaive's research where they gathered the preferred occupation sites of several compensating cations from previous syntheses.57Fig. 2 summarizes the site occupation, cation loading, and Si/Al of each structure. For the monovalent cations M, where M = {Li, Na, K, Rb, Cs, Ag, Cu(I)} a full exchange was applied during the modelling of the majority of these systems58–64 with the exception of Rb and Cs for which only partial exchange was experimentally demonstrated.57 Due to their large size, it was revealed that these two cations tend to avoid the occupation of sodalite and D6R (sites I and I′).65–67 Instead, sodium atom is located on these sites and Rb and Cs occupy only sites II and III′. Subsequently, the generalized molecular formula (eqn (4)) for these monovalent cations incorporated in the FAU is given as follows: for Si/Al = 47 the single cation was placed on site II being the most stable site over all others.68 For the primitive cell where x + y = 96, we obtain MAlSi47O96. In the same spirit, for MY, where Si/Al = 2.43 and taking into consideration that Rb and Cs cells are partially exchanged, we get NaxM14−xAl14Si34O96, where x = 6 for Rb and Cs, and 0 otherwise. Finally, for MX we get NaxM20−xAl20Si28O96, applying the same values for x as in the case of MY.
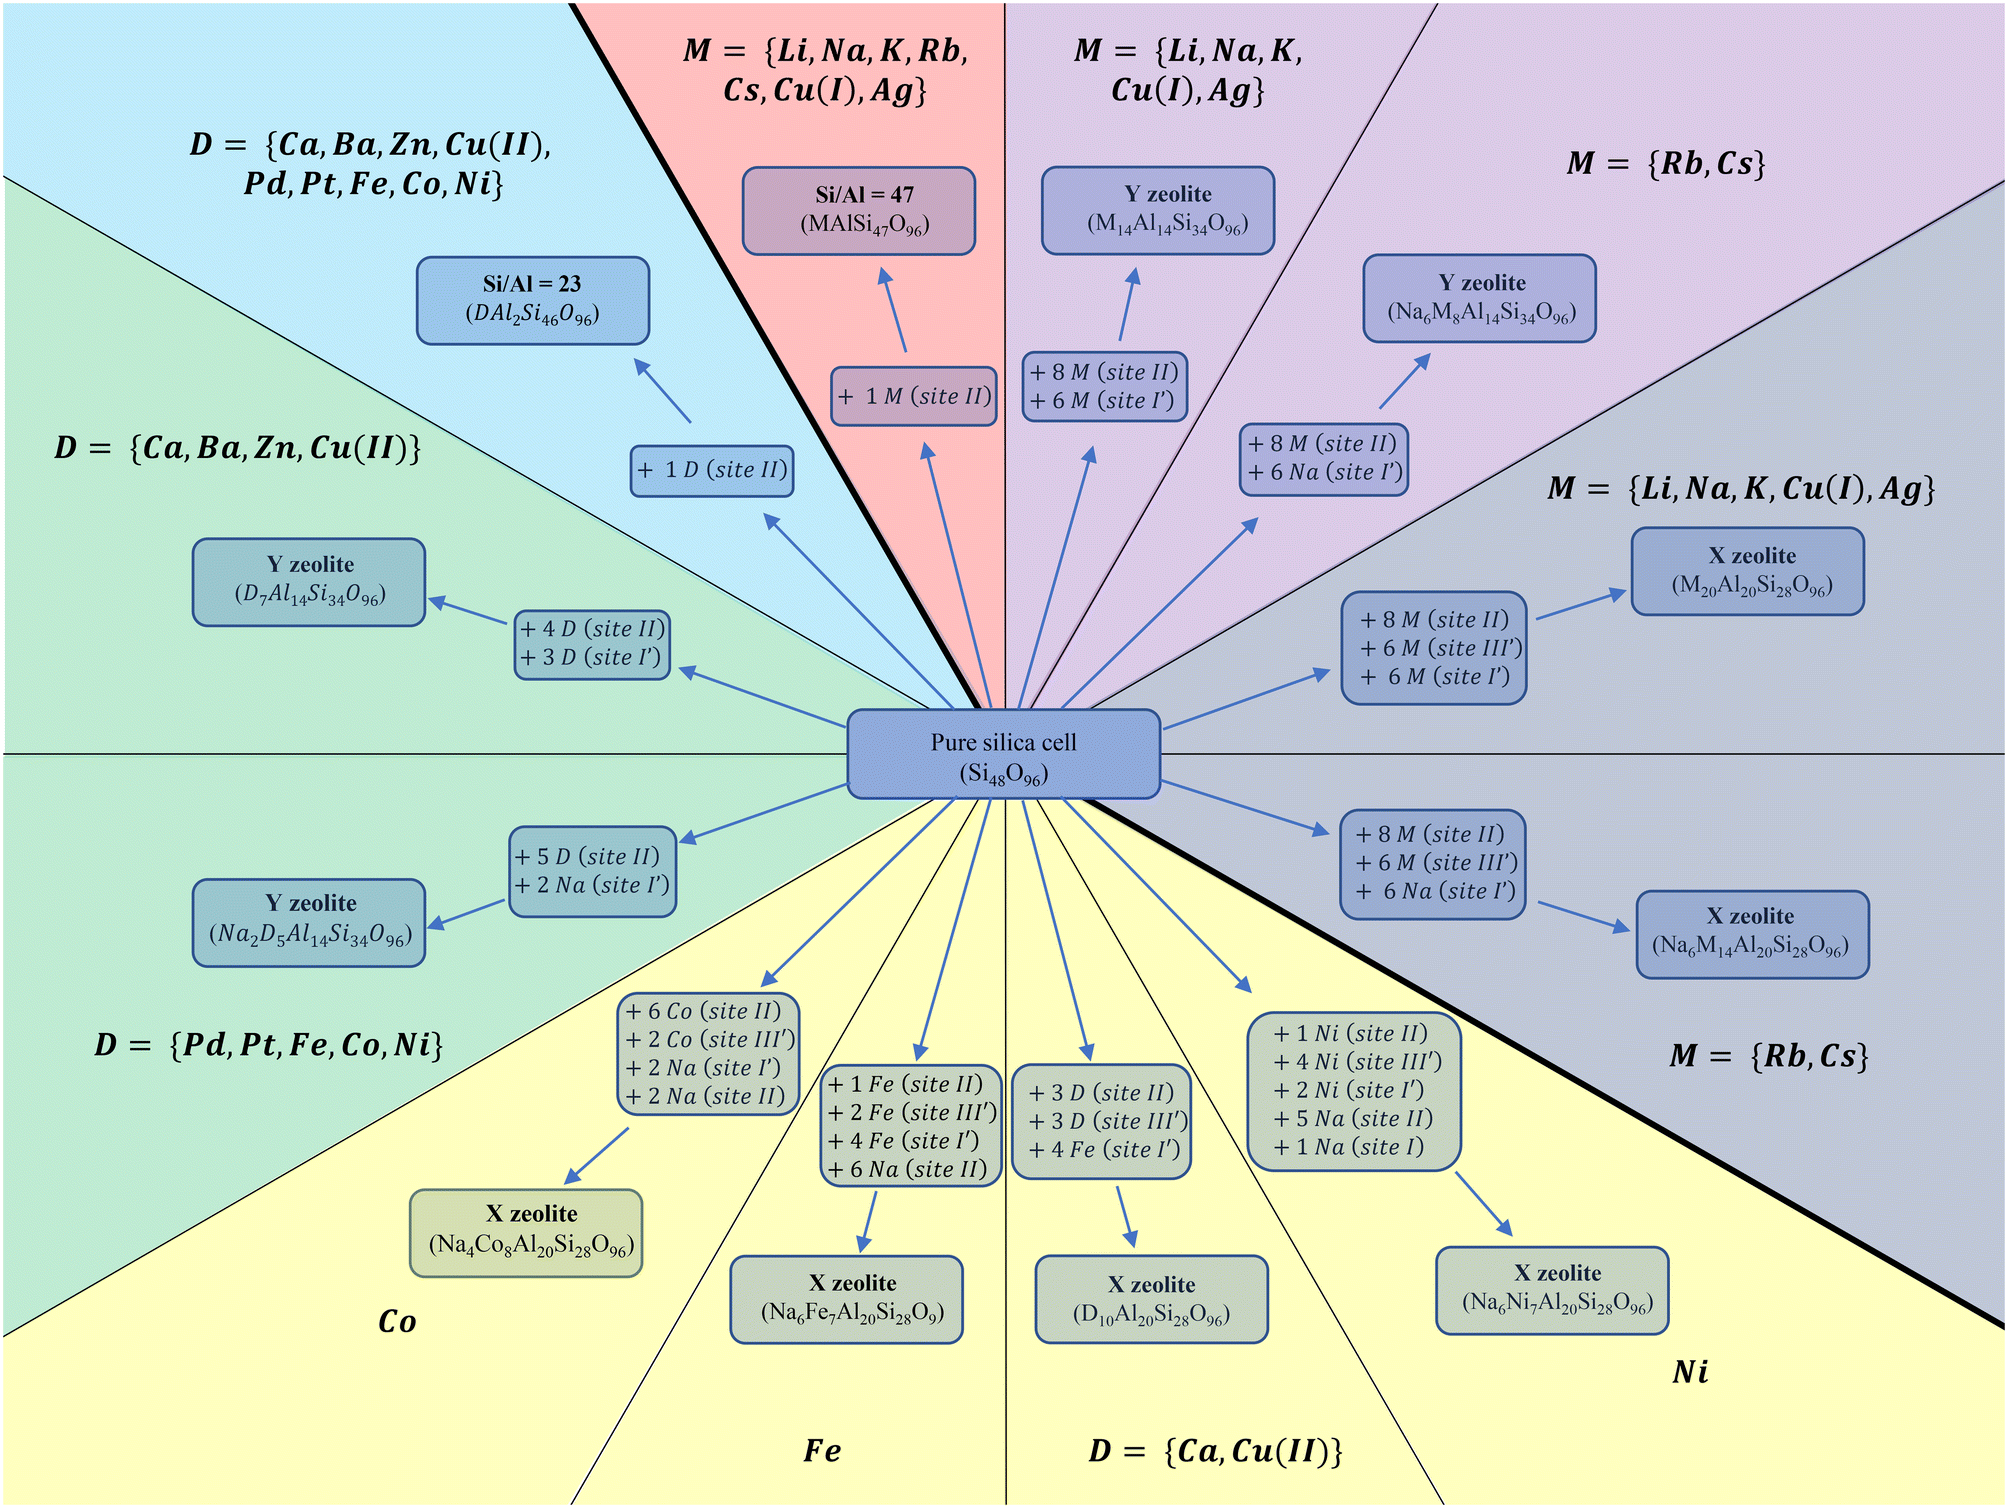 | ||
| Fig. 2 The site occupation, cation loading, and Si/Al of the sites considered are presented. Lines separate each kind of structure based on site occupation and cation loading. Thick lines separate monovalent from divalent structures. Colours separate the different Si/Al ratios. The arrows illustrate how introduction of cations leads from the pure silica cell to each kind of structure. | ||
As for the divalent cations, where D = {Ca, Ba, Zn, Pt, Pd, Cu(II), Fe, Co, Ni}. T. Frising and P. Leflaive have shown in their excellent review that divalent cations present a fussy behaviour regarding the site occupation compared to that of monovalent. Not all of them prefer the same sites and neither achieve the same exchange rate. Fig. 2 summarizes the site occupation, cation loading, and Si/Al of each structure. Utilizing (eqn (4)) for the primitive cell where x + y = 96: if Si/Al = 23 with only one divalent cation located at site II, we obtain the molecular formula DAl2Si46O96. For Y, two molecular formulas were used: D7Al14Si34O96 for Ca, Ba, Zn, and Cu(II) where a full exchange was achievable and divalent cations occupied site II, I and I′, and D6Na2Si34O96 for the rest. Both were inspired by previously synthesised structures.57,69–77 The fully exchanged structures contain three divalent cations in sodalites and four on site II, while the partially exchanged cell contains two divalent and two Na cations in sodalites and four divalent cations on site II. Finally, X zeolite cells were divided into four groups. The only fully exchanged cells were experimentally found achievable for Cu(II) and Ca(II) with the molecular formula D10Al20Si28O96. The partially exchanged structures are the ones of Fe(II), with the molecular formula Na6Fe7Al20Si28O96, the cell of Co, with the molecular formula Na4Co8Al20Si28O96, and finally, the cell of Ni, with the molecular formula Na6Ni7Al20Si28O96. It is noted that BaX, ZnX, PtX and PdX were not investigated because they do not occupy site III′,57 thus their interaction energies are expected to resemble the Y cases.
3. Results
3.1 Adsorption screening for the monovalent cations
As mentioned earlier, three different Si/Al ratios have been investigated for monovalent cation embedded cells in the present study: 47 (isolated cation cell), 2.43 (Y zeolite), or 1.4 (X zeolite). Adsorption energies determined for NO, NO2 and H2O on FAU zeolites are presented in Table 1 and illustrated in Fig. 3. Results obtained for Si/Al = 47 structure at the PBE + D2 level of theory were extracted from a previous work43 and they are compared here with the present results. Adsorption energies for pure silica cell were equal to −19.1, −17.9 and −27.5 kJ mol−1 for NO, NO2 and H2O respectively.| Si/Al ratio | Gases | Li+ | Na+ | K+ | Rb+ | Cs+ | Cu+ | Ag+ |
|---|---|---|---|---|---|---|---|---|
| 47 | NO | −32.4 | −24.8 | −19.1 | −22.7 | −20.3 | −121.8 | −73.5 |
| NO2 | −38.2 | −30.7 | −29.3 | −21.7 | −20.1 | −81.8 | −54.9 | |
| H2O | −80.5 | −64.0 | −64.4 | −58.5 | −61.6 | −86.3 | −84.7 | |
| 2.43 (Y) | NO | −32.9 | −27.8 | −12.9 | −27.4 | −33.1 | −117.4 | −82.7 |
| NO2 | −34.7 | −33.3 | −11.6 | −25.2 | −34.3 | −122.7 | −36.0 | |
| H2O | −77.8 | −73.1 | −72.8 | −72.5 | −73.7 | −80.4 | −67.3 | |
| 1.4 (X) | NO | −41.4 | −38.6 | −47.1 | −60.8 | −59.7 | −173.0 | −77.7 |
| NO2 | −53.9 | −73.2 | −99.6 | −131.9 | −123.3 | −255.2 | −164.2 | |
| H2O | −106.6 | −105.9 | −96.4 | −89.1 | −114.0 | −137.5 | −113.8 |
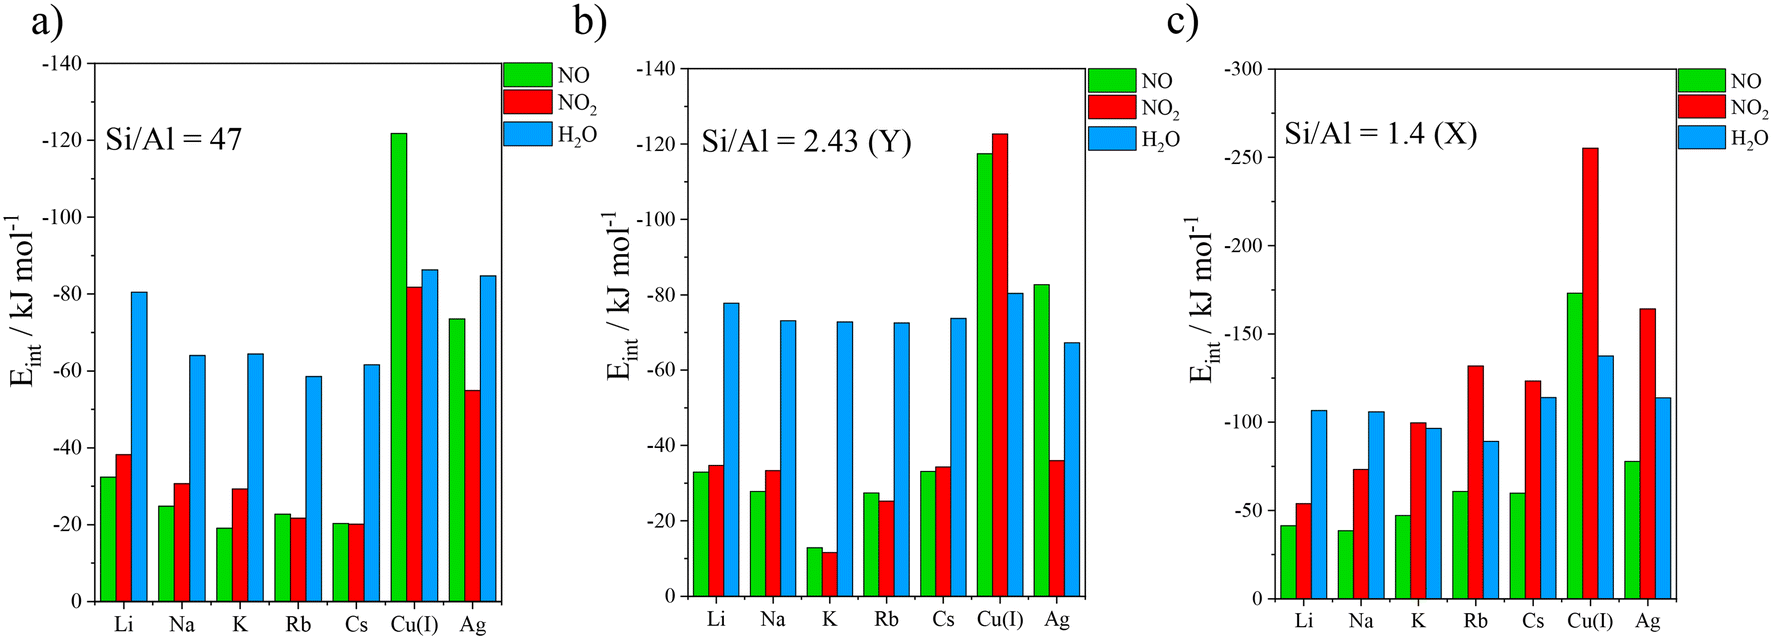 | ||
| Fig. 3 Interaction energies computed at the PBE + D2 level of theory for NO, NO2, and H2O adsorption on a) isolated monovalent cation embedded faujasite (Si/Al = 47), b) Y zeolite (Si/Al = 2.43) and c) X zeolite (Si/Al = 1.4). | ||
For structures with Si/Al = 47, all alkaline cations presented much higher affinity for water than for NOx (Fig. 3a). Remarkably, Cu(I) shows a great preference for NO over water with an energy difference of 35.5 kJ mol−1, but NO2 does not follow this trend. Similar adsorption energy was reported in a previous work for NO adsorption in Cu(I) embedded chabazite on site II using the PBE + D2 level of theory harvesting an interaction energy of −123.4 kJ mol−1, very similar to ours at −117.4 kJ mol−1.78
For Y structures (Fig. 3b), all alkaline atoms exhibit a stronger interaction with H2O than with NOx. Cu(I) showed a much higher adsorption energy for NO and NO2 than for H2O with differences at 37.0 kJ mol−1 and 117.3 kJ mol−1, respectively. Hessou et al. (2018)43 reported similar results for all cations. Adsorption configurations are illustrated in Fig. 4a–f, depicting the adsorbed gases on Na of the alkali group and on Cu(I) of the transition metal group incorporated in Y zeolite. The adsorption on the other cations is illustrated in Fig. S1 of the ESI.† NO and NO2 were adsorbed on Na with a distance of 2.60 and 2.53 Å respectively (Fig. 4a and c). Water stayed closer to the cation, at 2.40 Å (Fig. 4e). For adsorption on Cu(I), NO and NO2 were connected with lengths of 1.79 and 1.88 Å respectively (Fig. 4b and d), while water remained at 1.93 Å. The latter even formed a H-bond with the 6MR oxygen with a length equal to 1.75 Å (Fig. 4f). The shorter distances observed with Cu(I) support the stronger affinity of Cu(I) for NOx than water, especially considering the longer covalent radius of N by comparison with O. The opposite behaviour was observed for alkaline cations, which formed stronger interactions with water.
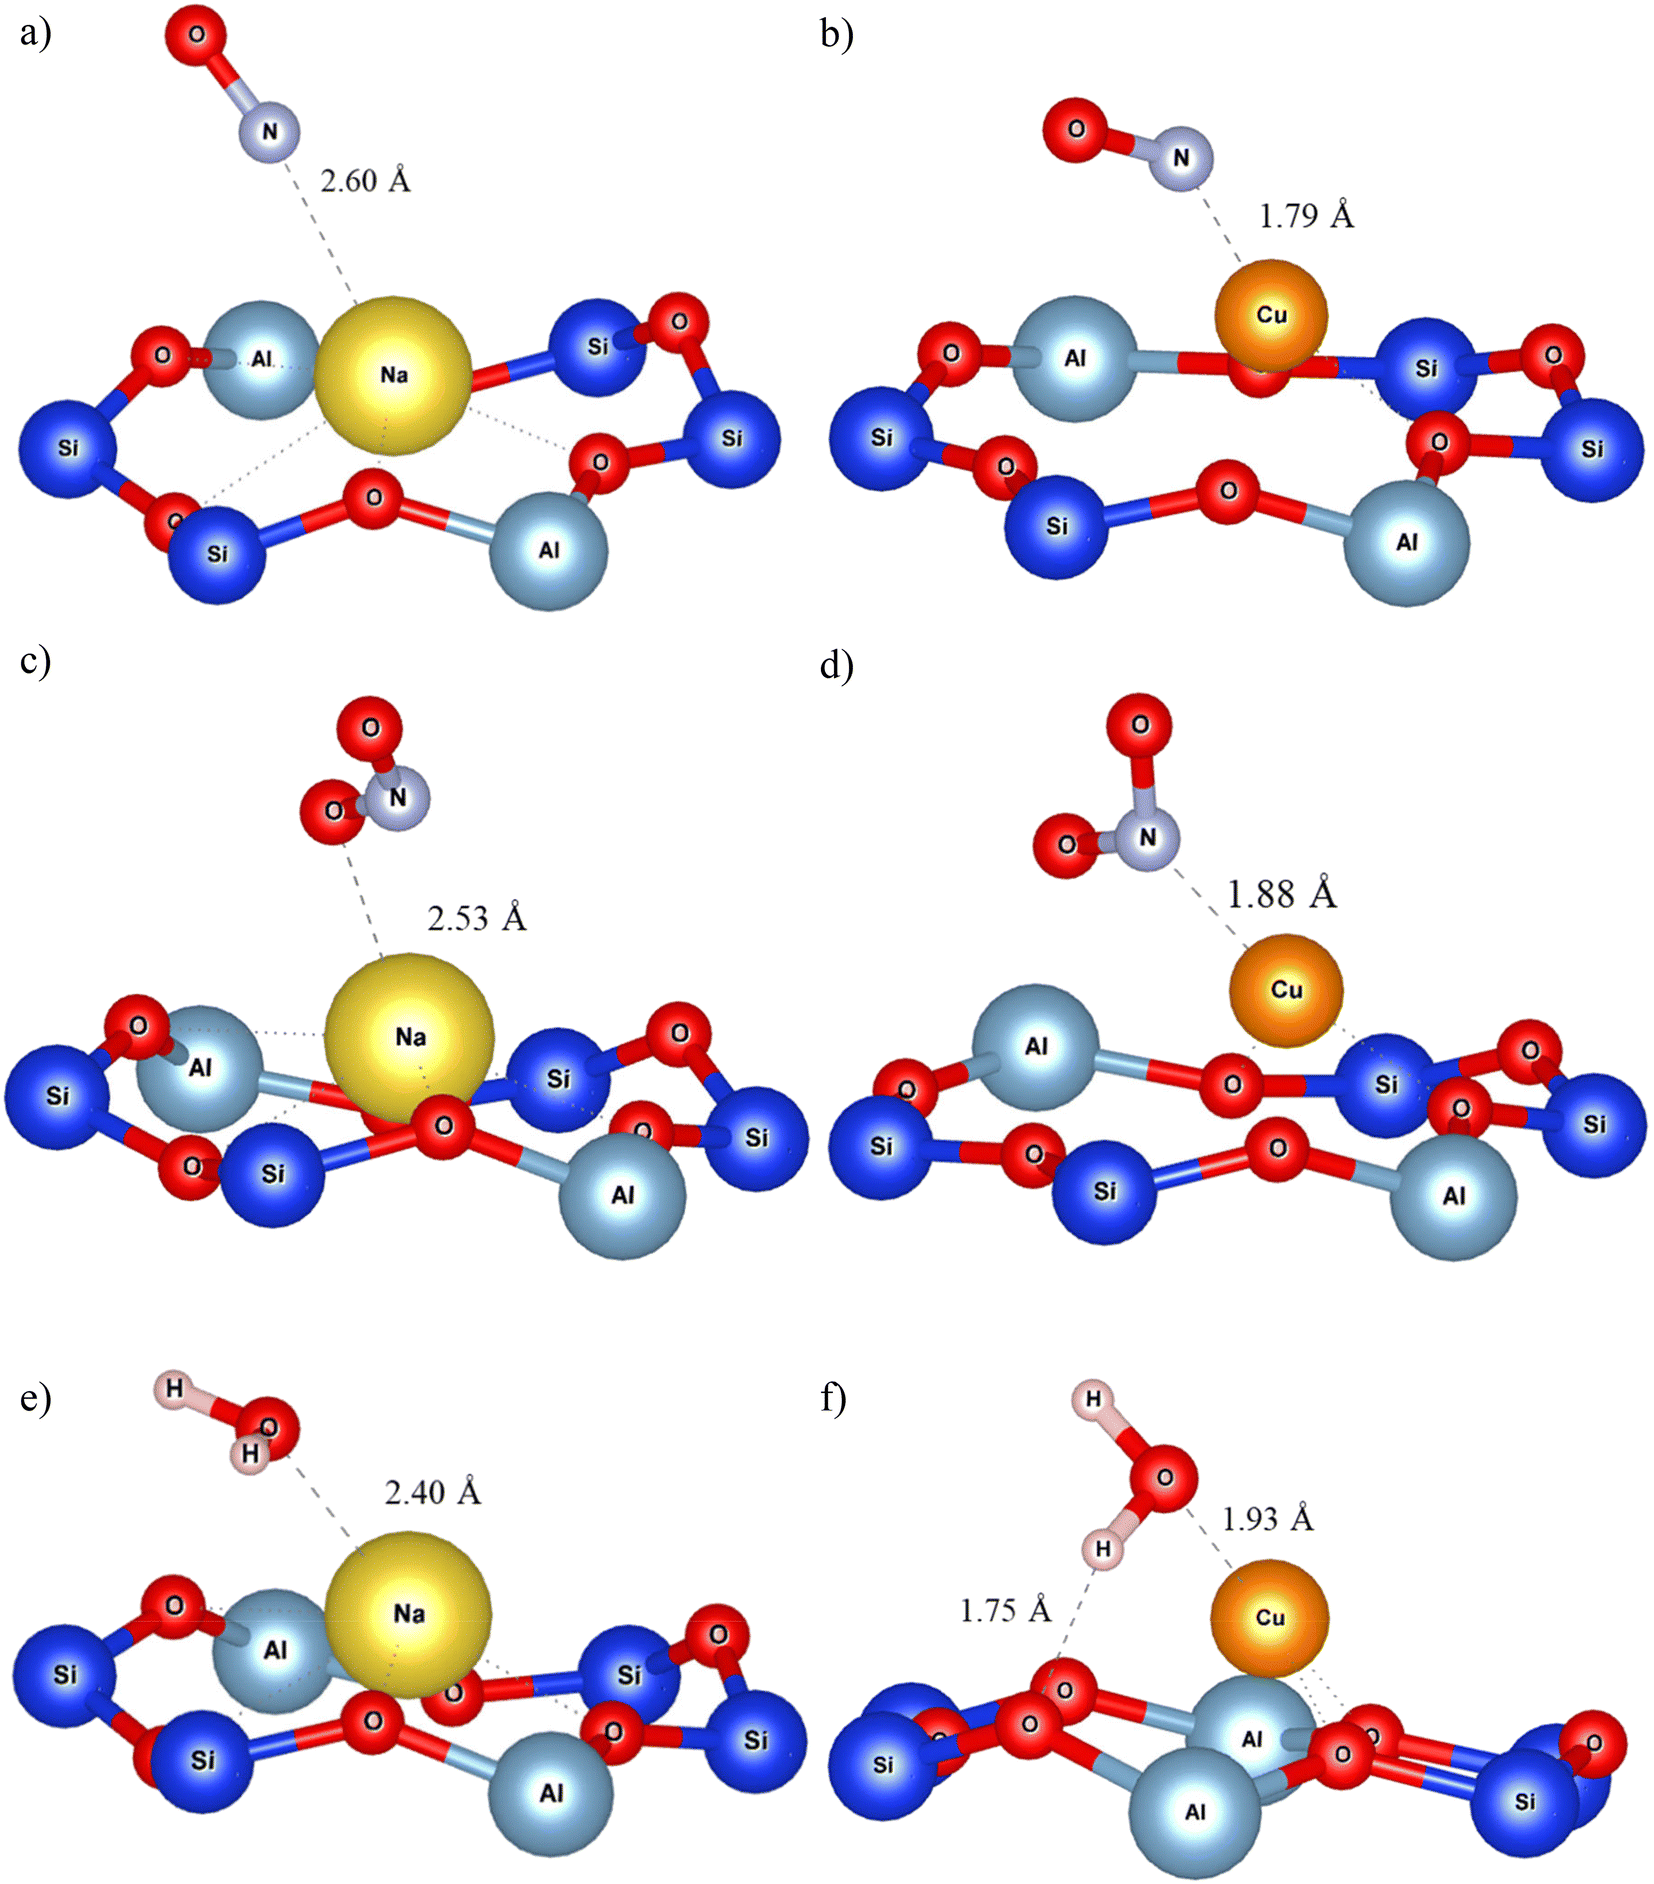 | ||
| Fig. 4 Na and Cu(I) embedded Y adsorption configurations of NO (a and b respectively), NO2 (c and d respectively) and H2O (e and f respectively). The cations are located on site II. | ||
Finally, for X structure (Si/Al = 1.4), the results are depicted on Fig. 3c and Table 1. The adsorption energies were highly increased in comparison to results obtained for Si/Al = 47 and 2.43. For water, this was systematically observed on alkaline gas exchanged X zeolite. This is attributed to the formation of stabler (shorter) H-bonds with the framework which are favoured in the curvy topology of site III′ much more than the relatively flat of site II, used for 47 and Y. NO2 adsorption was also strongly enhanced in the cases of X zeolite. As cross-adsorption between site II and site III′ is particularly strong for NO2, it leads to higher binding energies than water as opposed to zeolite Y. This is exemplified by KX with a difference of 3.2 kJ mol−1, RbX with a difference of 42.8 kJ mol−1, and CsX with a difference of 9.4 kJ mol−1, but not by Na+ and Li+, which consistently favour water over NO2. Similarly, the interaction with NO was strongly enhanced on zeolite X due to cross-adsorption between site II and site III′, as shown in Table 1, but overall, the simulated trends were similar to those observed for Y. In short, Cu(I) appeared once again to be selective towards NOx as interaction energies with NO and NO2 remained 35.5 kJ mol−1 and 117.7 kJ mol−1 higher than with water, respectively.
Adsorption configurations of gases adsorbed on X are shown in Fig. 5a–f, for the representative cations Na (from the group of alkaline cations) and Cu(I) (from the monovalent transition metals). NO and NO2, were both cross adsorbed by site II and site III′ with similar interaction distances, above 2.4 Å (Fig. 5a and c), while water formed a shorter interaction at 2.30 Å with the cation, and two H-bonds at 1.82 Å and 2.02 Å strongly stabilizing the complex (Fig. 5e). As for Cu(I), NO was adsorbed on site III′ with an interacting distance of 1.79 Å (Fig. 5b), and NO2 got cross adsorbed by site III′ and site II with lengths of 1.88 and 1.86 Å respectively (Fig. 5d). In this figure especially, Cu+ migration was very clearly observed, by comparison with its position in Fig. 5b and f. This is a known phenomenon that occurs in zeolites, to stabilize the complex.61 Finally, water is adsorbed on Cu(I) with a length of 1.91 Å and a H-bond of 1.71 Å.
 | ||
| Fig. 5 Na and Cu(I) embedded X adsorption configurations of NO (a and b respectively), NO2 (c and d respectively) and H2O (e and f respectively). Strong migration was observed in the case of adsorption of NO2 on Cu(I)X, both for copper located on site II and site III′. | ||
In summary, it appears that structures with Si/Al = 47 and 2.43 share common binding patterns. Their big difference regards Cu(I), which differently from 47, it behaves selectively towards NO2, when incorporated in Y. This selectivity is driven by non-bonding interactions between the closest O atom of NO2 to the 6MR, with the atoms of the 6MR. In regard to X zeolite, all interaction energies became much higher due to cross adsorption and the interaction of gases with site III′ as expected.68,78,79 While only selected adsorption configurations are shown here, the whole of the results are presented in ESI,† at Fig. S3.
3.2 Adsorption screening for the divalent cations
Adsorption energies determined for NO, NO2 and H2O on divalent cation embedded cells are reported in Table 2 and illustrated in Fig. 6.| Si/Al ratio (zeolite) | Gases | Ca2+ | Ba2+ | Zn2+ | Pt2+ | Pd2+ | Cu2+ | Fe2+ | Co2+ | Ni2+ |
|---|---|---|---|---|---|---|---|---|---|---|
| 23 | NO | −41.7 | −31.3 | −49.4 | −79.6 | −108.6 | −130.6 | −207.0 | −130.3 | −82.3 |
| NO2 | −46.0 | −31.7 | −49.5 | −24.2 | −39.3 | −39.1 | −147.2 | −68.7 | −59.0 | |
| H2O | −108.9 | −77.3 | −111.0 | −17.9 | −28.4 | −90.6 | −114.4 | −116.9 | −120.5 | |
| 2.43 (Y) | NO | −46.5 | −40.1 | −55.9 | −114.4 | −110.5 | −103.8 | −246.6 | −185.5 | −157.0 |
| NO2 | −60.9 | −77.0 | −64.6 | −24.8 | −49.4 | −29.4 | −192.4 | −102.6 | −72.5 | |
| H2O | −110.6 | −119.1 | −108.8 | −31.5 | −24.6 | −77.0 | −143.8 | −131.9 | −111.1 | |
| 1.4 (X) | NO | −56.8 | −147.6 | −257.5 | −215.9 | −185.1 | ||||
| NO2 | −152.5 | −66.0 | −232.6 | −240.2 | −133.4 | |||||
| H2O | −139.4 | −134.4 | −146.6 | −157.5 | −167.4 |
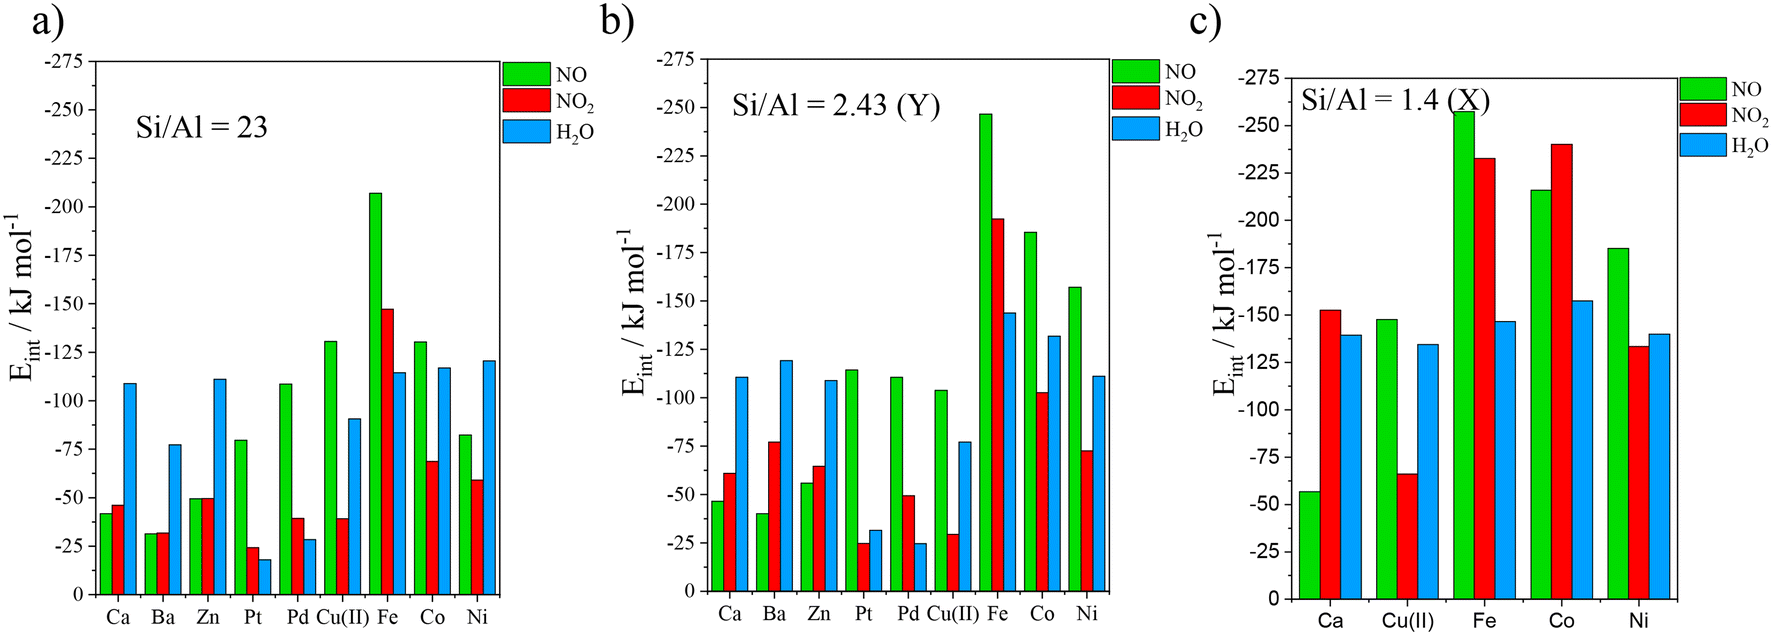 | ||
| Fig. 6 Interaction energies computed at the PBE + D2 level of theory for NO, NO2, and H2O adsorption on a) isolated divalent cation embedded faujasite (Si/Al = 23), b) Y zeolite (Si/Al = 2.43) and c) X zeolite (Si/Al = 1.4). | ||
The results for the structures with Si/Al = 23 are depicted in Fig. 6a. NO/NO2 were more strongly adsorbed than H2O on Pt and Pd by 61.7/80.2 and 6.3/10.9 kJ mol−1, respectively. Moreover, NO and NO2 were selectively adsorbed compared to H2O on Fe, with interaction energy differences of 92.6 and 32.8 kJ mol−1 respectively. Alkaline earth cations (Ca, Ba) and Zn showed a stronger affinity for water than for NOx. Although the remaining metals (Cu(II), Co(II) and Ni(II)) showed preference for NO, they displayed poor affinity for NO2. Daouli et al.80 performed a cation screening for isolated cation-embedded faujasite using periodic PBE, U = 4.0 for Fe2+ and the Tkatchenko–Scheffler scheme with iterative Hirshfeld partitioning (TS/HI), for dispersion corrections. Their findings are similar to ours for Ca, Ba, Zn and Cu2+, but they differ significantly for Pt and Pd. Differently from us, they predicted that Fe is not selective.
The results concerning Y zeolite, are depicted in the histogram of Fig. 6b. The alkaline earths and Zn behaved hydrophilically, as observed previously on structures with Si/Al = 23. Interaction energies of NO and NO2 on PdY exceeded that of water by 85.9 and 24.8 kJ mol−1, respectively. Fe also appeared to be selective towards NO and NO2, with binding energies exceeding that of water by 102.8 and 48.6 kJ mol−1, respectively. Pt, Cu(II), CoY and NiY were poor candidates. Göltl and co-workers81 have used a regression analysis model to determine the adsorption energies of NO and CO on different zeolite rings. Their results regarding 6MR (which we also used for Si/Al = 23 and 2.43 (Y)), with the same Al distribution as ours, for Cu2+ (−103.3 kJ mol−1), Co2+ (−172.2 kJ mol−1) and Ni2+ (−167.8 kJ mol−1), were consistent with our results for Y. Conversely, their result for Fe2+ (−181.0 kJ mol−1) was less negative than ours. This difference is attributed to the zeolite they use (SSZ-13), which imposes a different coordination to the cations.
Adsorption configurations of Ca (representing alkaline earths) and Fe (representing divalent transition metals) on Y are presented in Fig. 7a–f, while all the rest are provided in the ESI† (Fig. S2). NO and NO2 were bound to CaY with distances of 2.59 Å and 2.35 Å (Fig. 7a and c), water staying at a distance of 2.37 Å (Fig. 7e). NO and NO2 were adsorbed at approximately the same distance from Fe, at 1.67 and 1.68 Å respectively (Fig. 7b and d), much closer than water which stayed 1.98 Å away from Fe. These results are in line with the interaction energies which indicated a higher affinity of Fe for NOx than for water. It is noticeable that H2O did not form any H-bonds when adsorbed on divalent cations (unlike with monovalent cation-exchanged Y).
 | ||
| Fig. 7 Ca and Fe embedded Y adsorption configurations of NO (a and b respectively), NO2 (c and d respectively) and H2O (e and f respectively). The cations are located on site II. | ||
Regarding X zeolite, adsorption energy values were overall higher than for Y and 23 (Fig. 6c). CaX showed similar affinities for NO2 and H2O, which are higher than for NO. PtX and PdX are exceptionally selective, interacting more strongly with NO/NO2 than H2O by 147.0/99.6 kJ mol−1 and 113.4/51.9 kJ mol−1, respectively. Furthermore, Fe2+ and Co2+ appeared to be selective for both nitrogen oxides, yielding differences between NO/NO2 and H2O, equal to 110.9/86.0 kJ mol−1, and 58.4/86.0 kJ mol−1 respectively. Finally, Cu2+ and Ni2+, were found to be selective for NO but not for NO2.
Adsorption configurations of gases on DX are given in Fig. 8a–f and S4.† NO is adsorbed on Ca of site III′ with an interacting distance of 2.48 Å (Fig. 8a), quite shorter than the value calculated for site II (2.59 Å). NO2 showed a different behaviour being cross-adsorbed, at equal distances from the Ca atoms (∼2.4 Å) of site II and site III′ (Fig. 8c). Water remained 2.28 Å away from Ca, forming two H-bonds with lengths 1.70 and 1.80 Å with the framework (Fig. 8e). The formation of 2 H-bonds endowed the adsorption of water on site III′ with great potent as we observe in Fig. 6c. Considering Fe, NO formed a tight connection of length 1.65 Å with the cation on site III′ (Fig. 8b). NO2 was adsorbed by iron on site III′ through both its N and O atoms with distances of 1.93 and 1.84 Å respectively, bringing also its second oxygen at 2.71 Å from Na on site II (Fig. 8d). Water was linked with Fe, with a separating distance of 1.95 Å (Fig. 8f) – far longer than NOx, which is in accordance with its smaller binding energy. However, the interaction of water with the framework was further enhanced through one H-bond of 1.59 Å.
 | ||
| Fig. 8 Ca and Fe embedded X adsorption configurations of NO (a and b respectively), NO2 (c and d respectively) and H2O (e and f respectively). Cross adsorptions were observed in both cases for NO2. | ||
Overall, the cation distribution significantly affected the separation capability of the faujasites. Although the adsorption took place on site II both for Si/Al = 23 and Y structures, the interaction energies large deviations. In contrast, adsorption energies on monovalent cation-embedded 47 and Y were similar. X zeolite interactions were much stronger than Y and 23, as we should expect, based on the less stable attach of the cations to the 4MR. The possibility of cross-adsorption with increased NO2 loading is studied in the last part of the ESI.† Calculations were carried out for CaX, NiX and FeX, and they show that cross-adsorption is not prevented by the presence of a second NO2 in the vicinity of the cross-adsorbed one. On the contrary it is adsorbed as well.
4. Discussion
All the adsorption data computed for Y and X are gathered in Fig. 9 for the identification of the best structures according to their thermodynamic selectivity for NOx over water. Fig. 9's upper right square i.e., with x and y values > 0 contains the selective materials, namely materials where both the interaction energies of NO and NO2 are in absolute value higher than that of water. According to this graph, the selective materials are Cu(I)Y, PdY, FeY, Cu(I)X, PtX, PdX, FeX and CoX. | ||
| Fig. 9 This map contains all the results of adsorptions on Y (blue colour) and X (red colour). The axes represent the subtractions of the interaction energies between H2O and NO (x) and H2O and NO2 (y). The up and right corner contains the selective cations. | ||
4.1 Identification of the best selective materials
The next step was to determine the best cation/zeolite pair. As observed by comparing Fig. 3 and 6, adsorption energies were almost always higher for X than for Y zeolites. Consequently, the regeneration criterion favours Y. Moreover, X is known to be much more hydrophilic82 than Y, which makes it less stable in the presence of high levels of water.83 Therefore, Y zeolite is the preferred candidate between the two zeolites.The best compensating metals for Y were Cu(I), Pd and Fe(II). Palladium presents high selectivity, but its high cost and low availability calls for alternative options. On the other hand, both Cu(I) and Fe(II) showed great selectivity (especially iron) and are both cheap and abundant. Consequently, Cu+ and Fe2+ embedded on Y are the most suitable cations for our application.
To more thoroughly evaluate the accuracy of our results obtained with the D2 level of theory, we utilized the MBD (many-body dispersion) correction to calculate the adsorption energies of FeY with NO, NO2, and H2O. Unlike D2, which only considers the pairwise interactions between atoms, the MBD correction accounts for the many-body effects arising from interactions involving three or more atoms.
Our calculations using the MBD correction yielded adsorption energies of −210.5 kJ mol−1, −157.1 kJ mol−1, and −104.2 kJ mol−1 for NO, NO2, and H2O, respectively. These results are consistent with the trends observed using the D2 method, which suggests that many-body effects do not significantly affect the accuracy of the D2 results for our zeolite systems.
However, it is worth noting that the MBD correction can be more computationally expensive than the D2 method and may be necessary for more complex systems or for obtaining highly accurate results. By using both methods in our study, we were able to assess the reliability of the D2 approach and validate our findings.
4.2 Bond and regeneration analysis and formation of by-products assessment for Cu(I) and Fe(II)
It is imperative for the application that the material is able to regenerate after the operational hours. Thus, it is important to know if during the adsorption the gases have their intramolecular bonds stretched. We use the term bond activation to call the extensive bond stretching. We understand bond stretching as a tendency of the gas adsorbed, to further react leading to the formation of by-products. It is possible that that these by-products will hinder the regeneration of the material rendering it practically useless after its operational hours. The bond stretching can be measured by a subtraction of the intramolecular bond lengths of the gases before and after the adsorption. This analysis is carried out only for the most prominent structures Cu(I)Y and FeY and the results are presented in Table 3. Moreover, Bader charge transfers (Table 4) and charge density differences (Fig. 10), that occurred due to the adsorption, were calculated to rationalize the bond elongations. The aforementioned calculations have also been performed for Pd, Pt, Co and Ni promoting Y, during the treatment of NO2, only, and they are provided in the ESI† (Tables S4, S6 and Fig. S11) for comparison.| Gas species concerned | NO | NO2 | H2O | ||
|---|---|---|---|---|---|
| Bond | N–O | O1–NO | O2–NO | H1–OH | H2–OH |
| Initial length (Å) | 1.17 | 1.23 | 1.23 | 0.97 | 0.97 |
| Cu(I)Y (Å) | 0.02 (2%) | 0.08 (7%) | 0.02 (2%) | 0.03 (3%) | 0.00 (0%) |
| FeY (Å) | 0.00 (0%) | 0.31 (26%) | −0.04 (−3%) | 0.00 (0%) | 0.01 (1%) |
| Complex | Atom | Charge difference |
|---|---|---|
| Cu–NO | O | 0.042 |
| N | −0.254 | |
| Cu(I) | 0.144 | |
| Cu–N–O2 | O1 | −0.156 |
| O2 | −0.134 | |
| N | −0.204 | |
| Cu(I) | 0.102 | |
| Cu–H2O | O1 | −0.006 |
| H1 | 0.053 | |
| H2 | 0.037 | |
| Cu(I) | −0.016 | |
| Fe–NO | O | 0.092 |
| N | −0.169 | |
| Fe | 0.072 | |
| Fe–O1–N|O2 | O1 | −0.370 |
| O2 | −0.021 | |
| N | 0.040 | |
| Fe | 0.233 | |
| Fe–H2O | O | −0.004 |
| H1 | 0.083 | |
| H2 | 0.049 | |
| Fe | 0.065 |
 | ||
| Fig. 10 Charge density differences that occurred during the adsorption of NO on a) Cu(I)Y and b) FeY, of H2O on c) Cu(I)Y and d) FeY and of NO2 on e) Cu(I)Y and f) FeY. The isosurfaces have a density 0.002 e/a30. | ||
Nitrosyl ligands of transition metals are known to be bent.84 As the angle becomes more bent, nitrosyls are expected to behave as NO−. They donate electron charge through σ-donation and accept it back through π-backdonation, the latter being more prominent. To accept electrons, monovalent copper will have to make a sd hybridization. Then they are returned to NO due to π-backdonation. Fig. 10a depicts clearly the rehybridization of Cu orbitals based on a charge density difference before and after adsorption. Upon accepting charge according to Bader population analysis, NO fills its antibonding  orbital thus reducing the N–O bond order. The breaking of symmetry of NO's
  and
and  is followed by a charge accumulation perpendicular to the plane Cu–N–O. The orbitals created have a contribution from the sd hybrids of Cu and the antibonding π of NO leading to a π-backdonation.
We treat the adsorption on Fe in a similar manner. No bond elongation is found in this case (Table 3). Bader charges of 0.092, −0.169 and 0.072 e were distributed on Fe, N and O respectively (Table 4). The charge flow towards NO is now approximately 1/3 of that calculated for Cu(I). A Fe–N–O angle of 166° is predicted.
It is notable that, in agreement with the literature, the smaller charge transfer to NO from Fe than from Cu(I), is accompanied with a smaller deviation of the M–N–O angle from linearity. We observe clearly from the charge density difference (Fig. 10b) the depopulation of the orbital between N and O, due to σ-donation. We can also observe the rehybridization of the iron's orbitals with a strong 3dz2 character, for the formation of a charge accumulation between N and Fe. The π-backdonation balances almost perfectly the donation to Fe leaving N with a small charge.
Strong polarization of the charge density of water is predicted, towards O, increasing its already strong dipole moment. This leads to strong induction and electrostatic forces connecting it to Cu. Adding up the Bader charges of water though, we see that there is charge transfer from it to the material and more specifically to Cu(I). The presence of the positive Cu(I) and the H-bond formed, further pushes electron charge towards water's O. The charge difference Fig. 10c highlights excellently all the aspects discussed and reveals a charge accumulation between O and Cu. The latter will have to perform a sd hybridization to accept this charge as its 3d orbitals are full. This is clearly shown as a yellow shell around Cu in Fig. 10c.
As for Fe, a similar approach could be taken. Negligible bond stretching was computed equal to 0.00 (0%) and 0.01 Å (1%) (Table 3) for the two O–H bonds. Bader charge transfer of −0.004 e was attributed to O and 0.083, 0.049 and 0.065 e moved from H1, H2 and Fe respectively (Table 4). This charge difference between the H atoms is well illustrated in the charge density difference in Fig. 10d.
The same reasoning as for Cu can be adopted here too. Iron favours the perpendicular adsorption and water is unable to form H-bonds. The nucleophilic attack of O on Fe should be more plausible now as Fe has available d orbitals to accept a σ-donation. On the other hand, the charge transfer is mitigated due to oxygen's strong electronegativity. The charge–dipole interaction is now stronger than before. Fig. 10d reveals a charge redistribution of iron's orbitals during the adsorption, like the one we observed for NO. Charge density is pushed from H atoms towards O to feed the bond with Fe.
To provide a more complete bond stretching analysis, we study how the bonds of NO2 evolve in different potential wells with particularly prominent depth. For this reason, we consider the adsorption when NO2 adsorbs: 1) through N while O atoms remain away (M–N–O2), 2) through O1 while N and O2 are ordered parallelly to the 6MR (M–O1–N–O2) and 3) through O1 while N and O2 are ordered perpendicularly to the 6MR (M–O1–N|O2). We provide bond length elongations, Bader charge transfers and charge density differences in Tables S4, S6 and Fig. S11† respectively, for all these adsorption modes but we comment in the text only the data associated to the stablest configurations.
4.2.3.1 Cu(I)Y–N–O2. Upon adsorption on Cu(I) through N, NO2 shows low bond activation. Elongations of 0.08 (7%) and 0.02 (2%) Å are computed for the N–O bonds of NO2 (Table 3). These findings are supported by Bader charge transfers of −0.156 and −0.134 e on O1 and O2 respectively (Table 4). In addition, N received −0.204 and Cu 0.102 e. The difference between the O atoms is evident from the adsorption mode as one O approaches one Al atom of the ring. The interaction energy calculated for this adsorption mode was equal to −122.7 kJ mol−1.
As shown from Fig. 10e, charge flows towards NO2. It also highlights how polarization induced from the presence of the O of NO2, upon the charge of O and Al of the 6MR, forces them to rehybridize their orbitals resulting in some non-bonding attraction. This induction will motivate a secondary flow of charge towards the O of NO2 that remains close to the 6MR, disclosing the difference mentioned above. This physical interaction between O and the atoms of the 6MR, further stabilizes the adsorption. A sd hybridization will enable Cu to accept charge from the antibonding LUMO of NO2 due to the favourable arrangement of the complex, but π-backdonation is dominates. This is proven by the bond elongations and the Bader charge transfers which imply the increased occupation of the antibonding LUMO of NO2.
4.2.3.2 FeY–O1–N|O2. Next, we move to the perpendicular adsorption on Fe (Fe–O1–N|O2). We found very similar bonding characteristics to the parallel mode. Exactly the same elongations are predicted as before namely, 0.31 (26%) and −0.04 (−3%) Å (Table 3). The Bader charge transfers are −0.370 and −0.021 e to the O atoms, 0.040 e to N and 0.233 e to Fe (Table 4). The interaction energy calculated at −192.4 kJ mol−1, is only 0.1 kJ mol−1 larger than the parallel.
Table S6† reveals strong charge transfer only in the cases of Cu(I), Co and Fe. The big difference between Cu(I) and the other two cations is its filled d subshell. Therefore, σ-donation, which destabilizes the gas, is seriously obstructed for Cu(I). The charge transfer from Cu(I) to NO2 results to be high because there is no competition between π-backdonation and σ-donation. On the other hand, Co and Fe have unfilled d orbitals, and are prone to both electron donation phenomena. We can realize the σ-donation for Fe and Co, in Fig. S11,† from the charge deficit between N and O. This charge deficit is not observed in the case of Cu(I) according to same figures.
To conclude, we believe that, differently from FeY, adsorption on Cu(I)Y should not impose any troubling bond activation to any of the gases. NO and H2O remained inactive at all instances. The intramolecular bonds of NO2 were slightly extended upon adsorption on Cu(I) reaching an extension of 7%. In the case of Fe, the two adsorption modes through O were equivalent, both accounting for the interaction energy, but also the bond O1–N elongation of 26%.
The alarming stretching of NO2 during adsorption on FeY, regarding the most prominent configurations suggests that the formation of by-products is possible. Despite this downside, Fe2+ showed notable selectivity and its implementation as an extraframework cation by a different zeolite could lead to smaller interaction energies and bond activations. To better understand the regeneration potential of a zeolite, future studies should be focused on the forces that determine the balance between σ-donation and π-backdonation. We showed that when both happen at the same time, the regenerability of the material is put in jeopardy.
5. Conclusions
The goal of this study was to screen the adsorption capability of NOx in the presence of H2O on a series of FAU with different cations and Si/Al ratios using periodic DFT calculations. The purpose was to identify a zeolite which can be applied in vehicles working in closed-spaced environments, trap exhaust gas NOx in ambient temperatures and release them at higher ones. High temperatures will enable catalysts to operate efficiently and transform NOx into harmless N2, protecting the health of workers that are exposed to the air pollutants. Furthermore, this material has to be regenerable, so that it can be used several times. Pt/Pd promoting zeolites have been successfully implemented in the past, but due to their high cost, we search for alternatives. For this investigation, faujasites including monovalent cations Li, Na, K, Rb, Cs, Cu and Ag and divalent cations Ca, Ba, Zn, Cu, Pt, Pd, Fe, Co, and Ni were tested. Based primarily on the thermodynamic selectivity and secondarily on the availability and price of the materials, FeY and Cu(I)Y were identified as the best candidates for this application. These two formulations have further been explored using Bader charge analysis and charge density differences to shed light on charge transfer and bond stretching upon adsorption. Quite a significant change for the N–O1 bond of NO2 was measured while adsorbed on Fe(II)Y (26%), suggesting that it is possibly prone to further chemical reactions.This is the first screening of such a significant size regarding the selective trapping of NOx against water. The only structure that made it through the screening of selectivity and regenerability was Cu(I)Y. Nonetheless, Fe(II) showed excellent selectivity, and due to its low price and high availability, its implementation as an extraframework cation should by tested by other zeolites too. To better understand the regeneration potential of a zeolite, future studies should be focused on the forces that determine the balance between σ-donation and π-backdonation. We showed that when both happen at the same time, the regenerability of the material is put in jeopardy.
Conflicts of interest
There are no conflicts of interest to declare.Acknowledgements
This work was granted access to the HPC resources of TGCC under the allocation 2022-A0120810433 made by GENCI. This work is partially funded by the French National Research Agency NOA Project (ANR-20-CE08-0024).References
- A. K. Jain, Z. Tao, X. Yang and C. Gillespie, J. Geophys. Res., 2006, 111, D06304 Search PubMed.
- L. Jaeglé, L. Steinberger, R. V. Martin and K. Chance, Faraday Discuss., 2005, 130, 407 RSC.
- M. Amann, D. Derwent, B. Forsberg, O. Hänninen, F. Hurley, M. Krzyzanowski, F. de Leeuw, S. Liu, C. Mandin, J. Schneider, P. Schwarze and D. Simpson, Health risks of ozone from long-range transboundary air pollution, WHO Regional Office for Europe, DK-2100 Copenhagen Ø, Denmark, 2008 Search PubMed.
- V. Strand, M. Svartengren, S. Rak, C. Barck and G. Bylin, Eur. Respir. J., 1998, 12, 6–12 CrossRef CAS PubMed.
- R. W. Atkinson, I. M. Carey, A. J. Kent, T. P. van Staa, H. R. Anderson and D. G. Cook, Epidemiology, 2013, 24, 44–53 CrossRef PubMed.
- Nitrogen oxides (NOx) emissions — European Environment Agency, https://www.eea.europa.eu/data-and-maps/indicators/eea-32-nitrogen-oxides-nox-emissions-1/assessment.2010-08-19.0140149032-3, (accessed September 2, 2020).
- L. Castoldi, L. Lietti, R. Bonzi, N. Artioli, P. Forzatti, S. Morandi and G. Ghiotti, J. Phys. Chem. C, 2011, 115, 1277–1286 CrossRef CAS.
- R. Büchel, R. Strobel, A. Baiker and S. E. Pratsinis, Top. Catal., 2009, 52, 1799–1802 CrossRef.
- Steam: its generation and use, ed. J. B. Kitto, Babcock & Wilcox, Barberton, Ohio, 41st edn, 1 print, 2005 Search PubMed.
- H. S. Latha, K. V. Prakash, M. Veerangouda, D. Maski and K. T. Ramappa, Int. J. Curr. Microbiol. Appl. Sci., 2019, 8, 1553–1559 CrossRef CAS.
- Y. Ji, D. Xu, S. Bai, U. Graham, M. Crocker, B. Chen, C. Shi, D. Harris, D. Scapens and J. Darab, Ind. Eng. Chem. Res., 2017, 56, 111–125 CrossRef CAS.
- Y. Ji, S. Bai, D. Xu, D. Qian, Z. Wu, Y. Song, R. Pace, M. Crocker, K. Wilson, A. Lee, D. Harris and D. Scapens, Appl. Catal., B, 2020, 264, 118499 CrossRef.
- H.-Y. Chen, J. E. Collier, D. Liu, L. Mantarosie, D. Durán-Martín, V. Novák, R. R. Rajaram and D. Thompsett, Catal. Lett., 2016, 146, 1706–1711 CrossRef CAS.
- Y. Ryou, J. Lee, S. J. Cho, H. Lee, C. H. Kim and D. H. Kim, Appl. Catal., B, 2017, 212, 140–149 CrossRef CAS.
- H.-Y. Chen, J. E. Collier, D. Liu, L. Mantarosie, D. Durán-Martín, V. Novák, R. R. Rajaram and D. Thompsett, Catal. Lett., 2016, 146, 1706–1711 CrossRef CAS.
- Y. Ji, S. Bai and M. Crocker, Appl. Catal., B, 2015, 170–171, 283–292 CrossRef CAS.
- Y. Ryou, J. Lee, H. Lee, C. H. Kim and D. H. Kim, Catal. Today, 2017, 297, 53–59 CrossRef CAS.
- H.-Y. Chen, S. Mulla, E. Weigert, K. Camm, T. Ballinger, J. Cox and P. Blakeman, SAE Int. J. Fuels Lubr., 2013, 6, 372–381 CrossRef CAS.
- R. R. Rajaram, H.-Y. Chen and D. Liu, US Pat., US20150158023A1, 2015 Search PubMed.
- Y. Gu and W. S. Epling, Appl. Catal., A, 2019, 570, 1–14 CrossRef CAS.
- What Are Diesel Emissions, https://dieselnet.com/tech/emi_intro.php, (accessed June 15, 2022).
- Gaseous Emissions, https://dieselnet.com/tech/emi_gas.php, (accessed June 15, 2022).
- A. J. Stone, The Theory of Intermolecular Forces, Clarendon Press, Oxford, 2nd edn, 1997 Search PubMed.
- R. T. Yang, in Adsorbents: Fundamentals and Applications, John Wiley & Sons, Ltd, New Jersey, 2003, pp. 157–190 Search PubMed.
- M. Sun, Q. Gu, A. Hanif, T. Wang and J. Shang, Chem. Eng. J., 2019, 370, 1450–1458 CrossRef CAS.
- T. Ayadi, M. Badawi, L. Cantrel and S. Lebègue, Mol. Syst. Des. Eng., 2022, 7, 422–433 RSC.
- G. Delahay, S. Kieger, N. Tanchoux, P. Trens and B. Coq, Appl. Catal., B, 2004, 52, 251–257 CrossRef CAS.
- G. Delahay, B. Coq, S. Kieger and B. Neveu, Catal. Today, 1999, 54, 431–438 CrossRef CAS.
- I. Khalil, H. Jabraoui, G. Maurin, S. Lebègue, M. Badawi, K. Thomas and F. Maugé, J. Phys. Chem. C, 2018, 122, 26419–26429 CrossRef CAS.
- V. V. Speybroeck, K. Hemelsoet, L. Joos, M. Waroquier, R. G. Bell and C. R. A. Catlow, Chem. Soc. Rev., 2015, 44, 7044–7111 RSC.
- I. Khalil, H. Jabraoui, S. Lebègue, W. J. Kim, L.-J. Aguilera, K. Thomas, F. Maugé and M. Badawi, Chem. Eng. J., 2020, 402, 126264 CrossRef CAS.
- E. P. Hessou, H. Jabraoui, I. Khalil, M.-A. Dziurla and M. Badawi, Appl. Surf. Sci., 2021, 541, 148515 CrossRef CAS.
- F. Jensen, Introduction to computational chemistry, John Wiley & Sons, Chichester, England; Hoboken, NJ, 2nd edn, 2007.
- G. Kresse and J. Hafner, Phys. Rev. B: Condens. Matter Mater. Phys., 1993, 47, 558–561 CrossRef CAS PubMed.
- J. P. Perdew, K. Burke and M. Ernzerhof, Phys. Rev. Lett., 1996, 77, 3865–3868 CrossRef CAS PubMed.
- G. Kresse and D. Joubert, Phys. Rev. B: Condens. Matter Mater. Phys., 1999, 59, 1758–1775 CrossRef CAS.
- M. D. Strømsheim, N. Kumar, S. Coriani, E. Sagvolden, A. M. Teale and T. Helgaker, J. Chem. Phys., 2011, 135, 194109 CrossRef PubMed.
- S. Grimme, J. Comput. Chem., 2006, 27, 1787–1799 CrossRef CAS PubMed.
- S. Grimme, J. Comput. Chem., 2004, 25, 1463–1473 CrossRef CAS PubMed.
- A. Tkatchenko, R. A. DiStasio, R. Car and M. Scheffler, Phys. Rev. Lett., 2012, 108, 236402 CrossRef PubMed.
- A. Ambrosetti, A. M. Reilly, R. A. DiStasio and A. Tkatchenko, J. Chem. Phys., 2014, 140, 18A508 CrossRef PubMed.
- T. Bučko, S. Lebègue, J. Hafner and J. G. Ángyán, J. Chem. Theory Comput., 2013, 9, 4293–4299 CrossRef PubMed.
- E. P. Hessou, W. G. Kanhounnon, D. Rocca, H. Monnier, C. Vallières, S. Lebègue and M. Badawi, Theor. Chem. Acc., 2018, 137, 161 Search PubMed.
- V. I. Anisimov, J. Zaanen and O. K. Andersen, Phys. Rev. B: Condens. Matter Mater. Phys., 1991, 44, 943–954 CrossRef CAS PubMed.
- J. Zaanen, O. Jepsen, O. Gunnarsson, A. T. Paxton, O. K. Andersen and A. Svane, Phys. C, 1988, 153–155, 1636–1641 CrossRef CAS.
- G. Lan, J. Song and Z. Yang, J. Alloys Compd., 2018, 749, 909–925 CrossRef CAS.
- R. F. W. Bader, Acc. Chem. Res., 1985, 18, 7 CrossRef.
- W. Tang, E. Sanville and G. Henkelman, J. Phys.: Condens. Matter, 2009, 21, 084204 CrossRef CAS PubMed.
- E. Sanville, S. D. Kenny, R. Smith and G. Henkelman, J. Comput. Chem., 2007, 28, 899–908 CrossRef CAS PubMed.
- G. Henkelman, A. Arnaldsson and H. Jónsson, Comput. Mater. Sci., 2006, 36, 354–360 CrossRef.
- M. Yu and D. R. Trinkle, J. Chem. Phys., 2011, 134, 064111 CrossRef PubMed.
- W. H. Baur, Am. Mineral., 1964, 49, 697–704 CAS.
- Database of Zeolite Structures, https://www.iza-structure.org/databases/, (accessed June 16, 2022).
- S. Bordiga, E. Garrone, C. Lamberti, A. Zecchina, C. O. Areán, V. B. Kazansky and L. M. Kustov, J. Chem. Soc., Faraday Trans., 1994, 90, 3367–3372 RSC.
- C. Abrioux, B. Coasne, G. Maurin, F. Henn, M. Jeffroy and A. Boutin, J. Phys. Chem. C, 2009, 113, 10696–10705 CrossRef CAS.
- Z. Nour, D. Berthomieu, Q. Yang and G. Maurin, J. Phys. Chem. C, 2012, 116, 24512–24521 CrossRef CAS.
- T. Frising and P. Leflaive, Microporous Mesoporous Mater., 2008, 114, 27–63 CrossRef CAS.
- F. Porcher, M. Souhassou, Y. Dusausoy and C. Lecomte, Eur. J. Mineral., 1999, 11, 333–344 CrossRef CAS.
- G. R. Eulenberger, D. P. Shoemaker and J. G. Keil, J. Phys. Chem., 1967, 71, 1812–1819 CrossRef CAS.
- H. Herden, W.-D. Einicke, R. Schöllner, W. J. Mortier, L. R. Gellens and J. B. Uytterhoeven, Zeolites, 1982, 2, 131–134 CrossRef CAS.
- G. T. Palomino, S. Bordiga, A. Zecchina, G. L. Marra and C. Lamberti, J. Phys. Chem. B, 2000, 104, 8641–8651 CrossRef.
- N. D. Hutson and R. T. Yang, AIChE J., 2000, 46, 2305–2317 CrossRef CAS.
- L. Zhu and K. Seff, J. Phys. Chem. B, 2000, 104, 8946–8951 CrossRef CAS.
- L. Zhu and K. Seff, J. Phys. Chem. B, 2001, 105, 12221–12222 CrossRef CAS.
- G. L. Marra, A. N. Fitch, A. Zecchina, G. Ricchiardi, M. Salvalaggio, S. Bordiga and C. Lamberti, J. Phys. Chem. B, 1997, 101, 10653–10660 CrossRef CAS.
- C. E. A. Kirschhock, B. Hunger, J. Martens and P. A. Jacobs, J. Phys. Chem. Bt, 2000, 104, 439–448 CrossRef CAS.
- P. Norby, F. I. Poshni, A. F. Gualtieri, J. C. Hanson and C. P. Grey, J. Phys. Chem. B, 1998, 102, 839–856 CrossRef CAS.
- P. Rejmak, M. Sierka and J. Sauer, Phys. Chem. Chem. Phys., 2007, 9, 5446–5456 RSC.
- Y. H. Yeom, S. B. Jang, Y. Kim, S. H. Song and K. Seff, J. Phys. Chem. B, 1997, 101, 6914–6920 CrossRef CAS.
- P. B. Peapples-Montgomery and K. Seff, J. Phys. Chem., 1992, 96, 5962–5965 CrossRef CAS.
- I. E. Maxwell, J. J. D. Boer and R. S. Downing', J. Catal., 1980, 61, 10 Search PubMed.
- G. Bergeret, P. Gallezot and B. Imelik, J. Phys. Chem., 1981, 85, 411–416 CrossRef CAS.
- S. H. Lee, Y. Kim and K. Seff, J. Phys. Chem. B, 2000, 104, 2490–2494 CrossRef CAS.
- J. R. Pearce, W. J. Mortier, J. B. Uytterhoeven and J. H. Lunsford, J. Chem. Soc., Faraday Trans. 1, 1981, 77, 937–946 RSC.
- D. Bae and K. Seff, Microporous Mesoporous Mater., 1999, 33, 265–280 CrossRef CAS.
- H. D. Simpson and H. Steinfink, J. Am. Chem. Soc., 1969, 91, 6225–6229 CrossRef CAS.
- D. Bae and K. Seff, Microporous Mesoporous Mater., 2000, 40, 219–232 CrossRef CAS.
- F. Göltl and J. Hafner, J. Chem. Phys., 2012, 136, 064503 CrossRef PubMed.
- P. Rejmak, E. Broclawik, K. Góra-Marek, M. Radoń and J. Datka, J. Phys. Chem. C, 2008, 112, 17998–18010 CrossRef CAS.
- A. Daouli, E. P. Hessou, H. Monnier, M.-A. Dziurla, A. Hasnaoui, G. Maurin and M. Badawi, Phys. Chem. Chem. Phys., 2022, 24, 15565–15578 RSC.
- F. Göltl, P. Müller, P. Uchupalanun, P. Sautet and I. Hermans, Chem. Mater., 2017, 29, 6434–6444 CrossRef.
- C. Wang, H. Guo, S. Leng, J. Yu, K. Feng, L. Cao and J. Huang, Crit. Rev. Solid State Mater. Sci., 2021, 46, 330–348 CrossRef CAS.
- L. Zhang, K. Chen, B. Chen, J. L. White and D. E. Resasco, J. Am. Chem. Soc., 2015, 137, 11810–11819 CrossRef CAS PubMed.
- C. Lamberti, A. Zecchina, E. Groppo and S. Bordiga, Chem. Soc. Rev., 2010, 39, 4951–5001 RSC.
Footnote |
| † Electronic supplementary information (ESI) available. See DOI: https://doi.org/10.1039/d3me00044c |
| This journal is © The Royal Society of Chemistry 2023 |