
Structure and properties of polymer/two-dimensional nanomaterials studied via molecular dynamics simulation: a review
Meng Yu
Zhou
a,
Jun
Liu
*abc and
Li Qun
Zhang
 *abc
*abc
aCenter of Advanced Elastomer Materials, Beijing University of Chemical Technology, People's Republic of China. E-mail: zhanglq@mail.buct.edu.cn
bState Key Laboratory of Organic-Inorganic Composites, Beijing University of Chemical Technology, People's Republic of China. E-mail: lj200321039@163.com
cKey Laboratory of Beijing City on Preparation and Processing of Novel Polymer Materials, Beijing University of Chemical Technology, People's Republic of China
First published on 31st October 2022
Abstract
Attributed to their excellent mechanical, electrical and thermal properties, two-dimensional (2D) nanomaterials have attracted considerable scientific and technological attention as ideal nanofillers for the design and fabrication of high-performance polymer nanocomposites (PNCs). In this review, based on molecular dynamics (MD) simulation, we focus our attention on summarizing the complicated effects of the filler characteristics such as chemical components, loading, size, aspect ratio, the polymer-filler interfacial interaction and the dispersion state of the fillers on the mechanical, viscoelastic and thermal and electrical conductivity properties of PNCs. Emphasis is placed on the following four fillers such as graphene/graphene oxide, boron nitride (BN), MXenes and montmorillonite (MMT). Therefore, graphene and its derivatives provide optimal enhancement in terms of these four properties, followed closely by the emerging MXenes with rich functional groups. Besides, MMT and BN are widely applied to improve the strength and thermal conductivity of polymers, respectively, benefiting from their excellent intrinsic properties. Furthermore, the excellent performance of 2D nanosheet based PNCs not only depends on its optimal loading, high aspect ratio and uniform dispersion of nanofillers but also is closely related to its compatibility with the polymer, which can be realized via functionalization. Lastly, some future challenges and opportunities of polymer/2D nanomaterials via MD simulations are put forward.
 Meng Yu Zhou | Mengyu Zhou is a PhD candidate at the Beijing University of Chemical Technology. Her research interest is mainly focused on the multiscale simulation of mechanical properties of elastomer nanocomposites. |
 Jun Liu | Jun Liu is a Professor at the Beijing University of Chemical Technology. His research interests are high throughput computer simulation of polymers with emphasis on the study of structure–property relations and rational design of high-performance elastomer materials. |
 Li Qun Zhang | Liqun Zhang is a Professor at the Beijing University of Chemical Technology. His research interests focus on rubber science and technology, polymer nanocomposites, bio-based polymeric materials, etc. |
Design, System, ApplicationAttributed to their excellent mechanical, electrical and thermal properties, two-dimensional (2D) nanomaterials have attracted considerable scientific and technological attention as ideal nanofillers for the design and fabrication of high-performance polymer nanocomposites (PNCs). Herein, we review the MD simulation methods for the mechanical, viscoelastic, electrical and thermal conductivity properties of 2D nanosheet filled PNCs and related molecular mechanisms. 2D nanofillers including graphene/graphene oxide, boron nitride (BN), MXenes and montmorillonite (MMT) are mainly involved. The effects of filling loading, aspect ratio, distribution, functionalization, and defects of 2D nanosheets on the above properties of PNCs are investigated. Some future challenges and opportunities of polymer/2D nanomaterials via MD simulation are also put forward. Generally, this work is expected to provide a fundamental understanding about the 2D nanomaterial filled PNCs on a molecular level, with a hope to design materials with excellent performance. |
1 Introduction
2D nanosheets1–3 can be defined as a class of freestanding nanomaterials in which two dimensions are outside the nanoscale and only one dimension is single or few atomic layers thick. The most remarkable structural feature of 2D materials is the large surface area-to-volume ratio, making them tend to be more sensitive compared with bulk materials. Secondly, strong in-plane covalent bonds and atomic layer thicknesses endow them with excellent mechanical properties such as high levels of stiffness and strength. Thirdly, the confinement of electrons in a plane also leads to 2D materials exhibiting distinguished electrical conductivity. Graphene4 is the first material to trigger active research on 2D nanomaterials, starting from Novoselov and Geim successfully obtaining graphene by mechanical exfoliation from graphite. Further, atomically thin hexagonal boron nitride (h-BN)5 was prepared, which is a layered material analogous to graphene. Besides, clay minerals represented by montmorillonite6 (MMT) are found to be natural layered materials, accompanied by wide availability and excellent stability. MXenes7,8 are an emerging 2D carbide/nitride material with a structure similar to that of graphene, which is derived from the etching of the A atomic layer (Mn + 1Xn) from the MAX phase. The existence of M and X diatoms or multiple atoms in MXenes makes them more stable. The co-existence of covalent, ionic and metallic bonds also indicates that this 2D material possesses more adjustable properties.Pure 2D nanosheets are limited in many applications, caused by the difficulty in inducing more and controlled functions. Therefore, 2D nanomaterial filled nanocomposites9–11 or hybrids are attracting increasing efforts for real applications such as energy storage, impact protection and electronics. Practically, elastomers,12 thermoplastics,13 epoxy,14 block copolymers15 and hydro/aerogels16 are widely used as a matrix, which is inspired by their desirable wear and corrosion resistance, light quality, low density and high elasticity, flexibility, controlled surface and bulk properties and other unique physical properties. However, 2D nanosheets17,18 tend to agglomerate due to the existence of strong van der Waals interactions and have poor compatibility with the matrix, which limits their exertion of excellent performance. Extensive research effort has been focused on attaining full potency of nanosheets and uniform transfer of superior properties of nanosheets to the host polymer matrix by surface modification methods,19–21 which can be generally divided into chemical modification, physical modification and element doping modification. Moreover, a significant enhancement in the nanocomposite performance also depends on proper content selection, size, shape and the arrangement design of 2D nanosheets.
To date, the progress made in 2D nanomaterial-based PNCs22–24 has been discovered in several reviews with an emphasis on preparation, functionalization and applications using experiments. However, a whole view of molecular dynamics (MD) studies on nanocomposites incorporated with 2D nanomaterials is missing. Herein, we review the MD simulation methods for the mechanical, viscoelastic, electrical and thermal conductivity properties of 2D nanosheet filled polymer nanocomposites and related molecular mechanisms. The effects of filling loading, aspect ratio, distribution, functionalization, and defects of 2D nanosheets (Fig. 1) on the above properties of PNCs are investigated. The primary intrinsic properties of 2D nanosheets are firstly introduced, followed by a comprehensive discussion of effects of structural variations in 2D nanosheets on different properties. At the same time, we are mainly concerned with the different roles of filler surface functionalization played on the transfer of interfacial properties and overall performance. Finally, brief conclusions, challenges and perspectives on 2D nanosheet filled PNCs based on MD simulations are discussed.
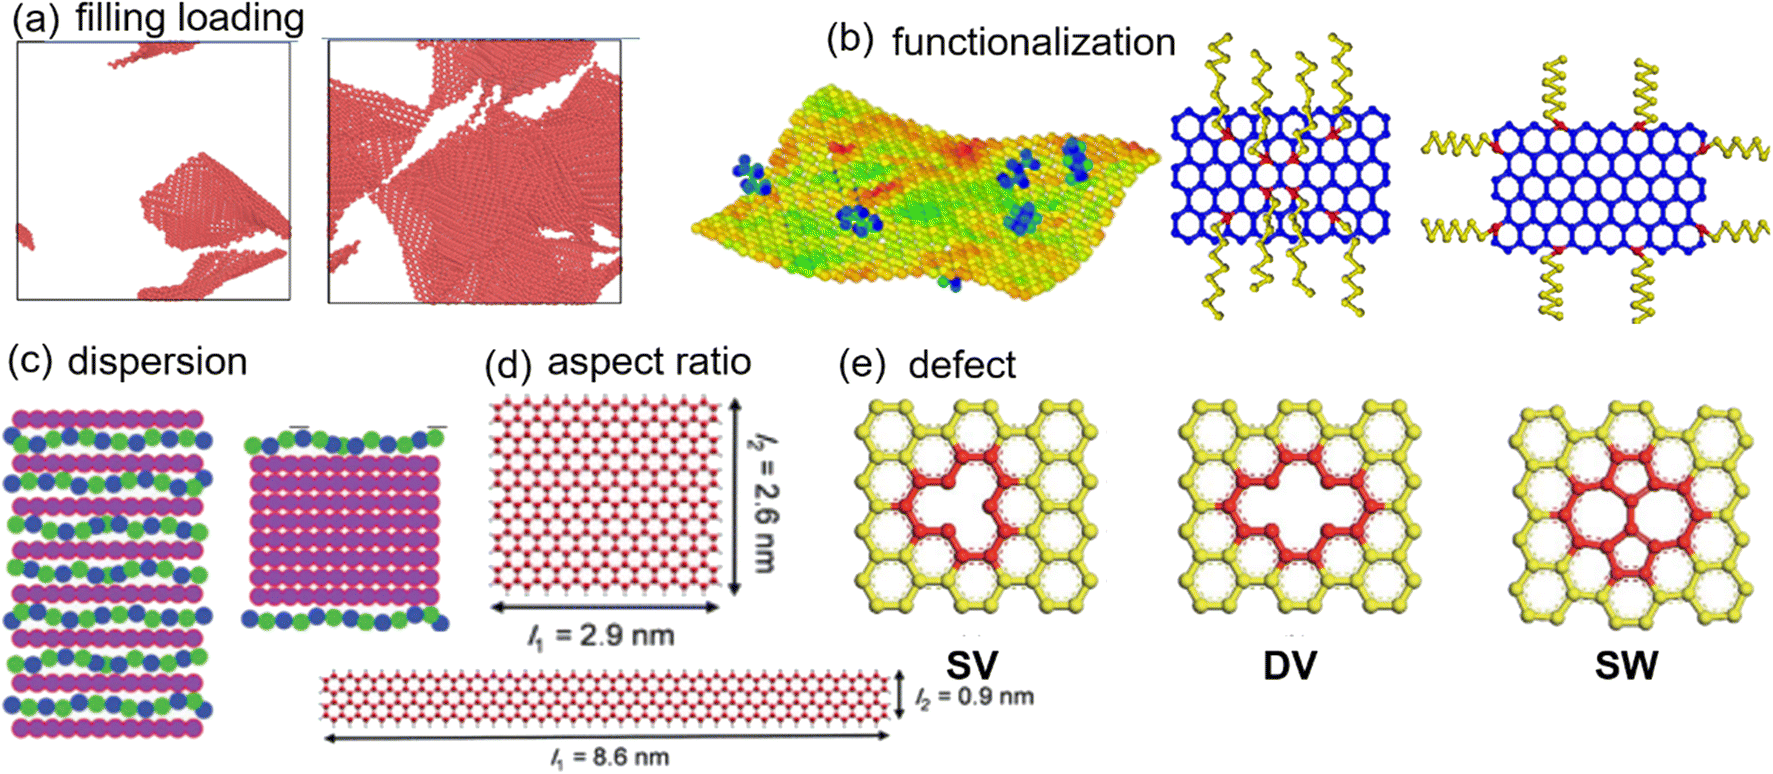 | ||
| Fig. 1 Structural pattern of 2D nanosheets (adopted from ref. 45, 54, 55, 58, and 66 with permission). | ||
2 Intrinsic properties of 2D nanosheets
Firstly, the structures (Fig. 2) and intrinsic properties of 2D nanosheets are introduced. Graphene,25 h-BN,26 MMT27 and MXenes28 are mainly involved. Graphene is a single layer of sp2-hybridized carbon atoms arranged in a hexagonal structure, and h-BN is an isomorph of graphene, but its molecular backbone is made up of boron and nitrogen atoms instead of carbon atoms. MMT is a kind of hydrated aluminum phyllosilicate consisting of a negatively charged layered structure and interlayer cations. The layered structure contains an aluminum octahedral layer sandwiched between two silica tetrahedral layers, and interlayer cations (Na+ and Ca2+) are intercalated to balance the charges. MXenes are new 2D carbon/nitride nanomaterials prepared by the denudation of atom layer A in the MAX phase utilizing the weak interactions between the A lamellar and MX lamellar structures. Their general formula can be expressed as Mn+1XnTx, where M is an early transition metal, X is carbon/nitrogen, and Tx is the functional group (–OH, –F, and![[double bond, length as m-dash]](https://www.rsc.org/images/entities/char_e001.gif) O) attached to the surface produced by chemical etching. Benefiting from their versatile machining, hydrophilicity, adjustable conductivity and rich surface functional groups, MXenes have also received preferred attention recently.
O) attached to the surface produced by chemical etching. Benefiting from their versatile machining, hydrophilicity, adjustable conductivity and rich surface functional groups, MXenes have also received preferred attention recently.
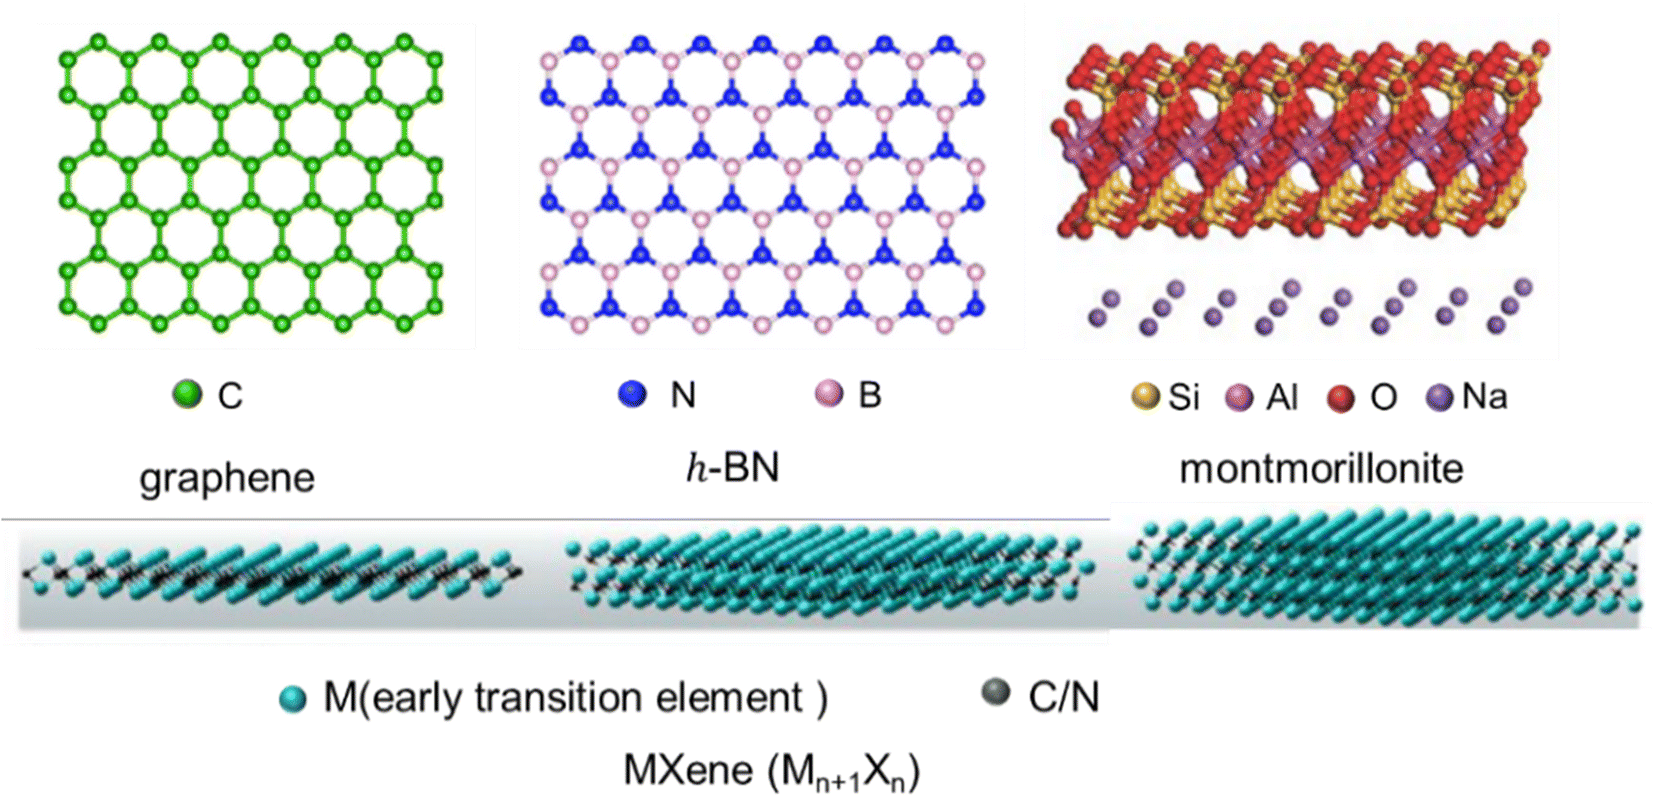 | ||
| Fig. 2 The structure of 2D nanosheets (graphene, h-BN, MMT, and MXenes) (adopted from ref. 25–28 with permission). | ||
Herein, intrinsic properties of 2D nanosheets are summarized in Table 1. It can be concluded that the performance of graphene is optimal in terms of mechanical properties, and electrical and thermal conductivity. The overall performance of MXenes is also impressive with better stability of M/X multiple atoms and abundant functional groups. For h-BN, the most remarkable feature is high thermal conductivity. As a reinforced filler, the advantages of MMT are wide sources and good stability. Nevertheless, the performances of 2D nanosheet-based nanocomposites not only depend on the size, shape and decoration of the nanofiller, but also are closely related to the compatibility of the polymer, which will be discussed in depth in the following sections.
| 2D nanosheets | Mechanical properties (GPa) | λ (W mK−1) | Electrical properties (S cm−1) |
|---|---|---|---|
| Graphene | Modulus = 1000 | 5000 | σ = 108 |
| Strength = 130 | |||
| GO | Modulus = 200–250 (ref. 29) | 10–20 (ref. 30) | σ = 10−6–10−3 (ref. 31) |
| h-BN | Modulus = ∼810 | 300–360 (ref. 32) | σ = 10−14 (ref. 33) |
| MMT | Modulus = 255 (ref. 27) | 0.5–1 (ref. 34) | σ = 10−3 (ref. 35) |
| MXene | Modulus = 500–600 (ref. 36) | 55.8 (ref. 37) | σ = 4000–9800 (ref. 38) |
3 Mechanical properties of 2D nanosheet filled PNCs
A variety of simulation studies on modelling, calculation and analysis of enhanced mechanical and fracture properties of 2D nanosheet/polymer composites are summarized. The inherent mechanisms of improved mechanical properties from atomic views are particularly discussed. Three models,39 namely concentration model (CM), stacked model (SM) and interfacial model (IM), have been used here to estimate improvements under the effect of filling loading, size, aspect ratios, surface modification, dispersion and stacking conditions of 2D nanomaterials.3.1 Computational simulation technologies of mechanical properties
Large-scale atomic/molecular massively parallel simulator (LAMMPS)102 is commonly used for the modeling and simulation processes. The isothermal-isobaric (NPT) ensemble is required to be employed to obtain a system with less residual stresses and proper density, and the NVT ensemble is applied for further analyzing atomic information and calculating properties. In all-atom (AA) MD simulations, nanocomposite models are constructed mainly based on their real atomic compositions and configurations. Force fields such as Tersoff99 and AIREBO100 are commonly used to provide inter- and intramolecular atomic interactions of 2D nanosheets, which can accurately capture the interaction between crystalline atoms. The Clayff force field,101 which is specifically proposed for clay minerals, is widely used in the calculation of MD simulation of MMT. Besides, COMPASS, CVFF and OPLS are generally used to describe atomic interactions of the polymer and nanocomposites. While in coarse-grained (CG) MD simulations,102 several atoms are bundled into a bead, the bonded interactions can be roughly represented by FENE or harmonic bonds, and nonbonded interactions can be denoted by the Lennard–Jones (LJ) potential. Alternatively, the mechanical matching method or structural matching method is widely applied to obtain a CG force field to describe the interaction between beads, which can reproduce atomic chemical properties.103 The time step is generally ∼fs in MD simulation, and the simulation time can reach the ∼ns or ∼μs level according to the specific calculation process. Strain constant methods40,41 are often employed to obtain stress–strain curves, which are one of the fundamental characters to investigate and predict tensile/shear properties. Typically, the strain rate is commonly selected as 107 s−1–1010 s−1 to accommodate the time step (∼fs) of MD simulation. Suppose that the z-axis is the movement direction, the stress σzz = (1 + v) (−Pzz + P), where P = ∑i (Pii/3) is the hydrostatic pressure, Pzz is the pressure in the z-direction, and ν is Poisson's ratio. The stress–strain responses from the uniaxial tensile tests in the x-direction, y-direction and z-direction are applied to calculate C11, C22 and C33 respectively, and the results from shear deformation in the xy-direction, yz-direction and xz-direction are used to determine C66, C55, and C44, respectively. The Lamé coefficients λ and μ could be determined by the following equations:| λ = 1/3(C11 + C22 + C33) − 2/3(C44 + C55 + C66) | (1) |
| μ = 1/3(C44 + C55 + C66) | (2) |
Subsequently, characteristic parameters of mechanical properties, such as bulk modulus (B), shear modulus (G), Young's modulus (E) and Poisson's ratio (ν), can be calculated as follows:
| E = λ(3λ + 2μ)/(3λ + 2μ) | (3) |
| K = λ + 2/3μ | (4) |
| G = μ | (5) |
| ν = λ/(3λ + 2μ) | (6) |
3.2 Related influence factors on mechanical properties
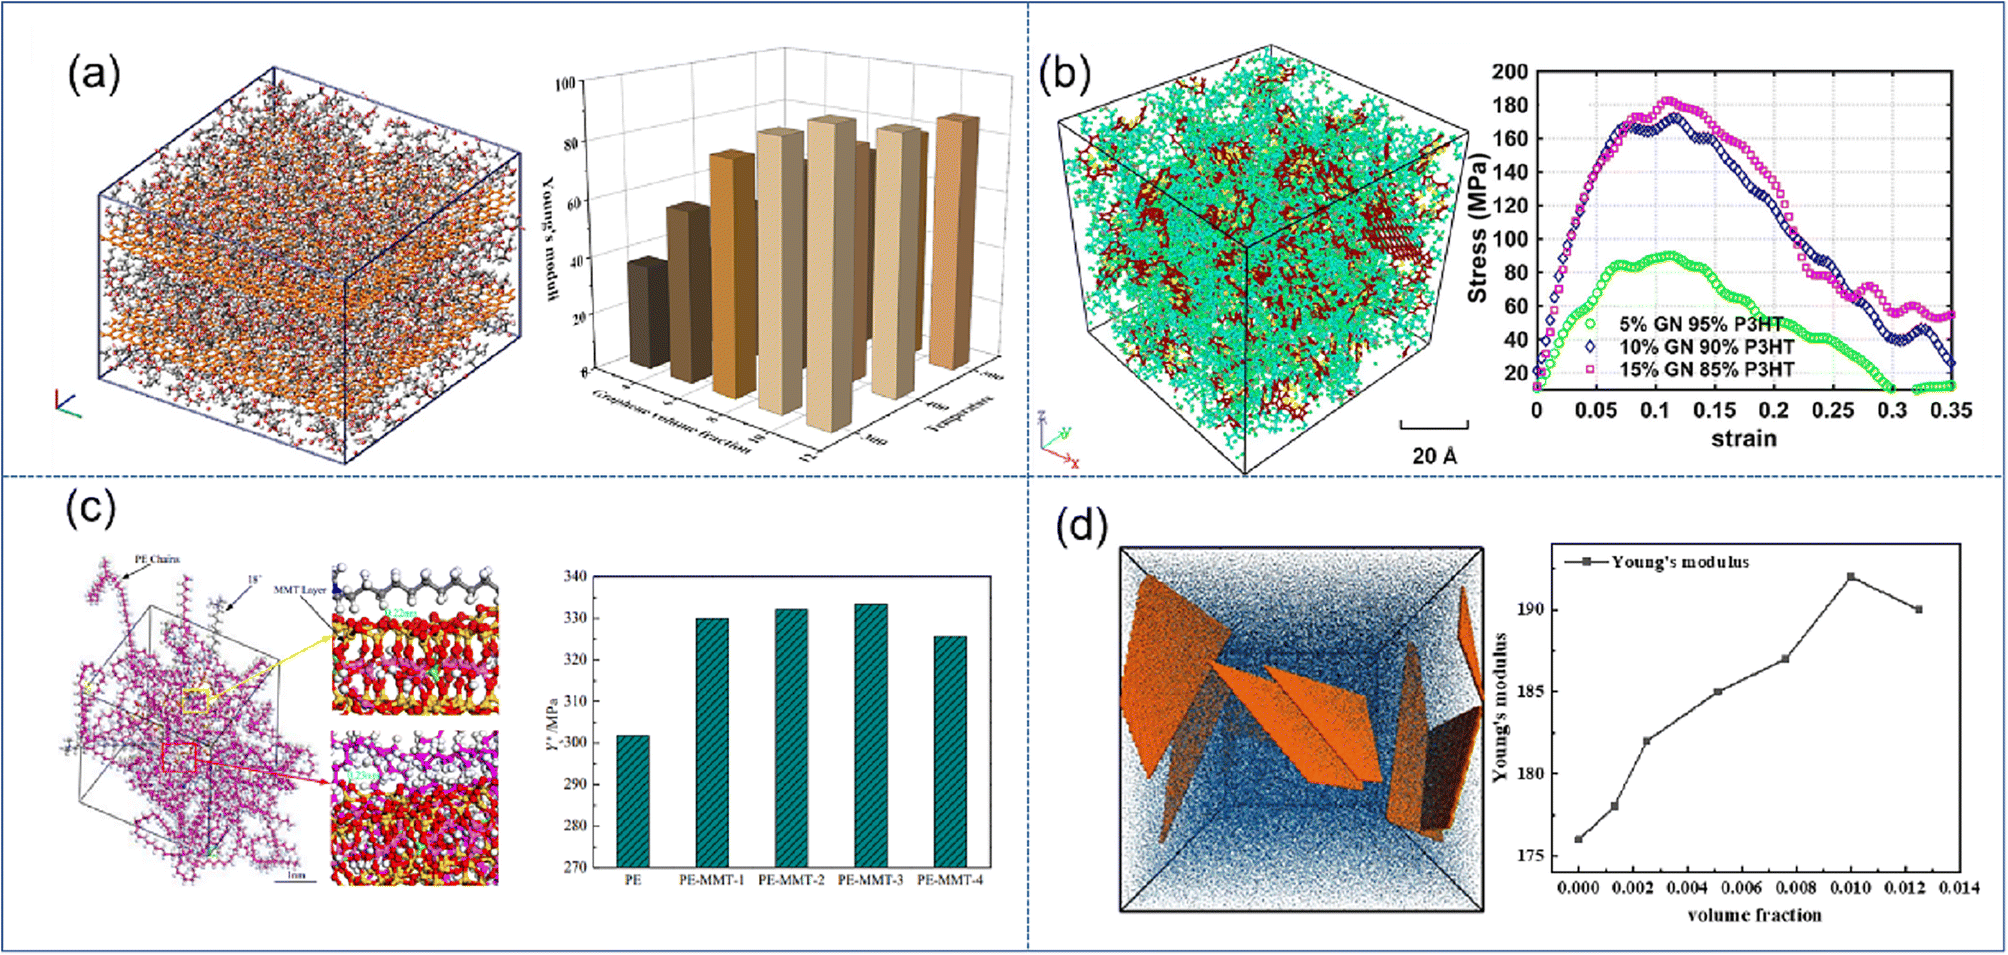 | ||
| Fig. 3 Snapshot of the stacking model of (a) graphene/PMMA (adopted from ref. 45 with permission), concentration model of (b) graphene/P3HT (adopted from ref. 46 with permission), (c) MMT/PE (adopted from ref. 48 with permission), and (d) coarse-grained MXene-epoxy, and mechanical properties vs. filling fraction of 2D nanosheets (adopted from ref. 51 with permission). | ||
The enhancement effect of MMT is significantly lower than that of graphene. Saha et al.48 indicated that Young's modulus is improved by 140% and 220% for 40% loading of MMT and GO.49 Wang et al. found that the mechanical properties can be improved rapidly with increasing O-MMT content (Fig. 3(c)), which can be attributed to the reduction of interfacial thickness and the strong hindering effect on the synergistic transition of PE chain segments. However, when the O-MMT content continues to increase to 4%, the interface between nanoparticles and alkane chains is liable to form physical defects, thereby decreasing the mechanical properties of the nanocomposites. Similar behavior was also found in BN/MXene reinforced nanocomposites; Chaurasia et al.50 predicted that 4% BN in polyethylene exhibits the maximum elastic modulus. Sliozberg51et al. found that the modulus linearly increases with the filler loading up to 1 vol% in MXene-epoxy nanocomposites (Fig. 3(d)). At higher filler contents, the increase of the modulus is reduced due to filler aggregation. Through literature analysis, graphene has the highest enhancement efficiency, but there still exist certain disadvantages in its application, such as easy agglomeration and difficult processing. While montmorillonite and MXenes are not as efficient as graphene, their stability and easy processing also make them occupy a wide range of applications.
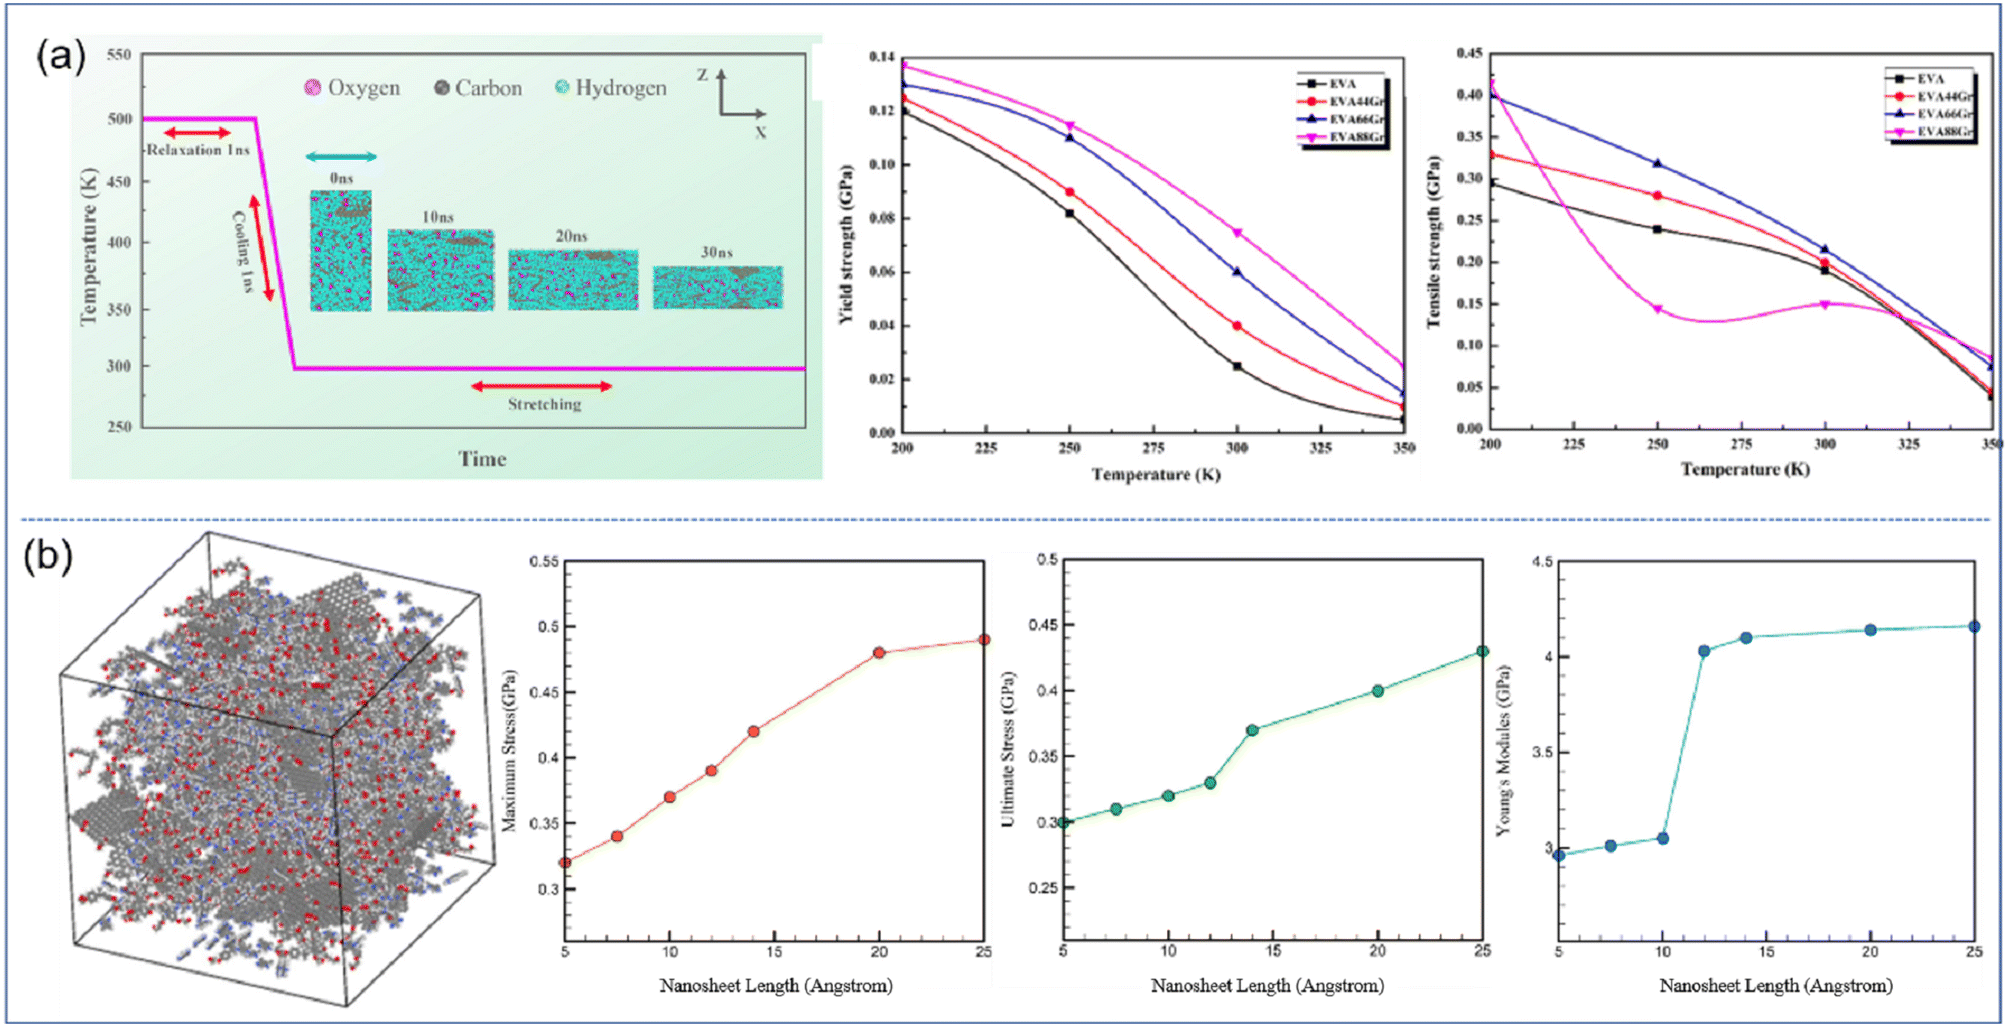 | ||
| Fig. 4 (a) Stretching process of EVA66Gr at 300 K with a strain rate of 108 s−1 and yield strength and tensile strength of graphene/EVA nanocomposites (adopted from ref. 52 with permission) and (b) snapshot of the epoxy–graphene oxide concentration model and maximum stress, ultimate stress and Young's modulus as a function of nanosheet length (adopted from ref. 53 with permission). | ||
Ankur Chaurasia and his coworkers26 employed a reactive force field to simulate the uniaxial tensile behavior of h-BN/polyethylene nanocomposites. First, four different morphologies including rectangular, circular, triangular and polygonal of h-BN nanosheets (Fig. 5(b)) were considered. Under the same filling fraction, the rectangular and circular nanosheets provide the maximum improvement in the fracture stress and toughness on the PNCs, while the triangular fillers have the weakest enhancement effect (Fig. 5(c)). This phenomenon can be related to the surface area of nanosheets and interfacial nonbonded interaction. Their results also showed that a maximum improvement of 32.64% is achieved with an aspect ratio of 4.5 of the h-BN nanosheet as compared to the 17.82% improvement with an aspect ratio of 1.25 for the same weight percentage of the h-BN nanosheet (Fig. 5(d)), although surface and interfacial areas are independent of the aspect ratio of graphene. The conclusion obtained by Ramin also elucidated that the high-aspect ratio graphene leads to higher in-plane Young's modulus of nanocomposites as a direct effect of higher density.54
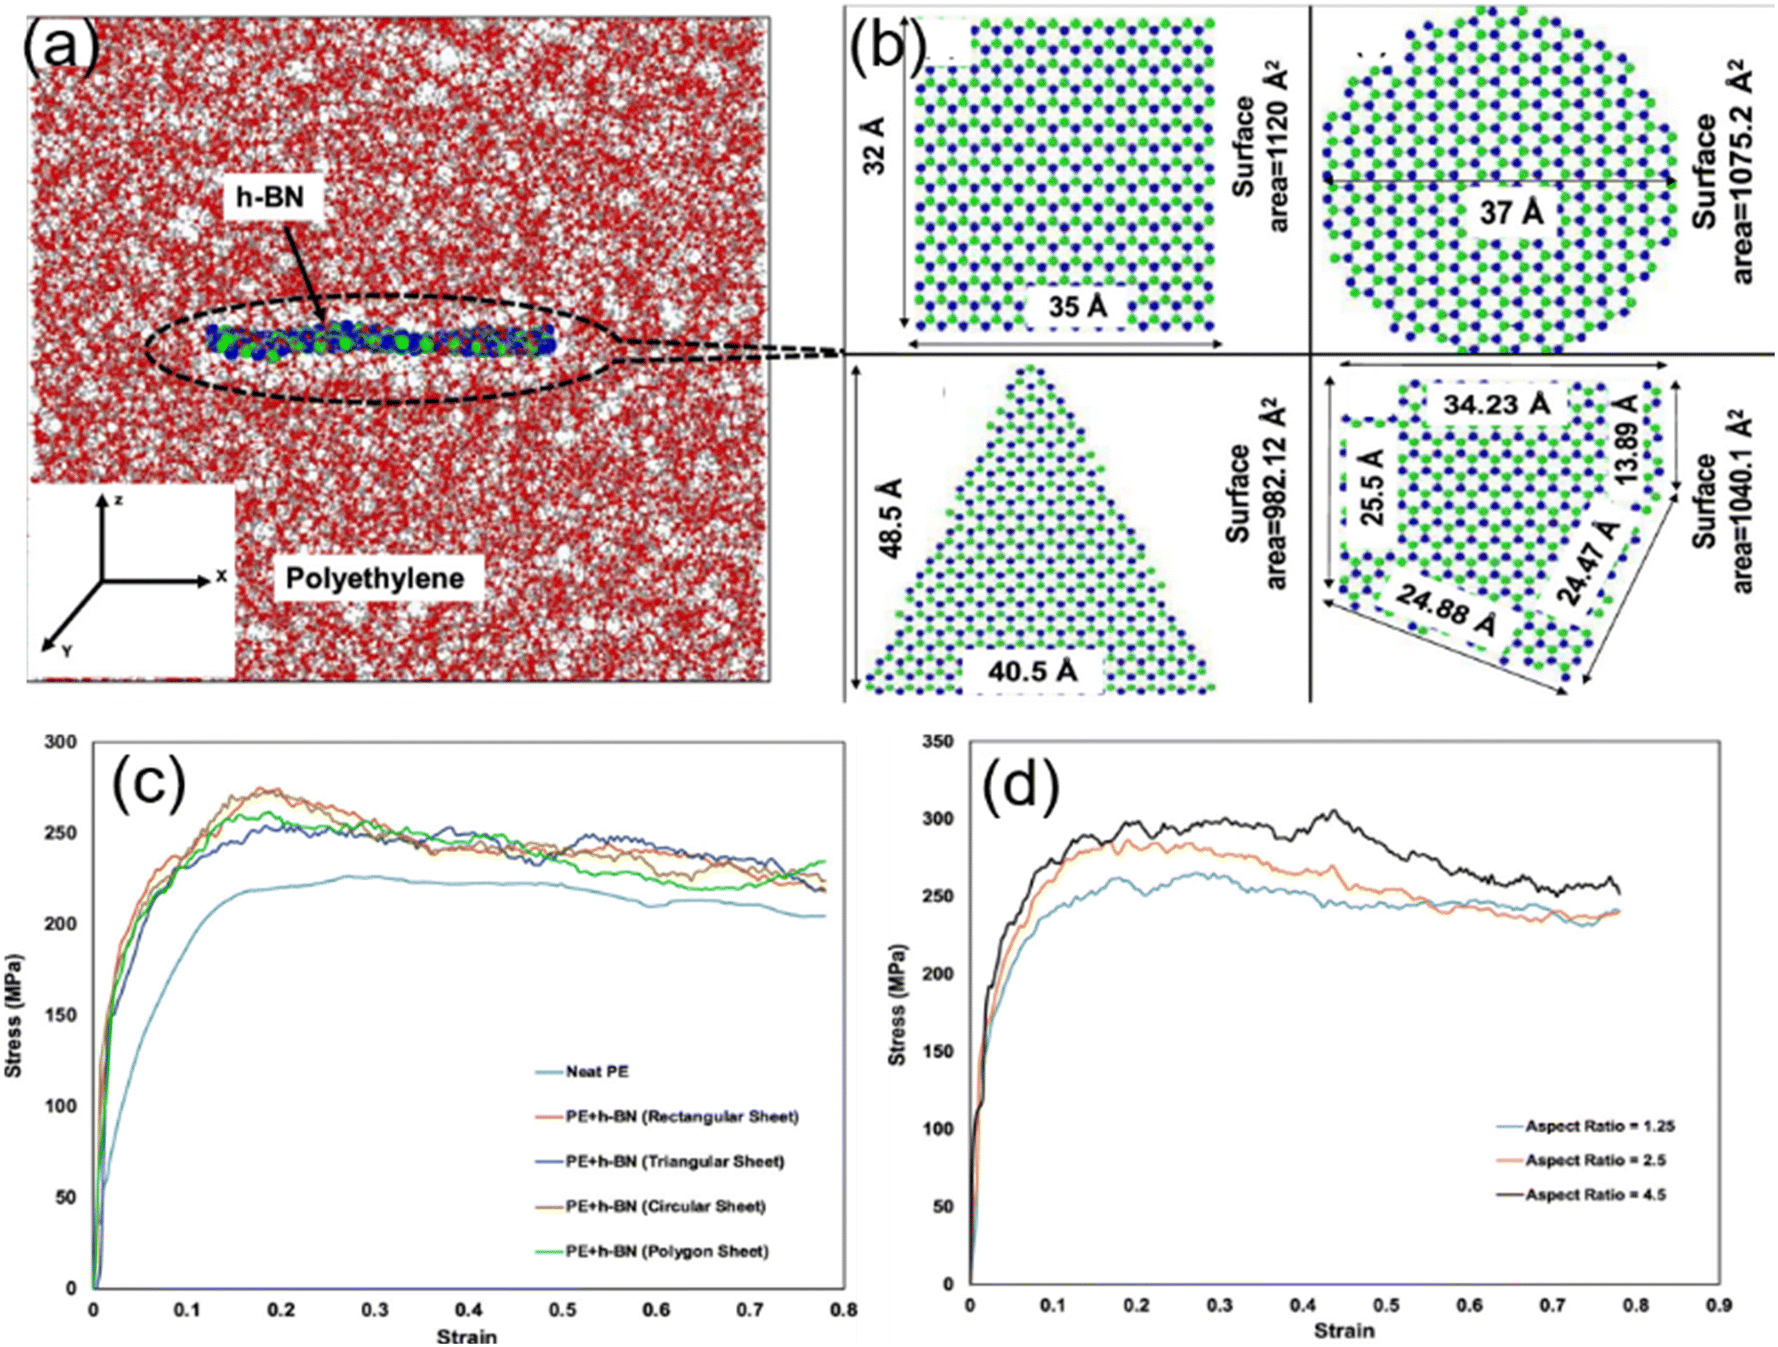 | ||
| Fig. 5 Atomistic model of (a) the h-BN/PE nanocomposite, and (b) rectangular h-BN, circular h-BN, triangular h-BN, and polygonal h-BN nanosheets. Stress–strain response of the effect of (c) geometry morphology and (d) aspect ratio of h-BN (adopted from ref. 26 with permission). | ||
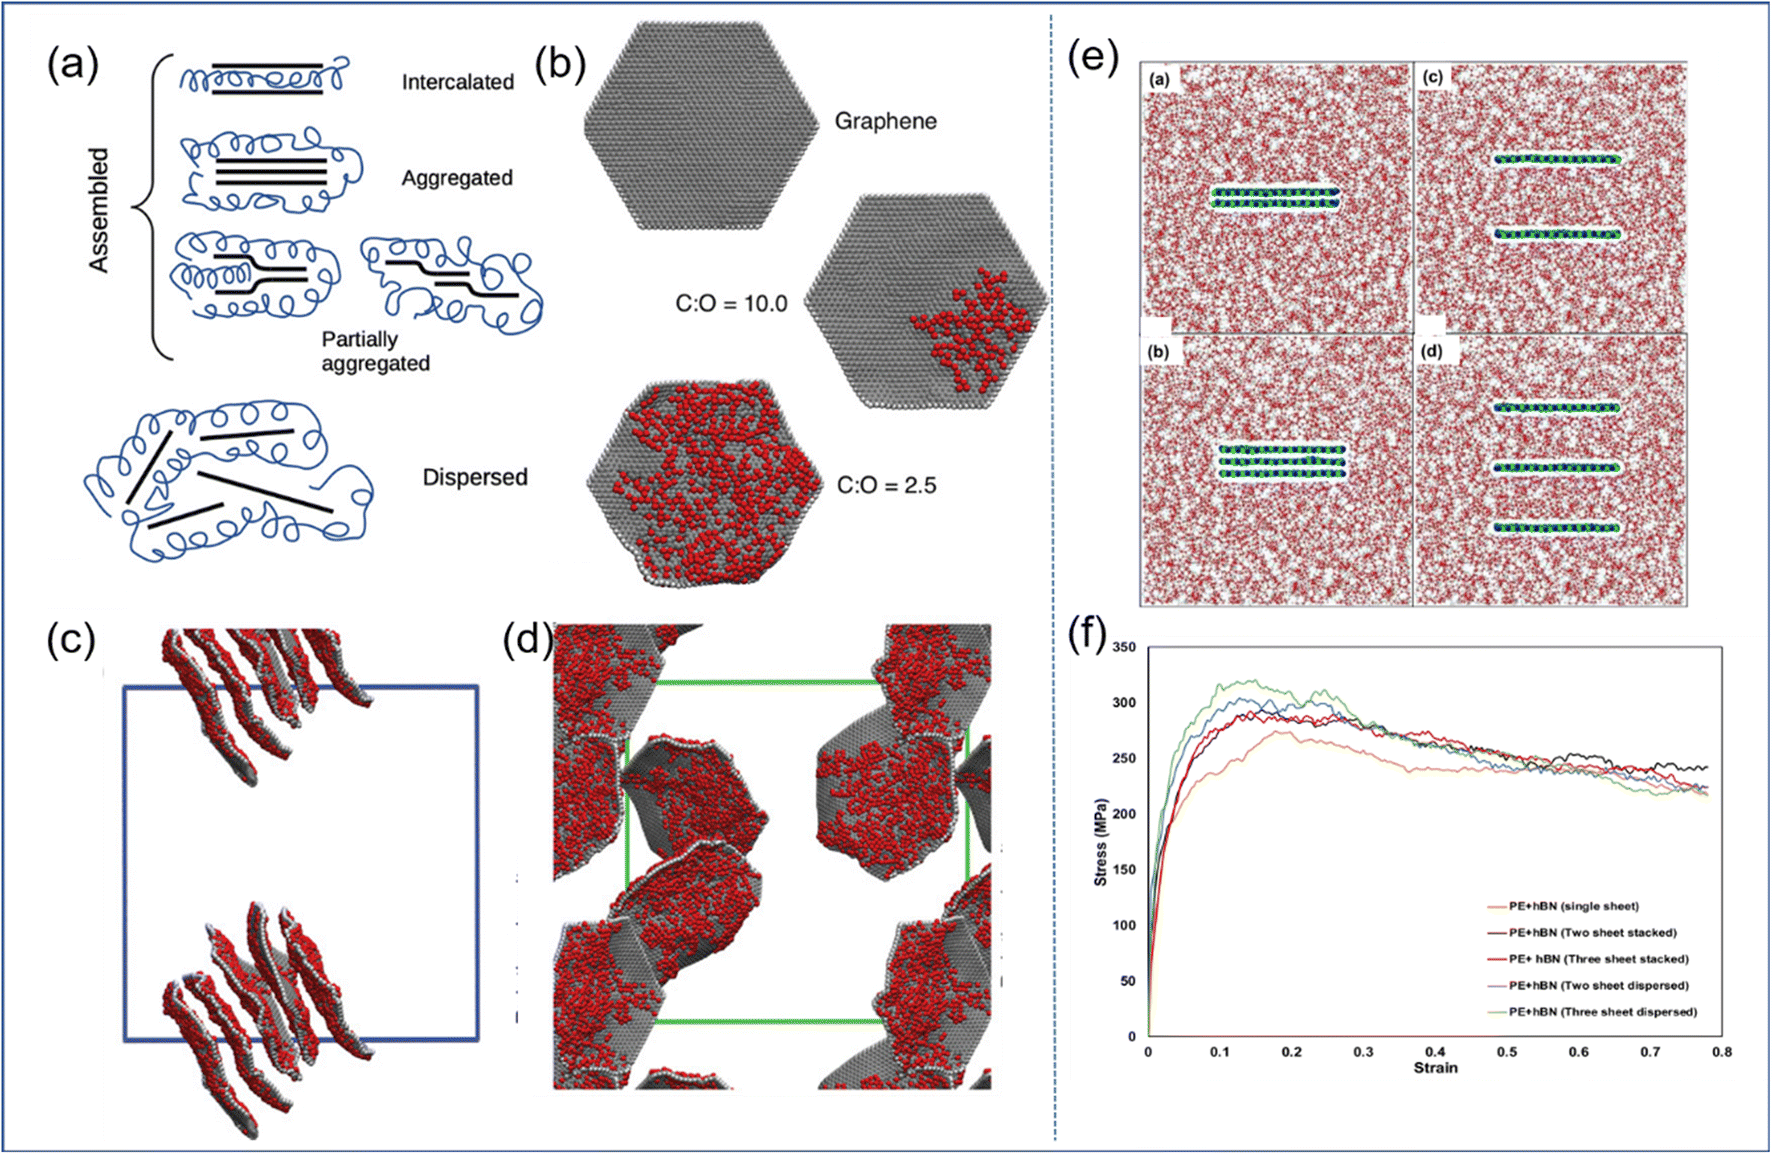 | ||
| Fig. 6 (a) Schematic diagram of GO self-assembly, and (b) examples of CG graphene sheets oxidized to different extents. Snapshot of (c) the GO-PVA system and (d) GO-PEG systems. (e) Snapshot of the BN-PE stack model, consisting of two/three stacked BN nanosheets, and two/three randomly dispersed BN nanosheets, and (f) stress–strain response of these four models (adopted from ref. 26 and 57 with permission). | ||
In general, the well-dispersed 2D sheets can improve the mechanical properties of PNCs effectively; besides, the functionalization of the filler surface is one of the important means to achieve good dispersion.
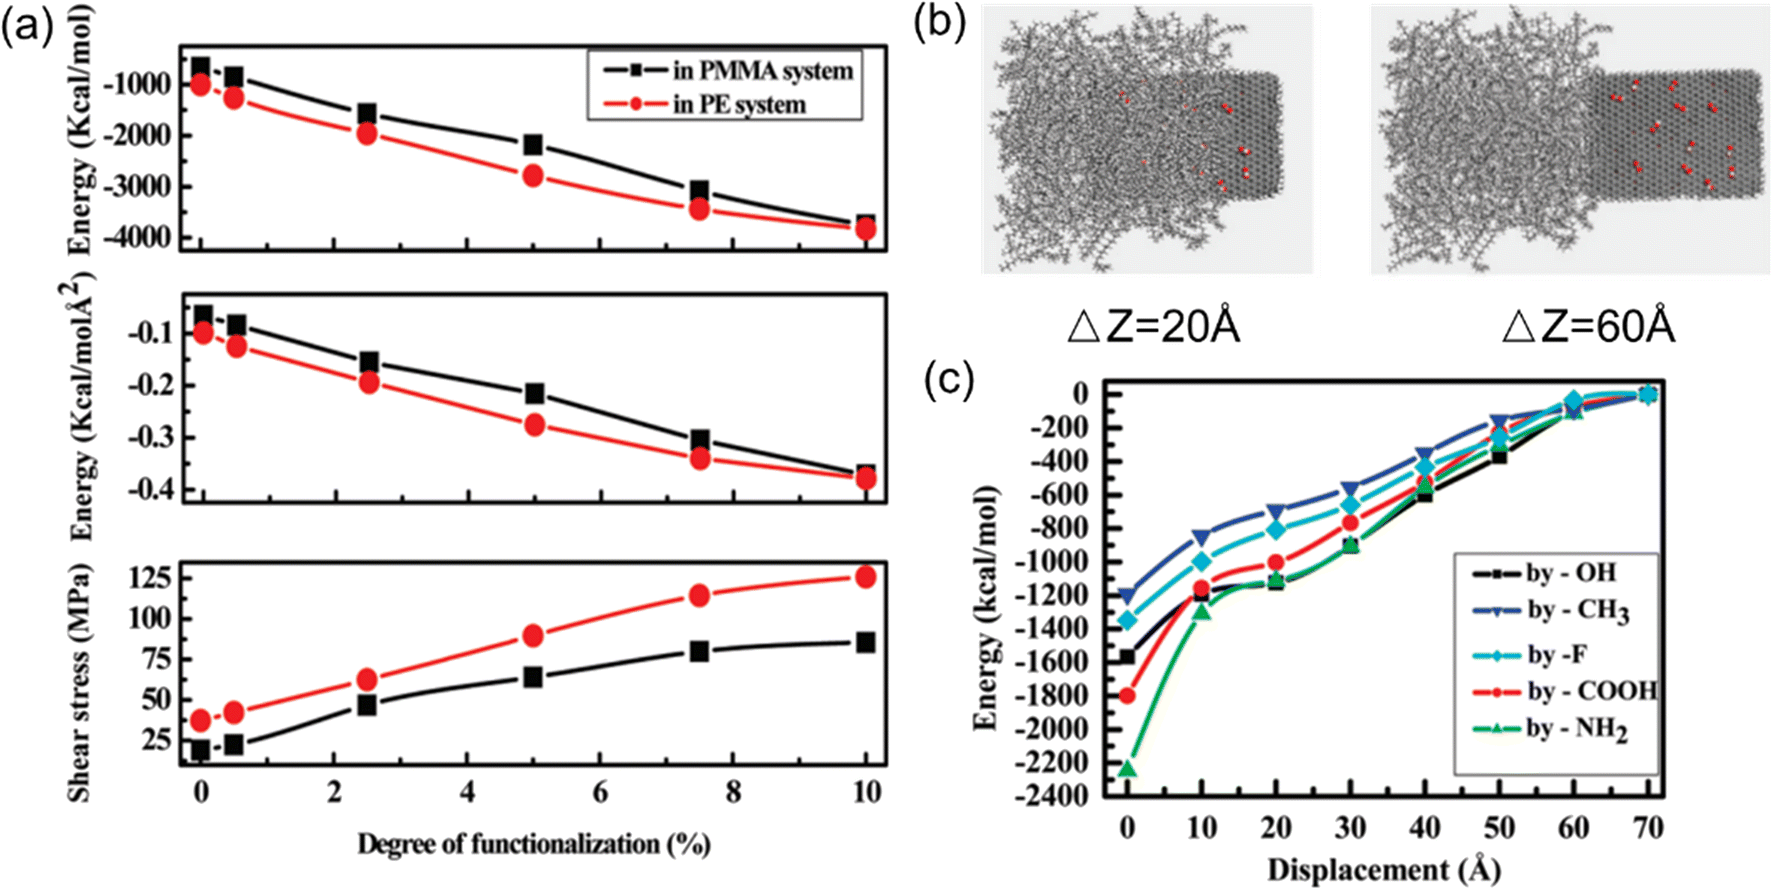 | ||
| Fig. 7 (a) Shear stress, pull-out energy and interaction energy versus the degree of functionalization, (b) snapshot of the process of graphene pulling from the polymer matrix, and (c) interaction energy as a function of pull-out distance at different functional groups (adopted from ref. 58 with permission). | ||
Park et al.59 also investigated the effect of surface functionalization (–COOH and –OH) on the interfacial properties between graphene and the epoxy matrix. Their simulation results demonstrated that the pullout force of –COOH-graphene and –OH-graphene embedded epoxy systems is 54% and 5% higher than that of a pristine graphene/epoxy system. However, the interfacial shear modulus decreased by 85% and 56%, respectively, which can be related to the lesser stiffness in the interfacial region.
Contrary to the above grafting functional groups can promote the interaction force at the interface; Dewapriya et al.60 observed that the hydrogen functionalization deteriorates the interfacial strength of graphene PNCs. A similar trend was also observed in MXene-epoxy nanocomposites. Binding51 between Ti3C2Tx and epoxy becomes stronger with less hydrogen coverage of the Ti3C2Tx surface due to an increase in favorable electrostatic interactions.
The effect of functionalization on the mechanical properties is complex, because it not only depends on the interfacial load transfer, but also is closely related to the breakup of the sp2 hybridization and degradation of the inherent physical properties of graphene. Yang et al.61 constructed pristine and methyl-group-functionalized graphene/PP composite models (Fig. 8). The degradation of graphene by the methyl groups results in the degradation of longitudinal Young's modulus and in-plane shear modulus of the nanocomposites. Besides, the longitudinal shear moduli of the nanocomposites, which depend on the interfacial shear load transfer, are considerably improved upon methyl functionalization. It was also discovered that pristine graphene shows stronger adhesion characteristics to the PP matrix than methyl functionalized graphene. Such an unexpected improvement is attributed to the increased surface roughness of graphene and improvement in the dispersibility of graphene.
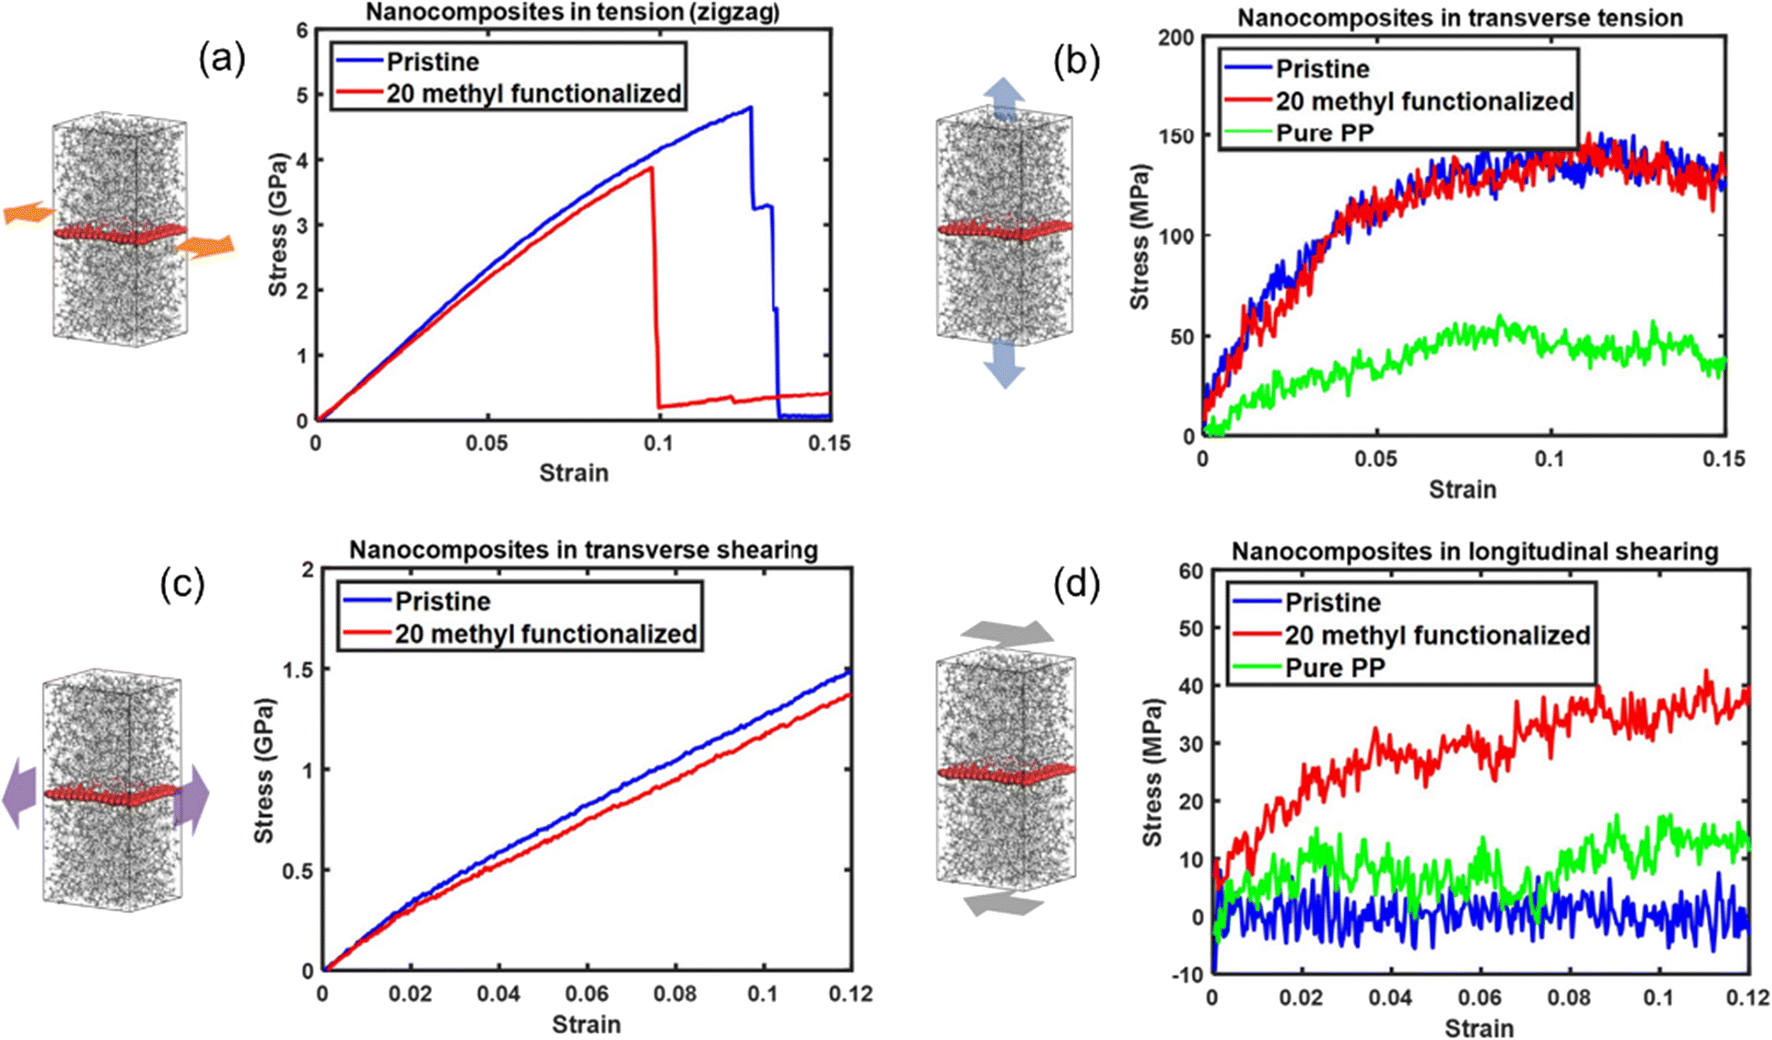 | ||
| Fig. 8 Tensile stress–strain curves of nanocomposites along (a) the zigzag direction and (b) transverse direction, and shear stress–strain curves of nanocomposites (c) transverse shear and (d) longitudinal shear of pristine/20methyl functionalized graphene PE nanocomposites (adopted from ref. 61 with permission). | ||
Cui et al.21 studied the mechanical properties of hydroxyl group (–OH), carboxyl (–COOH), and ester (–COOCH3) functionalized graphene-reinforced nitrile rubber composites. The results of the AA simulations indicated that stronger interfacial interactions and better stability and dispersion of graphene in rubber matrices can be obtained by introducing functionalized graphene, resulting in a higher Young's modulus, bulk modulus, and shear modulus. The enhancement effect of functionalization was ranked as follows: –COOH > –OH > –COOCH3.
Zhang et al.62 revealed that a higher density of oxygen-containing groups leads to a decrease of elastic modulus of individual GO sheets. However, the groups also lead to the increased hydrogen bonds between the GO sheets and polymer molecules, resulting in the corresponding increase in overall stiffness. Sun et al. also found that the ultimate stress and elastic modulus decrease greatly as the density of function groups absorbed on GO increases from 10% to 50%, but are independent of the group type of hydroxide or epoxide ones.63
Besides, the mechanical properties of functionalized graphene greatly rely on the location, distribution and coverage of functional groups.64,65 Pei and his coworkers found that radicals arranged of –CH3 in lines perpendicular to the tensile direction exhibit a much stronger influence on the mechanical properties, and the elastic modulus of graphene decreases gradually with increasing –CH3 coverage, while both the strength and fracture strain show a sharp drop at low coverage.
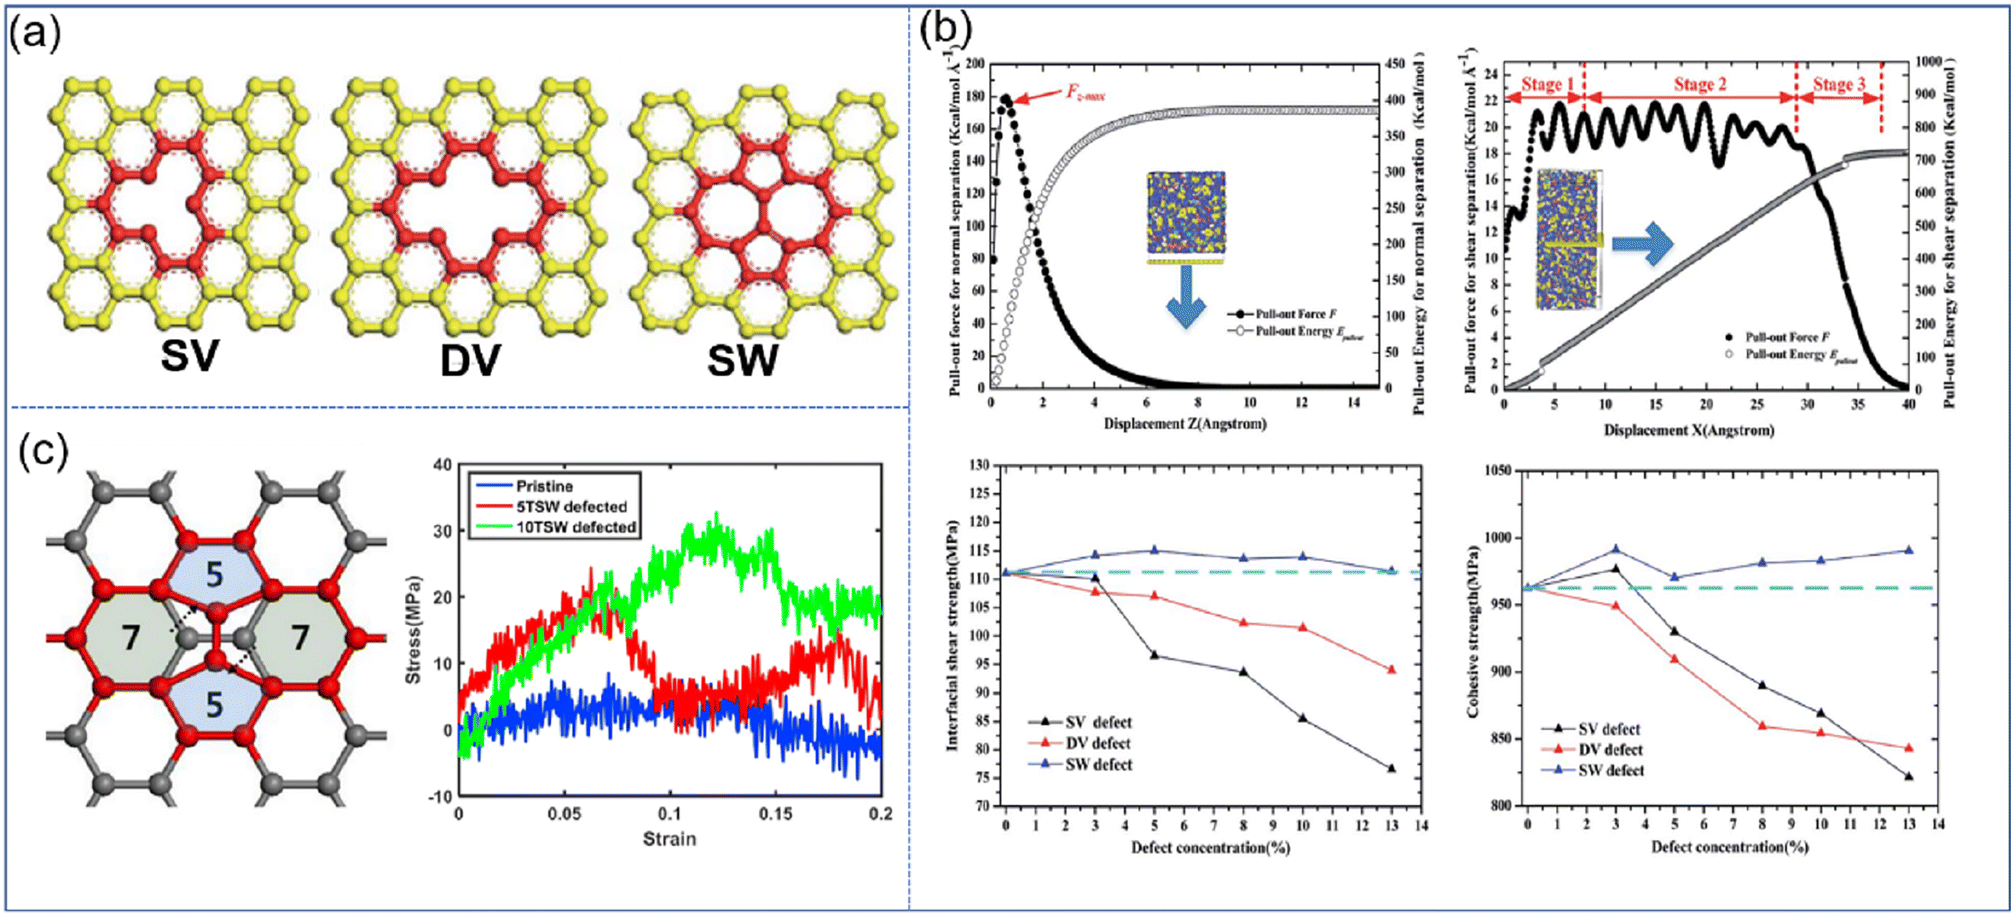 | ||
| Fig. 9 (a) Schematic diagram of SV, DV, and SW defects, (b) variation of the pull-out force F and pull-out energy for the graphene–epoxy nanocomposite in normal separation mode, shear separation mode, in cohesive strength and interfacial shear strength, and (c) atomic configuration of graphene with STW defects, and stress–strain curves of nanocomposites under longitudinal shear according to the number of STW defects (adopted from ref. 66 and 67 with permission). | ||
Besides, Moon et al. also revealed the effect of Stone–Thrower–Wales (STW) defects on the interfacial strengthening mechanism in graphene-PP nanocomposites.67 The formation of STW defects in graphene can be caused by a 90 rotation of two neighboring carbon–carbon bonds (Fig. 9(c)). The overall stress–strain characteristics of PNCs involving the deformation of graphene are degraded owing to the degradation of graphene itself. While in the longitudinal shearing, the STW defect can critically improve the shear load bearing capability, which is attributed to the increasing interfacial shearing. The increased interfacial shear load transfer results from the rippling of graphene at the STW defective sites, and the resultant surface roughness of graphene.
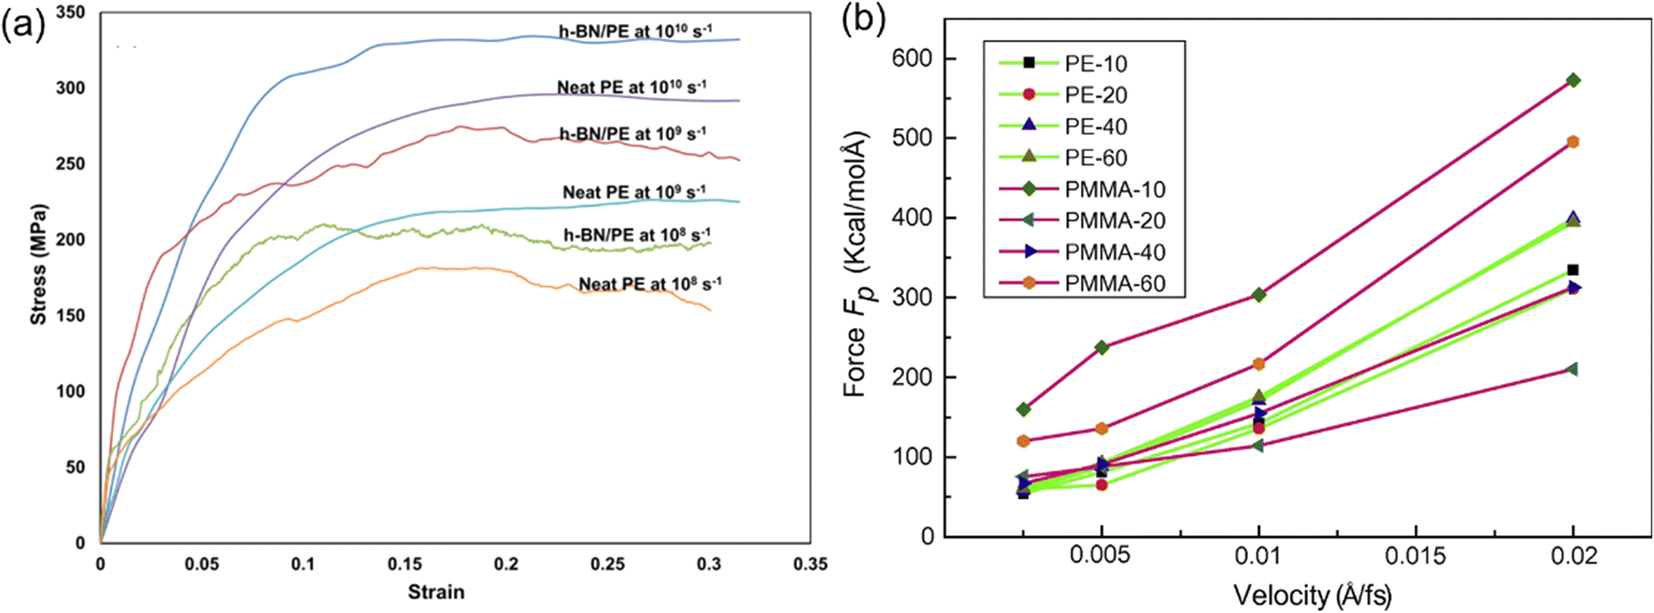
Apart from the role played by the intrinsic structures of 2D nanosheets, the mechanical properties of PNCs also exhibit a strong dependence on the strain rate in MD simulation. It was found that increasing strain rates leads to an increase (Fig. 10(a)) in the elastic modulus.68 Liu et al.43 also investigated the influence of pull-out velocity on the pull-out force in the graphene/PMMA interfacial model. And they indicated that the faster the pull-out velocity is, the larger the pull-out force required. However, when the pull-out velocity is lower than 0.005 Å/fs, the pull-out force (Fig. 10(b)) is insensitive to the pull-out velocity in almost all systems.
3.3 Fracture mechanism
Furthermore, failure analysis and fracture mechanism are also important topics in mechanical property investigation. The location of crack generation and the direction of extension are distinct for different filler-filled systems. Meanwhile, whether a crack takes place in the matrix or the interface part will depend much on the ratio of the maximum interface strength to matrix strength.43 The fracture of the composite is complicated; non-bonded interaction is one of the key criteria for the initial crack appearing. Inevitably, the 2D sheets act as a barrier in front of the crack growth from the matrix since the filler topology is much bigger than the crack tip, and their bond and atom topology are stable. Zhang et al.46 discovered that cracks extend further from the edge to the middle until the cubic model is completely damaged in graphene PNCs (Fig. 11). Li et al. constructed two multilayer graphene configurations (graphene layers parallel and perpendicular to the polymer/graphene interface) in epoxy composites, and their results showed that the strengths of composites are similar in both cases, but the damage mechanisms are different: the parallel case exhibits cohesive yield with strain localization and nano-void formation within the bulk polymer, while the case with graphene sheets orienting normal to the interface exhibits interfacial debonding. | ||
| Fig. 11 Fracture schematic of graphene/P3HT nanocomposites (adopted from ref. 43 with permission). | ||
4 Viscoelasticity of 2D nanosheet filled PNCs
4.1 Computational simulation technologies of viscoelasticity
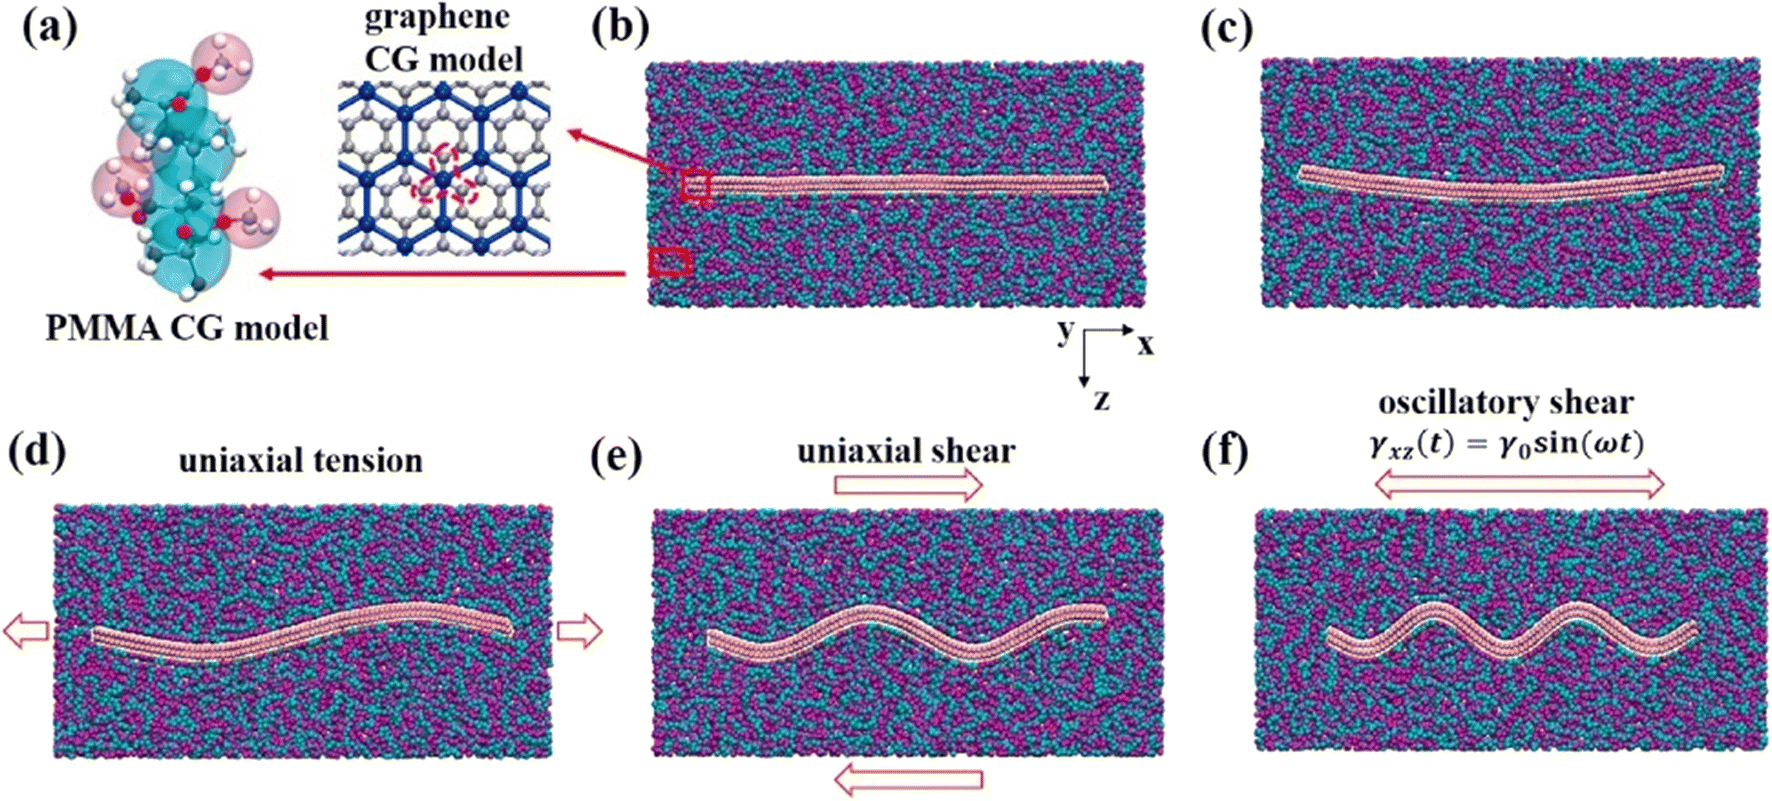
Viscoelasticity of nanocomposites dictates their performance in many dynamic mechanical applications, such as automotive tires, damping, structural coatings, and impact-mitigation applications. The study of the viscoelasticity of PNCs is of great benefit for practical applications. The viscoelasticity properties of PNCs in MD simulation are studied by applying a cyclic shear deformation and recording the resulting shear stress. Regarding the SLLOD method69 for shearing mode, Lees–Edward “sliding brick” boundary conditions are used. Assuming that the shear occurs in the xy direction, the xy plane of the simulation box is shifted along the x direction so that each point in the simulation box can be regarded as having a “streaming” velocity. This position-dependent streaming velocity must be subtracted from each atom's actual velocity to yield a thermal velocity which will be used to calculate the temperature and further thermostating.The shear strain is defined as 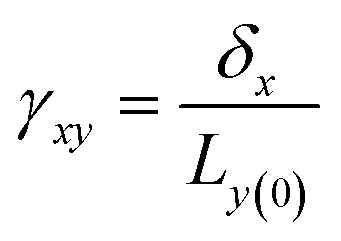 , where δx is the transverse displacement along the x-axis, and Ly(0) is the box length along the y-axis. In this oscillatory shear deformation, the shear strain is expressed by a sinusoidal function:
γxy = γ0![[thin space (1/6-em)]](https://www.rsc.org/images/entities/char_2009.gif) sin(2πωt) sin(2πωt) | (7) |
Correspondingly, stress can also be described in this form:
| σxy = σ0sin(2πωt + δ) = δ′sin(2πωt) + δ′′cos(2πωt) | (8) |
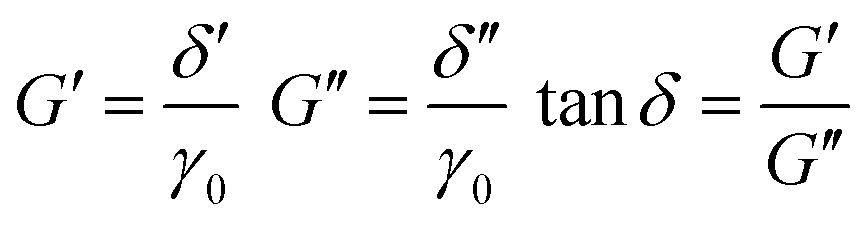 | (9) |
4.2 Related influence factors on mechanical properties
Hong et al.70 examined the effects of nanosheet (NS) loadings on viscoelasticity. A coarse-grained model of NS-based PNCs was first constructed. The potentials in the present MD simulations include the bonding potential and the nonbonding potential, which are given by the finitely extensible nonlinear elastic potential and modified LJ 12–6 potential respectively. Their simulation results showed that the storage modulus and loss modulus exhibit an increase with the NS loading (Fig. 12). The enhancement of dynamic moduli can be divided into three regimes, which are related to the Rouse dynamics, chain confinement, and percolation network. First, they examined the dependence of the storage modulus G′ and loss modulus G′′ on the strain under shear frequencies of ω = 0.01 τ−1 for samples with various volume fractions of NSs. The strain independence at small amplitudes and strain dependence at large amplitudes were observed. The result also manifested that the Payne effect exhibited in PNCs increases with the increase of NS loadings, which derives from the increase of energy dissipation and structural breaking. Then, they investigated the storage modulus versus shear frequency ω in the linear viscoelastic regime and found that G' exhibits an increase while the power-law exponent decreases with the increase of NS loadings, which is ascribed to the lack of complete relaxation of polymer chains in the presence of NSs.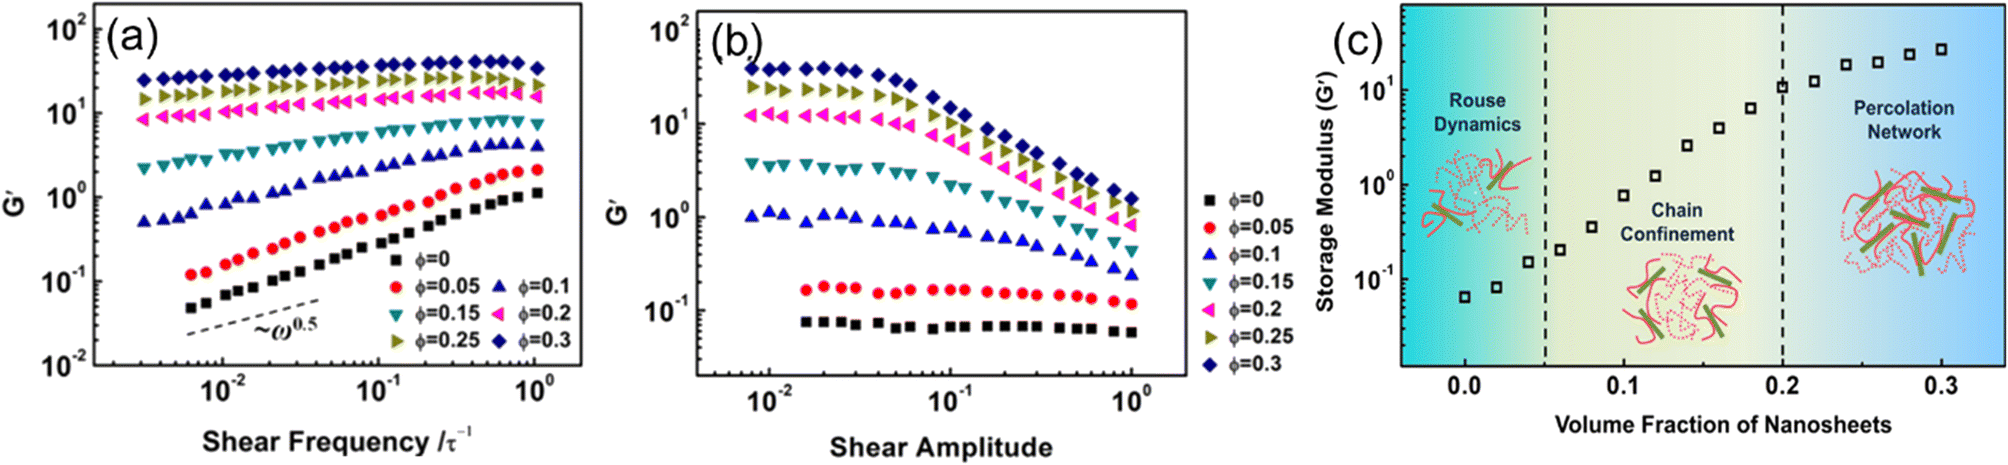 | ||
| Fig. 12 (a) Storage modulus vs. shear frequency, (b) storage modulus vs. shear amplitude under different 2D sheet filling fractions, and (c) storage modulus varies with the volume fraction of nanosheets (adopted from ref. 70 with permission). | ||
Furthermore, they also probed the effect of NS-polymer interactions on the viscoelasticity of NS-based PNCs, including strongly attractive, weakly attractive, and repulsive interactions (Fig. 13). Their observations manifested that attractive NS-polymer interaction can enhance the G′ and G′′ of nanocomposites, and the viscoelasticity is not influenced dramatically in repulsive systems because of the poor dispersion of NSs. Yang et al.71 employed MD simulations to construct a graphene-reinforced polycarbonate coarse-grained model and implemented oscillatory shear NEMD simulations to investigate the viscoelasticity of nanocomposites. The results indicated that increasing the interfacial interaction leads to an increase in both storage and loss moduli, which can be related to the excellent dispersion of graphene into the matrix and slow down the motion of polymer chains. Surface functionalization can improve both the interaction force between the matrix and filler and the dispersibility of the filler, which is very beneficial to enhance the viscoelasticity of the nanocomposites.
 | ||
| Fig. 13 (a) Equilibrium structures of NS-based PNCs with (a) repulsive, (b) weakly attractive, and (c) strongly attractive NS-polymer interactions. Frequency sweeps of (d) G′ and (e) G′′ in the pure polymers and NS-based PNCs at ϕ = 0.05 (adopted from ref. 70 with permission). | ||
In addition, Li and his coauthors72 carried out oscillatory shear simulations to study the effect of the heterogeneous GO patches (Fig. 14) with different sizes on the viscoelastic properties of the nanocomposite. When heterogeneous patches strongly attract polymers, larger patches result in higher adhesion energy and better dispersion. However, for weak oxidized region-polymer interaction, increasing the patch size contributes to higher G′ and lower tanδ, while having a lesser effect on the G′′ of the PNCs. Besides, they indicated that enhancing the dispersion of GO sheets to achieve a more complete exfoliation towards monolayer GO would generate the improved viscoelastic properties of PNCs more effectively compared with multilayer GO.
 | ||
| Fig. 14 Oscillatory shear simulation of heterogeneous GO patches with different sizes on the viscoelastic properties of the PB nanocomposite (adopted from ref. 72 with permission). | ||
Wang and his coworkers73 specifically focused on the effect of the waviness of wrinkled multilayer graphene sheets (MLGSs) (Fig. 15) and the number of layers on graphene-PMMA nanocomposites. They demonstrated that MLGS with a specific winkle shows a larger tanδ and a rising level of energy dissipation, which can be more readily activated.
 | ||
| Fig. 15 Snapshot of the wrinkled multilayer graphene sheet-PMMA nanocomposite, (a) CG model of PMMA and graphene, (b)–(f) wrinkled multilayer graphene sheets with different waviness. | ||
Guo et al. constructed two novel graphene structure (intercalated and stacked GP structures) reinforced cis-1,4-polybutadiene (cis-PB) models to investigate the effect of different GP packing patterns on the viscoelastic behaviors. They found that the intercalated systems have a higher storage modulus and concluded that the restriction and orientation of polymer chains become more crucial factors than the GP–GP interaction in viscoelasticity.
5 Thermal/electrical conductivity of 2D nanosheet filled PNCs
5.1 Computational simulation technologies of thermal conductivity
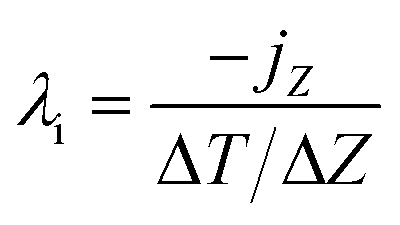
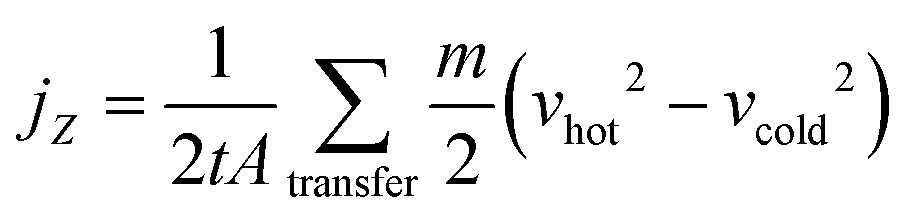
The thermal conductivity k of polymers is quite low; that is, k of bulk polymer74,75 is ∼0.5 W m−1 K, while k of aluminum is 200 W m−1 K, which limits their applications in thermal management systems. However, polymers can offer many potential advantages such as low cost, low weight, corrosion resistance and ease of processability, which makes them attractive for heat transfer applications. The enhancement in thermal conductivity of polymers can be achieved by the addition of graphene and BN nanoplatelets.The generation of heat conduction in solids can be caused by the movement of free electrons and phonon diffusion;76,77 phonons can be regarded as the smallest unit of quantization of periodic lattice vibration. Polymers can be treated as “crystals” composed of very fine grains with only a few lattice spacings, and the directional motion of phonons inside can generate heat flow. The nonequilibrium molecular dynamics (NEMD) method, which is close to the experimental method, is widely adopted to calculate the thermal conductivity by generating a stable temperature gradient under a fixed thermal flux. Temperature gradient can be measured using the local heat bath method; after setting the temperature of the hot and cold zones directly, the system can then exchange energy with the hot zone to form a steady heat flow. Another method is the momentum exchange method (reverse nonequilibrium molecular dynamics, RNEMD) proposed by Müller-Plathe,78 in which the momentum of the coldest atom in the hot region and the momentum of the hottest atom in the cold region is exchanged; after the system reaches a steady state, the temperature of each layer of the system is measured and the temperature gradient can be obtained. Finally, the thermal conductivity can be achieved by Fourier's law.
In the RNEMD method, the interfacial thermal conductivity λi is obtained by the following equation:
 | (10) |
 | (11) |
| k = jZ/(∂T/∂Z) | (12) |
5.2 Related influence factors on thermal properties
Yang et al.79 investigated the out-of-plane thermal conductivity and interface thermal resistance (ITR) of BN/graphene filled epoxy composite MD models (Fig. 16). The results manifested that the out-of-plane thermal conductivity of the BN/epoxy is higher than that of graphene/epoxy at the same volume fraction of the fillers. Simultaneously, the obtained ITR between epoxy and graphene is (4.48–8.43) × 10−9 m2 K W−1, which is larger than that of BN/epoxy (2.42–3.62) × 10−9 m2 K W−1. Besides, the ITRs exponentially decay with the number of layers of BN/graphene. Finally, the vibrational density of states (VDOS) was calculated using the Fourier transform of the velocity autocorrelation function to better understand the mechanism of thermal transport. And better interfacial transport and lower ITR can be explained using the overlap between graphene/BN and epoxy.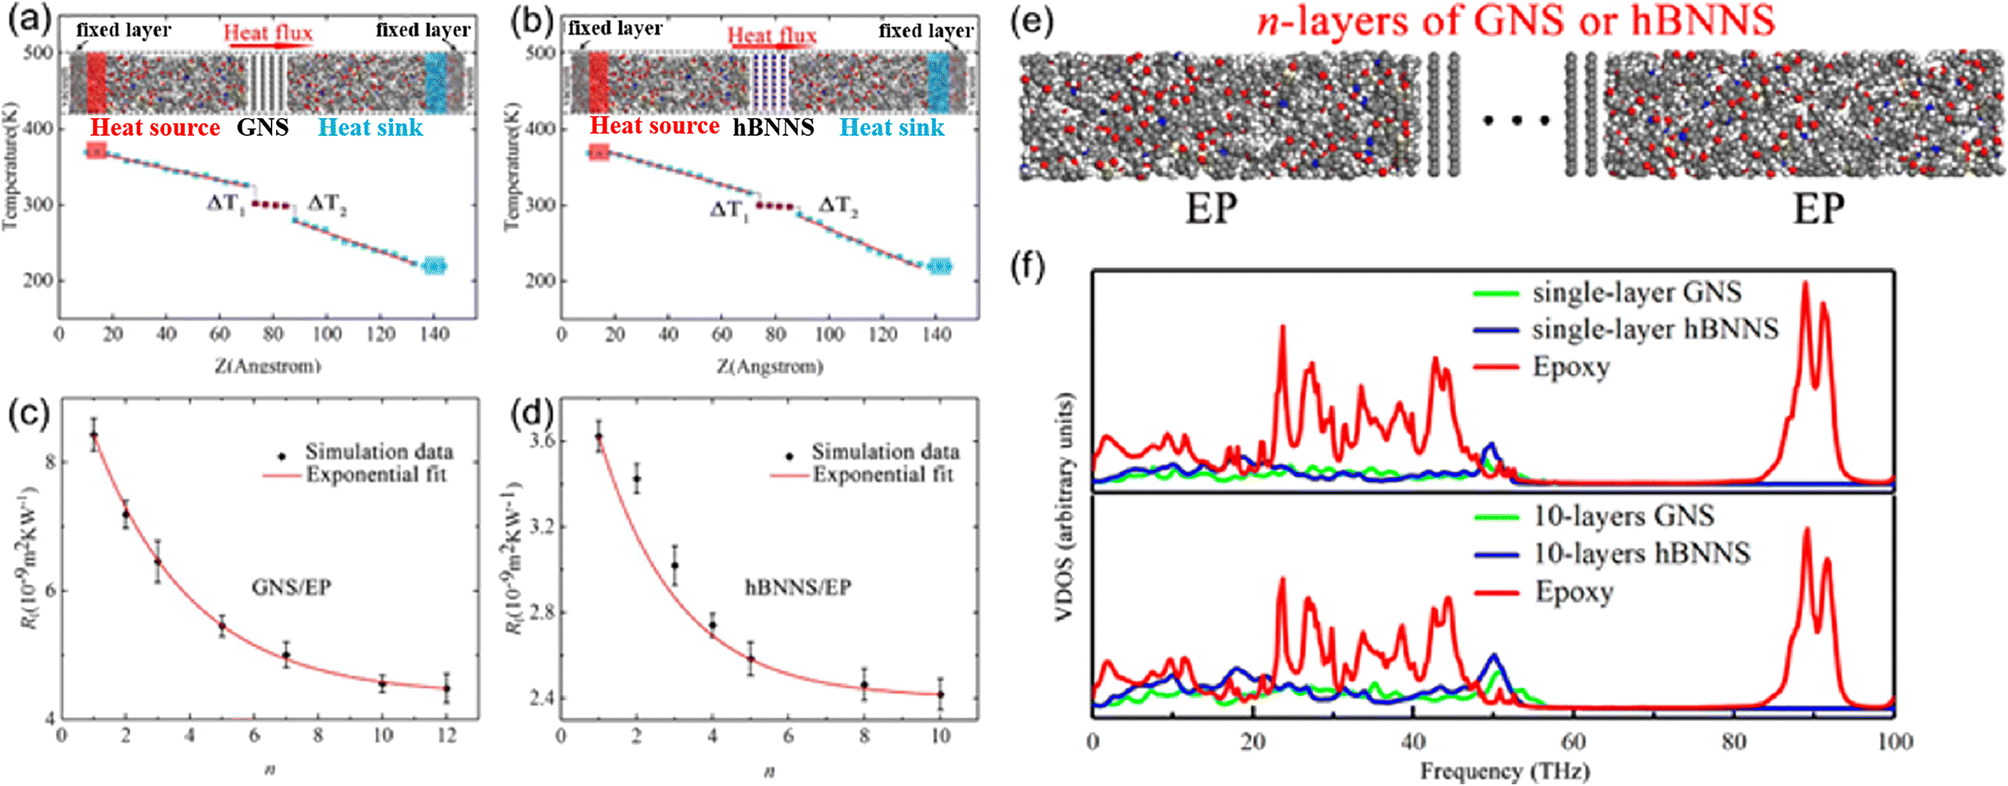 | ||
| Fig. 16 (a) and (b) Temperature gradient along the Z direction and snapshot of BN/graphene filled epoxy composites, (c) and (d) ITR between graphene/hBNNS and epoxy as a function of n, (e) structure of n-layers of GNS or hBNNS, and (f) vibrational density of states vs. frequency (adopted from ref. 79 with permission). | ||
Besides, the effect80 of BN/graphene volume fractions and aspect ratio on the thermal conductivity of epoxy composites was investigated by RNEMD simulation. Increasing volume fraction of graphene from 1% to 3%, the normalized thermal conductivity increases by approximately 23% for graphene–polyethylene PNCs. In addition, Wang et al.81 discovered that the thermal conductivity of the PI/BN system with filling mass fractions of 1.25%, 2.5%, 5%, 7.5% and 10% increases by 29.3%, 18.1%, 33.8%, 93.6% and 103.4%, respectively, compared with that of the PI neat system. It was generally assumed that the thermal conductivity of PNCs increases slowly with the filler fraction initially, followed by a sharp transition point as the percolation network is formed when the filling loading is large enough. A percolation phenomenon was observed in Li′s work82 (Fig. 17), 12 vol% < Vf ≤ 17 vol%, which is attributed to the formation of an h-BN overlapping network and the heat conduction path. The results obtained by Zhang revealed83 that PCM (Fig. 18) with 0.7 wt% graphene has the highest values among all nanocomposites. The following introduction of graphene to paraffin/EVA would restrict the heat transfer process when graphene contents achieve 7.0 wt%. These phenomena result from the impact complex interaction of EVA and graphene components because the increased graphene might affect the vibration of molecules in PCMs.
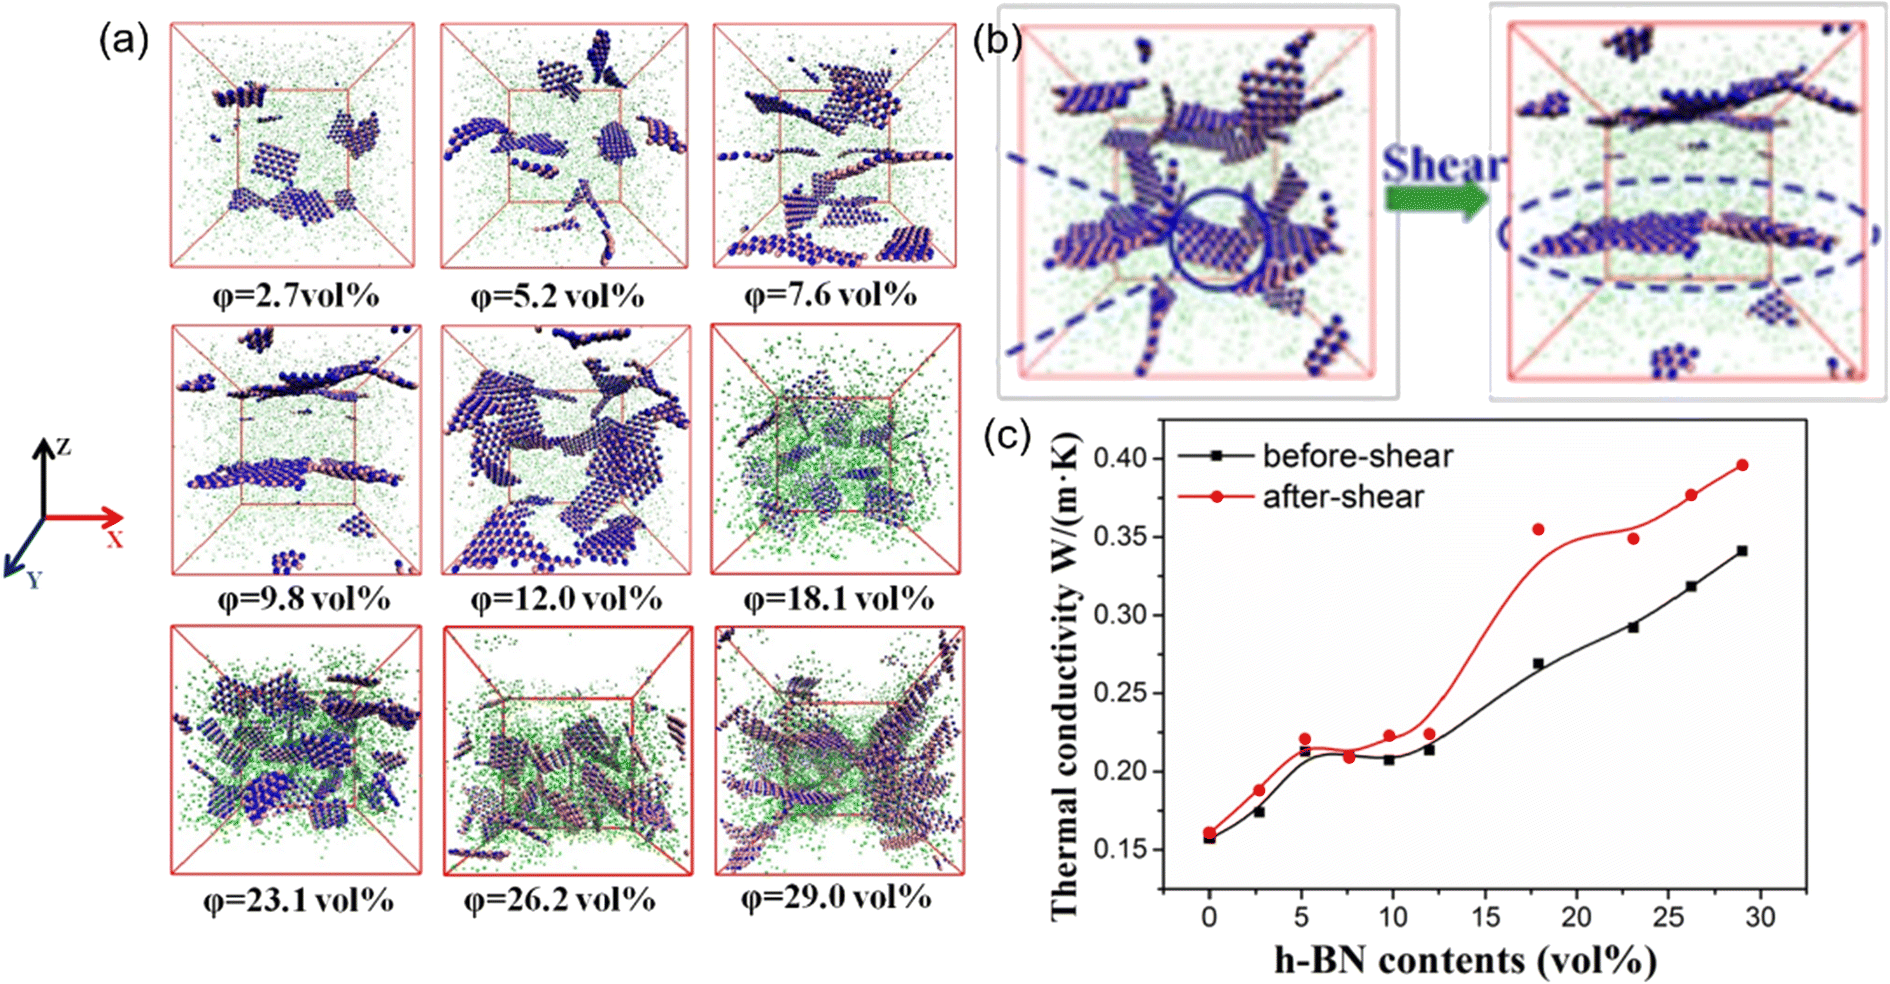 | ||
| Fig. 17 (a) Snapshots of PDMS/h-BN composites under five packing fractions of h-BN, (b) schematic of structural changes in h-BN before and after oscillatory shear, and (c) thermal conductivity of the PDMS/h-BN composite as a function of the h-BN volume fraction (adopted from ref. 82 with permission). | ||
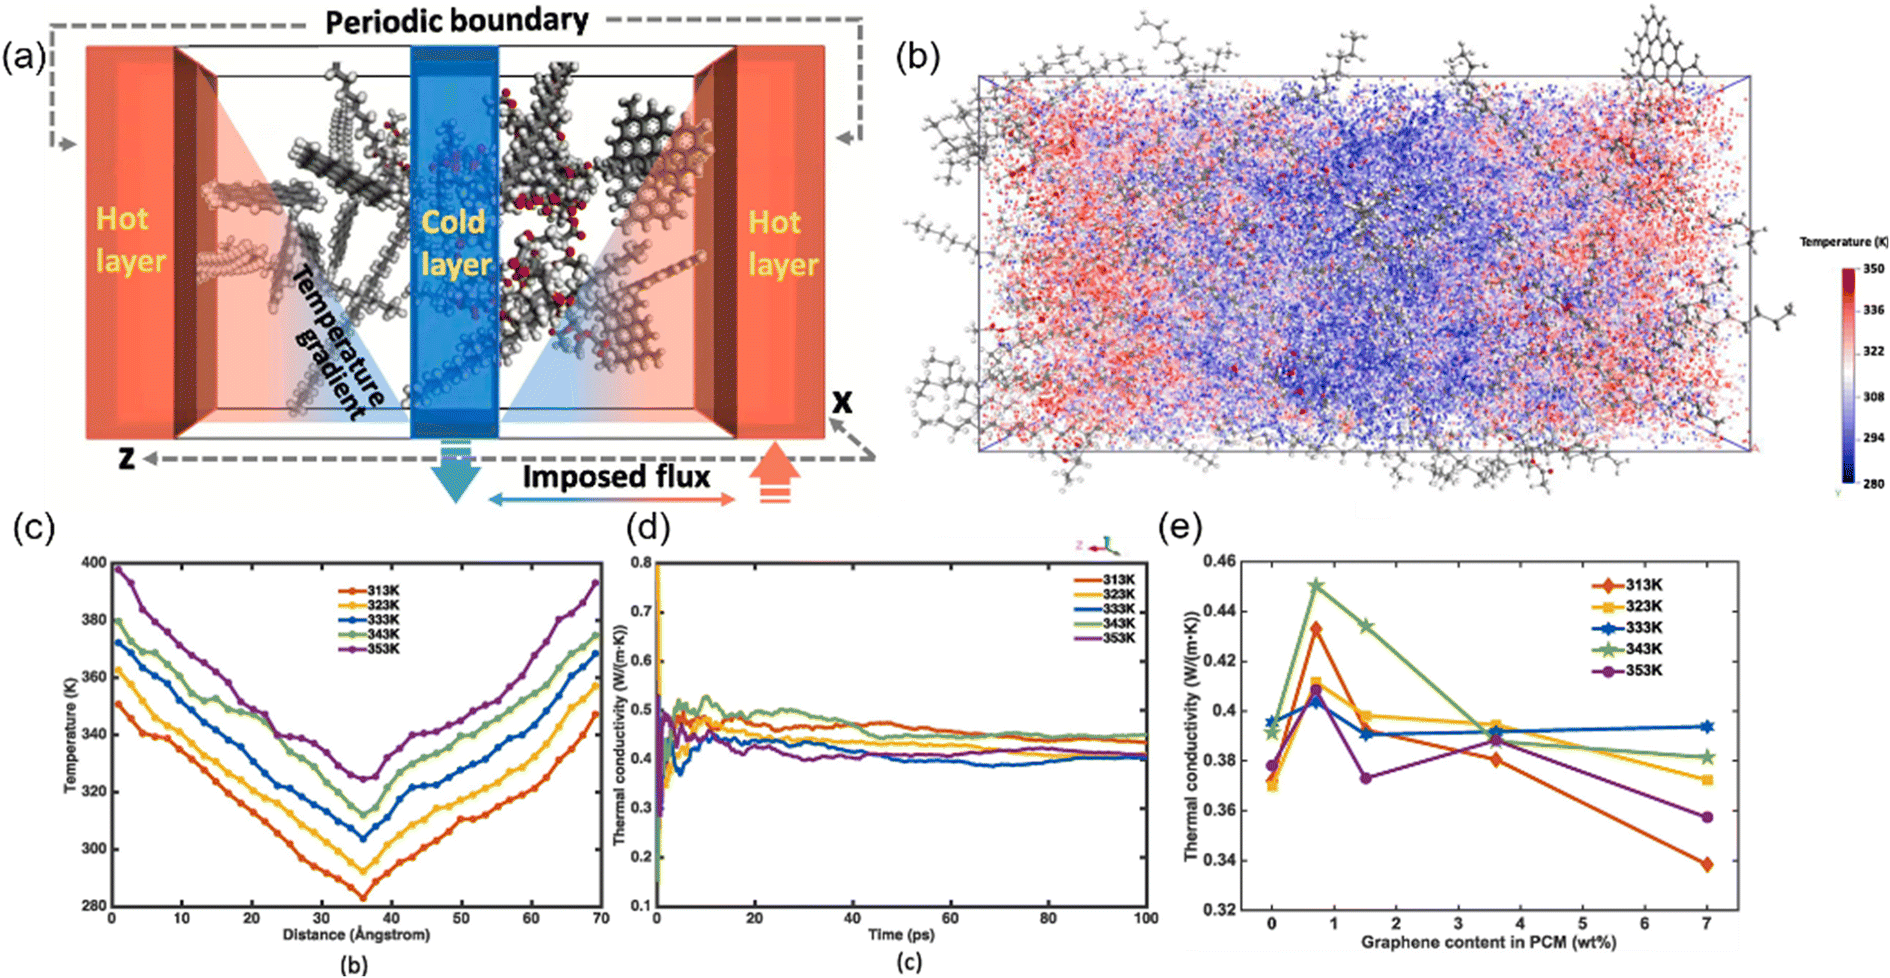 | ||
| Fig. 18 (a) Schematic of evaluating thermal conduction using the imposed flux method, (b) visualized temperature contour under 313 K, (c) temperature profile under different temperatures and (d) thermal conductivity versus simulation time, and (e) thermal conductivity under different temperatures with the variation of graphene content (adopted from ref. 83 with permission). | ||
Moreover, by reducing the aspect ratio of graphene from 100 to 20, the effective thermal conductivity of graphene polyethylene nanocomposites decreases about 34%. The results obtained by Hu et al.84 suggest that agglomeration and low aspect ratio of the conductive nanofiller additive are primarily responsible for the limited conductivity enhancement reported to date.
Functionalization of graphene/BN is very important to improve its interfacial thermal conductivity. Wang et al.85 concerned with the interfacial thermal resistance for PNCs reinforced by various covalently functionalized graphene. Among the various functional groups, the capacity to reduce the interfacial thermal resistance can be ranked as butyl, methyl, phenyl, and formyl. The other functional groups under consideration, such as carboxyl, hydroxyl, and amines, were found to produce negligible reduction in the interfacial thermal resistance (Fig. 19(a)). This is due to the fact that the introduction of functional groups increases the phonon vibration coupling between graphene and the polymer matrix, which effectively reduces the scattering of phonons and the energy loss of heat flow in the interfacial transport process. The interfacial thermal resistance exhibits the same behavior/tendency in the three polymers (PLA, PP, and epoxy): graphene > rGO ≈ GO.86 It was also observed that the presence of functional groups in the graphene, in the form of oxidation (hydroxyl and oxirane groups), increased the interfacial thermal conductivity.
 | ||
| Fig. 19 (a) Simulation models of pristine graphene and graphene functionalized with butyl, methyl, phenyl, formyl, carboxyl, amines, and hydroxyl, and interfacial thermal resistance as a function of the coverage of covalent functionalization (adopted from ref. 85 with permission), (b) atomistic model of a unit of epoxy molecular chains and graphene for calculating thermal conductivity, simulation for interfacial thermal conductance of the graphene/epoxy interface and inverse of thermal conductivity vs. inverse of grafting number (adopted from ref. 87 with permission), and (c) perpendicular thermal conductivity λ⊥ as a function of distance from the graphene plane for different grafting density, interfacial thermal conductivity, and the competition of interfacial, thermal conductivity of graphene and nanocomposites vs. increasing grafting density (adopted from ref. 88 with permission). | ||
The effect of functionalization on the overall thermal conductivity of nanocomposites depends on the competition between the contribution of interface thermal conductivity and the sacrifice of intrinsic thermal conductivity in 2D sheets. Wang87 investigated the thermal conductivities of functionalized graphene (FG) and FG/epoxy nanocomposites and indicated that the thermal conductivity of FG is markedly reduced compared with that of pristine graphene (Fig. 19(b)). This suggested that the improvement of interface thermal conductivity exhibits dominance compared with the sacrifice of thermal conductivity of graphene. The interfacial thermal conductivity is increased by 15–25%, and the thermal conductivity of the epoxy is augmented by 10% accordingly. Gao et al.88 investigated the effect of surface-grafted chains on the thermal conductivity of graphene–polyamide-6.6 (PA) nanocomposites (Fig. 19(c)), and they found that the interfacial thermal conductivity perpendicular to the graphene plane increases initially and then saturates with the length of grafted chains. On the one hand, the in-plane thermal conductivity of graphene drops as the grafting density increases, which is attributed to the destruction of the conjugate planar structure of graphene and the decline of the intrinsic free path length of phonons. On the other hand, the thermal conductivity parallel to the graphene plane of the composite increases with both grafting density and length. So there exists an optimum grafting density for improving the thermal conductivity of nanocomposites because of these two competing effects. XiShen and his coworkers89 investigated the effect of functionalization of graphene on the thermal conductivity of graphene and the epoxy composites. They demonstrated that improved interfacial thermal conductivity played a more important role in determining the overall thermal properties of nanocomposites when the sizes are small. In contrast, as the size increases up to a critical value, fewer interfaces are present along the direction of phonon transport, making the inherent thermal conductivity of graphene more dominant.
The effect of defects on the interfacial thermal conductivity of graphene/epoxy composites also attracts much interest. With the increase of defect concentration, the interface binding energy increases, leading to the increase of phonon vibration coupling degree and the increase of interfacial thermal conductivity. Meanwhile, SW, DV, and MV defects lead to a stronger conjugation effect between graphene and the epoxy matrix, thus resulting in a greater interfacial thermal conductivity. However, the defect is detrimental to the overall thermal conductivity. Zhang et al.90 explored (Fig. 20) the impact of the defect density, the inhomogeneity of the defect distribution, and the number of h-BN layers on the interfacial and overall thermal conductivity. Their conclusions revealed that the defects can improve the interfacial thermal conductivity, especially for h-BNs with high inhomogeneity of the defect distribution and multilayer, while the defect leads to the decline of intrinsic thermal conductivity of h-BN. In addition, the overall thermal conductivity of nanocomposites exhibits a gradual decrease with increasing defect density or reducing the inhomogeneity of the defect distribution.
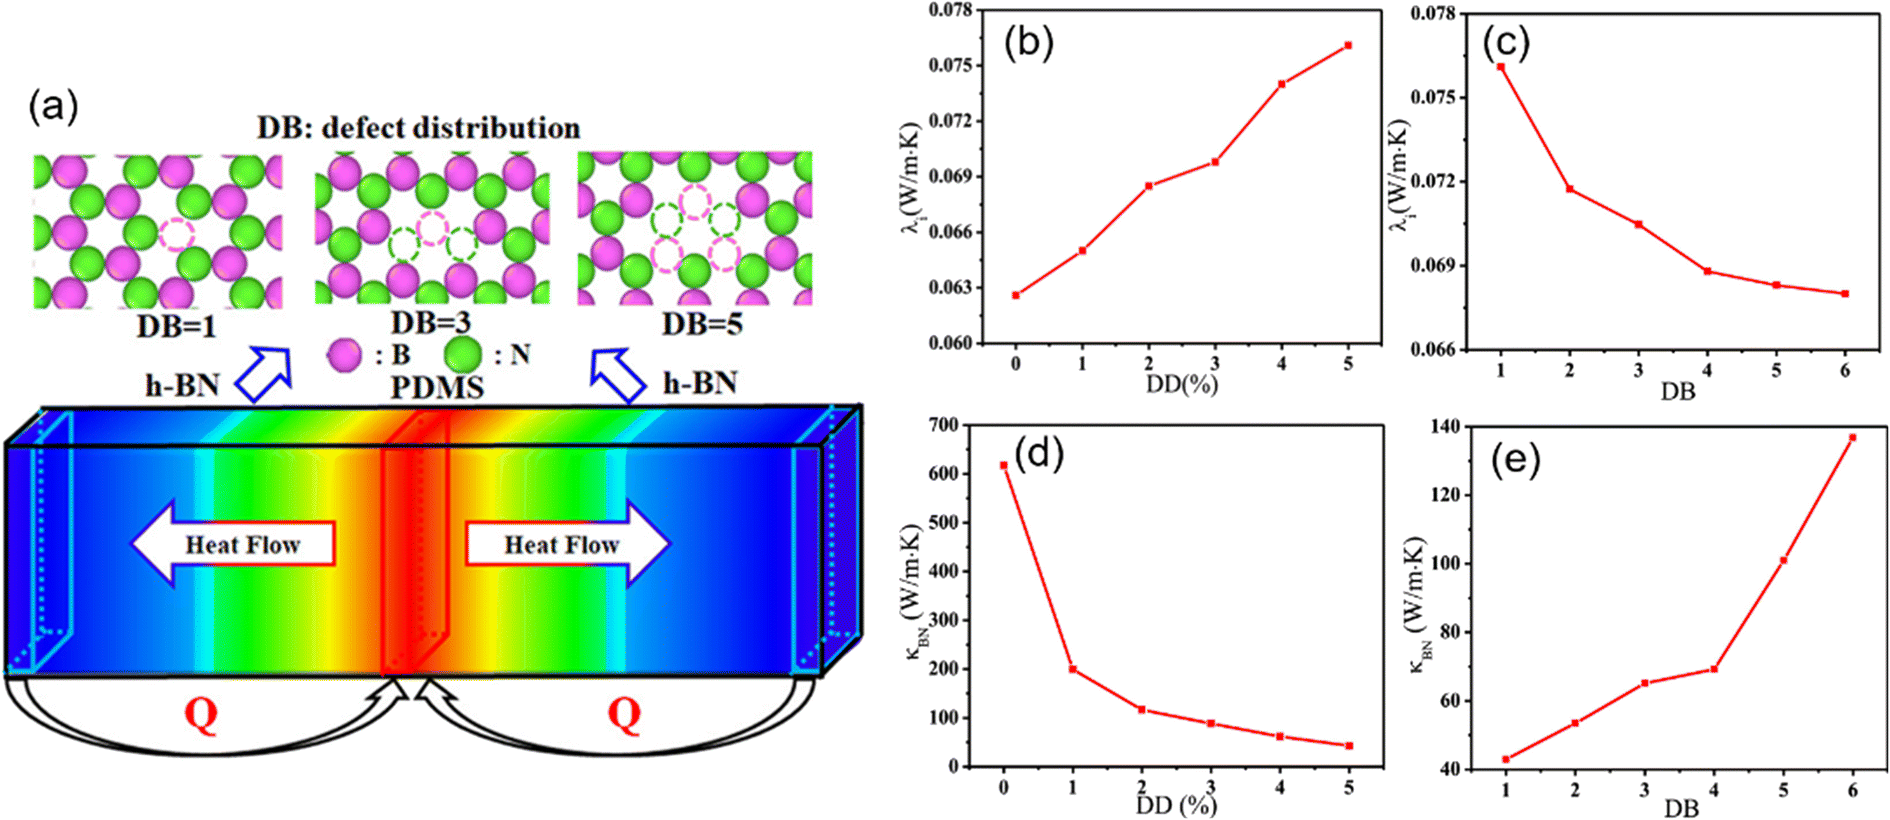 | ||
| Fig. 20 (a) Schematic diagram of defect distribution and heat flow in nanocomposites, interfacial thermal conductivity with respect to the (b) defect density and (c) defect distribution, and thermal conductivity of an infinitely long h-BN with respect to the (d) defect density (DD), and (e) defect distribution (DB) (adopted from ref. 90 with permission). | ||
Incorporation of 2D fillers to the matrix also affects the thermal stability of the polymer. Farzin Rahmani et al. found that the introduction of pristine graphene (PG)91 to the PEO system improves the thermal stability of the polymer. A delay in the temperature of the onset of decomposition in the non-isothermal mode and a nearly 60% increase in the activation energy of decomposition in the isothermal mode were observed for the PEO-PG system. In contrast, introducing GO in the PEO system deteriorates the thermal stability of the polymer. On the other hand, the thermal stability of the polymer both exhibits increased with increasing GO/graphene concentration.
5.3 Progress and challenges in MD simulation of electrical performance of nanocomposites
The most fascinating property of graphene lies in its very high electrical conductivity; in addition, MXenes also possess considerable electrical conductivity. The filled nanocomposites92 exhibit a non-linear increase of the electrical conductivity as a function of the filler loading. At a certain loading fraction, known as percolation threshold, the fillers are able to form a network, leading to a sudden rise in the electrical conductivity of the composite. The hyperbolic tangent equation is often applied to calculate the percolation threshold.| Λ = 0.5 + 0.5tanh(2(φ − φc)/dc) | (13) |
Λ denotes the electrical conductivity, φ represents the filler volume fraction, and φc and dc represent the percolation threshold and percolation extent respectively. The percolation threshold93 for conventional large conductive sheet materials (e.g., metal powders) is about 60 wt%, while for low-density sheet materials like graphene, the percolation threshold can be reduced to 3.15 wt%. The filler need not be in direct contact with the current flow; rather, conduction can take place via tunneling in polymer layers and this tunneling resistance has been proven to be the limiting factor for the thermal conductivity of polymer composites.
Apart from the filling loading of graphene, the shape and flatness of graphene also have a significant impact on the conductivity. Huang et al.94 studied the electric properties of GO-polydimethylsiloxane (PDMS) nanocomposites through simulation of the radius of gyration, dipole moments and dielectric constants (Fig. 21). The results indicated that the conductivity of the system is related to the flatness of the GO sheet, which is linked to the restriction of GO in the matrix. Appropriate wrinkles can contribute either through direct “contact” between the conductive fillers or “tunneling” of electrons between the sufficiently close polymer.
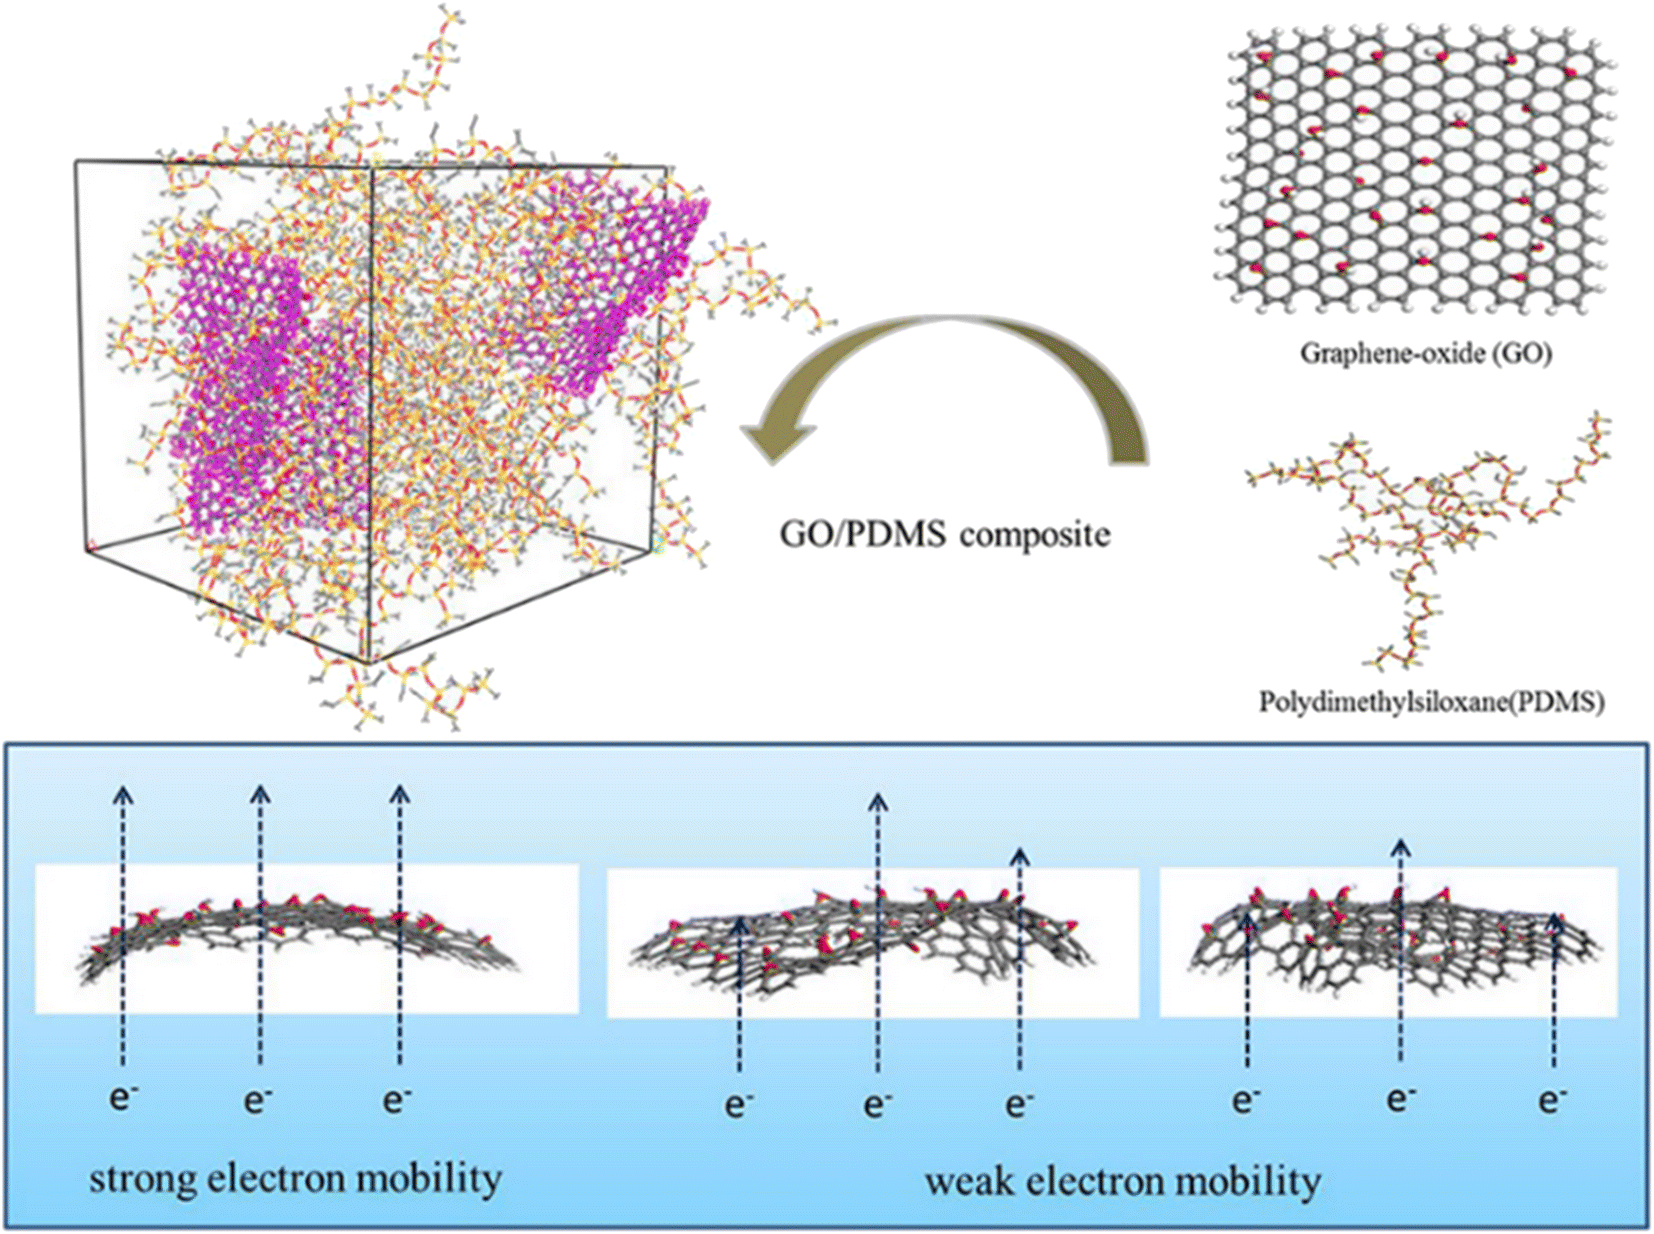 | ||
| Fig. 21 Conductive mechanism diagram of GO-polydimethylsiloxane (PDMS) nanocomposites (adopted from ref. 94 with permission). | ||
However, it was found that the electrical threshold and resistivity of carbon nanotube filled nanocomposites are lower than those of graphene filled nanocomposites. Furthermore, based on the critical exponent of the power-law model, the carbon nanotube nanocomposites possess a three-dimensional conductive network, while the graphene nanocomposites can only form a two-dimensional conductive network. Therefore, numerous MD simulations focus on the improvement of the conductivity of polymers by rod fillers,95 or several fillers96 (spheres, nanorods, and nanosheets) used together; less attention has been paid to 2D sheet fillers.
6 Future challenges and perspectives
Herein, we summarize the effects of filling loading, size, shape, dispersion and functionalization, and defect of 2D sheets on the mechanical, viscoelastic and thermal/electrical properties of polymer nanocomposites.Graphene is the most popular 2D sheet to reinforce polymers, and BN and MMT are mainly applied to improve the thermal and mechanical properties of polymers, respectively. MXenes, emerging 2D sheets, are still relatively less studied in MD simulation, and have gained more and more attention, which is one of the future research directions.
There exists a percolation phenomenon on the effect of filling loading on the above properties; that is, there is an optimum fraction that makes the 2D sheets form a percolation network to achieve the best performance. Polymer nanocomposites filled with 2D sheets with high aspect ratio and better dispersion can achieve better performance. Furthermore, the effect of functionalization on the overall performance of polymer nanocomposites depends on the competition between the contribution of interface transfer properties and the sacrifice of intrinsic properties in 2D sheets. A similar trend can be found in defective 2D sheet filled polymer nanocomposites.
All models we summarized are derived from experiments; the calculation results and the corresponding molecular mechanism are helpful to guide the preparation and processing of 2D nanosheet based nanocomposites, reduce the design cycle of materials, and thus promote the development of the field of 2D nanocomposites. However, despite the superiority of employing MD simulations to study the structure–property relations of 2D nanosheet based polymer nanocomposites, the challenges remain to be resolved and the possible future perspectives are proposed as follows:
Too short time step in MD simulation makes the strain rate generally selected as 107 s−1–1010 s−1 in the process of the calculation of its mechanical properties, which is deviated from the real physical experiment.97 Hence, a multi-scale modeling and simulation technique is desirable to be developed.98 In addition, MD simulation is mainly concerned with the physicochemical properties of small systems over short periods, while the properties of real materials involve coupling on multiple scales. To achieve high precision-massive scale-laboratory time scale, the combination of machine learning such as neural network potential function with a supercomputer, GPU support, and accelerated algorithm offers an opportunity to implement simulations that approximate the real experimental process. Finally, more algorithms should be developed so that the key parameters of MD simulation can be verified experimentally.
Conflicts of interest
There are no conflicts of interest to declare.Acknowledgements
The authors acknowledge the financial support from the National Science Fund for Excellent Young Scholars (52122311), the Major Program (51790502) of the National Nature Science Foundation of China, the National Natural Science Foundation of China (51873006, 21674010, and 51333004), the Beijing Municipal Natural Science Foundation (2182053), and the Fok Ying-Tong Education Foundation of China (Grant No. 171040). The super-calculation center of “Tianhe number two” and the cloud calculation platform of Beijing University of Chemical Technology (BUCT) are both greatly appreciated.References
- N. Kong, S. Zhang, J. Liu, J. Wang, Z. Liu, H. Wang, J. Liu and W. Yang, Mol. Syst. Des. Eng., 2019, 4, 431–436 RSC.
- J. Li, X. Liu, Y. Feng and J. Yin, Prog. Polym. Sci., 2022, 101505 CrossRef CAS.
- S. Z. Butler, S. M. Hollen, L. Cao, Y. Cui, J. A. Gupta, H. R. Gutiérrez, T. F. Heinz, S. S. Hong, J. Huang and A. F. Ismach, ACS Nano, 2013, 7, 2898–2926 CrossRef CAS.
- K. S. Novoselov, A. K. Geim, S. V. Morozov, D. Jiang, M. I. Katsnelson, I. Grigorieva, S. Dubonos and A. Firsov, Nature, 2005, 438, 197–200 CrossRef CAS.
- K. Zhang, Y. Feng, F. Wang, Z. Yang and J. Wang, J. Mater. Chem. C, 2017, 5, 11992–12022 RSC.
- L. Zhong, S. Hu, X. Yang, M. Yang, T. Zhang, L. Chen, Y. Zhao and S. Song, Colloids Surf., A, 2021, 617, 126364 CrossRef CAS.
- X. Zhan, C. Si, J. Zhou and Z. Sun, Nanoscale Horiz., 2020, 5, 235–258 RSC.
- I. J. Echols, H. An, X. Zhao, E. M. Prehn, Z. Tan, M. Radovic, M. J. Green and J. L. Lutkenhaus, Mol. Syst. Des. Eng., 2020, 5, 366–375 RSC.
- W. Xia, J. Song, Z. Meng, C. Shaoc and S. Keten, Mol. Syst. Des. Eng., 2020, 32, 2003154 Search PubMed.
- Z. Ji, L. Zhang, G. Xie, W. Xu, D. Guo, J. Luo and B. Prakash, Friction, 2020, 8, 813–846 CrossRef.
- R. Wazalwar, M. Sahu and A. M. Raichur, Nanoscale Adv., 2021, 3, 2741–2776 RSC.
- J. R. Vakil, N. D. A. Watuthanthrige, Z. A. Digby, B. Zhang, H. A. Lacy, J. L. Sparks and D. Konkolewicz, Mol. Syst. Des. Eng., 2020, 5, 1267–1276 RSC.
- A. D. Valino, J. R. C. Dizon, A. H. Espera Jr, Q. Chen, J. Messman and R. C. Advincula, Prog. Polym. Sci., 2019, 98, 101162 CrossRef CAS.
- H. Gu, C. Ma, J. Gu, J. Guo, X. Yan, J. Huang, Q. Zhang and Z. Guo, J. Mater. Chem. C, 2016, 4, 5890–5906 RSC.
- D. J. Carastan, N. R. Demarquette, A. Vermogen and K. Masenelli-Varlot, Rheol. Acta, 2008, 47, 521–536 CrossRef CAS.
- Y. B. Pottathara, H. R. Tiyyagura, Z. Ahmad and K. K. Sadasivuni, J. Energy Storage, 2020, 30, 101549 CrossRef.
- X. Sun, C. Huang, L. Wang, L. Liang, Y. Cheng, W. Fei and Y. Li, Adv. Mater., 2021, 33, 2001105 CrossRef CAS.
- V. Vatanpour, S. A. Naziri Mehrabani, B. Keskin, N. Arabi, B. Zeytuncu and I. Koyuncu, Ind. Eng. Chem. Res., 2021, 60, 13391–13424 CrossRef CAS.
- H. Zhang, ACS Nano, 2015, 9, 9451–9469 CrossRef CAS PubMed.
- M. Wang, M. Zhou, X. Li, C. Luo, S. You, X. Chen, Y. Mo and H. Zhu, Mater. Res. Express, 2021, 8, 042002 CrossRef CAS.
- A. H. Khan, S. Ghosh, B. Pradhan, A. Dalui, L. K. Shrestha, S. Acharya and K. Ariga, Bull. Chem. Soc. Jpn., 2017, 90, 627–648 CrossRef.
- K. Hu, D. D. Kulkarni, I. Choi and V. V. Tsukruk, Prog. Polym. Sci., 2014, 39, 1934–1972 CrossRef CAS.
- G. Guan and M.-Y. Han, Adv. Sci., 2019, 6, 1901837 CrossRef CAS.
- D. Jariwala and M. C. Hersam, Mol. Syst. Des. Eng., 2019, 4, 469–470 RSC.
- A. K. Geim, Science, 2009, 324, 1530–1534 CrossRef CAS PubMed.
- A. Chaurasia, A. Verma, A. Parashar and R. S. Mulik, J. Phys. Chem. C, 2019, 123, 20059–20070 CrossRef CAS.
- O. L. Manevitch and G. C. Rutledge, J. Phys. Chem. B, 2004, 108, 1428–1435 CrossRef CAS.
- L. H. Karlsson, J. Birch, J. Halim, M. W. Barsoum and P. O. Persson, Nano Lett., 2015, 15, 4955–4960 CrossRef CAS PubMed.
- J. W. Suk, R. D. Piner, J. An and R. S. Ruoff, ACS Nano, 2010, 4, 6557–6564 CrossRef CAS PubMed.
- X. Mu, X. Wu, T. Zhang, D. B. Go and T. Luo, Sci. Rep., 2014, 4, 1–9 Search PubMed.
- X. Shen, Q. Zheng and J.-K. Kim, Prog. Mater. Sci., 2021, 115, 100708 CrossRef CAS.
- V. Guerra, C. Wan and T. McNally, Prog. Mater. Sci., 2019, 100, 170–186 CrossRef CAS.
- H. Li, L. Ren, Y. Zhou, B. Yao and Q. Wang, High Voltage, 2020, 5, 365–376 CrossRef.
- N. Garcia and J. Bazan, Clay Miner., 2009, 44, 81–88 CrossRef CAS.
- N. J. García and J. C. Bazán, Clay Miner., 2009, 44, 81–88 CrossRef.
- L. Gao, C. Li, W. Huang, S. Mei, H. Lin, Q. Ou, Y. Zhang, J. Guo, F. Zhang and S. Xu, Chem. Mater., 2020, 32, 1703–1747 CrossRef CAS.
- R. Liu and W. Li, ACS Omega, 2018, 3, 2609–2617 CrossRef CAS PubMed.
- F. Shahzad, M. Alhabeb, C. B. Hatter, B. Anasori, S. Man Hong, C. M. Koo and Y. Gogotsi, Science, 2016, 353, 1137–1140 CrossRef CAS.
- A. Talapatra and D. Datta, Mol. Simul., 2021, 47, 602–618 CrossRef CAS.
- J. Fuller and M. Wisnom, Compos. Sci. Technol., 2015, 112, 8–15 CrossRef CAS.
- S. Frankland, V. Harik, G. Odegard, D. Brenner and T. Gates, Compos. Sci. Technol., 2003, 63, 1655–1661 CrossRef CAS.
- X. Zhang, J. Chen and T. Liu, Macromol. Theory Simul., 2022, 31, 2100044 CrossRef CAS.
- F. Liu, N. Hu, H. Ning, Y. Liu, Y. Li and L. Wu, Comput. Mater. Sci., 2015, 108, 160–167 CrossRef CAS.
- R. Rahman, J. Appl. Phys., 2013, 113, 243503 CrossRef.
- F. Lin, Y. Xiang and H.-S. Shen, Composites, Part B, 2017, 111, 261–269 CrossRef CAS.
- Q. Zhang, B. Mortazavi, X. Zhuang and F. Aldakheel, Compos. Struct., 2022, 281, 115004 CrossRef CAS.
- M. Rafiee, J. Rafiee, Z. Wang, H.-H. Song, Z.-Z. Yu and N. Koratkar, ACS Nano, 2009, 3, 3884–3890 CrossRef CAS PubMed.
- T. Saha, A. K. Bhowmick, T. Oda, T. Miyauchi and N. Fujii, Composites, Part B, 2019, 169, 65–78 CrossRef CAS.
- Y. Wang, X. Zhang, L. Li and J. Gao, AIP Adv., 2019, 9, 125201 CrossRef.
- A. Chaurasia and A. Parashar, Mater. Today: Proc., 2021, 47, 2875–2877 CAS.
- Y. Sliozberg, J. Andzelm, C. B. Hatter, B. Anasori, Y. Gogotsi and A. Hall, Compos. Sci. Technol., 2020, 192, 108124 CrossRef CAS.
- J. Shi, J. Yang, J. Zhou, H. Ji and T. Gao, Mater. Res. Express, 2020, 7, 035304 CrossRef CAS.
- A. Yarahmadi, M. Hashemian and D. Toghraie, J. Mol. Liq., 2022, 347, 118392 CrossRef CAS.
- M. A. Rafiee, J. Rafiee, Z. Wang, H. Song, Z.-Z. Yu and N. Koratkar, ACS Nano, 2009, 3, 3884–3890 CrossRef CAS PubMed.
- R. Atif and F. Inam, Graphene, 2016, 5, 96–142 CrossRef CAS.
- L.-C. Tang, Y.-J. Wan, D. Yan, Y.-B. Pei, L. Zhao, Y.-B. Li, L.-B. Wu, J.-X. Jiang and G.-Q. Lai, Carbon, 2013, 60, 16–27 CrossRef CAS.
- J. L. Suter, R. C. Sinclair and P. V. Coveney, Adv. Mater., 2020, 32, 2003213 CrossRef CAS.
- C. Lv, Q. Xue, D. Xia, M. Ma, J. Xie and H. Chen, J. Phys. Chem. C, 2010, 114, 6588–6594 CrossRef CAS.
- C. Park and G. J. Yun, J. Appl. Mech., 2018, 85, 091007 CrossRef.
- M. A. N. Dewapriya, R. K. N. D. Rajapakse and N. Nigam, Carbon, 2015, 93, 830–842 CrossRef CAS.
- S. Yang and J.-H. Lee, Funct. Compos. Struct., 2019, 1, 045007 CrossRef CAS.
- J. Zhang and D. Jiang, Carbon, 2014, 67, 784–791 CrossRef CAS.
- Y. Sun, X. Tang, H. Bao, Z. Yang and F. Ma, RSC Adv., 2020, 10, 29610–29617 RSC.
- Q.-X. Pei, Y.-W. Zhang and V. B. Shenoy, Nanotechnology, 2010, 21, 115709 CrossRef PubMed.
- Z. Zheng, Z. Wang, L. Wang, J. Liu, Y. Wu and L. Zhang, Nanotechnology, 2016, 27, 265704 CrossRef.
- M. Li, H. Zhou, Y. Zhang, Y. Liao and H. Zhou, RSC Adv., 2017, 7, 46101–46108 RSC.
- J. Moon, S. Yang and M. Cho, Carbon, 2017, 118, 66–77 CrossRef CAS.
- M. Moeini, R. Barbaz Isfahani, S. Saber-Samandari and M. M. Aghdam, Mol. Simul., 2020, 46, 476–486 CrossRef CAS.
- Y. Chen, Z. Li, S. Wen, Q. Yang, L. Zhang, C. Zhong and L. Liu, J. Chem. Phys., 2014, 141, 104901 CrossRef PubMed.
- W. Hong, J. Lin, X. Tian and L. Wang, J. Phys. Chem. B, 2020, 124, 6437–6447 CrossRef CAS PubMed.
- J. Yang, D. Custer, C. C. Chiang, Z. Meng and X. H. Yao, Comput. Mater. Sci., 2021, 191, 110339 CrossRef CAS PubMed.
- T. Li, Z. Meng and S. Keten, Carbon, 2020, 158, 303–313 CrossRef CAS.
- Y. Wang and Z. Meng, Carbon, 2021, 177, 128–137 CrossRef CAS PubMed.
- Z. Liu, J. Li, C. Zhou and W. Zhu, Int. J. Heat Mass Transfer, 2018, 126, 353–362 CrossRef CAS.
- C. Huang, X. Qian and R. Yang, Mater. Sci. Eng., R, 2018, 132, 1–22 CrossRef.
- Y.-R. Huang, P.-H. Chuang and C.-L. Chen, Int. J. Heat Mass Transfer, 2015, 91, 45–51 CrossRef CAS.
- Y. Han, K. Li, Z. Li, J. Liu, S. Hu, S. Wen, L. Liu and L. Zhang, Phys. Chem. Chem. Phys., 2022, 4334–4347 RSC.
- F. Müller-Plathe, J. Chem. Phys., 1997, 106, 6082–6085 CrossRef.
- X. Yang, X. Wang, W. Wang, Y. Fu and Q. Xie, Int. J. Heat Mass Transfer, 2020, 159, 120105 CrossRef CAS.
- M. Zhu, J. Li, J. Chen, H. Song and H. Zhang, Comput. Mater. Sci., 2019, 164, 108–115 CrossRef CAS.
- X. Wang, T. Zhao, Y. Wang, L. Zhang, L. Zou and Y. Zhang, Comput. Mater. Sci., 2021, 272–280 CAS.
- Z. Li, K. Li, J. Liu, S. Hu, S. Wen, L. Liu and L. Zhang, Polymer, 2019, 177, 262–273 CrossRef CAS.
- M. Zhang, C. Wang, A. Luo, Z. Liu and X. Zhang, Appl. Therm. Eng., 2020, 166, 114639 CrossRef CAS.
- L. Hu, T. Desai and P. Keblinski, J. Appl. Phys., 2011, 110 CAS.
- Y. Wang, H. F. Zhan, Y. Xiang, C. Yang, C. M. Wang and Y. Y. Zhang, J. Phys. Chem. C, 2015, 119, 12731–12738 CrossRef CAS.
- F. M. Bellussi, C. Sáenz Ezquerro, M. Laspalas and A. Chiminelli, Nanomaterials, 2021, 11, 1709 CrossRef CAS PubMed.
- T.-Y. Wang and J.-L. Tsai, Comput. Mater. Sci., 2016, 122, 272–280 CrossRef CAS.
- Y. Gao and F. Müller-Plathe, J. Phys. Chem. B, 2016, 120, 1336–1346 CrossRef CAS PubMed.
- X. Shen, Z. Wang, Y. Wu, X. Liu and J.-K. Kim, Carbon, 2016, 108, 412–422 CrossRef CAS.
- W. Zhang, H. Li, H. Jiang, H. Wu, Y. Lu, X. Zhao, L. Liu, Y. Gao and L. Zhang, Langmuir, 2021, 37, 12038–12048 CrossRef CAS.
- S. Plimpton, J. Comput. Phys., 1995, 117, 1–19 CrossRef CAS.
- D. Verma, P. C. Gope, A. Shandilya and A. Gupta, Trans. Indian Inst. Met., 2014, 67, 803–816 CrossRef CAS.
- J. Li, P. C. Ma, W. S. Chow, C. K. To, B. Z. Tang and J. K. Kim, Adv. Funct. Mater., 2007, 17, 3207–3215 CrossRef CAS.
- Y.-R. Huang, C.-L. Chen, Y.-H. Tseng, C.-T. Chang Chien, C.-W. Liu, C.-C. Tai and M.-H. Liu, J. Mol. Graphics Modell., 2019, 92, 236–242 CrossRef CAS PubMed.
- H. Wu, H. Li, W. Zhang, F. Li, B. Li, Y. Gao, X. Zhao and L. Zhang, Compos. Sci. Technol., 2020, 196, 108208 CrossRef CAS.
- F. Qu, W. Sun, B. Li, F. Li, Y. Gao, X. Zhao and L. Zhang, Soft Matter, 2021, 17, 769 RSC.
- Y. Peng, T. Yue, S. Li, K. Gao, Y. Wang, Z. Li, X. Ye, L. Zhang and J. Liu, Mol. Syst. Des. Eng., 2021, 6, 461–475 RSC.
- M. Fermeglia, A. Mio, S. Aulic, D. Marson, E. Laurinia and S. Pricl, Mol. Syst. Des. Eng., 2020, 5, 1447–1476 RSC.
- J. Tersoff, Phys. Rev. B: Condens. Matter Mater. Phys., 1988, 37, 6991 CrossRef PubMed.
- S. J. Stuart, A. B. Tutein and J. A. Harrison, J. Chem. Phys., 2000, 112, 6472–6486 CrossRef CAS.
- R. T. Cygan, J. J. Liang and A. G. Kalinichev, J. Phys. Chem. B, 2004, 108, 1255–1266 CrossRef CAS.
- S. Plimpton, J. Comput. Phys., 1995, 117, 1–19 CrossRef CAS.
- M. Zhou, J. Liu, H. Yang and L. Zhang, Compos. Sci. Technol., 2022, 228, 109617 CrossRef CAS.
| This journal is © The Royal Society of Chemistry 2023 |