
 Open Access Article
 This Open Access Article is licensed under a
 Creative Commons Attribution 3.0 Unported Licence
Pretargeted imaging beyond the blood–brain barrier†
Vladimir
Shalgunov‡
 a,
Sara
Lopes van den Broek‡
a,
Ida
Vang Andersen
a,
Rocío
García Vázquez
a,
Nakul Ravi
Raval
bc,
Mikael
Palner
bd,
Yuki
Mori
d,
Gabriela
Schäfer
e,
Barbara
Herrmann
f,
Hannes
Mikula
f,
Natalie
Beschorner
d,
Maiken
Nedergaard
d,
Stina
Syvänen
g,
Matthias
Barz
dh,
Gitte
Moos Knudsen
bi,
Umberto Maria
Battisti
*a and
Matthias Manfred
Herth
*aj
a,
Sara
Lopes van den Broek‡
a,
Ida
Vang Andersen
a,
Rocío
García Vázquez
a,
Nakul Ravi
Raval
bc,
Mikael
Palner
bd,
Yuki
Mori
d,
Gabriela
Schäfer
e,
Barbara
Herrmann
f,
Hannes
Mikula
f,
Natalie
Beschorner
d,
Maiken
Nedergaard
d,
Stina
Syvänen
g,
Matthias
Barz
dh,
Gitte
Moos Knudsen
bi,
Umberto Maria
Battisti
*a and
Matthias Manfred
Herth
*aj
aDepartment of Drug Design and Pharmacology, Faculty of Health and Medical Sciences, University of Copenhagen, Universitetsparken 2, 2100 Copenhagen, Denmark. E-mail: umberto.battisti@sund.ku.dk; matthias.herth@sund.ku.dk
bNeurobiology Research Unit and Center for Integrated Molecular Brain Imaging, Rigshospitalet Copenhagen University Hospital, Blegdamsvej 9, DK-2100 Copenhagen, Denmark
cFaculty of Health and Medical Sciences, University of Copenhagen, 2200 Copenhagen, Denmark
dCenter for Translational Neuromedicine, University of Copenhagen, Blegdamsvej 3B, DK-2200 Copenhagen, Denmark
eLeiden Academic Centre for Drug Research, Leiden University, Einsteinweg 55, 2333CC Leiden, The Netherlands
fInstitute of Applied Synthetic Chemistry, Technische Universitat Wien (TU Wien), Getreidemarkt 9, 1060 Vienna, Austria
gRudbeck Laboratory, Department of Public Health and Caring Sciences, Uppsala University, Dag Hammarskjölds Väg 20, 75185 Uppsala, Sweden
hDepartment of Dermatology, University Medical Center of the Johannes Gutenberg University Mainz, Langenbeckstraße 1, 55131 Mainz, Germany
iDepartment of Clinical Medicine, University of Copenhagen, Denmark
jDepartment of Clinical Physiology, Nuclear Medicine & PET, Rigshospitalet Copenhagen University Hospital, Blegdamsvej 9, 2100 Copenhagen, Denmark
First published on 2nd December 2022
Abstract
Pretargeting is a powerful nuclear imaging strategy to achieve enhanced imaging contrast for nanomedicines and reduce the radiation burden to healthy tissue. Pretargeting is based on bioorthogonal chemistry. The most attractive reaction for this purpose is currently the tetrazine ligation, which occurs between trans-cyclooctene (TCO) tags and tetrazines (Tzs). Pretargeted imaging beyond the blood–brain barrier (BBB) is challenging and has not been reported thus far. In this study, we developed Tz imaging agents that are capable of ligating in vivo to targets beyond the BBB. We chose to develop 18F-labeled Tzs as they can be applied to positron emission tomography (PET) – the most powerful molecular imaging technology. Fluorine-18 is an ideal radionuclide for PET due to its almost ideal decay properties. As a non-metal radionuclide, fluorine-18 also allows for development of Tzs with physicochemical properties enabling passive brain diffusion. To develop these imaging agents, we applied a rational drug design approach. This approach was based on estimated and experimentally determined parameters such as the BBB score, pretargeted autoradiography contrast, in vivo brain influx and washout as well as on peripheral metabolism profiles. From 18 initially developed structures, five Tzs were selected to be tested for their in vivo click performance. Whereas all selected structures clicked in vivo to TCO-polymer deposited into the brain, [18F]18 displayed the most favorable characteristics with respect to brain pretargeting. [18F]18 is our lead compound for future pretargeted neuroimaging studies based on BBB-penetrant monoclonal antibodies. Pretargeting beyond the BBB will allow us to image targets in the brain that are currently not imageable, such as soluble oligomers of neurodegeneration biomarker proteins. Imaging of such currently non-imageable targets will allow early diagnosis and personalized treatment monitoring. This in turn will accelerate drug development and greatly benefit patient care.
Introduction
Positron emission tomography (PET) is a non-invasive molecular imaging method that relies on radiolabeled molecules (tracers) and is routinely used for clinical diagnosis, treatment monitoring and drug development.1–4 The key advantages of PET over other molecular imaging techniques are its quantitativity, high sensitivity, superior resolution and relatively low radiation dose for patients.3–5 Therefore, the development of new PET tracers is essential, especially for the emergence of new treatment forms.6–8 Monoclonal antibodies (mAbs) are particularly promising vectors for diagnostic imaging. This is because of their high target specificity and low non-displaceable binding.9–12 Recently, it became possible to use these vectors also for targets within the brain. Penetration of the blood–brain barrier (BBB) can be achieved by several methods such as active transport, for example by utilizing the transferrin receptor, or by opening the BBB, for example by using focused ultrasound-based (FUS) strategies.13–18 Despite these advances, the use of mAbs for diagnostic brain imaging is still in its infancy, as imaging is hindered by the slow pharmacokinetics of mAbs. Although there are long-lived radionuclides compatible with the long circulation time of mAbs,19–22 respective radionuclides provide inferior image quality and result in high radiation burden for the patient.22Pretargeting makes it possible to combine slow-circulating targeting vectors with short-lived PET radionuclides (Fig. 1A).22–25 In this approach, a tagged mAb is injected first and allowed sufficient time to accumulate at target-rich sites and to be eliminated from the blood. Next, a radiolabeled small molecule (effector molecule) is injected, which possesses fast pharmacokinetics and can rapidly and selectively react with the tag of the beforehand administered mAb.25–27 The use of trans-cyclooctene (TCO) derivatives as chemical tags and 1,2,4,5-tetrazine (Tz) derivatives as effector molecules has become state-of-the-art for pretargeted PET imaging due to the ultra-fast kinetics of the inverse electron demand Diels–Alder (IEDDA) “click” cycloaddition between these two structures, its bioorthogonality and compatibility with multiple scaffolds.28–30 Development of controlled drug delivery by means of Tz-triggered decaging of TCO-drug conjugates or vice versa (click-to-release) makes this chemistry even more attractive.22,31–33
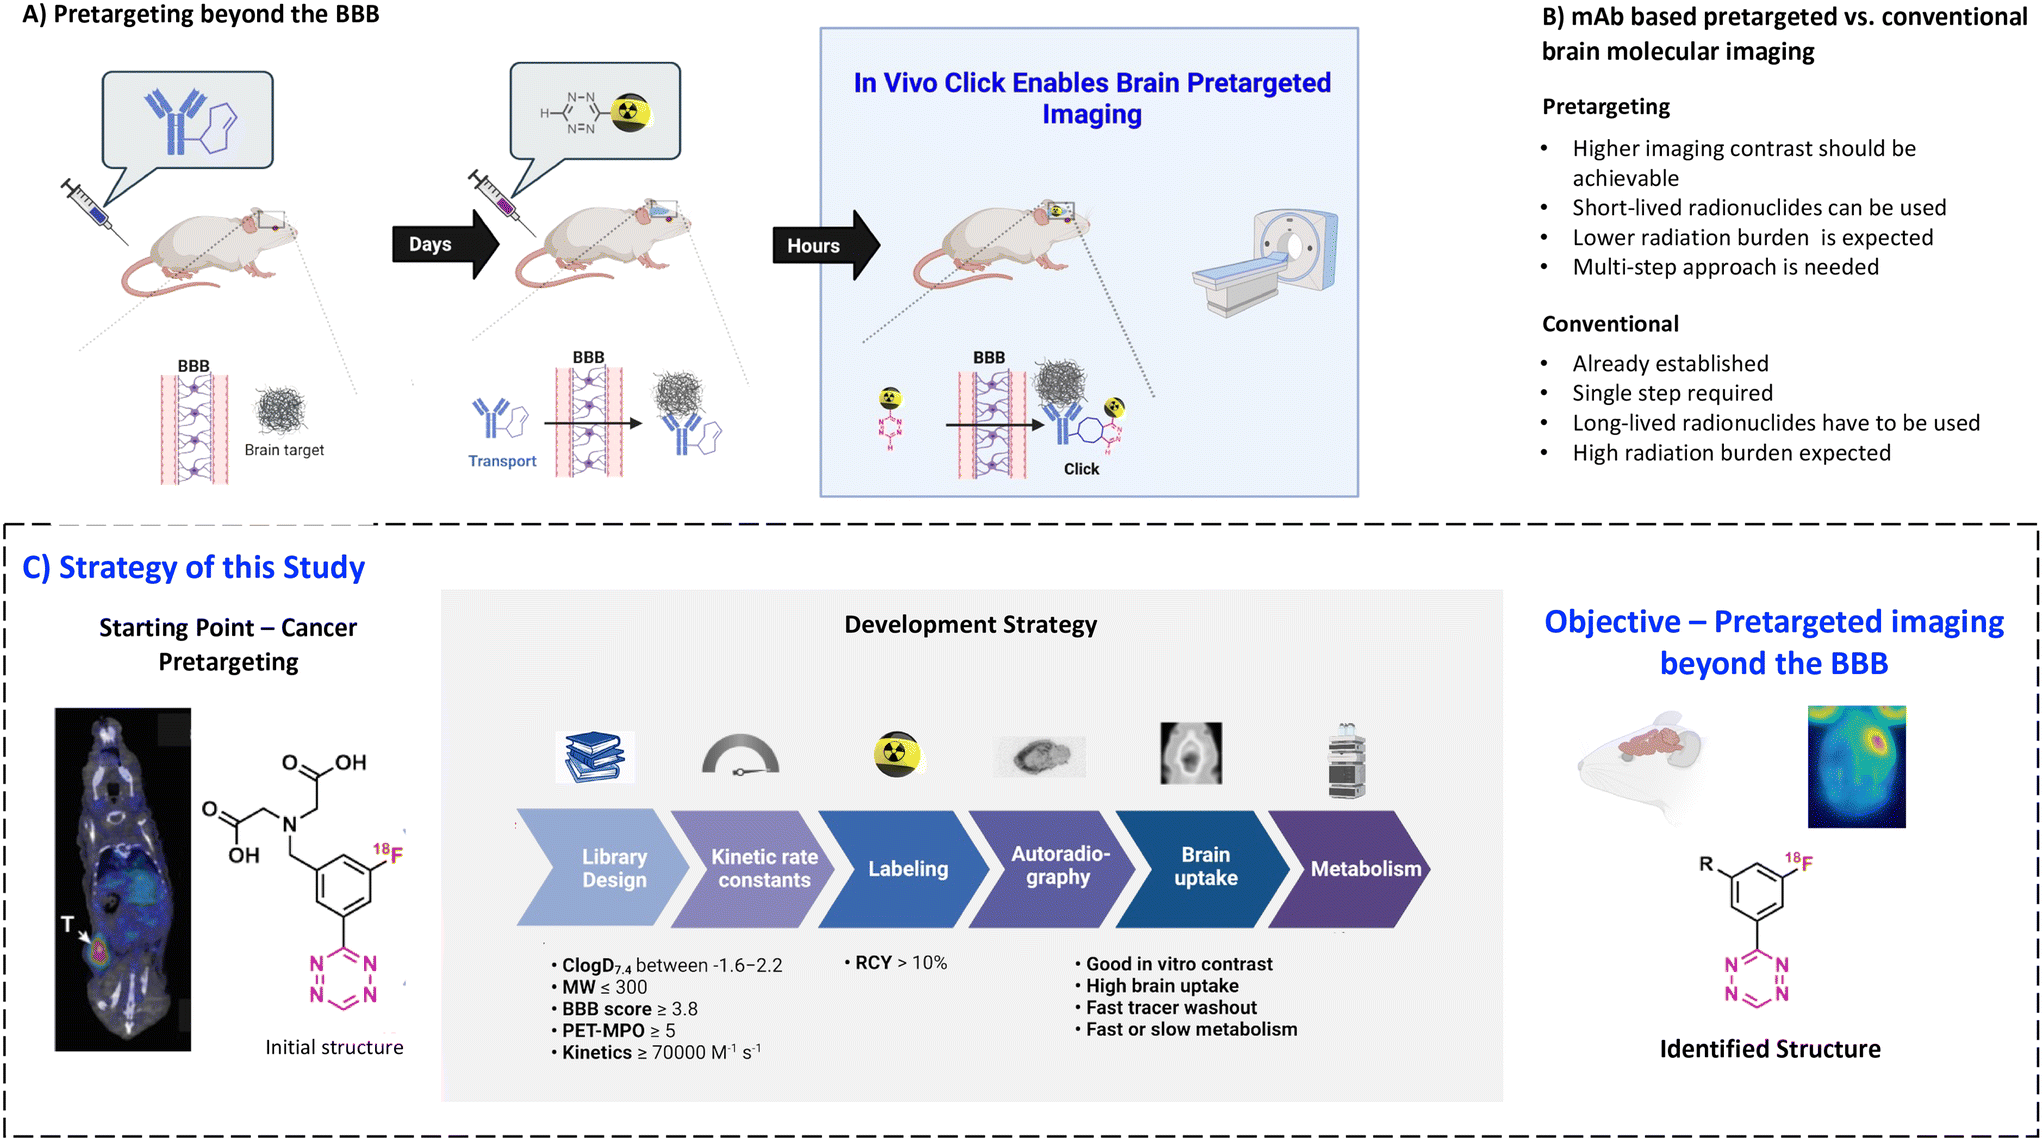 | ||
| Fig. 1 A) The concept of pretargeting beyond the BBB. In the first step, a BBB-penetrating TCO-tagged mAb is injected. The mAb is actively transported over the BBB and binds to its target. In the second step, a 18F-radiolabeled Tz is injected. The Tz clicks to the TCO-tagged mAbs, thus enabling the imaging of the selected target. B) Comparison between pretargeted and conventional imaging C) strategy and workflow of this study to develop BBB permeable Tz imaging agent that is able to click in vivo to targets within the brain. The starting point was a Tz probe developed for cancer pretargeting. A library was designed based on this scaffold to have optimal parameters to cross the BBB and click in vivo. All the designed molecules were synthesized to evaluate labeling feasibility and in vitro stability. The 18F-Tzs were then tested for imaging contrast with in vitro autoradiography. Finally, compounds were injected into rats to evaluate the brain uptake. Metabolism was then evaluated for the best compounds. | ||
Recently, we performed a systematic study of the relationship between the physicochemical properties of Tzs and their in vivo click performance in a colon tumor model. This study revealed that only hydrophilic Tzs with fast click kinetics were suitable for pretargeted tumor imaging.34 Hydrophilicity was crucial for fast clearance of unreacted Tzs from healthy tissues and excretion through kidneys and/or liver.34 Such Tzs are unsuitable for imaging of brain targets as their hydrophilicity prevents any reasonable BBB penetration. However, Tz uptake in peripheral organs is irrelevant for brain imaging contrast, because the brain is spatially separated from them. Therefore, we hypothesized that pretargeted imaging within the brain is possible with sufficient contrast using more lipophilic Tzs.
The aim of the present study was to explore the physicochemical parameters that influence the performance of Tzs for pretargeted brain imaging and apply this knowledge to develop a suitable imaging agent for this purpose (Fig. 1A). We decided to develop 18F-radiolabeled Tzs. First of all, fluorine-18 (18F) is widely considered to be the ideal PET radionuclide due to its convenient half-life (110 minutes), high positron branching ratio (97%) and short positron range in tissue (max. range 2.4 mm in H2O). These properties altogether result in high-resolution images with low patient radiation dose.1,2 Secondly, 18F can be produced on large scale in centralized facilities, and 18F-labeled radiopharmaceuticals consequently distributed for clinical use.35 Thirdly, introduction of 18F into the Tz scaffold can be used to fine-tune its reactivity, while the physiochemical properties of the fluorinated framework can be simultaneously manipulated with an extra handle (Fig. 1B).36,37
We have recently developed methods to prepare highly reactive Tzs labeled with fluorine-18.37–40 These methods were used to label all Tzs in this study. The respective development strategy is displayed in Fig. 1. In short, we designed and synthesized a panel of 18F-labeled Tzs guided by parameters reported to increase the chances to develop a successful tracer for brain imaging. Selection of the parameters was inspired by the BBB score – a parameter developed to identify brain-penetrating molecules.41 Subsequently, the Tz panel was subjected to in vitro and in vivo screening. Based on the results, a subset of Tzs was selected for final evaluation in a pretargeting model. In this model, rats were intracerebrally injected with a non-internalizing TCO-polymer. This polymer was then – in a second step – targeted by selected radiolabeled Tzs. We decided to use this invasive model as it allowed us to solely study the in vivo performance of the Tzs without challenges arising from a brain-targeting antibody, for example with respect to blood circulation, target engagement or metabolism. Obtained results were afterwards analyzed to identify possible relationships between the in vivo performance and physicochemical parameters of the Tzs. The aim of this work was to identify a Tz best suited for pretargeted brain imaging.
Results and discussion
Design of the tetrazine library
The development of brain imaging agents is often challenging. Good BBB permeability, acceptable non-displaceable binding and sufficient metabolic stability are only some of the criteria that must be met. Multiple trade-offs exist between parameters that influence these criteria. For example, high lipophilicity increases brain uptake of the tracer, but also its non-displaceable binding. Therefore, it is essential to balance these parameter values, i.e., identify the value that positively affects one criterion without disrupting another.42–46 Nowadays, many physicochemical parameters can simply be estimated from the chemical structure.42–46 These estimations can be used to calculate a variety of composite scores.47 The CNS MPO and BBB scores, for example, are based on parameters such as MW, numbers of H-bond donors/acceptors, clog![[thin space (1/6-em)]](https://www.rsc.org/images/entities/char_2009.gif) D7.4 or clogP. These scores can be used to estimate the probability of a certain structure to enter the brain and consequently be used as a brain tracer.41,45,48,49
D7.4 or clogP. These scores can be used to estimate the probability of a certain structure to enter the brain and consequently be used as a brain tracer.41,45,48,49
In this work, we carefully designed a set of 18 Tzs, which were predicted to be suitable brain imaging agents. According to their CNS MPO and BBB scores, they possessed a probability of >75% to enter the brain in sufficient amounts (Fig. 2).41,45 All designed Tzs were based on the 3-fluorophenyltetrazine scaffold. This scaffold ensures fast click reaction kinetics, can be labeled with fluorine-1837,38 and modified with an extra handle to manipulate the physicochemical properties of Tzs.37,39 Consequently, it is an ideal starting point to develop BBB penetrant Tzs for pretargeted imaging. Since previous studies have shown that addition of a single methyl group can dramatically affect the pharmacokinetics and distribution of CNS tracers, a homologation approach was employed by stepwise increasing the length/bulk of the chosen side chain within five preselected Tz motifs (groups) (Fig. 2).44,50,51 Linkers within those motifs were designed based on the possibility to synthesize them easily and on similarities to endogenous structures known to enter the brain.
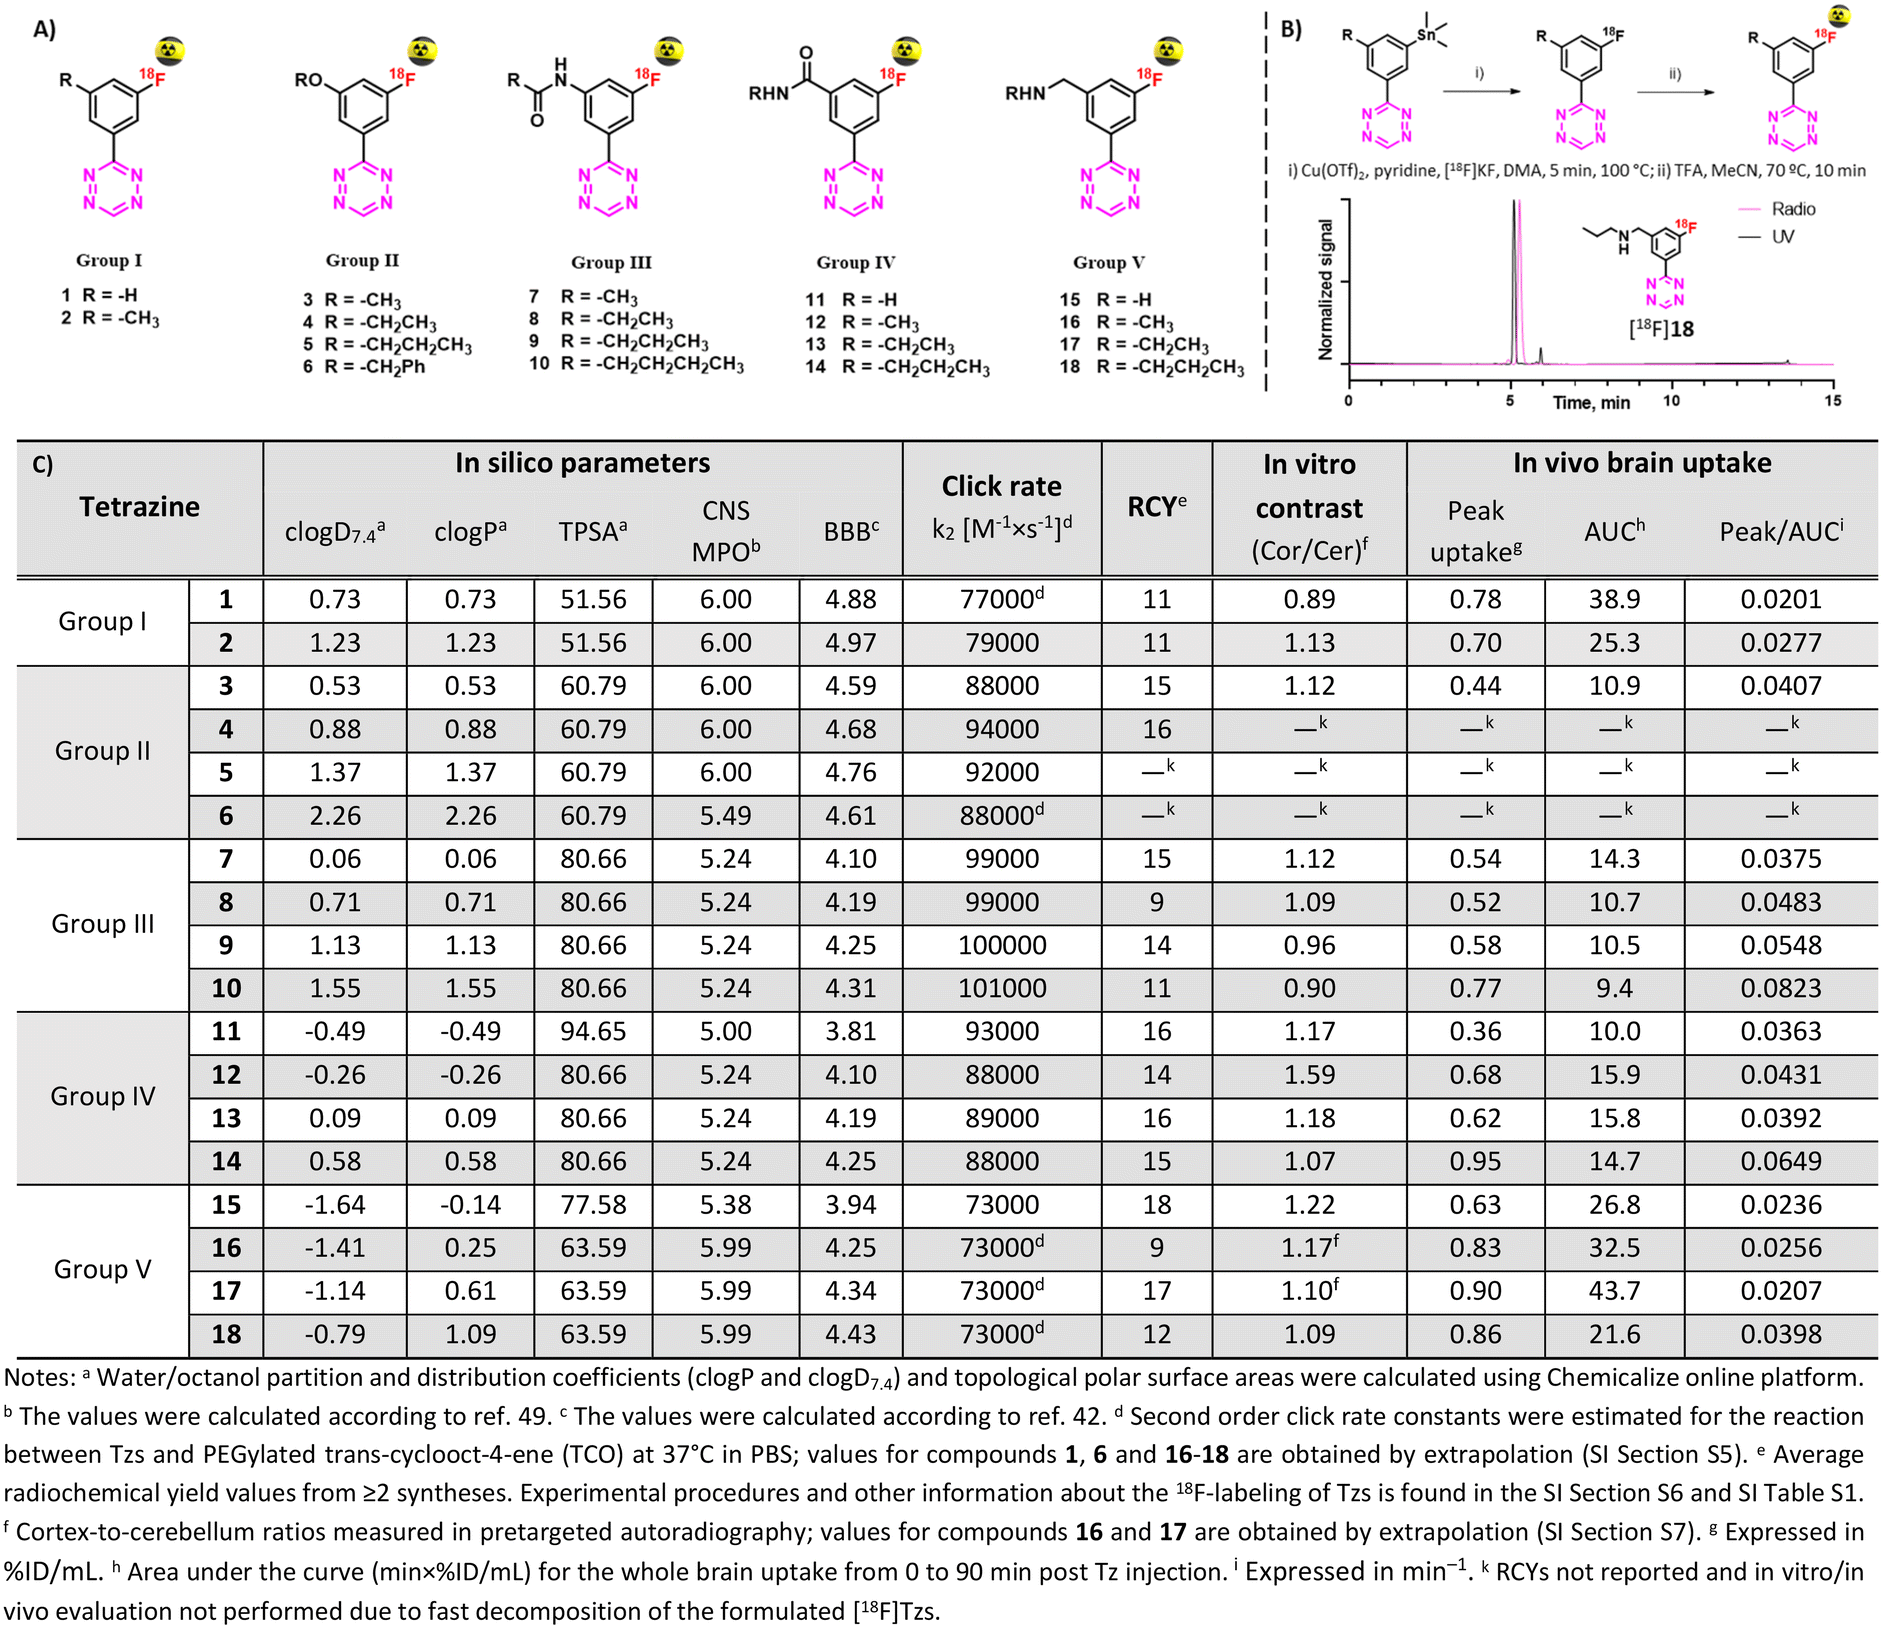 | ||
| Fig. 2 A) Designed Tz structures. B) Radiolabeling of Tzs [18F]1–18 and HPLC traces of [18F]18. C) In silico properties of Tzs along with key screening results. | ||
Synthesis and characterization of the tetrazine library
Reference 19F-Tzs were synthesized via a Pinner-like synthesis from nitriles which were either commercially available or synthesized in-house.52 Click rate constants (k2) were determined with TCO by pseudo-first-order measurements in DPBS at 37 °C by stopped-flow spectrophotometry (ESI† Section S5).38,53 All tested Tzs displayed rate constant (k2) values above 70000 M−1 × s−1 (Fig. 2). We have recently shown that such rate constants are strong indicators of high in vivo click performance of Tzs for pretargeting.34 Typical densities of brain targets are on the order of 100 nM,54 therefore the aforementioned rate constants will also be sufficient for pretargeted imaging beyond the BBB (ESI† Section S1).
Radiolabeling
Stannane precursors were synthesized as described above ending with palladium-catalyzed stannylation (ESI† Section S4). Cu-mediated 18F-fluorination succeeded using our previously reported method (Fig. 2B, ESI† Section S6).37 If necessary, protecting groups were quantitatively removed in a second step by acid hydrolysis. After purification, all products were formulated in ethanol/phosphate buffer (0.1 M, pH 7.4). Obtained radiochemical yields (RCYs) were on the order of 9–19% within a synthesis time of approx. 90 min. Molar activities (Am) were on the order of 70–210 GBq μmol−1, radiochemical purities (RCP) >92%. Stability studies revealed that all compounds – except for [18F]5 and [18F]6 – were stable for at least 2 hours. Because of the low stability, possibly caused by radiolysis, [18F]5 and [18F]6 were not evaluated in further experiments.Pretargeted autoradiography
Autoradiography allows to identify radioligands with suitable imaging contrast for further in vivo studies.55,56 As Tzs do not possess a native target within the brain, direct autoradiography cannot be carried out. Instead, we developed an autoradiography protocol based on pretargeting (Fig. 3A, ESI† Section S7). In short, brain slices from Tg-ArcSwe mice – a mouse strain with high content of beta-amyloid (Aβ) fibrils in the cortex57 – were first incubated with TCO-modified 3D6 (anti-Aβ) mAbs. Excess of mAbs was then washed away. In a second step, these slices were incubated with 18F-Tzs. The Tzs clicked subsequently to Aβ-bound TCO-3D6. This strategy enabled us to visualize the binding of the mAb to Aβ, but, more importantly, it also allowed us to study the binding properties of applied 18F-labeled Tzs (18F-Tzs) with respect to their specific and non-specific binding. In order to mimic the in vivo situation as close as possible, so called “no-wash” autoradiographic experiments were carried out.58 The uptake values in cortex (Cor, Aβ-rich region) and in cerebellum (Cer, Aβ-poor region, assumed to represent non-specific binding) were determined. Cor/Cer ratios were used to rank 18F-Tzs – the higher the ratio the better the contrast (Fig. 2 and 3). [18F]12 possessed the best ratio, whereas [18F]1 the worst (Fig. 3B). Cor/Cer ratios inversely correlated with clogP (ESI† Fig. S4) and showed – as expected – that more lipophilic Tzs possess a higher non-displaceable component.
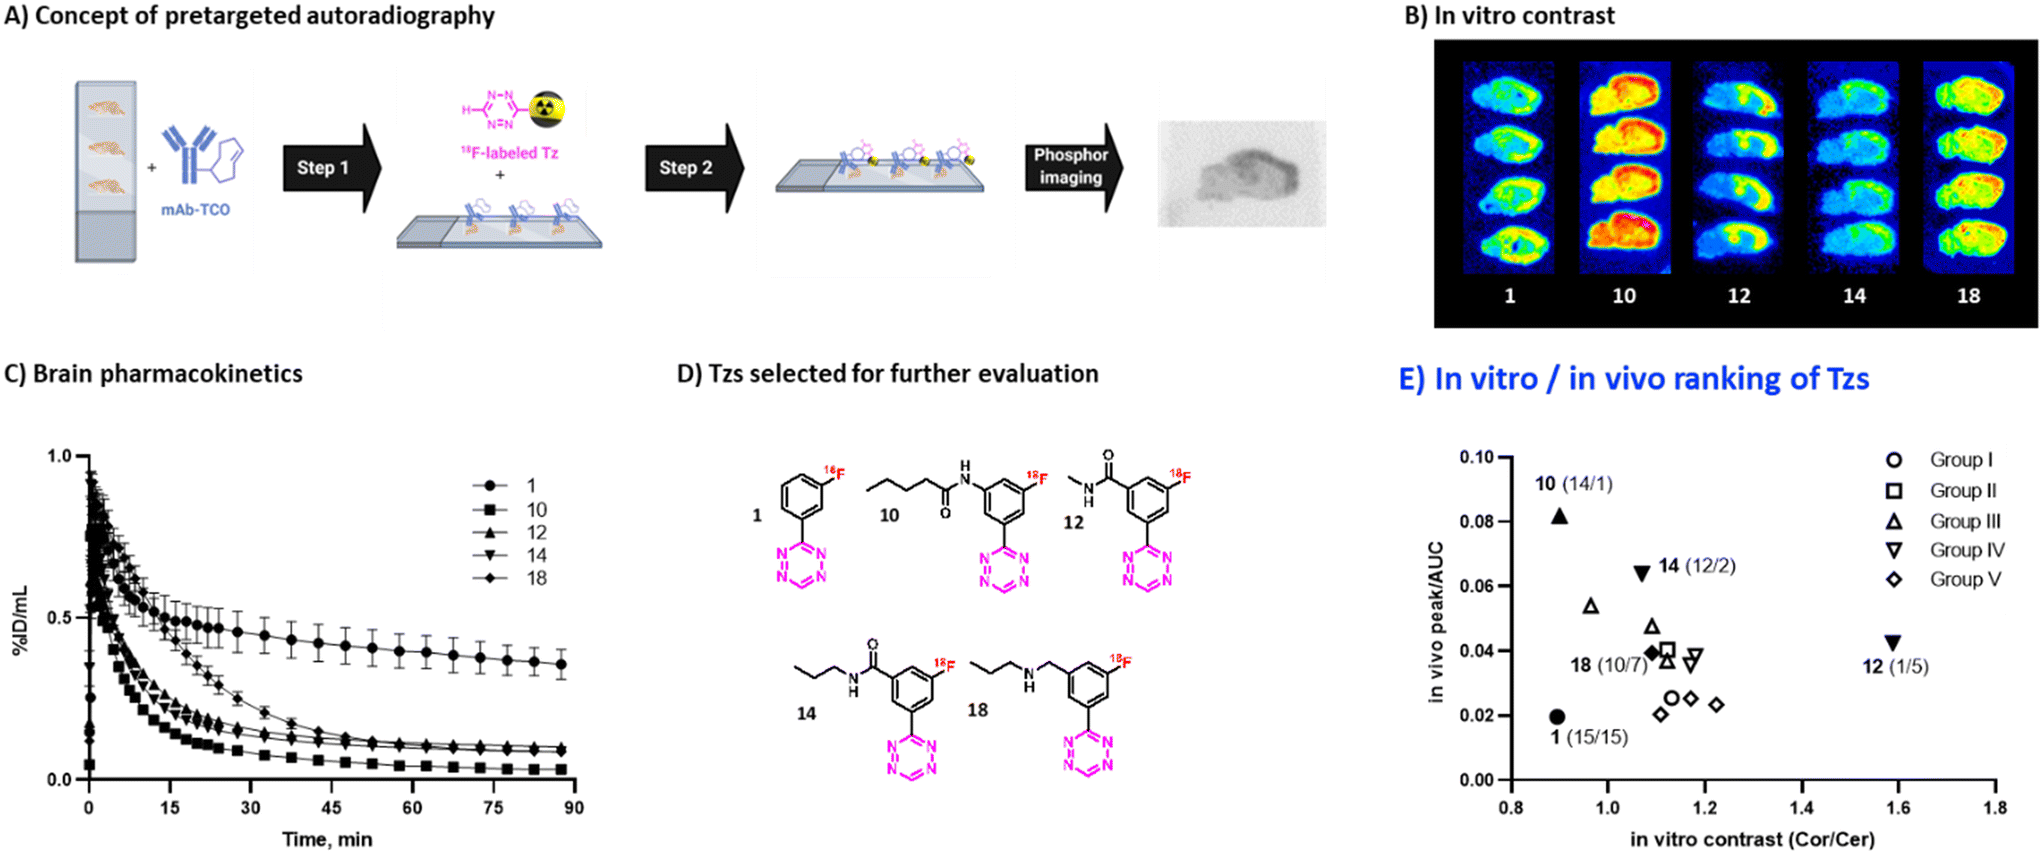 | ||
| Fig. 3 A) Workflow of pretargeted autoradiography. B) Pretargeted autoradiography images for selected Tzs. C) Brain time-activity curves for selected Tzs. D) Structures of Tzs selected for further evaluation. E) Ranking of evaluated Tzs by in vitro contrast and in vivo brain uptake kinetics. Tzs selected for further evaluation are marked with filled symbols, relative rankings (in vitro/in vivo) are shown in parentheses. In vitro contrast for [18F]18 was estimated by regression (see ESI† Section S7). | ||
Brain uptake
Hydrophilic Tzs result in the best in vitro contrast, whereas more lipophilic Tzs enter the brain better.59 To investigate this trade-off and identify a Tz that would provide an optimal combination of imaging contrast and brain uptake, we assessed the brain uptake and washout of all 18F-Tzs in vivo by dynamic PET scans in healthy Long–Evans rats (ESI† Section S8). Time activity curves (TACs) for the whole brain were expressed in % ID per mL tissue. We expected 18F-Tzs that show high peak brain uptake followed by fast washout to be best suited for pretargeted imaging. High initial uptake increases the possibility of the Tz to click to TCOs deposited in the brain, and fast washout decreases background levels. Consequently, Tzs with these properties should display high imaging contrast. We used the peak uptake as a measure of the brain uptake and the inverse area under the curve (1/AUC) as a measure for the washout. The uptake-washout index (equivalent to a ratio between peak uptake and AUC) was used to rank 18F-Tzs (Fig. 2). This value describes the interplay between high initial uptake and fast washout. The higher it is, the better the properties. Interestingly, peak/AUC ratios strongly correlated with clogP and clogD7.4 within the same Tz motif (ESI† Fig. S9). The most lipophilic Tzs from each class (2, 10, 14 and 18) displayed the best peak/AUC ratios.
Candidate selection for pretargeted imaging beyond the BBB
In order to select Tzs for pretargeted imaging, we plotted the in vitro Cor/Cer ratios against the in vivo peak/AUC ratios (Fig. 3E). An ideal Tz with high ranks both in vivo and in vitro would be found in the top right corner of the resulting plot. Such a Tz was not identified. Consequently, we decided to test the three most promising Tzs, namely, [18F]12, [18F]10 and [18F]14. In order to verify that our ranking model can predict the performance of 18F-Tzs in pretargeted brain imaging, we also selected the lowest-ranking Tz [18F]1 and the middle-ranking Tz [18F]18 for testing. Thus, Tzs from 4 out of 5 Tz groups were tested in pretargeted imaging.Pretargeted imaging beyond the BBB
To evaluate the in vivo click performance of our Tzs, we used an invasive model based on intracerebral injection of a TCO-functionalized polymer (Fig. 4A). As mentioned beforehand, this model circumvents challenges that arise when administering a targeting vector systemically. For example, intracerebral injection does not create a large pool of blood circulating vector which reacts with administered Tz and prevents a significant fraction of it from reaching the brain.60 A detailed description of the model and its validation is reported in ESI† Section S9. In brief, Long–Evans rats were injected with TCO-decorated PeptoBrush (100 μg polymer, 15 nmol TCO in 4 μL of 10 mM phosphate buffered saline at pH 7.2) into the right striatum. This polymer has been shown to be non-internalizing, so challenges of extra diffusion barriers for Tzs and intracellular degradation of TCOs are not present.61 Moreover, in rodent plasma, which is similar in composition to interstitial fluid of the brain, at least 50% of the TCOs were stable for 24 h.61 Retention of PeptoBrush in the striatum was confirmed by SPECT/CT imaging using polymer batch labeled with indium-111 to high specific activity (290 MBq × mg−1, Fig. 4B). Restoration of the BBB integrity 18 h after polymer injection was confirmed by MRI imaging with the gadolinium-based contrast agent ProHance (ESI† Fig. S12).62 To quantify the retention of TCO-PeptoBrush at the injection site, the polymer was 111In-labeled to low specific activity (100–200 kBq × mg−1). 20–24 h after TCO-polymer injection, rats were injected with 18F-Tzs (10–30 MBq, 0.3–1.3 nmol) into the lateral tail vein and scanned in a PET scanner for 90 min. Radioactivity uptake in the right striatum was compared with the uptake in the left (polymer-free) striatum. After the scan, rats were sacrificed, their brains dissected into right and left hemispheres and gamma-counted 24 h later to measure the 111In-counts after the decay of 18F. On average, 49.4 ± 8.7% (n = 14) of the injected 111In-activity was found in the injected brain hemisphere, while only 0.5 ± 0.2% (n = 14) was found in the control hemisphere, indicating good and consistent retention of the TCO-polymer (ESI† Fig. S13). It is not known whether the observed loss of 111In-activity from the injection site reflects de-chelation of 111In or washout of the TCO-polymer. However, activity loss from the injection site was spread throughout the whole body. Therefore, local TCO concentration in the striatum was >1000-fold higher than elsewhere in the body and amounted to ≈92 μM assuming striatal volume of 40 μL per side,63 50% polymer loss and 50% TCO isomerization after 24 h.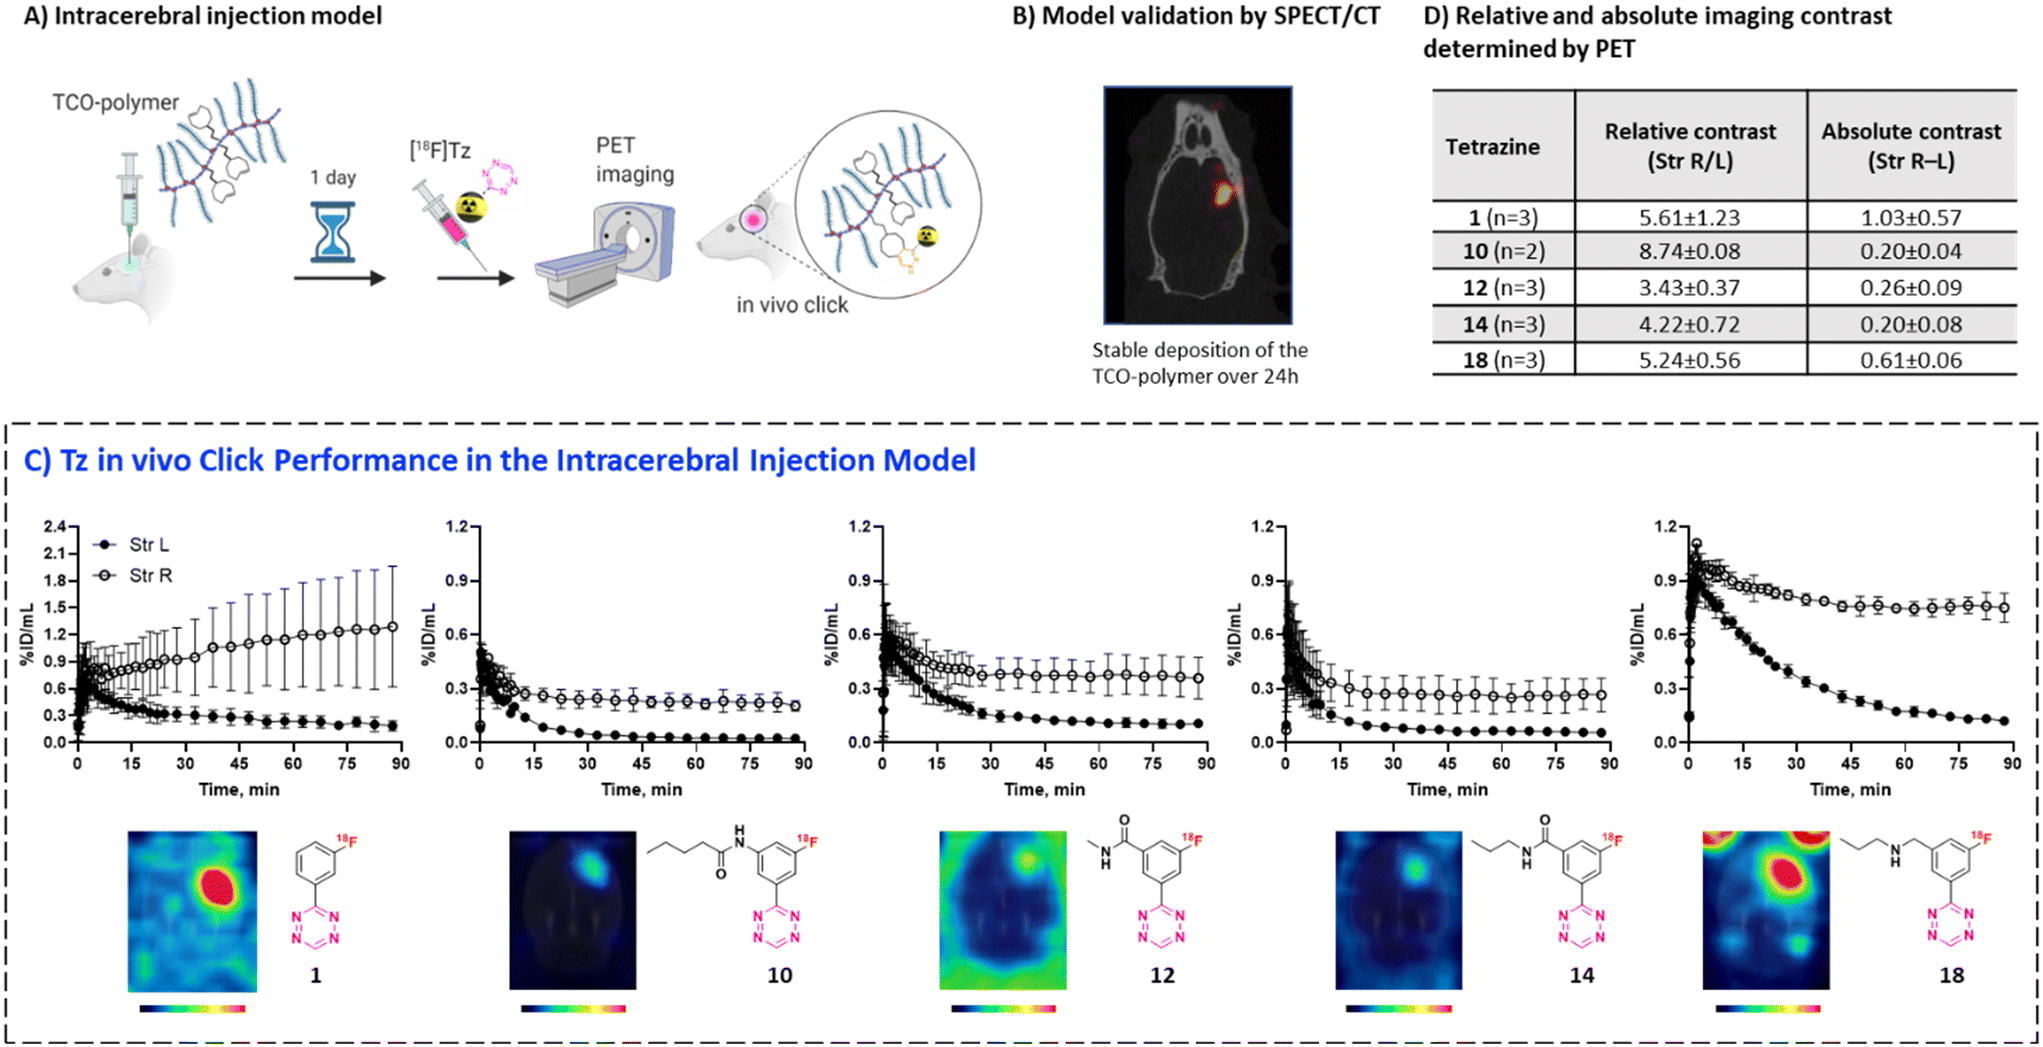 | ||
| Fig. 4 A) Intracerebral TCO-polymer injection model B) confirmation of TCO-polymer retention by SPECT/CT C) averaged TACs and representative PET images showing in vivo uptake of 18F-Tzs in the left (TCO-injected) and right (TCO-free) striata. D) Absolute and relative contrast between left and right striatum for selected Tzs. PET images and contrast measurements are based on average 18F-activity uptake at 60–90 min post-injection. | ||
Preferential 18F-uptake in the TCO-polymer pre-injected striatum was clearly visible for all investigated Tzs, both on summed images as well as on registered TACs (Fig. 4C). We ranked 18F-Tzs in terms of their absolute and relative imaging contrast (Fig. 4D). Relative imaging contrast was defined as the ratio between 18F-uptake in the TCO-polymer injected vs. the polymer-free striatum, while the absolute contrast was defined as the difference between the uptake values, expressed in % ID per mL. The best relative contrast was observed for [18F]10, the best absolute contrast for [18F]1. These results are not expected from our prediction model displayed in Fig. 3E. For example, [18F]1 was suggested to be the least promising compound whereas good in vivo click performance was observed in pretargeted experiments. Although the absolute contrast for [18F]1 was high and appeared to be still growing at 90 min after Tz injection, the uptake in the polymer-injected striatum had a huge variation from scan to scan, which raises concerns for quantitative analysis and inter-subject comparison if [18F]1 is used for pretargeted imaging. Tz [18F]18 showed absolute and relative contrast comparable to [18F]1, but the respective values were much more robust. Therefore, we consider [18F]18 our prime candidate to be used in further studies.
Metabolism
Metabolic stability is another important factor that influences the ability of Tzs to reach their targets in the brain and ligate to them in vivo.34,42,64 We decided therefore to determine the in vivo metabolism profile of our selected Tz tracers (Fig. 5A and B). Tzs [18F]14 and [18F]10 were the least stable: intact tracer comprised <5% plasma activity at 90 minutes post-injection (Fig. 5A). [18F]12 and [18F]1 showed the best stability (50% of intact tracer), while [18F]18 displayed an intermediate metabolism rate – approx. 30% intact tracer. All detected radiometabolites were much more hydrophilic than the parent (ESI† Fig. S15), indicating that these radiometabolites do not contribute to the brain activity as they are unlikely to pass the BBB. In general, rapid metabolism appeared to strongly influence the brain uptake of the studied Tzs, mainly due to less intact 18F-Tz being available to diffuse into the brain (Fig. 5B). Metabolic stability of Tz correlated with brain AUC (r 0.78, ESI† Fig. S16). The continued growth of [18F]1 uptake in the polymer-injected striatum 90 min after injection could be caused by continued influx of unmetabolized [18F]1 into that striatum, where it reacts with TCOs.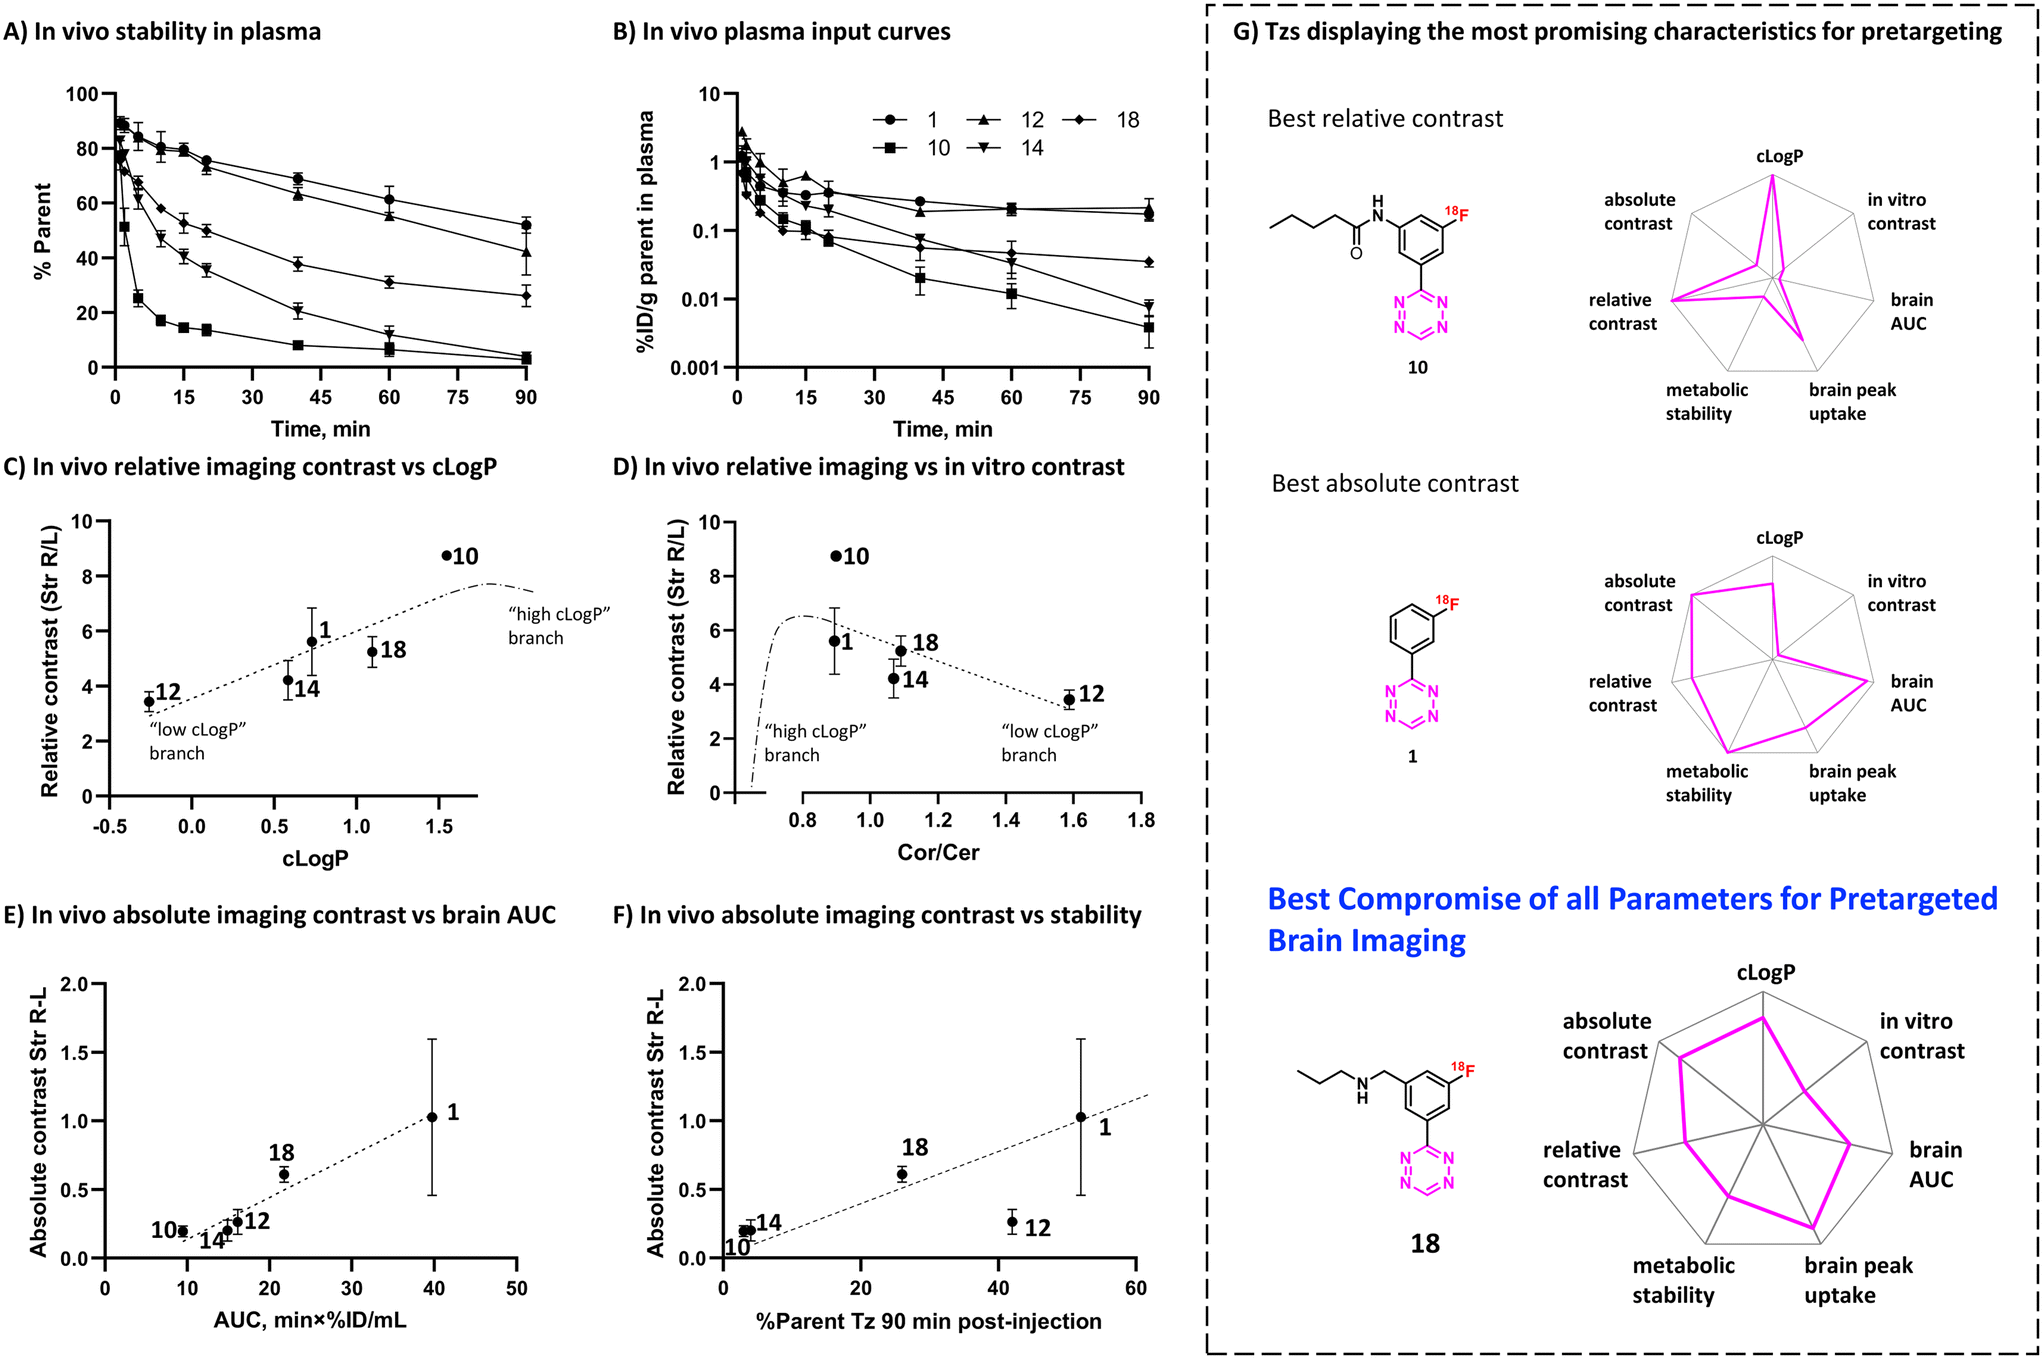 | ||
| Fig. 5 A) In vivo metabolic stability of selected Tzs in rat plasma B) metabolite-corrected arterial plasma input curves for selected Tzs. C and D) Correlation of relative imaging contrast with clogP and in vitro contrast, respectively. Dash-dot lines represent putative non-monotonous relationships for highly lipophilic Tzs, E) correlation of absolute imaging contrast with in vivo brain AUC, F) correlation of absolute imaging contrast with in vivo metabolic stability of 18F-Tzs. Dashed line represents putative trend without 12. G) Summary rankings of Tzs displaying the most promising characteristics for pretargeting beyond the BBB. Rankings are relative to other Tzs. [18F]18 was identified to possess the best parameters. | ||
Both intact Tzs and their metabolites are eventually excreted through kidneys (renal clearance) or liver (hepatobiliary clearance). Examination of dynamic PET scans showed quick accumulation of radioactivity in the urinary bladder for all Tzs except [18F]1 (Fig. S10†). Presumably, bladder uptake represented mostly radiometabolites for [18F]14 and [18F]10 and mostly intact Tz for [18F]12. For [18F]18, radioactivity uptake in both bladder and liver increased rapidly, signifying greater preference for hepatobiliary clearance. [18F]1 showed slow clearance via both pathways. PET data for other Tzs confirmed the slow clearance of [18F]1 and showed that more hydrophilic tetrazines tended to have high radioactivity accumulation in the bladder, while for more lipophilic ones, radioactivity accumulated primarily in the liver and intestines (Fig. S11†).
The in vivo click performance
In order to explain the observed in vivo click performance, we examined our data from in silico calculations, pretargeted autoradiography, in vivo brain uptake and metabolism studies. Relative in vivo imaging contrast showed positive correlation with clogP (r 0.88, Fig. 5C), but negative correlation with in vitro contrast from pretargeted autoradiography experiments (Cor/Cer ratio, r −0.67, Fig. 5D). This finding appears contradictory: the lower the in vitro contrast, the higher the in vivo contrast. We propose a speculative explanation for this finding, which implies the existence of a threshold clogP value, at which the trends for both in vitro and in vivo contrast should have a turning point (see ESI† Section S1). If the clogP values of the tested Tzs had been on both sides from this threshold value, we would have observed non-monotonous trends in both Fig. 5C and D. Independently of that, in vitro Cor/Cer ratios could not be used as an intuitive predictor of in vivo click performance.
Our initial assumption that in vivo click performance would positively correlate with the brain uptake-washout index of the Tzs – as determined by the peak/AUC ratios – was not confirmed (Fig. S14A and B†). However, AUC values (representing cumulative brain uptake) showed strong positive correlation with absolute imaging contrast (r 0.99, Fig. 5E). Absolute imaging contrast also strongly correlated with the BBB and CNS MPO scores, both of which are predictors of brain uptake (r 0.91–0.93, Fig. S14D and F†). Interestingly, absolute imaging contrast appeared to correlate with the metabolic stability for all 18F-Tzs except for [18F]12 (Fig. 5F). Rapid metabolism should result in less tracer being available to enter the brain from the blood, which can explain the low absolute imaging contrast of [18F]14 and [18F]10. Both tracers were rapidly metabolized (Fig. 5A and B). In contrast, [18F]18 and [18F]1 displayed slower metabolism and consequently, higher absolute imaging contrast (Fig. 5A, B and F). However, absolute imaging contrast of [18F]12 was not aligned with this trend. Its slow metabolism did not result in a high absolute imaging contrast (Fig. 5F). Apparently, the relatively low brain penetration of [18F]12, visible from its AUC (Fig. 5E) and possibly stemming from its low clogP (Fig. 2), turned out to be the determining factor for its click performance.
Our results indicate that fast Tz washout is not necessarily required for successful pretargeted brain imaging (Fig. 3E and 4C). Conversely, high cumulative brain uptake and slow metabolism seem important for good imaging contrast, as more Tz can enter the brain and click to TCOs (Fig. 5E and F).
Conclusion
We investigated structure–activity relationships of a library of 18 different 18F-Tzs, their in vitro imaging contrast and in vivo brain pharmacokinetics to predict their in vivo click performance on targets beyond the BBB. Although we did not identify any single decisive parameter with a clear-cut relationship to pretargeted imaging contrast, slow metabolism as well as high lipophilicity appear to be beneficial for high brain uptake. Of the evaluated Tzs, [18F]18 showed the best imaging properties. High brain uptake combined with intermediate metabolic stability and good imaging contrast are the key properties of this tracer to be our prime candidate for further pretargeted imaging studies beyond the BBB (Fig. 5G). In the next step, we will design BBB penetrating and TCO-modified mAbs that can be targeted and imaged with [18F]18. TCO-mAbs with TCO isomerization half-lives over 4 days are already known, which allows long experiments.65 We believe that this approach ultimately will enable pretargeted imaging of brain targets, such as pathological protein isoforms and oligomers. These proteins are valuable drug targets for several neurodegenerative diseases and can currently not be imaged. Imaging would make it possible to diagnose these diseases, distinguish responders from non-responders or to monitor treatment. Consequently, imaging will provide valuable information to accelerate drug development and greatly benefit patient care.Ethical statement
All animal procedures were performed in accordance with the European Commission's Directive 2010/63/EU for animal research and approved by the Danish Council for Animal Ethics (license numbers 2017-15-0201-01283 and 2017-15-0201-01375) together with the Department of Experimental Medicine, University of Copenhagen.Author contributions
VS and SLB contributed equally. MMH and UMB conceived the study. Tz structures were designed by UMB. Organic syntheses were performed by UMB and RGV. Kinetic measurements were determined by BH and HM. Radiosyntheses were carried by RGV and VS. The pretargeted autoradiography protocol was designed by VS and SLB. In vitro screening of [18F]Tzs was conducted by SLB. In vivo PET experiments in rats were performed by IVA, NRR, NB and VS. Gadolinium MRI experiments were carried out by NRR, MP and YM. PeptoBrushes were designed by MB and synthesized by GS. In vivo and ex vivo data was analyzed by VS, SLB, IVA, SS, MN and GMK. Radiometabolite experiments were performed by IVA and VS. Manuscript was drafted by VS, UMB, RGV, NRR and SLB. VS, UMB and MMH edited the manuscript with critical feedback from all authors. All authors read and approved the final manuscript. MMH and UMB are the corresponding authors.Conflicts of interest
There are no conflicts to declare.Acknowledgements
This project has received funding from the European Union's EU Framework Programme for Research and Innovation Horizon 2020, under grant agreement no. 668532. MMH has received funding from the European Union's EU Framework Programme for Research and Innovation Horizon 2020 (grant agreement no. 670261). VS was supported by BRIDGE – Translational Excellence Programme at the Faculty of Health and Medical Sciences, University of Copenhagen, funded by the Novo Nordisk Foundation (grant agreement no. NNF18SA0034956). The Lundbeck Foundation (grant agreement no. R303-2018-3567), the Innovation Fund Denmark, and the Research Council for Independent Research (grant agreement no. 8022-00187B) are further acknowledged. We would like to further acknowledge Mohamed El Fakiri and Nawal Ayada Amgar for their help in analyzing the PET data.References
- P. E. Edem and E. J. L. Stéen, Late-Stage Fluorination of Bioactive Molecules and Biologically-Relevant Substrates, Elsevier, Copenhagen, 1st edn, 2018 Search PubMed.
- J. L. Kristensen and M. M. Herth, Textbook of drug design and discovery, CRC press, London and New York, 5th edn, 2017 Search PubMed.
- M. Piel, I. Vernaleken and F. Rösch, J. Med. Chem., 2014, 57, 9232–9258 CrossRef CAS.
- S. M. Ametamey, M. Honer and P. A. Schubiger, Chem. Rev., 2008, 108, 1501–1516 CrossRef CAS PubMed.
- B. Theek, L. Y. Rizzo, J. Ehling, F. Kiessling and T. Lammers, Clin. Transl. Imaging, 2014, 2, 67–76 CrossRef.
- A. J. Stoessl, Transl. Neurodegener., 2012, 1, 5 CrossRef.
- M. J. Armstrong and M. S. Okun, JAMA, J. Am. Med. Assoc., 2020, 323, 548–560 CrossRef.
- J. S. Lewis, A. D. Windhorst and B. M. Zeglis, Radiopharmaceutical Chemistry, Springer, 2019 Search PubMed.
- K. He, S. Zeng and L. Qian, J. Pharm. Anal., 2020, 10, 397–413 CrossRef PubMed.
- N. Dammes and D. Peer, Theranostics, 2020, 10, 938–955 CrossRef CAS.
- D. Psimadas, V. Valotassiou, S. Alexiou, I. Tsougos and P. Georgoulias, Cancer Invest., 2018, 36, 118–128 CrossRef CAS.
- O. C. Boerman and W. J. Oyen, J. Nucl. Med., 2011, 52, 1171–1172 CrossRef PubMed.
- D. Sehlin, X. T. Fang, L. Cato, G. Antoni, L. Lannfelt and S. Syvänen, Nat. Commun., 2016, 7, 10759 CrossRef CAS PubMed.
- G. Hultqvist, S. Syvänen, X. T. Fang, L. Lannfelt and D. Sehlin, Theranostics, 2017, 7, 308–318 CrossRef CAS.
- N. A. Lapin, K. Gill, B. R. Shah and R. Chopra, Sci. Rep., 2020, 10, 16546 CrossRef CAS.
- S. Syvänen, X. T. Fang, G. Hultqvist, S. R. Meier, L. Lannfelt and D. Sehlin, NeuroImage, 2017, 148, 55–63 CrossRef.
- P. Smith, N. Ogrodnik, J. Satkunarajah and M. A. O'Reilly, Sci. Rep., 2021, 11, 4412 CrossRef CAS.
- Y. Meng, M. Reilly Raymond, C. Pezo Rossanna, M. Trudeau, A. Sahgal, A. Singnurkar, J. Perry, S. Myrehaug, B. Pople Christopher, B. Davidson, M. Llinas, C. Hyen, Y. Huang, C. Hamani, S. Suppiah, K. Hynynen and N. Lipsman, Sci. Transl. Med., 2021, 13, eabj4011 CrossRef CAS PubMed.
- F. C. J. van de Watering, M. Rijpkema, L. Perk, U. Brinkmann, W. J. G. Oyen and O. C. Boerman, BioMed Res. Int., 2014, 2014, 203601 Search PubMed.
- K. Poels, M. Schreurs, M. Jansen, D. J. Vugts, T. T. P. Seijkens, G. A. M. S. van Dongen, E. Lutgens and W. Beaino, Biology, 2022, 11, 408 CrossRef CAS PubMed.
- V. V. Belov, A. A. Bonab, A. J. Fischman, M. Heartlein, P. Calias and M. I. Papisov, Mol. Pharmaceutics, 2011, 8, 736–747 CrossRef CAS.
- E. J. L. Stéen, P. E. Edem, K. Nørregaard, J. T. Jørgensen, V. Shalgunov, A. Kjaer and M. M. Herth, Biomaterials, 2018, 179, 209–245 CrossRef.
- R. M. Versteegen, R. Rossin, W. ten Hoeve, H. M. Janssen and M. S. Robillard, Angew. Chem., Int. Ed., 2013, 52, 14112–14116 CrossRef CAS PubMed.
- R. M. Versteegen, W. Ten Hoeve, R. Rossin, M. A. de Geus, H. M. Janssen and M. S. Robillard, Angew. Chem., Int. Ed., 2018, 57, 10494–10499 CrossRef CAS.
- R. Rossin, P. R. Verkerk, S. M. van den Bosch, R. C. Vulders, I. Verel, J. Lub and M. S. Robillard, Angew. Chem., Int. Ed., 2010, 49, 3375–3378 CrossRef CAS.
- L. Carroll, H. L. Evans, E. O. Aboagye and A. C. Spivey, Org. Biomol. Chem., 2013, 11, 5772–5781 RSC.
- B. L. Oliveira, Z. Guo and G. J. L. Bernardes, Chem. Soc. Rev., 2017, 46, 4895–4950 RSC.
- M. L. Blackman, M. Royzen and J. M. Fox, J. Am. Chem. Soc., 2008, 130, 13518–13519 CrossRef CAS PubMed.
- L. Wyffels, D. Thomae, A. M. Waldron, J. Fissers, S. Dedeurwaerdere, P. Van der Veken, J. Joossens, S. Stroobants, K. Augustyns and S. Staelens, Nucl. Med. Biol., 2014, 41, 513–523 CrossRef CAS PubMed.
- C. B. M. Poulie, J. T. Jørgensen, V. Shalgunov, G. Kougioumtzoglou, T. E. Jeppesen, A. Kjaer and M. M. Herth, Molecules, 2021, 26, 544 CrossRef CAS PubMed.
- S. Srinivasan, N. A. Yee, K. Wu, M. Zakharian, A. Mahmoodi, M. Royzen and J. M. Mejía Oneto, Adv. Ther., 2021, 4, 2000243 CrossRef CAS.
- M. Staudt, M. M. Herth and C. B. Poulie, in Theranostics-An Old Concept in New Clothing, IntechOpen, 2021 Search PubMed.
- J. C. T. Carlson, H. Mikula and R. Weissleder, J. Am. Chem. Soc., 2018, 140, 3603–3612 CrossRef CAS PubMed.
- E. J. L. Steen, J. T. Jorgensen, C. Denk, U. M. Battisti, K. Norregaard, P. E. Edem, K. Bratteby, V. Shalgunov, M. Wilkovitsch, D. Svatunek, C. B. M. Poulie, L. Hvass, M. Simon, T. Wanek, R. Rossin, M. Robillard, J. L. Kristensen, H. Mikula, A. Kjaer and M. M. Herth, ACS Pharmacol. Transl. Sci., 2021, 4, 824–833 CrossRef CAS.
- D. Le Bars, J. Fluorine Chem., 2006, 127, 1488–1493 CrossRef CAS.
- U. M. Battisti, R. Garcia-Vazquez, D. Svatunek, B. Herrmann, A. Loffler, H. Mikula and M. M. Herth, Bioconjugate Chem., 2022, 33, 608–624 CrossRef CAS.
- R. Garcia-Vazquez, U. M. Battisti, J. T. Jorgensen, V. Shalgunov, L. Hvass, D. L. Stares, I. N. Petersen, F. Crestey, A. Loffler, D. Svatunek, J. L. Kristensen, H. Mikula, A. Kjaer and M. M. Herth, Chem. Sci., 2021, 12, 11668–11675 RSC.
- U. M. Battisti, K. Bratteby, J. T. Jorgensen, L. Hvass, V. Shalgunov, H. Mikula, A. Kjaer and M. M. Herth, J. Med. Chem., 2021, 64, 15297–15312 CrossRef CAS PubMed.
- R. García-Vázquez, J. T. Jørgensen, K. E. Bratteby, V. Shalgunov, L. Hvass, M. M. Herth, A. Kjær and U. M. Battisti, Pharmaceuticals, 2022, 15, 245 CrossRef PubMed.
- K. Bratteby, V. Shalgunov, U. M. Battisti, I. N. Petersen, S. L. van den Broek, T. Ohlsson, N. Gillings, M. Erlandsson and M. M. Herth, ACS Pharmacol. Transl. Sci., 2021, 4, 1556–1566 CrossRef CAS PubMed.
- M. Gupta, H. J. Lee, C. J. Barden and D. F. Weaver, J. Med. Chem., 2019, 62, 9824–9836 CrossRef CAS PubMed.
- V. W. Pike, Trends Pharmacol. Sci., 2009, 30, 431–440 CrossRef CAS.
- M. Laruelle, M. Slifstein and Y. Huang, Mol. Imaging Biol., 2003, 5, 363–375 CrossRef.
- G. C. Van de Bittner, E. L. Ricq and J. M. Hooker, Acc. Chem. Res., 2014, 47, 3127–3134 CrossRef CAS.
- L. Zhang and A. Villalobos, EJNMMI Radiopharm. Chem., 2016, 1, 13 CrossRef PubMed.
- E. T. L'Estrade, H. D. Hansen, M. Erlandsson, T. G. Ohlsson, G. M. Knudsen and M. M. Herth, ACS Chem. Neurosci., 2018, 9, 1226–1229 CrossRef.
- E. J. L. Stéen, D. J. Vugts and A. D. Windhorst, Front. Nucl. Med., 2022, 2, 853475 CrossRef.
- T. T. Wager, X. Hou, P. R. Verhoest and A. Villalobos, ACS Chem. Neurosci., 2016, 7, 767–775 CrossRef CAS PubMed.
- T. T. Wager, X. Hou, P. R. Verhoest and A. Villalobos, ACS Chem. Neurosci., 2010, 1, 435–449 CrossRef CAS.
- Y. J. Seo, Y. Kang, L. Muench, A. Reid, S. Caesar, L. Jean, F. Wagner, E. Holson, S. J. Haggarty, P. Weiss, P. King, P. Carter, N. D. Volkow, J. S. Fowler, J. M. Hooker and S. W. Kim, ACS Chem. Neurosci., 2014, 5, 588–596 CrossRef CAS.
- C. Wang, F. A. Schroeder, H.-Y. Wey, R. Borra, F. F. Wagner, S. Reis, S. W. Kim, E. B. Holson, S. J. Haggarty and J. M. Hooker, J. Med. Chem., 2014, 57, 7999–8009 CrossRef CAS.
- Y. Qu, F.-X. Sauvage, G. Clavier, F. Miomandre and P. Audebert, Angew. Chem., Int. Ed., 2018, 57, 12057–12061 CrossRef CAS.
- D. Svatunek, C. Denk, V. Rosecker, B. Sohr, C. Hametner, G. Allmaier, J. Fröhlich and H. Mikula, Monatsh. Chem., 2016, 147, 579–585 CrossRef CAS PubMed.
- E. T. L'Estrade, M. Erlandsson, F. G. Edgar, T. Ohlsson, G. M. Knudsen and M. M. Herth, Neuropharmacology, 2020, 172, 107830 CrossRef.
- N. R. Raval, A. Johansen, L. L. Donovan, N. F. Ros, B. Ozenne, H. D. Hansen and G. M. Knudsen, Int. J. Mol. Sci., 2021, 22, 835 CrossRef CAS PubMed.
- N. Griem-Krey, A. B. Klein, M. Herth and P. Wellendorph, J. Visualized Exp., 2019, e58879 CAS.
- S. Lillehaug, G. H. Syverstad, L. N. Nilsson, J. G. Bjaalie, T. B. Leergaard and R. Torp, Neurobiol. Aging, 2014, 35, 556–564 CrossRef CAS.
- S. Patel, T. Hamill, E. Hostetler, H. D. Burns and R. E. Gibson, Mol. Imaging Biol., 2003, 5, 65–71 CrossRef PubMed.
- W. M. Pardridge, Drug Discovery Today, 2007, 12, 54–61 CrossRef CAS PubMed.
- N. R. Raval, A. Nasser, C. A. Madsen, N. Beschorner, E. E. Beaman, M. Juhl, S. Lehel, M. Palner, C. Svarer, P. Plavén-Sigray, L. M. Jørgensen and G. M. Knudsen, bioRxiv, 2022, preprint, DOI:10.1101/2021.12.31.473908.
- E. J. L. Stéen, J. T. Jørgensen, K. Johann, K. Nørregaard, B. Sohr, D. Svatunek, A. Birke, V. Shalgunov, P. E. Edem, R. Rossin, C. Seidl, F. Schmid, M. S. Robillard, J. L. Kristensen, H. Mikula, M. Barz, A. Kjær and M. M. Herth, ACS Nano, 2020, 14, 568–584 CrossRef.
- S. Danjo, Y. Ishihara, M. Watanabe, Y. Nakamura and K. Itoh, Brain Res., 2013, 1530, 44–53 CrossRef CAS PubMed.
- D. Goerzen, C. Fowler, G. A. Devenyi, J. Germann, D. Madularu, M. M. Chakravarty and J. Near, Sci. Rep., 2020, 10, 6952 CrossRef CAS PubMed.
- S. Otaru, H. Niemikoski, M. Sarparanta and A. J. Airaksinen, Mol. Pharmaceutics, 2020, 17, 3106–3115 CrossRef CAS.
- R. Rossin, S. M. van Duijnhoven, T. Lappchen, S. M. van den Bosch and M. S. Robillard, Mol. Pharmaceutics, 2014, 11, 3090–3096 CrossRef CAS PubMed.
Footnotes |
| † Electronic supplementary information (ESI) available: ESI discussion, description of organic synthesis, measurement of click rate constants of Tzs, radiolabeling protocols, protocols for in vitro autoradiography and in vivo PET scans, in vivo radiometabolite analysis, examples of analytical HPLC and radio-HPLC traces, and NMR spectra. See DOI: https://doi.org/10.1039/d2md00360k |
| ‡ These authors contributed equally. |
| This journal is © The Royal Society of Chemistry 2023 |