 Open Access Article
Fabrication and characterization of conductive electrospun nanofiber mats of carbon nanofiber/poly(vinyl alcohol)/poly(lactic acid) ternary nanocomposites for flexible electronics applications
Victor K
Sharma†
 a,
Gourhari
Chakraborty
b,
Soundararajan
Narendren
a and
Vimal
Katiyar
 *a
*a
aDepartment of Chemical Engineering, Indian Institute of Technology Guwahati, North Guwahati, Assam 781039, India. E-mail: vkatiyar@iitg.ac.in
bDepartment of Chemical Engineering, National Institute of Technology Andhra Pradesh, Andhra Pradesh 534101, India
First published on 6th November 2023
Abstract
Structural flexibility, high electrical conductivity, and biodegradability are some of the desired electrode properties required in electrode materials for various biomedical, biofuel cell, and flexible electronics applications. In this study, biodegradable polyvinyl alcohol (PVA) was covalently grafted onto surface-modified carbon nanofibers (mCFs) to form a highly conductive nanocomposite (PVA/mCF). This PVA/mCF nanocomposite was electrospun (PVA/mCF@PLA-es) or dip-coated (PVA/mCF@PLA) on neat polylactic acid (PLA) electrospun nanofiber mats to fabricate non-woven, flexible, and conductive nanofiber mats. The surface impedance of the PVA/mCF nanocomposite was reduced by 106 times compared to that of the neat polymer with no noticeable capacitance. Fourier transform infrared (FTIR) spectroscopy, Raman spectroscopy, X-Ray diffraction (XRD), and electron microscopy studies demonstrated evidence for successful surface modification of carbon nanofibers and covalent grafting of PVA. Thermogravimetric analysis (TGA) and contact angle studies also demonstrated improved thermal stability and wettability. Because of the excellent structural flexibility, high electrical conductivity, and biodegradability of PVA/mCF@PLA nanofiber mats, they could be used in biofuel cell electrodes, biomedical devices, and wearable electronics applications.
1 Introduction
Due to their diverse applications, conformability, and structural flexibility, flexible electronics have garnered ample attention from academic and industrial communities.1–5 Flexible electronics encompass many applications, including wearable electronic devices, medical implants, flexible solar cells, flexible displays, thin film transistors, and flexible electrodes, and other applications involving energy storage, healthcare, and defense.6–8 By the end of 2029, the commercial flexible electronics market globally is expected to surpass $77 billion at a compound annual growth rate of 8.5%.9 The obvious choice of materials for achieving high electrical conductivity is metals. However, metals lack structural flexibility and thus are a poor choice for flexible electronics applications. Alternatives like transparent conductive metal oxides10 and intrinsic conducting polymers11 have also been studied exhaustively. Inherent challenges with metal oxides are that they are not structural materials and must be deposited on another substrate like glass or a polymer. Polymers with intrinsic conductivity, such as polyaniline, find common use in constructing gas sensors, supercapacitors, membranes, and fuel cell electrodes, as well as in applications like water purifiers and actuators.12 Some polymers with conductivity possess acidic dopants and can potentially undermine the stability of the electronic apparatus in which they are employed.13 For applications like medical implants14 and microbial fuel cell electrodes,15 essential properties are biocompatibility and biodegradability, mainly lacking in metals, metal oxides, and intrinsically conducting polymers.8Electrically conductive composite materials based on biodegradable polymers like polyvinyl alcohol16 and poly(lactic acid)17 offer biocompatibility, biodegradability, and functionality. The advantage of a biocompatible, conductive, and polymer nanocomposite is that it can be used as a material for a multifaceted flexible electronics applications like wearable devices, biosensors, or flexible electrodes for microbial fuel cells. Polyvinyl alcohol (PVA) is an extensively researched natural polymer known for its strong biodegradability, favorable hydrophilic properties, and active alcohol-based side chain. These attributes make it an appropriate choice for creating nanocomposites alongside conductive additives like surface-modified carbon nanomaterials.16,18 PVA-based nanofibers have shown promising results based on their unique surface properties for sophisticated, flexible electronics applications, like on-chip sensors.19 Electrically conductive PVA hydrogels have been demonstrated for self-healing biosensor applications due to their excellent biocompatibility.
Carbon nanomaterials have become prominent constituents in the production of advanced composite materials intended for diverse electronics applications.20,21 In these composite materials, carbon nanomaterials induce high electrical conductivity while a polymer matrix acts as the structural material while also providing bendability and conformability as required for flexible electronics applications.4,22,23 Nanocomposites based on single-walled carbon nanotubes on polyethylene oxide nanofiber mats,24 and poly(vinyl alcohol) nanofibers embedded with titanium nanoparticles25 were demonstrated for biosensor and gas sensor applications, respectively. Among carbon nanomaterials, carbon nanotubes (CNTs) and 2-D graphene have been studied to a much greater extent than carbon nanofibers (CFs).26 Although there is some ambiguity between carbon nanofiber and carbon fiber structural properties, Al-Saleh and Sundararaj showed that vapor-grown carbon nanofibers could have a diameter ranging between 50 nm and 200 nm (aspect ratio: 25–2000), while the carbon fiber diameter was 7.3 μm (aspect ratio: 440) and it shows almost 100 times lower thermal conductivity compared to carbon nanomaterials.27 However, CFs have several advantages28 over other carbon nanomaterials because of their facile synthesis, 100 times lower cost than single-walled carbon nanotubes,29 equally superior electrical conductivity and ease of functionalization. A fundamental issue in incorporating carbon nanomaterials into polymer matrices is the insufficient interfacial interactions between the filler and the matrix, resulting in uneven dispersion of the nanomaterials.30 In order to create high-performance nanocomposites using carbon nanomaterials such as graphene, carbon nanotubes (CNTs), and carbon nanofibers (CFs), it is necessary to perform functionalization of these materials before introducing them into a polymer matrix.31 Utilizing covalent functionalization of carbon nanomaterials could be an effective strategy for creating nanocomposites where carbon nanomaterials are grafted onto a polymer matrix. It facilitates filler–matrix compatibility by promoting adhesion between the carbon nanomaterial and polymer to achieve superior functional properties.32–35
Electrodes required to have high electrochemical surface area and structural flexibility for their application in flexible electronics devices. Electrospinning has been used as a popular choice for producing flexible, non-woven nanofibers with high electrochemical surface area for applications requiring high electrical conductivity.25,36,37 This unique method utilizes straightforward instrumentation, leveraging a high-voltage electric field to guide a polymer solution into a stable jet formation, leading to the creation of nanofiber mats spanning a range from a few micrometers to several nanometers in the fiber diameter.
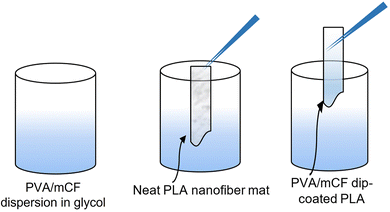
Although polymer nanocomposites have been synthesized and characterized for various applications, evidence for combined properties, including electrical conductivity, flexibility, biocompatibility and biodegradability, is still lacking in the literature. This study aims to synthesize and characterize a biodegradable, biocompatible polymer-based electrically conductive nanocomposite for flexible electronics applications. CFs were functionalized to generate acyl chloride moieties on their surface. The modified CFs (mCFs) were used as conductive fillers in the PVA matrix using a covalent grafting technique to enhance filler–matrix interactions to synthesize an electrically conductive nanocomposite (PVA/mCF). The electrospinning technique was used to fabricate flexible electrospun nanofiber mats using polylactic acid (PLA) solutions with chloroform as the solvent. PVA/mCF was then incorporated into the PLA nanofiber mats using two different methods. In the first method, PVA/mCF with various weight percentages of mCFs was directly electrospun from its aqueous solutions on the PLA nanofiber mats. The second method used PVA/mCF glycol solution to dip-coat38 the PLA mats to fabricate flexible, conductive nanofiber mats. Several characterization techniques were employed to understand and analyze the influence of CF composition dispersion and fabrication techniques on the nanofiber mats’ surface and thermal and electrical properties. These highly flexible, biocompatible and electrically conductive nanofiber mats can be used in a wide range of flexible electronics applications.
2 Experimental section
2.1 Materials and chemicals
Polyvinyl alcohol (PVA) with a molecular weight ranging from 89![[thin space (1/6-em)]](https://www.rsc.org/images/entities/char_2009.gif) 000 Da to 98
000 Da to 98![[thin space (1/6-em)]](https://www.rsc.org/images/entities/char_2009.gif) 000 Da was procured from Sigma Aldrich and utilized without additional purification. Vapor-grown carbon nanofibers, exhibiting an intrinsic impedance of 0.005 Ω, were acquired from Sigma Aldrich and used as is. Poly(L-lactic acid) (PLA) of 2003D grade from NatureWorks® LLC (USA) was employed without modification. Other analytical-grade reagents, including thionyl chloride (SOCl2), nitric acid (HNO3), sulfuric acid (H2SO4), chloroform (CHCl3), and ethylene glycol (C2H6O2), were used in the study.
000 Da was procured from Sigma Aldrich and utilized without additional purification. Vapor-grown carbon nanofibers, exhibiting an intrinsic impedance of 0.005 Ω, were acquired from Sigma Aldrich and used as is. Poly(L-lactic acid) (PLA) of 2003D grade from NatureWorks® LLC (USA) was employed without modification. Other analytical-grade reagents, including thionyl chloride (SOCl2), nitric acid (HNO3), sulfuric acid (H2SO4), chloroform (CHCl3), and ethylene glycol (C2H6O2), were used in the study.
2.2 Surface modification of CFs
To produce oxidized carbon fibers with carboxylic acid groups (CF–COOH), 300 mg of carbon fibers (CF) was combined with 200 ml of a mixture of 3![[thin space (1/6-em)]](https://www.rsc.org/images/entities/char_2009.gif) :
:![[thin space (1/6-em)]](https://www.rsc.org/images/entities/char_2009.gif) 1 v/v of concentrated nitric acid and sulfuric acid. The mixture was heated in a 500 ml round bottom flask at 120 °C, under constant reflux and stirring at 600 rpm for 45 minutes. Following this, the resulting product was allowed to settle, and the acid was removed through repeated sedimentation and decantation using deionized (DI) water. CF–COOH was subsequently subjected to centrifugation and washed multiple times to eliminate most of the residual acid. The product was then dialyzed using a cellulose acetate membrane until the pH approached a value near 7.
1 v/v of concentrated nitric acid and sulfuric acid. The mixture was heated in a 500 ml round bottom flask at 120 °C, under constant reflux and stirring at 600 rpm for 45 minutes. Following this, the resulting product was allowed to settle, and the acid was removed through repeated sedimentation and decantation using deionized (DI) water. CF–COOH was subsequently subjected to centrifugation and washed multiple times to eliminate most of the residual acid. The product was then dialyzed using a cellulose acetate membrane until the pH approached a value near 7.
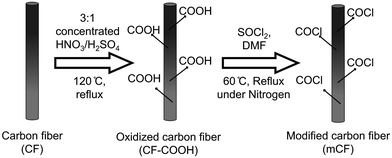
In the next step, 100 mg of dried CF–COOH was mixed with 30 ml of thionyl chloride (SOCl2), and 2 ml of dimethylformamide (DMF) was introduced as a catalyst in a round bottom flask. This setup was placed in an oil bath at 60 °C with constant stirring at 600 rpm and nitrogen gas purging for 24 hours. The resulting product was meticulously washed using tetrahydrofuran (THF) until all unreacted SOCl2 was eliminated. The washed product underwent further centrifugation and washing steps with water, followed by pH adjustment using a membrane dialysis bag and deionized water. The process concluded with vacuum drying at 60 °C for 2 days to obtain the surface-modified carbon fiber (mCF), as depicted in Scheme 1.
2.3 Covalent grafting of mCFs on PVA
To initiate the covalent grafting procedure, 120 mg of polyvinyl alcohol (PVA) was dissolved in an excess of water. Subsequently, 7.6 mg, 10.4 mg, 13.3 mg, or 30 mg of surface-modified carbon fiber (mCFs) was incorporated into this solution. The mixture was subjected to sonication using a probe sonicator for a duration of 2 hours, resulting in the creation of PVA/mCF composites with varying weight percentages: 6%, 8%, 10%, and 20%, denoted as PVA/mCF-6, PVA/mCF-8, PVA/mCF-10, and PVA/mCF-20, respectively. The resultant dispersions were then heated under reflux at 80 °C for a duration of 3 hours. Following this step, the products were centrifuged to eliminate excess water. The resulting samples were subsequently freeze-dried to yield the dried grafted PVA/mCF nanocomposites. In the rest of this article, PVA/mCF-20 is referred to as PVA/mCF.2.4 Fabrication of conductive nanofiber mats
The solution for electrospinning polylactic acid (PLA) was created by dissolving 2 g of pure PLA in 10 ml of 3![[thin space (1/6-em)]](https://www.rsc.org/images/entities/char_2009.gif) :
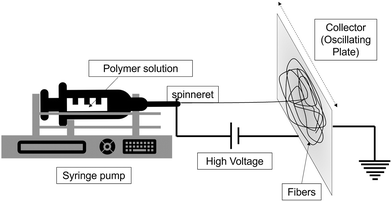
:![[thin space (1/6-em)]](https://www.rsc.org/images/entities/char_2009.gif) 1 chloroform and dimethylformamide (DMF) mixture (v/v). This solution was stirred continuously overnight. Subsequently, the resulting PLA solution was subjected to electrospinning to produce a nanofiber mat of neat PLA (PLA-es). This process was carried out on an oscillating plate as the collector (Scheme 2) to obtain a large area of the electrospun nanofiber using the following parameters: a syringe with a diameter of 13.6 mm, an interelectrode distance of 13 cm, a flow rate of 1 ml h−1, and an applied voltage of 6.5 kV. The PLA nanofiber mat was subsequently dried overnight in a hot-air oven at 50 °C.
1 chloroform and dimethylformamide (DMF) mixture (v/v). This solution was stirred continuously overnight. Subsequently, the resulting PLA solution was subjected to electrospinning to produce a nanofiber mat of neat PLA (PLA-es). This process was carried out on an oscillating plate as the collector (Scheme 2) to obtain a large area of the electrospun nanofiber using the following parameters: a syringe with a diameter of 13.6 mm, an interelectrode distance of 13 cm, a flow rate of 1 ml h−1, and an applied voltage of 6.5 kV. The PLA nanofiber mat was subsequently dried overnight in a hot-air oven at 50 °C.
2.5 Characterization techniques
3 Results and discussion
3.1 Fourier transform infrared (FTIR) studies
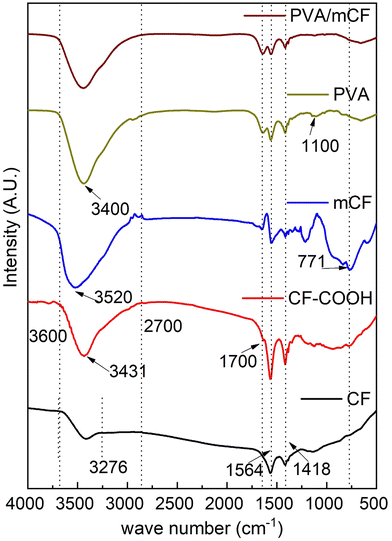
Fig. 2 illustrates the FTIR spectra of CFs, CF–COOH, mCFs, PVA, and PVA/mCF. The peaks at 1564 cm−1 and 1418 cm−1 signify the skeletal vibration of the carbon fiber. The range from 3276 cm−1 to 3600 cm−1 corresponds to the –OH stretching vibration attributed to moisture in the CFs. Upon oxidation, this –OH stretching vibration intensity was higher due to the presence of the (–COOH) moiety in CF–COOH compared to CFs.42 The concomitant appearance of a peak ∼1700 cm−1 could be attributed to C![[double bond, length as m-dash]](https://www.rsc.org/images/entities/char_e001.gif) O stretching vibration, which indicates the formation of –COOH and –COCl groups in CF–COOH and mCFs, further confirming successful partial surface functionalization of CFs. Furthermore, the peak due to –OH stretching vibrations experienced a slight shift to 3520 cm−1 due to the transformation of –COOH groups into –COCl in the mCF spectrum. The emergence of a peak at 771 cm−1 was attributed to the C–Cl bond stretching vibrations, confirming the successful modification of CF. In the PVA spectrum, the peak at 1564 cm−1 originates from the stretching vibrations of C–H in the PVA backbone, and a robust hydroxyl stretching vibration peak is noticeable at 3400 cm−1. The peak at 1100 cm−1 is linked to C–OH bond stretching, an attribute not observed in the PVA/mCF spectrum. The simultaneous absence of the C–Cl peak at 771 cm−1 verifies the effective grafting of PVA onto mCFs.
O stretching vibration, which indicates the formation of –COOH and –COCl groups in CF–COOH and mCFs, further confirming successful partial surface functionalization of CFs. Furthermore, the peak due to –OH stretching vibrations experienced a slight shift to 3520 cm−1 due to the transformation of –COOH groups into –COCl in the mCF spectrum. The emergence of a peak at 771 cm−1 was attributed to the C–Cl bond stretching vibrations, confirming the successful modification of CF. In the PVA spectrum, the peak at 1564 cm−1 originates from the stretching vibrations of C–H in the PVA backbone, and a robust hydroxyl stretching vibration peak is noticeable at 3400 cm−1. The peak at 1100 cm−1 is linked to C–OH bond stretching, an attribute not observed in the PVA/mCF spectrum. The simultaneous absence of the C–Cl peak at 771 cm−1 verifies the effective grafting of PVA onto mCFs.
3.2 Raman spectroscopy studies
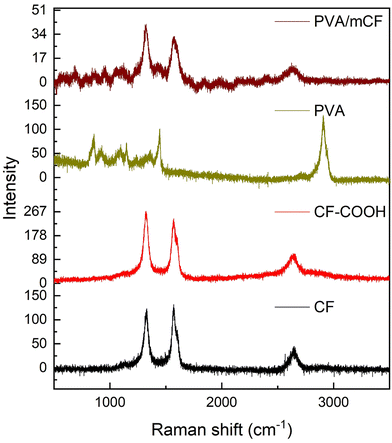
Fig. 3 shows the Raman spectra of CFs, CF–COOH, PVA, and PVA/mCF. At Raman shifts of 1578 cm−1 and 1319 cm−1, the D and G bands represent distinctive CF characteristics.39 The ratios of the intensities of the D band (ID) and G band (IG) for CF and CF–COOH are tabulated in Table 1. It should be noted that the ID/IG ratio of CFs escalated from 0.92 to 1.11 in CF–COOH. This notable increase in the ID/IG ratio within the oxidized carbon fiber CF–COOH indicates a transformation of graphitic sp2 carbon into sp3 carbon during CF oxidation. This, in turn, generates defects on the exposed graphene edges on the CF surface, resulting in the emergence of surface –COOH functional groups.16 In the PVA spectra, prominent bands associated with polyvinyl alcohol were observed at 1444 cm−1 and 2915 cm−1, corresponding to shear mode and C–H vibrations, respectively.43 The presence of graphitic peaks in the PVA/mCF spectrum further corroborates the successful grafting of PVA onto the mCF surface.| Sample | I D | I G | I D/IG |
|---|---|---|---|
| CF | 120.7 | 130.7 | 0.9 |
| CF–COOH | 264.3 | 238.8 | 1.1 |
3.3 X-ray diffraction (XRD) studies
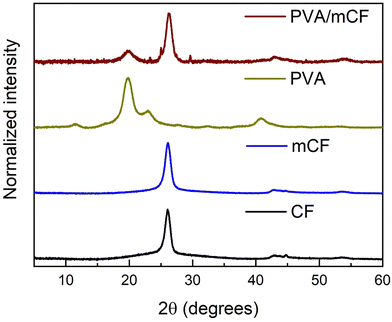
Fig. 4 presents the X-ray diffraction (XRD) profiles of CFs, mCFs, PVA and PVA/mCF. It was observed that the peaks at 2θ values of 26.1, 42.9, and 44.8 degrees were similar to the characteristic peaks of graphite, corresponding to the planes 002, 100, and 101, respectively.44 In the mCF XRD pattern, a slight broadening of the peak at 2θ = 26.1 degrees was observed, which could be attributed to a minor reduction in crystallinity resulting from the conversion of some sp2 carbon into sp3 carbon. However, despite this, the identical peak position suggests that the primary crystalline structure of CFs remained unchanged after modification into mCFs. Notably, PVA's characteristic peaks emerged at 2θ values of 19.8 and 22.9 degrees. In the XRD pattern of PVA/mCF, incorporation of graphitic peak at 2θ = 26.1 degrees was evident, offering further confirmation of the successful grafting of PVA onto the mCF surface, with effective mCF dispersion. Additionally, the concurrent broadening of the PVA's signature peak at 2θ = 19.8 degrees indicated a reduction in PVA's inherent crystallinity upon its grafting onto mCFs.3.4 Thermal degradation studies
Thermogravimetric analysis (TGA) curves for PVA, mCFs and the PVA/mCF nanocomposite are shown in Fig. 5. The inset plot shows the differential weight loss versus the temperature of PVA and PVA/mCF. It was observed that the mass loss of mCFs was below 7%, primarily due to the thermal decomposition of surface functional groups and some moisture present in the mCF. The analysis of PVA's thermal degradation profile revealed the presence of approximately 3% moisture content, which was observed to evaporate between 25 and 100 °C. The differential weight loss curve indicated a two-stage thermal decomposition of PVA, occurring at around 300 °C and 460 °C. Most of the weight loss transpired below 500 °C, with only about 2% residual weight remaining for PVA.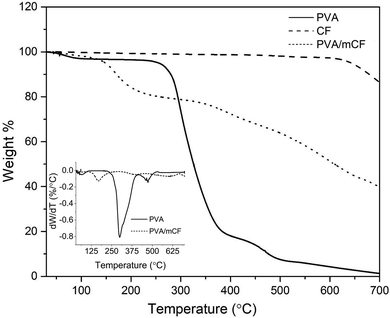 | ||
| Fig. 5 TGA curves of PVA, CFs, and the PVA/mCF nanocomposite. The inset plot depicts differential weight loss of PVA and PVA/mCF with temperature. | ||
In the PVA/mCF nanocomposite, a gradual weight loss was noted below 100 °C, attributed to the presence of moisture in the composite. A distinct weight loss gradient emerged at 150 °C, possibly due to portions of the PVA matrix that were not covalently bonded to the mCF surface. As the temperature increased, the thermal decomposition of PVA/mCF was significantly delayed due to the robust covalent linkage between the surface-modified carbon fiber (mCF) and the polymer matrix (PVA). Remarkably, the PVA/mCF exhibited a residual weight of approximately 39% at 700 °C, a nearly twenty-fold increase compared to pristine PVA. This suggests that the thermal stability of the covalently grafted PVA/mCF nanocomposite was significantly enhanced, rendering it suitable for high-temperature applications like thermocouples. A similar finding was reported by Malikov et al.,16 wherein the thermal degradation pattern of PVA-grafted MWCNT nanocomposites demonstrated enhanced thermal stability due to covalent grafting.
3.5 Morphological studies
Fig. 6(a)–(c) show the scanning electron micrographs of unmodified CFs, mCFs and PVA/mCF. The diameter distribution of CF fibers spanned from 100 to 200 nanometers, exhibiting a relatively smooth surface. In contrast, significant surface roughness was evident in mCFs, as depicted in Fig. 6b, possibly arising from the defects introduced during CF surface modification. Furthermore, the interweaving of carbon fibers within the PVA-grafted carbon fiber matrix is distinctly visible in Fig. 6c. This observation underscores the notable compatibility between the mCFs as a filler and the PVA matrix, further corroborated by the entanglement pattern seen in the micrograph. The neat PLA electrospun nanofiber mat (PLA-es) was characterized by larger diameters ranging between 500 and 1200 nm (Fig. 6d). The PVA/mCF-20@PLA-es electrospun nanofiber mat is shown in Fig. 6e, where the surface layer of electrospun PVA/mCF with smaller diameters is visible above the underlying electrospun PLA layer. The dip-coated PVA/mCF@PLA nanofiber mat consisted of a surface film of PVA/mCF; hence, high-resolution micrographs could not be obtained for this sample. Transmission electron micrographs further showed the PVA/mCF morphology, and a heavily crosslinked mCF network was observed due to the covalent grafting of PVA (Fig. 6f). Certain mCF instances displayed multiple PVA patches distributed along their length, while others exhibited a consistent coating, leading to a slight augmentation in the fiber diameter. Xu et al.45 observed a similar increase in the MWCNT diameter due to the deposition of amorphous layers of poly-(N-iso-propyl acrylamide) when covalently grafted onto MWCNTs. Altogether, morphological evidence for successful surface modification of CFs and covalent grafting of PVA on mCFs was observed in scanning and transmission electron micrographs. Therefore, the covalent grafting strategy could be deemed reliable for fabricating polymer-based conductive nanofiber mats.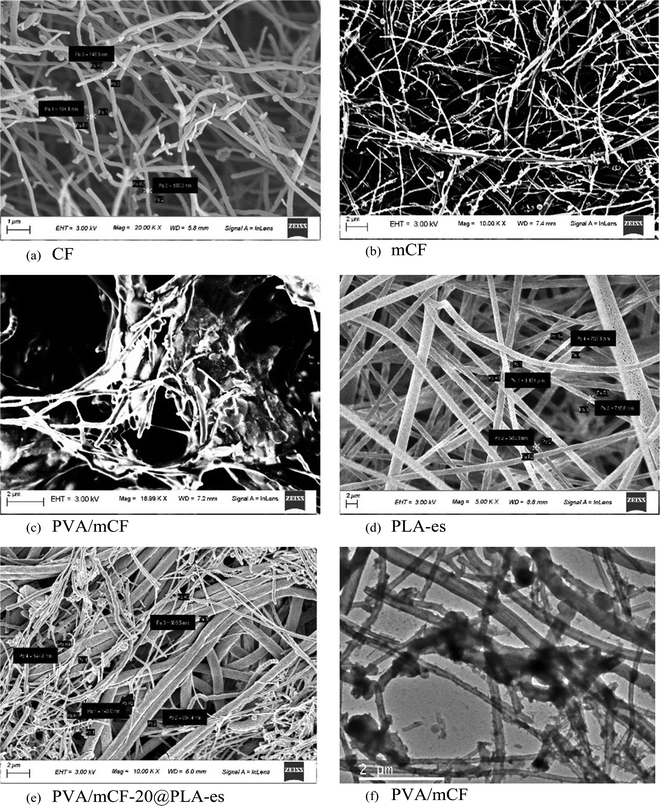 | ||
| Fig. 6 (a)–(e) Scanning electron micrographs of CFs, mCFs, PVA/mCF, neat PLA nanofiber mats, and PVA/mCF@PLA-es nanofiber mats, respectively; (f) transmission electron micrograph of PVA/mCF. | ||
3.6 Wettability studies
The contact angle of neat PLA-es nanofiber mats was equal to (130 ± 6)° due to their hydrophobic characteristics (Fig. 7a). The dip-coated PVA/mCF@PLA nanofiber mats had a contact angle of (74 ± 15)° (Fig. 7b), almost decreased by 43% compared to the neat PLA-es nanofiber mats. The decrease in the contact angle can be attributed to PVA's inherent hydrophilicity and the augmented hydrophilic properties of mCFs compared to CFs, brought about by the presence of surface functional groups. The elevated standard deviation may be attributed to the uneven surface and inconsistent thickness of the PVA/mCF coating on the PLA layer. Due to the hydrophilic nature of PVA/mCF@PLA-es, it can potentially facilitate cell adhesion and proliferation, rendering it a promising choice for biomedical and microbial fuel cell applications.15,46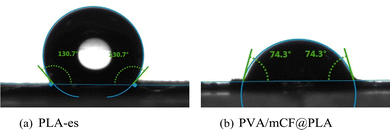 | ||
| Fig. 7 Contact angles of (a) neat PLA electrospun nanofiber mats (PLA-es), (b) dip-coated PVA/mCF on PLA nanofiber mats (PVA/mCF@PLA). | ||
3.7 Electrochemical impedance spectroscopy (EIS) studies
Impedance values of the different nanofiber mats are compiled in Table 2. The impedance of neat PVA nanofiber was 1.6 × 10⁸ Ω at a frequency sweep of 0.1 Hz. With increasing mCF loading, the impedance of the electrospun nanofiber mats successively decreases up to 560 Ω. The dip-coated nanofiber mat PVA/mCF@PLA exhibits the lowest impedance with a significant decrease in capacitive impedance. The extremely low impedance of the 20 weight % mCF containing nanofiber mats PVA/mcF-20@PLA-es and PVA/mCF@PLA could be ascribed to the high mCF loading, which forms a conductive network in the polymer matrix. It was observed that at low filler loadings, the composite nanofiber mats (PVA/mCF-6@PLA-es and PVA/mCF-10@PLA-es) exhibit high impedance values of 2.3 × 10⁵ and 3.9 × 10⁴ ohms, respectively. This is because the discontinuous filler network in the polymer matrix gives rise to high capacitive impedance in the nanofiber mats. Although both the electrospun nanofiber mat PVA/mCF-20@PLA-es and the dip-coated nanofiber mat PVA/mCF@PLA were fabricated from the PVA/mCF nanocomposite containing 20 weight% of CF, there was a slight decrease in the impedance of the dip-coated nanofiber mat (about 13%) compared to the electrospun nanofiber mat. This could also be explained by the improved continuity of the CF network in the polymer matrix upon dip-coating. The high flexibility of PVA/mCF@PLA nanofiber mats and their low impedance value in the order of 102 Ω make them highly suitable for flexible electronics applications.| Frequency (Hz) | Impedance (Ω) | ||||
|---|---|---|---|---|---|
| PVA | PVA/mCF-6@PLA-es | PVA/mCF-10@PLA-es | PVA/mCF-20@PLA-es | PVA/mCF@PLA | |
21![[thin space (1/6-em)]](https://www.rsc.org/images/entities/char_2009.gif) 544 544 |
4.6 × 10⁵ | 5.8 × 10⁴ | 3501 | 555 | 492 |
| 10 | 1.2 × 10⁸ | 2.1 × 10⁵ | 4.4 × 10⁴ | 584 | 498 |
| 0.1 | 1.6 × 10⁸ | 2.3 × 10⁵ | 3.9 × 10⁴ | 560 | 497 |
3.8 Current–voltage (I–V) response studies
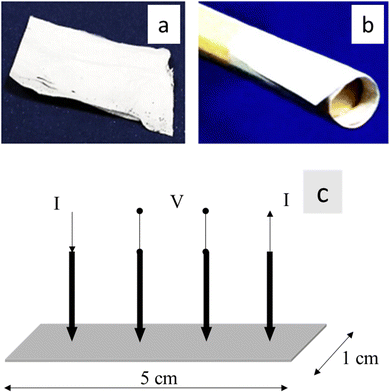
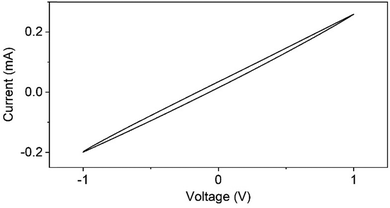
The I–V response of the PVA/mCF@PLA nanofiber mat was reversible and was characterized by the absence of redox peaks and negligible hysteresis (Fig. 8). The absence of redox peaks suggests that no species in the nanofiber mat could be oxidized or reduced in this voltage range. The voltammogram's negligible hysteresis and reversible nature indicate the absence of capacitive impedance.47 The linearity of the I–V response curve further suggests the composites’ resistive nature with a current density of 40 mA mm−2 at an applied potential of 1 V, making the PVA/mCF@PLA nanofiber mats an ideal candidate for conductive applications.4. Conclusions
In this work, we have successfully demonstrated surface-modification of CFs and covalent grafting of biodegradable PVA onto the surface-modified CFs to synthesize PVA/mCF. The PVA/mCF nanocomposite was either directly electrospun on PLA nanofiber mats fabricated using electrospinning (PVA/mCF@PLA-es) or dip-coated (PVA/mCF@PLA). The nanofiber mats’ electrical impedance study and I–V response characteristics showed promising results in a low surface impedance (∼491 Ω) and a high current density (∼40 mA mm−2). FTIR, Raman, and XRD studies demonstrated structural evidence for successful surface modification of CFs and covalent grafting of PVA onto mCFs. Wettability studies confirmed the hydrophilicity of the ternary composite compared to neat PLA nanofiber mats. Morphological studies also affirmed the changes upon surface modification of CFs and covalent grafting of PVA onto the mCFs. The uniform distribution of the PVA/mCF fibers on the PVA/mCF@PLA-es corroborated the high conductivity of the ternary composite. High thermal stability of the PVA/mCF nanocomposite was achieved in terms of 20 times higher weight retention at 700 °C compared to neat PVA. Wettability studies also showed high hydrophilicity due to the lower contact angle of PVA/mCF@PLA (74 ± 15)° compared to neat PLA (130 ± 15)°. Holistically, electrospun architectures are highly flexible, and the PVA/mCF@PLA ternary nanocomposites prepared herein with high electrical conductivity, low water contact angle, and high thermostability are thus suitable for an array of applications of flexible electronics, biomedical devices and biofuel cells.Author contributions
V.S conducted investigations, developed methodologies, curated data, performed formal analyses, generated original drafts, and contributed to review and editing. G.C and N.S contributed to investigations, formal analyses, reviews and editing. V.K was responsible for conceptualizing the study, funding acquisition, managing project administration, providing supervision, and contributing to review and editing.Conflicts of interest
The authors declare no conflicts of interest.Acknowledgements
The authors are grateful to the Centre of Excellence for Sustainable Polymers (funded by the Department of Chemicals and Petrochemicals, Government of India) and the Central Instruments Facility at IIT Guwahati for facilitating this research.References
- H. R. Ansari, A. Mirzaei, H. Shokrollahi, R. Kumar, J.-Y. Kim, H. W. Kim, M. Kumar and S. S. Kim, J. Mater. Chem. C, 2023, 11, 6528–6549 RSC.
- A. Chinnappan, C. Baskar, S. Baskar, G. Ratheesh and S. Ramakrishna, J. Mater. Chem. C, 2017, 5, 12657–12673 RSC.
- A. H. Espera, J. R. C. Dizon, A. D. Valino and R. C. Advincula, Jpn. J. Appl. Phys., 2022, 61, SE0803 CrossRef.
- C. Jellett, K. Ghosh, M. P. Browne, V. Urbanová and M. Pumera, ACS Appl. Energy Mater., 2021, 4, 6975–6981 CrossRef CAS.
- D. Ye, Y. Ding, Y. Duan, J. Su, Z. Yin and Y. A. Huang, Small, 2018, 14, 1703521 CrossRef PubMed.
- G. Zhou, F. Li and H.-M. Cheng, Energy Environ. Sci., 2014, 7, 1307–1338 RSC.
- S. Park, M. Vosguerichian and Z. Bao, Nanoscale, 2013, 5, 1727–1752 RSC.
- D.-L. Wen, D.-H. Sun, P. Huang, W. Huang, M. Su, Y. Wang, M.-D. Han, B. Kim, J. Brugger, H.-X. Zhang and X.-S. Zhang, Microsyst. Nanoeng., 2021, 7, 1–25 CrossRef PubMed.
- Flexible, Printed and Organic Electronics 2019–2029: Forecasts, Players & Opportunities, 2018.
- M. R. Akanda, A. M. Osman, M. K. Nazal and M. A. Aziz, J. Electrochem. Soc., 2020, 167, 037534 CrossRef.
- V. Babel and B. L. Hiran, Polym. Compos., 2021, 42, 3142–3157 CrossRef CAS.
- Y. Wang, Polym. Int., 2018, 67, 650–669 CrossRef CAS.
- W. Lee, M. Song, S. Park, S. Nam, J. Seo, H. Kim and Y. Kim, Sci. Rep., 2016, 6, 33795 CrossRef CAS PubMed.
- E. W. Lau, in Clinical Cardiac Pacing, Defibrillation and Resynchronization Therapy, ed. K. A. Ellenbogen, B. L. Wilkoff, G. N. Kay, C.-P. Lau and A. Auricchio, Elsevier, 2017, pp. 313–351.e29 Search PubMed.
- K. Guo, PhD dissertation, Ghent University, 2014.
- E. Y. Malikov, M. B. Muradov, O. H. Akperov, G. M. Eyvazova, R. Puskás, D. Madarász, L. Nagy, Á. Kukovecz and Z. Kónya, Phys. E, 2014, 61, 129–134 CrossRef CAS.
- G. Chakraborty, P. Dhar, V. Katiyar and G. Pugazhenthi, J. Mater. Sci.: Mater. Electron., 2020, 31, 5984–5999 CrossRef CAS.
- S. Gahlot, V. Kulshrestha, G. Agarwal and P. K. Jha, Macromol. Symp., 2015, 357, 173–177 CrossRef CAS.
- Z.-C. Chen, T.-L. Chang, T.-C. Pan, D. Chiang and S.-F. Tseng, Mater. Lett., 2018, 233, 130–133 CrossRef CAS.
- G. Chakraborty, G. Pugazhenthi and V. Katiyar, Polym. Bull., 2019, 76, 2367–2386 CrossRef CAS.
- M. Moniruzzaman and K. I. Winey, Macromolecules, 2006, 39, 5194–5205 CrossRef CAS.
- B. Li, F. Zhang, S. Guan, J. Zheng and C. Xu, J. Mater. Chem. C, 2016, 4, 6988–6995 RSC.
- Z. Yu, X. Niu, Z. Liu and Q. Pei, Adv. Mater., 2011, 23, 3989–3994 CrossRef CAS PubMed.
- Y. Liu, J. Chen, N. T. Anh, C. O. Too, V. Misoska and G. G. Wallace, J. Electrochem. Soc., 2008, 155, K100 CrossRef CAS.
- G. F. El Fawal, H. S. Hassan, M. R. El-Aassar and M. F. Elkady, Arabian J. Sci. Eng., 2019, 44, 251–257 CrossRef CAS.
- L. Wen, F. Li and H.-M. Cheng, Adv. Mater., 2016, 28, 4306–4337 CrossRef CAS PubMed.
- M. H. Al-Saleh and U. Sundararaj, Composites, Part A, 2011, 42, 2126–2142 CrossRef.
- L. Guo, K. Wan, B. Liu, Y. Wang and G. Wei, Nanotechnology, 2021, 32, 442001 CrossRef CAS PubMed.
- I. Kang, Y. Y. Heung, J. H. Kim, J. W. Lee, R. Gollapudi, S. Subramaniam, S. Narasimhadevara, D. Hurd, G. R. Kirikera, V. Shanov, M. J. Schulz, D. Shi, J. Boerio, S. Mall and M. Ruggles-Wren, Composites, Part B, 2006, 37, 382–394 CrossRef.
- P.-C. Ma, N. A. Siddiqui, G. Marom and J.-K. Kim, Composites, Part A, 2010, 41, 1345–1367 CrossRef.
- V. D. Punetha, S. Rana, H. J. Yoo, A. Chaurasia, J. T. McLeskey, M. S. Ramasamy, N. G. Sahoo and J. W. Cho, Prog. Polym. Sci., 2017, 67, 1–47 CrossRef CAS.
- V. T. Le, C. L. Ngo, Q. T. Le, T. T. Ngo, D. N. Nguyen and M. T. Vu, Adv. Nat. Sci.: Nanosci. Nanotechnol., 2013, 4, 035017 CAS.
- J. Qiu, J. Li, Z. Yuan, H. Zeng and X. Chen, Appl. Compos. Mater., 2018, 25, 853–860 CrossRef CAS.
- N. Wang, S. Pandit, L. Ye, M. Edwards, V. R. S. S. Mokkapati, M. Murugesan, V. Kuzmenko, C. Zhao, F. Westerlund, I. Mijakovic and J. Liu, Carbon, 2017, 111, 402–410 CrossRef CAS.
- N. Raphael, K. Namratha, B. N. Chandrashekar, K. K. Sadasivuni, D. Ponnamma, A. S. Smitha, S. Krishnaveni, C. Cheng and K. Byrappa, Prog. Cryst. Growth Charact. Mater., 2018, 64, 75–101 CrossRef CAS.
- Y. Zhang and G. C. Rutledge, Macromolecules, 2012, 45, 4238–4246 CrossRef CAS.
- J. P. F. Santos, M. Arjmand, G. H. F. Melo, K. Chizari, R. E. S. Bretas and U. Sundararaj, Mater. Des., 2018, 141, 333–341 CrossRef CAS.
- S. Sugumaran, C. S. Bellan, D. Muthu, S. Raja, D. Bheeman and R. Rajamani, RSC Adv., 2015, 5, 10599–10610 RSC.
- C.-H. Park, C.-H. Kim, L. D. Tijing, D.-H. Lee, M.-H. Yu, H. R. Pant, Y. Kim and C. S. Kim, Fibers Polym., 2012, 13, 339–345 CrossRef CAS.
- D. K. Schroder, Semiconductor Material and Device Characterization, John Wiley & Sons, Ltd, 2005 Search PubMed.
- N. Elgrishi, K. J. Rountree, B. D. McCarthy, E. S. Rountree, T. T. Eisenhart and J. L. Dempsey, J. Chem. Educ., 2018, 95, 197–206 CrossRef CAS.
- A. Fraczek-Szczypta, E. Menaszek, T. B. Syeda, A. Misra, M. Alavijeh, J. Adu and S. Blazewicz, J. Nanopart. Res., 2012, 14, 1181 CrossRef PubMed.
- C. F. P. de Oliveira, P. A. R. Muñoz, M. C. C. dos Santos, G. S. Medeiros, A. Simionato, D. A. Nagaoka, E. A. T. de Souza, S. H. Domingues and G. J. M. Fechine, Polym. Compos., 2019, 40, E312–E320 CAS.
- R. Das, S. B. A. Hamid, M. E. Ali, S. Ramakrishna and W. Yongzhi, Curr. Nanosci., 2015, 11(1), 23–35 CrossRef.
- G. Xu, W.-T. Wu, Y. Wang, W. Pang, P. Wang, Q. Zhu and F. Lu, Nanotechnology, 2006, 17, 2458 CrossRef CAS PubMed.
- Z. Yang, X. Li, J. Si, Z. Cui and K. Peng, J. Wuhan Univ. Technol., Mater. Sci. Ed., 2019, 34, 207–215 CrossRef CAS.
- M. Kosmulski, P. Próchniak and C. Saneluta, Adsorption, 2009, 15, 172–180 CrossRef CAS.
Footnote |
| † Work was carried out at Indian Institute of Technology Guwahati, North Guwahati, India. Current affiliation of the first author is Department of Chemical and Petroleum Engineering, University of Kansas, Lawrence, Kansas 66045, USA. |
| This journal is © The Royal Society of Chemistry 2023 |

