DOI:
10.1039/D3MA00537B
(Paper)
Mater. Adv., 2023,
4, 6645-6654
Computational study of the physical characteristics of Si-based oxide perovskites for energy generation using DFT
Received
11th August 2023
, Accepted 5th November 2023
First published on 24th November 2023
Abstract
SiMO3 (M = Sn, Ge) silicon-based oxide perovskite compounds are studied using density functional theory (DFT) and Wien2k software to examine their structural, elastic, optical, and electronic properties. The Birch–Murnaghan equation is used to optimize SiSnO3 and SiGeO3 compounds and deliver structural stability, whereas the IRelast program is used to find elastic constants to confirm the flexible stability as well as the elastic behavior of the presented compounds. These compounds resist plastic strain and are ductile, scratch resistant, anisotropic, and mechanically stable. The Trans-Blaha modified Becke–Johnson potential approximation calculations demonstrate that the band structure of SiSnO3 is intermetallic, whereas the second compound, SiGeO3, is a semiconductor. The evidence obtained from the band structure and density of states of the these compounds demonstrates that SiSnO3 has an indirect band gap, and the minima of the conduction band are at evenness point X, whereas the maxima of the valence band are at symmetry points M, resulting in an indirect band gap (X–M). Meanwhile, SiGeO3 has a direct band gap, and the minima of the valence band and maxima of the conduction band occur at symmetry points X. These crystals have low-energy absorption. If we examine the reflectance of ternary molecules SiGeO3 has a low absorption of up to 2 eV with fluctuations and the absorption increases to a maximum value of 40.0 at 6.50 eV. In contrast, SiSnO3 exhibits a different increase, and the absorption coefficient decreases to the lowest value of 12.4 eV. Our optical property analysis showed that SiSnO3 and SiGeO3 can be used in high-frequency ultraviolet devices. To the best of our knowledge, this is the first DFT-based examination of the characteristics of these crystals.
1. Introduction
Energy a basic need of every human being, is available to everyone, on average, in decreasing amounts over time. Perovskites are crystals used in generating and storing energy, and therefore, they remain popular among researchers. To produce perovskites with better properties, researchers are trying to make new perovskites. The typical chemical formula for perovskites is ABX3, where X may be oxygen, fluorine, chlorine, bromine, or iodine. Components A and B are cations, and X is an anion. CaTiO3 was the first material found, which obeyed this formula. Each perovskite structure is arranged in a way that twelve atoms of cation A and six atoms of cation B are bound to the anion. Oxide perovskites are found in the form of insulators, conductors, and semiconductors. These compounds can have stable crystalline structures with excellent electronic properties. These materials have applications in the lens industry, lithography, photoelectric materials, and energy storage devices.1–3 Several studies have been conducted revealing the various characteristics of perovskite crystals, especially oxide perovskites, which remain of great interest. Majority of researchers have concluded that they are mechanically and elastically stable.4–6 These crystals are promising for highly effective photovoltaic components and superior energy storage applications in automobiles, electronics, and optics.7–9 Oxygen is combined with inorganic species, organic species, or metals from the transition metal group to produce stable oxide perovskites. Wide band gap oxide perovskites are most viable. Such molecules can be employed to generate glass that operates in the vacuum ultraviolet and UV spectra due to their large energy band gap and high potential.10,11 Some new investigations on oxide perovskites have been conducted.12–14 Harmel et al.15 used density functional theory (DFT) to examine the characteristics of BaCsO3 oxide perovskites based on barium. They concluded that BaCsO3 will be suitable for electrooptic instruments because of its widespread direct band gap and bands of the imaginary constituent of the nonconducting features in the UV range. Daniel et al.16 demonstrated that the characteristics of LiBaO3 are effective for energy storage. Compounds with band gaps of >3.10 eV will be effective in the UV spectrum. SiSnO3 with intermetallic character and SiGeO3 with semiconductor properties are excellent candidates for electronic applications. Herein, with the help of DFT and the full-potential linear augmented plane wave (FP-LAPW) method, we discuss some fundamental characteristics of SiMO3 (M = Sn, Ge) oxide perovskites, providing insights for further research. These properties include structural, elastic, electronic, and optical properties.
2. Computational methodology
To calculate the above-mentioned characteristics, the FP-LAPW approach was used with the help of Wien2k software, and the results were discussed.17–22 We used the Trans-Blaha modified Becke–Johnson (TB-mBJ) technique, because it is useful in calculating the density of states (DOS) and optical and electronic properties.23 For the calculation of structural and elastic properties, generalized gradient approximation (GGA) and the exchange–correlation potential were applied as they are useful tools for such calculations.24 This study includes the investigation of some FP-LAPW base functions for which the value of muffin-tin radius (RMT) spheres was chosen to be 8. In our model, Kmax in the plane wave expansion is the magnitude of the supreme K points to attain a high degree of convergence. The RMT values for M and O are 2.38, 1.73, and 1.67 atomic units (a.u.), respectively. Within the muffin-tin spheres, the spherical harmonics were increased to lmax = 11, whereas the Fourier expanded charge density was decreased to Gmax = 12 (a.u.). The self-consistent field computations were considered to have converged, as the total energy dropped within the energy range of 0.0001 Ry. By equating the energy against volume curve, the equation of state by Birch–Murnaghan was used.25,26 To calculate the elastic constant used in analyzing the structural properties, we used the IRelast software.26 Additionally, we used the dielectric function ε(ω) to investigate the optical behavior of our selected crystals.27,28
3. Results and discussion
This section of the article provides a thorough scientific analysis of the results generated by our TB-mBJ potential approach. We will discuss structural and optical characteristics using this approach.
3.1 Structural properties
SiMO3 are the chosen crystals for investigation. The space group of our selected crystals is Pm![[3 with combining macron]](https://www.rsc.org/images/entities/char_0033_0304.gif) m number 221. It has a cubic unit cell structure comprising a single molecule and obeys the ABO3 formula, which means the crystals are oxide perovskites. The arrangement of atoms in the unit cell is such that Si atoms occupy (0, 0, 0) positions, M atoms at (1/2, ½, ½), and oxygen atoms at (0, 1/2, 1/2), (1/2, 0, 1/2), and (1/2, 1/2, 0), as shown in Fig. 1. We will compute the total energy around Vo in terms of the unit cell volume (the volume of the cell at the equilibrium point). For computing the volume optimization, to possibly predict the structural behavior of our selected crystals, we will utilize the Birch–Murnaghan's equation of state.25 To get the lowest stable unit cell, we will reduce the overall energy of the unit cell. The data derived from Birch–Murnaghan's equation of state are analytically estimated to predict the ground state characteristics of the unit cell. These include the equilibrium lattice constant ao, the bulk modulus B, and its pressure derivative B′.
m number 221. It has a cubic unit cell structure comprising a single molecule and obeys the ABO3 formula, which means the crystals are oxide perovskites. The arrangement of atoms in the unit cell is such that Si atoms occupy (0, 0, 0) positions, M atoms at (1/2, ½, ½), and oxygen atoms at (0, 1/2, 1/2), (1/2, 0, 1/2), and (1/2, 1/2, 0), as shown in Fig. 1. We will compute the total energy around Vo in terms of the unit cell volume (the volume of the cell at the equilibrium point). For computing the volume optimization, to possibly predict the structural behavior of our selected crystals, we will utilize the Birch–Murnaghan's equation of state.25 To get the lowest stable unit cell, we will reduce the overall energy of the unit cell. The data derived from Birch–Murnaghan's equation of state are analytically estimated to predict the ground state characteristics of the unit cell. These include the equilibrium lattice constant ao, the bulk modulus B, and its pressure derivative B′.
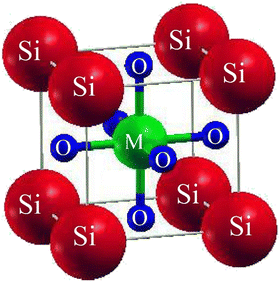 |
| | Fig. 1 Conventional cubic crystal structure of SiMO3 ternary molecules. | |
The minimum energy Eo, for which the volume gets its lowest value Vo, gives the actual minimum ground state of that particular compound. Those crystals that have more negative energy have more stable structures. The optimized structural parameters such as ao, Eo, Vo, Bo, and B′ are tabulated in Table 1. These results are reliable with the general trend indicating that as the bulk modulus drops, the lattice constant increases, which shows that the computed results are precise and accurate. The optimization graphs demonstrate that SiSnO3 has more negative energy, indicating more structurally stability than SiGeO3, as shown in Fig. 2 and Table 1.
Table 1 Optimized crystal unit cell computed data of SiMO3 molecules
| Compound |
a
o (Å) |
B (GPa) |
B′ |
V
0 (a.u.3) |
E
0 (Ry) |
| SiSnO3 |
3.72 |
202.32 |
4.59 |
346.37 |
−13390.08 |
| SiGeO3 |
3.61 |
221.05 |
4.47 |
318.70 |
−5229.98 |
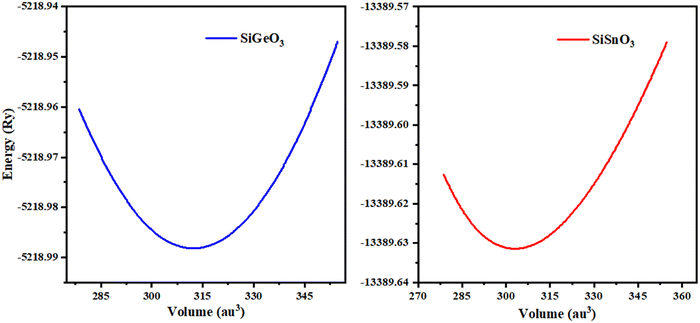 |
| | Fig. 2 Optimization curves of SiMO3 crystals fitted by Birch–Murnaghan's equation of state. | |
3.2 Electronic properties
Herein, we determine the real maps of the band structures, DOS, and arrangement of charge to analyze the electronic state of SiMO3 molecules. Local density approximation and GGA calculations significantly underestimate the essential band gaps of semiconductors and dielectrics.29,30 This is because the exchange–correlation energy and the charge derivative cannot be consistently reconstructed by the basic structure. TB-mBJ is effectively applied in various research reports14,31,32 and is selected to solve the underestimation of the band gaps. In the higher symmetry direction of the Brillouin zone, the energy-band structures obtained for the symmetric geometry of SiMO3 are shown in Fig. 3. The valence band and conduction band are separated by a horizontal line, which represents the Fermi energy level, EF. Above the Fermi level, there is the conduction band, and the valence band is shown below the Fermi level. According to Fig. 3a, SiSnO3 and SiGeO3 are semiconductors, because their energy band gaps lie between 0 and 3.1 eV. SiSnO3 has an indirect (M–X) energy state gap of 2.4 eV, and SiGeO3 has a direct (X–X) energy gap of 3.1 eV. We usually calculate the spin orbit coupling (SOC) for an element used in a compound having an atomic number of >50. We calculated the band structure using SOC calculation with TB-mBJ and found no change in the energy band gap in the band structures of both these compounds as shown in Fig. 3b.
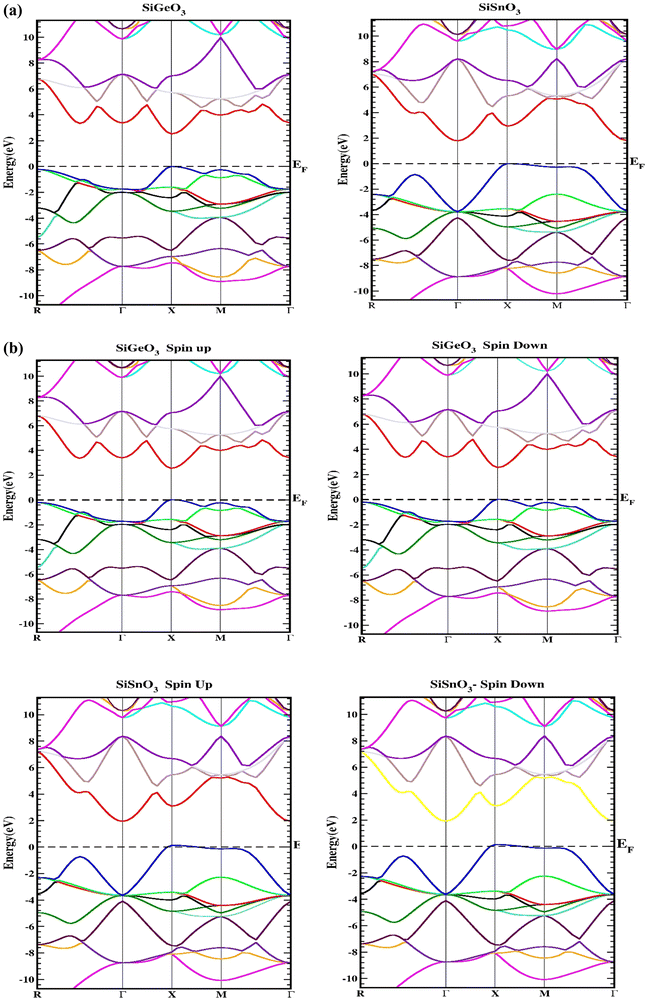 |
| | Fig. 3 (a) Representation of the band structures of SiMO3 using TB-mBJ approximation. (b) Representation of the band structures of SiMO3 using TB-mBJ with SOC. | |
To gain a greater understanding of the electronic states of SiMO3 crystals, the total density and partial density of states (TDOS and PDOS, respectively) are calculated as depicted in Fig. 4a. Each band consists of a vertical line representing a zero level, called the Fermi level. The left side of each band represents the valence band, whereas the right side is devoted to the conduction band. The roles of different electronic states in the valence and conduction bands are represented by their respective lines labeled in each graph of Fig. 4a. The energy range for the DOS of SiGeO3 is −12.5 to 7 eV, whereas for SiSnO3 is −9 to 7 eV. Some of the major influences of different states in the valence and conduction bands are explained as follows: First, we present the details of SiSnO3. The major contribution in the valence band is from O-tot, which is −4.4 to 0 eV, with the highest peak of 2.8 corresponding to −1 eV. Other peaks observed for the same states are 1.8, 2, and 2.6 at −1.5, −1.2, and −0.6 eV, respectively. The second highest contribution in the same band is from the Si-s state, with a value of 2 at −5.8 eV. The contributions from all other states are minor, such as the Sn-d state, whose value is approximately 0.2 in the energy range of −3.1 to 0.3 eV. For the same compound in the conduction band, the Si-p state has a maximum contribution from 3.2 to 5 eV with the highest peak of 3.3 at 4.5 eV. The contribution of O-tot is from 3.6 to 4.6 eV, having a peak of 0.4 at 4.5 eV. Secondly, an explanation of the DOS of SiGeO3 is as follows: The O-s state has a major contribution in the valence band with an energy range of −6 to 0 eV. It has different peaks at different energy levels, such as 0.5, 0.6, and 1.5 at −7.5, −6, and −2.5 eV, respectively. The Ge-s state in the same band has peaks of 0.7 and 0.8 at −7.5 and −1 eV, respectively. O-tot and Si-tot have some contribution, but it is minimal. Similarly, in the conduction band of SiGeO3, Ge-p has the highest contribution, with peaks 0.6 and 1.7 at 4.9 and 6 eV, respectively. Other contributions are from Ge-tot and O-s states, which have very small values.
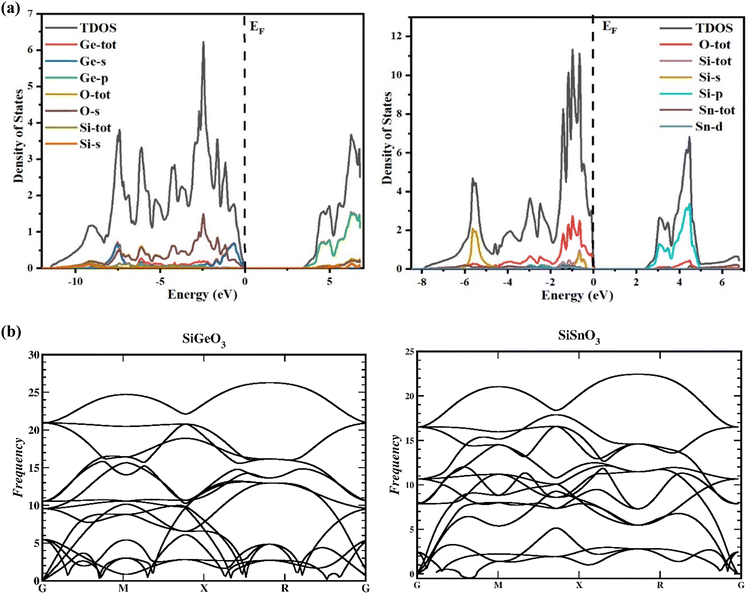 |
| | Fig. 4 (a) TDOS and PDOS of SiMO3 crystals using TB-mBJ approach. (b) Representation of the phonon band structures of SiMO3. | |
3.3 Elastic properties
The reactions to exterior forces by a particular compound are used to compute the flexible properties of that compound. The obtained data from such calculations give evidence regarding the stability and toughness of the crystal. By finding the components of stress tensor for tiny deformations and determining the energy in accordance with the lattice distortion that preserves the volume, the elastic factors of the compounds were determined with no pressure.33 For finding the elastic constants, the IRelast program was used with the help of the Wien2k software, thereby using all the particulars of the cubic system. The important elastic constants from which we can get detailed information of any cubic crystal system are C11, C12, and C44. These elastic constants are independent of each other and are presented in Table 2. To have a mechanically stable cubic crystal, the elastic constants should satisfy the following conditions: C11 > C12, C11 > 0, C44 > 0, C11 + 2C12 > 0, and B > zero.34 The phonon calculation, as depicted in Fig. 4b, demonstrate that there is no imaginary frequency and all the observed frequencies are real for SiSnO3 and SiGeO3, verifying that these compounds exhibit thermodynamic stability.35,36
Table 2 Few important constants of SiMO3 molecules
| Compound |
SiSnO3 |
SiGeO3 |
|
C
11
|
247.05 |
327.52 |
|
C
12
|
76.59 |
175.45 |
|
C
44
|
43.89 |
175.28 |
|
G
|
57.44 |
125.37 |
|
A
|
0.56 |
2.31 |
|
V
|
0.34 |
0.19 |
|
B/G |
2.99 |
1.37 |
The above-mentioned conditions are satisfied for our calculated elastic constants, indicating that these compounds are mechanically stable. According to our calculated data, the C11 value of SiSnO3 is 202.3236 GPa and that of SiGeO3 is 221.0451 GPa, which proves that SiGeO3 is to some extent stiffer than SiSnO3. Another parameter, known as the anisotropic constant, represented by A, gives information regarding the capacity of a crystal to produce small fractures. Engineers normally use this information to study the microscopic behavior of a crystal in response to external stress. The values of A for our selected compounds are calculated from the above-mentioned elastic constants with the help of the formula mentioned below.
The material will be isotropic if the value of
A = 1, otherwise it will be anisotropic. The calculated values of
A for both of our compounds are depicted in
Table 2.
Both the compounds are anisotropic, since the value of A deviates from 1 and the degree of variance reveals the degree of anisotropy. As it is clear from Table 2, the calculated value of A for SiSnO3 is 0.515 and that of SiGeO3 is 2.305, which shows that SiSnO3 is less anisotropic than SiGeO3. Other important parameters such as the Young's modulus represented by E, the shear modulus represented by G, and Poisson's ratio represented by v are calculated with the help of the elastic constants, tabulated in Table 2. Below are the formulae used to obtain these parameters.37–39
| |  | (2) |
| |  | (3) |
| |  | (4) |
| |  | (5) |
Ductility and brittleness are important characteristics in the study of the structure of any particular crystal. The Cauchy pressure, C11–C44, can indicate the ductility of a crystal.40 If the difference between these constants is positive, the material will be ductile, otherwise brittle. Both of our crystals have positive Cauchy pressures, 8.63382 GPa for SiSnO3 and 8.7825 GPa for SiGeO3, showing that they both exhibit ductility. Therefore, our selected SiMO3 crystals are mechanically ductile, anisotropic, tough, and fracture resistant. Materials with such characteristics have vast applications in the field of modern technology.
3.4 Optical properties
To calculate the optical properties of our selected crystals, we used incident photons with energy ranges from zero to 14 eV, using the estimated equilibrium lattice constant and the dielectric function ε(ω) to obtain all the optical characteristics of both crystals.
3.4.1 Dielectric function.
The dielectric function is represented by ε(ω) and given by the equation ε(ω) = ε1(ω) + iε2(ω). It consists of two parts. The first part represents the real part, and the second part represents the imaginary part. Fig. 5 demonstrates the distribution of incoming photons for the crystals and electronic polarizability. The real part of SiGeO3 starts from 4.3 at 0 eV and increases to 9.5 at 5.2 eV; it then decreases to 3.6 at 5.5 eV. At 6 eV, its value gets little greater and reaches 4, after which it decreases with fluctuating values and shows the lowest value of −1.9 at 9 eV, and its value reaches zero (approximately) at 12.5 eV. The imaginary part of the same crystal starts from zero at 0 eV and remains at zero until it reaches an energy value of 3.5 eV. It then increases to the highest value of 8 at 5.5 eV. Other peaks observed for the same part of the same compound are 7.5, 4, and 1.7 at 6, 9, and 13.5 eV, respectively. It is also clear from the same graph that the real part of SiSnO3 shows a value of 4.4 at 0 eV, and upon increasing the energy, its value increases to a maximum value of 7.6 at 4.5 eV. The graph summarizes that the value remains fluctuating until 14 eV with the following peaks: 5.5, 1.7, 0.1, and −2.5 at 5.3, 7.5, 9.5, and 13.5 eV, respectively. The imaginary part of the same compound is depicted in the same graph, starting from 0 at 0 eV, and has the same value up to the energy value of 3 eV. Further, its value increases to 7.8 at 5 eV and decreases to 4 at 4.5 eV, then increases again to 7.9 at 6.3 eV; we observe peaks at 5.8, 3.2, 3.5, 2.4, and 1.8 at 7.5, 9.5, 10, 11.6, and 13.5 eV, respectively. According to the Penn model, those crystals with a greater energy band gap result in smaller values of the static dielectric function.41–45Fig. 5 demonstrates that the behavior of the real parts of both crystals shows similar behavior at low, intermediate, and higher energies, and the same behavior is shown by their respective imaginary parts of the dielectric function ε(ω).
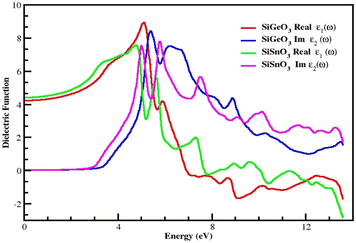 |
| | Fig. 5 Dielectric function ε(ω) of SiMO3 molecules. | |
3.4.2 Refractive indices.
From the calculated values of ε1(ω) and ε2(ω), we can derive values of different parameters for the calculation of different optical properties of any crystal, such as the refractive index represented by η(ω), conductivity represented by σ(ω), absorption coefficient represented by I(ω), and reflectivity represented by R(ω). Fig. 6 represents the computationally calculated values of the refractive indices of SiMO3 crystals. The refractive index at 0.0 eV, η(0), for SiGeO3 is 2.1 and that of SiSnO3 is 0.4. There is a large gap between the refractive indices η(ω) of both the compounds at all energies. Some prominent peaks of the refractive index of SiSnO3 are 3.2, 1.5, and 0.7 at 5, 8.7, and 13.5 eV, respectively. The refractive index peaks of SiGeO3 are 0.5, 0.4, and 0.5 at 5.5, 12, and 13.5 eV, respectively. The computed data analysis demonstrates that the refractive index of SiSnO3 is >1, with a photon energy of ≤9.5 eV; compounds that possess large number of electrons are normally more refractive. Thus, any process which increases the electron density increases the refractive index.
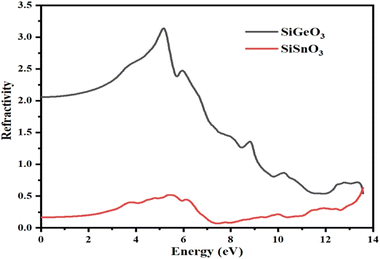 |
| | Fig. 6 Calculated refractive indices of compounds SiMO3. | |
3.4.3 Absorption coefficient.
The absorption coefficient, I(ω), was calculated from the dielectric function, ε(ω), as shown in Fig. 7. It is evident that at 0 eV, both compounds have zero absorption coefficients, and they are zero until 2.7 eV for SiSnO3 and 3.4 eV for SiGeO3. This means that the threshold energy for SiSnO3 is 2.7 eV and that for SiGeO3 is 3.4 eV. Further, the absorptivity of both the compounds is nonzero and remains >45 for until 14 eV. The fluctuating values of I(ω) for SiSnO3 are 140, 45, 100, 150, and 220 at 4.9, 7.3, 9.9, 11.3, and 13.5 eV, respectively. For SiGeO3, the peaks are 70, 130, 150, and 195 at 5.5, 6.8, 9, and 13.5 eV, respectively. Therefore, from 2 to 6 eV, SiSnO3 has good absorptivity; from 6 to 11.5 eV, SiGeO3 has better absorptivity; and after that SiSnO3 again has better absorptivity.
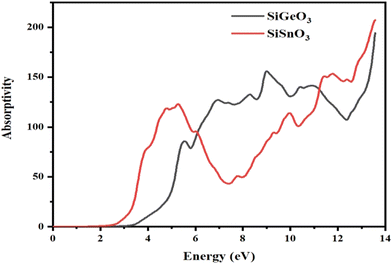 |
| | Fig. 7 Calculated absorption coefficient of crystals SiMO3. | |
3.4.4 Reflectivity.
The reflectivity of the crystals, R(ω), is derived from the dielectric function. The threshold values of both the compounds are nonzero and are 0.15 and 0.18 for SiGeO3 and SiSnO3, respectively. Some observed peaks for SiSnO3 are 0.4, 0.51, and 0.66 at 3.6, 5.4, and 13.5 eV, respectively. For SiGeO3, prominent peaks are 0.32, 0.35, 0.41, 0.42, and 0.55 at 5.3, 7, 9.1, 11.5, and 13.5 eV, respectively. The reflectances at zero-frequency R(0) for SiSnO3 and SiGeO3 are 0.54 and 0.72, respectively. The greater the reflectivity of the crystal, the lesser the transparency. Upon comparing the reflectivity of both these compounds, SiGeO3 is more transparent before 6.5 eV, after which SiSnO3 is more transparent until 12 eV, and from 12 to 14 eV, SiGeO3 is more transparent again as is depicted in Fig. 8. Those materials which have good transparency are recommended in making efficient lens materials.
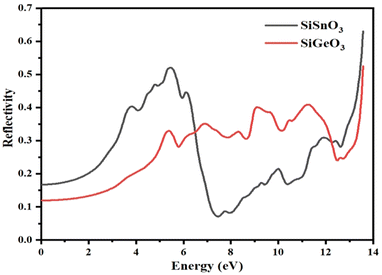 |
| | Fig. 8 Reflectivity R(ω) of incident light from the SiMO3 crystals. | |
3.4.5 Optical conductivity.
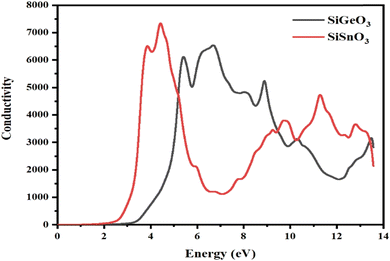
The optical conductivity σ(ω) is defined as the relationship between the induced current density and the absolute value of the induced electric field in the substance, at any particular frequency for any specific material. This property is used to represent the photon conduction inside a material. With the help of the dielectric function, as depicted in Fig. 9, for both of our selected crystals, the photon conductivity is zero at 0 eV and remains zero up to 2.4 eV, then the value for SiSnO3 increases to 6700 at 3.4 eV and to the highest value of 7600 at 4.4 eV. Meanwhile, for SiGeO3, the value remains zero until 3.1 eV; the value of the conductivity reaches 6400, 5000, 6600, 5400, 3100, and 3200 at 5.3, 5.9, 6.9, 8.8, 10.5, and 13.4 eV, respectively. Similarly, the value of the photon conductivity for SiSnO3 decreases to 1000 from 7600 at 7 eV and increases to 4200 at 10 eV. After that, it decreases slightly at 10.3 eV, then another peak of 5000 at 12.5 eV. Therefore, in the energy range of 2.2 to 5 eV, SiGeO3 is more conductive, whereas in the energy range of 5 to 9.5 eV, SiSnO3 is more conductive, after which the situation reverses until 13.5 eV.
 |
| | Fig. 9 The optical conductivity σ(ω) through SiMO3 (M = Sn and Ge) compounds. | |
3.4.6 Energy loss function (ELF).
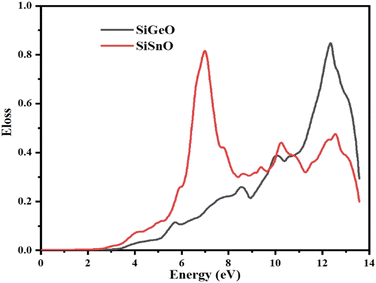
The ELF demonstrates the energy lost by an electron when it moves through a particular compound. The same function may be used to define intraband, interband, and plasmon interdependence. Herein, the calculated energy loss by an electron as shown in Fig. 10 indicates that the ELF values for both of our selected compounds are zero from 0 to ∼2.9 eV. For SiGeO3, the value remains zero until 3.5 eV. For SiSnO3, after 2.9 eV, the value increases and reaches the highest value of 0.88 at 7 eV and decreases to 0.35 at 8.3 eV; other peaks are 0.44, 0.36, and 0.45 at 10.3, 11.2, and 12.5 eV, respectively. For SiGeO3, the value of the ELF increases continuously from 3.5 to 12.2 eV at a varying rate with the following peaks: 0.12, 0.26, 0.39, and 0.9 at 5.8, 8.5, 10.1, and 12.2 eV, respectively. Thus, at low energy, both compounds do not absorb any electron energy; at the intermediate level, i.e., from 6 to 8.2 eV, SiSnO3 is an excellent absorber of electron energy; whereas at higher energies, i.e., from 10 to 12.2 eV, SiGeO3 is a good absorber.
 |
| | Fig. 10 Representation of the function for the loss of optical energy L(ω) of SiMO3. | |
4. Conclusion
We computed the elastic, structural, optical, and electrical properties of SiMO3 crystals. Harmony and coherence make our results more precise. Structural characteristics show that SiMO3 crystals are cubic and stable. The basic elastic constant, anisotropy factor, Poison ratio, ductility, Cauchy pressure, shear modulus, Pugh ratio, and Young modulus are predicted by IRelast. Based on these fundamental elastic properties, both materials are ductile, anisotropic, elastically stable, and scratch resistant. These studies proved that these crystals can be employed in several electronics applications. The calculation of SOC with TB-mBJ demonstrated that SiGeO3 is a semiconductor, and SiSnO3 exhibits intermetallic properties. The TDOS and PDOS results are as follows: O-tot, with a peak of 2.8 at −1 eV, dominates SiSnO3's valence band. The same states have maxima at 1.8, 2, and 2.6 at −1.5, −1.2, and −0.6 eV, respectively. The Si-s state contributes 2 at −5.8 eV. The Si-p state contributes most to the conduction band of the same crystal, with a peak of 3.3 at 4.5 eV. The contribution of O-tot is from 3.6 to 4.6 eV, with a peak of 0.4 at 4.5 eV. For SiGeO3, in the valence band, the O-s state has the major contribution in the energy range from −6 to 0 eV. It has different peaks at different energy levels, such as 0.5, 0.6, and 1.5 at −7.5, −6, and −2.5 eV, respectively. The Ge-s state in the same band has peaks of 0.7 and 0.8 at −7.5 and −1 eV, respectively. In the conduction band, Ge-p has the largest contribution with peaks of 0.6 and 1.7 at 4.9 and 6 eV, respectively. Further, due to a low absorption coefficient, optical property analysis demonstrated that SiSnO3 and SiGeO3 can be used in high-frequency UV devices. To the best of our knowledge, this is the first DFT-based examination of the characteristics of these crystals.
Data availability
This manuscript has no associated data.
Conflicts of interest
The authors have no conflict of interest.
Acknowledgements
This work was supported by the King Khalid University, Abha, Saudi Arabia. The authors extend their appreciation to the Deanship of Scientific Research at King Khalid University for funding this work through Large Groups Project under grant number (R.G.P. 2/43/44).
References
- T. Nishimatsu, N. Terakubo, H. Mizuseki, Y. Kawazoe, D. A. Pawlak, K. Shimamura and T. Fukuda, Band structures of perovskite-like fluorides for vacuum-ultraviolet-transparent lens materials, Jpn. J. Appl. Phys., 2002, 41, L365 CrossRef CAS.
- C. Dotzler, G. Williams and A. Edgar, RbCdF3:Mn2+: a potential ultraviolet dosimeter material, Appl. Phys. Lett., 2007, 91, 181909 CrossRef.
- G. Vaitheeswaran, V. Kanchana, R. S. Kumar, A. L. Cornelius, M. F. Nicol, A. Svane, A. Delin and B. Johansson, High-pressure structural, elastic, and electronic properties of the scintillator host material KMgF3, Phys. Rev. B: Condens. Matter Mater. Phys., 2007, 76, 14107 CrossRef.
- S. Naeem, G. Murtaza, R. Khenata and M. Khalid, First principle study of CsSrM3 (M = F, Cl), Phys. B, 2013, 414, 91–96 CrossRef.
- A. Mubarak,
Ab initio study of the structural, electronic and optical properties of the fluoropervskite SrXF3 (X = Li, Na, K and Rb) compounds, Comput. Mater. Sci., 2014, 81, 478–482 CrossRef CAS.
- A. Mubarak and S. Al-Omari, First-principles calculations of two cubic fluoropervskite compounds: RbFeF3 and RbNiF3, J. Magn. Magn. Mater., 2015, 382, 211–218 CrossRef CAS.
- R. Khan, K. Althubeiti, M. Algethami, N. Rahman, M. Sohail, Q. Mao, Q. Zaman, A. Ullah, N. Ilyas and A. Afzal,
et al., Observation of quantum criticality in antiferromagnetic based (Ce1−xYx)2Ir3Ge5 Kondo-lattice system, J. Magn. Magn. Mater., 2022, 556, 169361 CrossRef CAS.
- N. Dimov, A. Nishimura, K. Chihara, A. Kitajou, I. D. Gocheva and S. Okada, Transition metal NaMF3 compounds as model systems for studying the feasibility of ternary Li-MF and Na-MF single phases as cathodes for lithium–ion and sodium–ion batteries, Electrochim. Acta, 2013, 110, 214–220 CrossRef CAS.
-
J. Donaldson, S. G. Williams and S. Raymond, Characterization of a fluoroperovskite based fibre coupled optical dosimeter for radiotherapy, Annual Condensed matter and materials meeting, 2014.
- K. Shimamura, T. Fujita, H. Sato, A. Bensalah, N. Sarukura and T. Fukuda, Growth and characterization of KMgF3 single crystals by the Czochralski technique under CF4 atmosphere, Jpn. J. Appl. Phys., 2000, 39, 6807 CrossRef CAS.
- A. Bensalah, K. Shimamura, K. Nakano, T. Fujita and T. Fukuda, Growth and characterization of LiSrGaF6 single crystal, J. Cryst. Growth, 2001, 231, 143–147 CrossRef CAS.
- M. Husain, M. S. Ahmad, N. Rahman, M. Sajjad, A. Rauf, A. Habib, H. Mahmood, M. Nisar, A. Hussain and M. Imran,
et al., First principle study of the structural, electronic, and Mechanical properties of cubic fluoroperovskites: (ZnXF3, X = Y, Bi), Fluoride, 2020, 53, 657–667 Search PubMed.
- M. S. Ahmad, A. Habib, A. Rauf, M. U. Haq, J. Saddique, M. Nisar, S. Shah, C. Maouche, S. Zulfiqar and M. U. Rehman,
et al., Theoretical investigation of the structural,electronic and mechanical properties of the magnesium-based fluoroperovskite compounds XMgF3 (X = Ga, Al, In), Theor. Invest., 2020, 1, 542–553 Search PubMed.
- N. Rahman, M. Husain, J. Yang, M. Sajjad, G. Murtaza, M. U. Haq, A. Habib, R. A. Zulfiqar, A. Karim and M. Nisar,
et al., First principle study of structural, electronic, optical and mechanical properties of cubic fluoro-perovskites: (CdXF3, X = Y, Bi), Eur. Phys. J. Plus, 2021, 136, 1–11 CrossRef.
- M. Harmel, H. Khachai, A. Haddou, R. Khenata, G. Murtaza, B. Abbar, S. Binomran and M. Khalfa,
Ab initio study of the mechanical, thermal and optoelectronic properties of the cubic CsBaF3, Acta Phys. Pol., 2015, 128, 34–42 CrossRef CAS.
- D. J. Daniel, U. Madhusoodanan, R. Nithya and P. Ramasamy, Irradiation effect on luminescence properties of fluoroperovskite single crystal (LiBaF3:Eu2+), Radiat. Phys. Chem., 2014, 96, 135–139 CrossRef CAS.
- M. Maqbool, I. Ahmad, H. Richardson and M. Kordesch, Direct ultraviolet excitation of an amorphous AlN: Praseodymium phosphor by codoped Gd3+ cathodoluminescence, Appl. Phys. Lett., 2007, 91, 193511 CrossRef.
- G. Murtaza and I. Ahmad, Shift of indirect to direct bandgap and optical response of LaAlO3 under pressure, J. Appl. Phys., 2012, 111, 123116 CrossRef.
- G. Murtaza, I. Ahmad, B. Amin, A. Afaq, M. Maqbool, J. Maqssod, I. Khan and M. Zahid, Investigation of structural and optoelectronic properties of BaThO3, Opt. Mater., 2011, 33, 553–557 CrossRef CAS.
- J. Saddique, M. Husain, N. Rahman, R. Khan, S. Zulfiqar, A. Iqbal, M. Sohail, S. Ali Khattak, S. Naz Khan and A. Ali Khan,
et al., Modeling structural, elastic, electronic and optical properties of ternary cubic barium based fluoroperovskites MBaF3 (M = Ga and In) compounds based on DFT, Mater. Sci. Semicond. Process., 2022, 139, 106345 CrossRef CAS.
- G. K. Madsen, P. Blaha, K. Schwarz, E. Sjostedt and L. Nordstrom, Efficient linearization of the augmented plane-wave method, Phys. Rev. B: Condens. Matter Mater. Phys., 2001, 64, 195134 CrossRef.
- J. P. Perdew, K. Burke and M. Ernzerhof, Generalized gradient approximation made simple, Phys. Rev. Lett., 1996, 77, 3865 CrossRef CAS.
- F. Tran and P. Blaha, Accurate band gaps of semiconductors and insulators with a semilocal exchange-correlation potential, Phys. Rev. Lett., 2009, 102, 226401 CrossRef.
- F. Murnaghan, The compressibility of media under extreme pressures, Proc. Natl. Acad. Sci. U. S. A., 1944, 30, 244 CrossRef CAS.
- M. Jamal, M. Bilal, I. Ahmad and S. Jalali-Asadabadi, IRelast package, J. Alloys Compd., 2018, 735, 569–579 CrossRef CAS.
- J. Bechhoefer, Kramers–kronig, bode, and the meaning of zero, Am. J. Phys., 2011, 79, 1053–1059 CrossRef.
- C. C. Kim, J. Garland and P. Raccah, Modeling the optical dielectric function of the alloy system AlxGa1x as, Phys. Rev. B: Condens. Matter Mater. Phys., 1993, 47, 1876 CrossRef CAS.
- P. Dufek, P. Blaha and K. Schwarz, Applications of Engel and Vosko's generalized gradient approximation in solids, Phys. Rev. B: Condens. Matter Mater. Phys., 1994, 50, 7279 CrossRef CAS.
- Z. Charifi, H. Baaziz, F. E. H. Hassan and N. Bouarissa, High pressure study of structural and electronic properties of calcium chalcogenides, J. Phys.: Condens. Matter, 2005, 17, 4083 CrossRef CAS.
- M. A. Ali, N. Alam, S. Meena Ali, S. A. Dar, A. Khan, G. Murtaza and A. Laref, A theoretical study of the structural, thermoelectric, and spin-orbit coupling influenced optoelectronic properties of CsTmCl3 halide perovskite, Int. J. Quantum Chem., 2020, 120, 26141 CrossRef.
-
A. Mohamed, A. El Houssine, F. Nejmaa and B. Ibrahim, Ab initio study of electronic, optical and thermoelectric properties of TiO2 phases using mBJ approximation, In Proceedings of the 2020 IEEE 6th International Conference on Optimization and Applications. ICOA 2020, pp. 1–5.
- M. J. Mehl, Pressure dependence of the elastic moduli in aluminum-rich Al-Li compounds, Phys. Rev. B: Condens. Matter Mater. Phys., 1993, 47, 2493 CrossRef CAS.
- J. Wang, S. Yip, S. Phillpot and D. Wolf, Crystal instabilities at finite strain, Phys. Rev. Lett., 1993, 71, 4182 CrossRef CAS.
- R. Hill, The elastic behaviour of a crystalline aggregate, Proc. Phys. Soc., London, Sect. A, 1952, 65, 349 CrossRef.
-
W. Voigt, Lehrbuch der Kristallphysik (Textbook of crystal physics), BG Teubner, Leipzig and Berlin, 1928 Search PubMed.
- G. Ding, X. Chengwu, J. Bai, C. Zhenxiang, W. Xiaotian and W. Weikang, Recipe for single-pair-Weyl-points phonons carrying the same chiral charges, Phys. Rev. B, 2023, 108, L020302 CrossRef CAS.
- G. Ding, X. Chengwu, G. Jialin, J. Wang, J. Bai, W. Wang, D. Li, X.-P. Li and X. Wang, Exotic topological phonon modes in semiconductors: Symmetry analysis and first-principles calculations for representative examples, Phys. Rev. B, 2023, 108, 075201 CrossRef CAS.
- A. A. A. Russ, The origin of rheology, Mater. Phys., 1929, 49 Search PubMed.
- D. Pettifor, Theoretical predictions of structure and related properties of intermetallics, Mater. Sci. Technol., 1992, 8, 345–349 CrossRef CAS.
- S. X. C. I. I. Pugh, Relations between the elastic moduli and the plastic properties of polycrystalline pure metals, London, Edinburgh Dublin Philos. Mag. J. Sci., 1954, 45, 823–843 CrossRef CAS.
-
I. Frantsevich, Elastic constants and elastic moduli of metals and insulators hand book, In Reference Book, 1982.
- D. R. Penn, Electron mean-free-path calculations using a model dielectric function, Phys. Rev. B: Condens. Matter Mater. Phys., 1987, 35, 482 CrossRef CAS.
- M. Naseri, J. Jalilian and A. H. Reshak, Electronic and optical properties of pentagonal-B2C monolayer: a first-principlescalculation, Int. J. Mod. Phys. B, 2017, 31, 1750044 CrossRef CAS.
- J. Wang, H. Yuan, Y. Liu, X. Wang and G. Zhang, Multiple dimensions of spin-gapless semiconducting states in tetragonal Sr2CuF6, Phys. Rev. B, 2022, 106, L060407 CrossRef CAS.
- J. Wang, H. Yuan, W. Wang, G. Ding, X.-P. Li and X. Wang, Fully spin-polarized hourglass charge-three Weyl points and sextuple-helicoid surface arcs in P6322-type BaNiIO6, Phys. Rev. B, 2023, 108, 054424 CrossRef CAS.
|
| This journal is © The Royal Society of Chemistry 2023 |
Click here to see how this site uses Cookies. View our privacy policy here.  Open Access Article
 *a,
Nasir
Rahman
b,
Rajwali
Khan
b,
Omar H.
Alsalmi
c,
Dilsora
Abduvalieva
d,
Khamael M.
Abualnaja
e,
Atef
El Jery
f and
Mouataz
Adrdery
f
![[3 with combining macron]](https://www.rsc.org/images/entities/char_0033_0304.gif) m number 221. It has a cubic unit cell structure comprising a single molecule and obeys the ABO3 formula, which means the crystals are oxide perovskites. The arrangement of atoms in the unit cell is such that Si atoms occupy (0, 0, 0) positions, M atoms at (1/2, ½, ½), and oxygen atoms at (0, 1/2, 1/2), (1/2, 0, 1/2), and (1/2, 1/2, 0), as shown in Fig. 1. We will compute the total energy around Vo in terms of the unit cell volume (the volume of the cell at the equilibrium point). For computing the volume optimization, to possibly predict the structural behavior of our selected crystals, we will utilize the Birch–Murnaghan's equation of state.25 To get the lowest stable unit cell, we will reduce the overall energy of the unit cell. The data derived from Birch–Murnaghan's equation of state are analytically estimated to predict the ground state characteristics of the unit cell. These include the equilibrium lattice constant ao, the bulk modulus B, and its pressure derivative B′.
m number 221. It has a cubic unit cell structure comprising a single molecule and obeys the ABO3 formula, which means the crystals are oxide perovskites. The arrangement of atoms in the unit cell is such that Si atoms occupy (0, 0, 0) positions, M atoms at (1/2, ½, ½), and oxygen atoms at (0, 1/2, 1/2), (1/2, 0, 1/2), and (1/2, 1/2, 0), as shown in Fig. 1. We will compute the total energy around Vo in terms of the unit cell volume (the volume of the cell at the equilibrium point). For computing the volume optimization, to possibly predict the structural behavior of our selected crystals, we will utilize the Birch–Murnaghan's equation of state.25 To get the lowest stable unit cell, we will reduce the overall energy of the unit cell. The data derived from Birch–Murnaghan's equation of state are analytically estimated to predict the ground state characteristics of the unit cell. These include the equilibrium lattice constant ao, the bulk modulus B, and its pressure derivative B′.


