
 Open Access Article
 This Open Access Article is licensed under a
 Creative Commons Attribution 3.0 Unported Licence
Analytical electron microscopy study of the composition of BaHfO3 nanoparticles in REBCO films: the influence of rare-earth ionic radii and REBCO composition†
Lukas
Grünewald‡
 a,
Pablo
Cayado‡
*bc,
Manuela
Erbe
b,
Jens
Hänisch
*b,
Bernhard
Holzapfel
b and
Dagmar
Gerthsen
a
a,
Pablo
Cayado‡
*bc,
Manuela
Erbe
b,
Jens
Hänisch
*b,
Bernhard
Holzapfel
b and
Dagmar
Gerthsen
a
aKarlsruhe Institute of Technology (KIT), Laboratory for Electron Microscopy (LEM), Karlsruhe, Germany
bKarlsruhe Institute of Technology (KIT), Institute for Technical Physics (ITEP), Eggenstein-Leopoldshafen, Germany. E-mail: jens.haenisch@kit.edu
cUniversity of Geneva, Department of Quantum Matter Physics (DQMP), Quai Ernest-Ansermet 24, 1211 Geneva, Switzerland. E-mail: pablo.cayado@unige.ch
First published on 28th September 2023
Abstract
The critical current density of superconducting rare-earth barium copper oxide (REBCO) thin films is enhanced by adding nanoparticles to generate artificial pinning centers. Barium-based perovskites are popular nanoparticle materials. Although typically considered chemically unreactive in the surrounding REBCO matrix, previous studies have shown experimental evidence for rare-earth element (REE) incorporation from REBCO into the nanoparticles. However, not much is currently known about this chemical interaction. Here we apply analytical electron microscopy to study the mixing of REEs into BaHfO3(BHO) nanoparticles. We find that the REE mixing into BHO depends on the ionic radius and the REE content of the REBCO phase. We investigate various REBCO films with different REE compositions (single and mixed REEs) and the same BHO nanoparticle concentration produced with chemical solution deposition. REEs with smaller ionic radii are more likely to be incorporated into BHO with a preferential substitution at the Hf site. As a result, REBCO films with a mixed-REE composition show an apparent disparity in REE–BHO intermixing. Our results demonstrate that REE–BHO intermixing is predictable and should be accounted for during REBCO fabrication. These insights are likely to apply to other barium-based perovskite nanoparticles and REBCO fabrication techniques and help to optimize REBCO performance.
Introduction
Rare-earth (RE) barium copper oxides REBa2Cu3O7−δ (REBCO) are a class of high-temperature superconductors.1 The most prominent REBCO superconductor is YBa2Cu3O7−δ, with a critical temperature Tc of 93 K.2 However, other RE elements (REEs) besides Y can be used for high-quality REBCO films3,4 (denoted as “single-REE” films in this work). Biaxially textured REBCO thin films coated on technical substrates (coated conductors) have potential technical applications such as low-T high-field magnets, detectors, or fault-current limiters.5–9 However, further improvements of the superconducting properties, such as the critical current density Jc and a better understanding and control of the fabrication process of REBCO, are desired.10A common way to increase Jc in a type-II superconductor such as REBCO is the introduction of nanoscale non-superconducting regions as pinning centers. Nanoparticles, e.g. BaHfO3,11–13 introduce microstructural defects that act as artificial pinning centers (APCs).14 The latter prevent the movement of flux lines that penetrate a type-II superconductor in the application-relevant temperature range, thereby increasing Jc.14 The effectiveness of APCs depends on their size, shape, orientation, and density as well as on the operating conditions, such as the temperature and direction of an external magnetic field.15 For example, nanoparticles (3D) are typically more favorable at higher operating temperatures and low magnetic fields, whereas point defects (0D) may be more beneficial at lower temperatures and high magnetic fields,10,15 although this is still under debate.16
To achieve better low-T performance, REBCO compounds with a mixture of different REEs, i.e., at least two different REEs to form (REE1,REE2,…)BCO compounds (denoted as “mixed-REE” films in this work), are intensively studied. Atomic disorder in such mixed-REE films can result in point defects leading to effective low-T pinning.17–20 Point defects are assumed to arise from REE-Ba cation exchange3,21,22 or locally introduced strain due different ionic radii of various REEs.23 However, the fabrication of mixed-REE films is often more complicated than single-REE films since each REE typically has a different set of optimal fabrication parameters. The fabrication complexity increases with an increased number of REEs in the mixed-REE REBCO phase. Commonly, two or three different REEs17,18,20,24–27 are used. Recent works on high-entropy oxides28 showed the successful fabrication of mixed-REE REBCO compounds with more than three REEs.29–33
Besides optimizing process parameters for different REEs, an additional complication for nanocomposite fabrication arises from incorporating nanoparticles into single- or mixed-REE films. Many studies have observed that popular nanoparticle materials, such as the barium-based perovskites BaMO3 (BMO, M = Hf, Zr, Sn, Ti,…), can interact with the surrounding REBCO phase by incorporating REEs,34–40 which is typically considered an unwanted side effect due to an uncontrolled “loss” of REEs from the REBCO phase into the perovskite nanoparticles. For example, MacManus-Driscoll et al.34 observed reflections in their X-ray diffraction measurements of a YBCO–BaZrO3 nanocomposite, which could stem from Ba2Zr2−xYxO6−δ and Ba(Zr1−xYx)O3−δ. A TEM study by Yamada et al.36,41 showed the formation of Ba(Nb0.5Er0.5)O3 in ErBCO films with added BaNb2O6. More recently, chemical analysis using scanning transmission electron microscopy (STEM) combined with energy-dispersive X-ray spectroscopy (EDXS) by Díez-Sierra et al.38 revealed an intermixing of Y with BaZrO3 (BZO) and BaHfO3(BHO) nanoparticles in a YBCO matrix. They concluded that the mixing affects the coarsening of nanoparticles in their films. Similarly, Majkic et al.40 also detected Gd and Y signals in the BaZrO3 nanoparticles embedded in a (Gd,Y)BCO film using STEM-EDXS. High-resolution aberration-corrected STEM-EDXS mapping showed a clear Y signal on the Zr site (Gd not being as apparent), which suggests the formation of Ba2+(Zr4+,REE3+)O3−δ.
These examples show that REEs can be incorporated into BMO nanoparticles typically used as APCs in REBCO films. As a result, the REE concentration in REBCO is altered by introducing nanoparticles. Indeed, REE-doped barium-oxide perovskites are studied in different scientific contexts.42–46 This work considers four possible lattice sites (REE and Ba in REBCO, and Ba and Hf in BHO) for the REEs in REBCO–BHO nanocomposites as schematically shown in Fig. 1 using the atomic structure of REBCO and BHO. The oxidation state and coordination number (CN) of the possible substitution sites are shown since they determine the effective ionic radii.
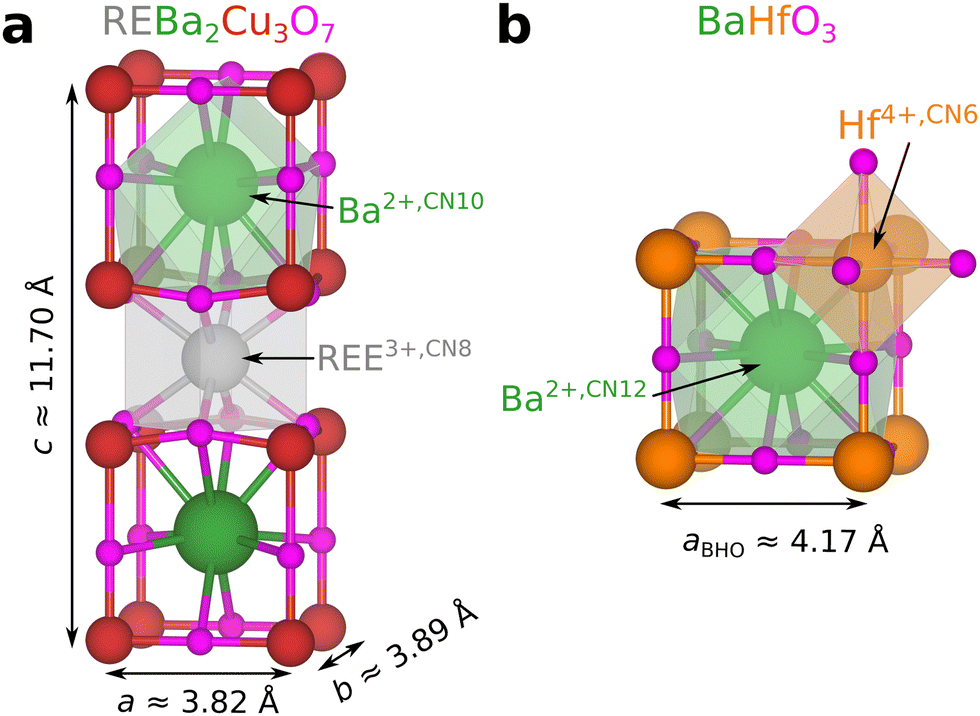 | ||
| Fig. 1 Crystal structures for (a) orthorhombic REBa2Cu3O7 (based on ICSD 4411347) and (b) cubic BaHfO3 (based on ICSD 9004948 and edited according to ref. 49). The exact lattice parameters of REBa2Cu3O7−δ depend on the rare-earth element and the oxygen stoichiometry. The polyhedra show the bonding environments for selected elements for the given coordination numbers (CN). Structures were edited and visualized using VESTA.50 The displayed atom sizes do not represent the actual ionic radii. | ||
The interplay between REEs and the nanoparticle material should be considered in optimizing REBCO nanocomposite fabrication. However, only little is known about the mixing behavior of REEs with BMO (or other) nanoparticle materials embedded in REBCO films.
To address this issue, we present a detailed electron microscopy study of the REE-dependent intermixing between different REEs and BHO nanoparticles in single- and mixed-REE films grown by chemical solution deposition (CSD). We analyze the chemical composition of different nanocomposite films using STEM imaging, EDXS, and electron energy-loss spectroscopy (EELS). We observe that the intermixing depends (i) on the ionic radii of the REEs and (ii) on the number of different REEs in mixed-REE REBCO compounds.
This work is structured in the following way: after describing the methods, we present a detailed analysis of a (Gd,Dy,Y,Ho,Er)BCO film to establish the experimental procedure used to analyze the embedded BHO nanoparticles. Afterward, we show and compare the results with other REBCO films. Then, a discussion on the observed REE-nanoparticle intermixing follows based on the Goldschmidt tolerance factor for perovskite phase stability.
Experimental methods
Thin-film fabrication by chemical-solution deposition
A detailed description of the procedure to prepare the chemical solution employed in this work can be found in ref. 11, 33 and 51. In short, the solutions to deposit the REBCO + 12 mol% BHO films are prepared by mixing the individual solutions of every single REBCO previously prepared according to the desired stoichiometry of the final REBCO films. The specific details of preparing the different REBCO-trifluoroacetate (TFA) solutions can be found in ref. 11. The precursor salts (acetates for REE, Ba, and Cu, purity >99.99%, hafnium(IV) 2,4-pentanedionate (Hf(acac)4); 97+%, all Alfa Aesar) are mixed with deionized water and trifluoroacetic acid (99.5+%, Alfa Aesar) in a stoichiometric ratio of 1![[thin space (1/6-em)]](https://www.rsc.org/images/entities/char_2009.gif) :2.136:3:0.136 for REE, Ba, Cu, and Hf, which equals a concentration of 12 mol% Hf with regard to the REE, or a final film of (REBa2Cu3O7−δ)0.88(BaHfO3)0.12, respectively. This mixture is dried using a rotary evaporator and then re-dissolved in anhydrous methanol (99.9%). The volume of the final solution is adjusted with methanol for a final RE cation concentration of 0.25 mol l−1.
:2.136:3:0.136 for REE, Ba, Cu, and Hf, which equals a concentration of 12 mol% Hf with regard to the REE, or a final film of (REBa2Cu3O7−δ)0.88(BaHfO3)0.12, respectively. This mixture is dried using a rotary evaporator and then re-dissolved in anhydrous methanol (99.9%). The volume of the final solution is adjusted with methanol for a final RE cation concentration of 0.25 mol l−1.
The solutions were deposited by spin coating (6000 rpm for 30 s) on 10 × 10 mm2 (100)-oriented SrTiO3(STO) or LaAlO3(LAO) single-crystal substrates. The REE distribution in the REBCO–BHO nanocomposites – which is of main interest in this work – is assumed to not be influenced by the substrate choice. However, the sharpness of the REBCO texture and the density of the crystalline defects can vary between REBCO samples grown on STO and LAO.33 The subsequent pyrolysis and growth (including oxygenation under oxygen partial pressure pO2) were carried out in a tubular furnace following the thermal profiles reported in ref. 51 (see also Table 1).
| Sample acronym | REE mixture | Substrate | Film thickness (nm) | Average nanoparticle size (nm) | T cryst (°C) | p O2 (ppm) | T c (K) | J sfc (77 K) (MA cm−2) |
|---|---|---|---|---|---|---|---|---|
| 5-REBCO | (Gd0.2Dy0.2Y0.2Ho0.2Er0.2) | STO | 220 | 24.6 (6.9) | 810 | 50 | 91.9 | 3.5 |
| 3-REBCO | (Y1/3Ho1/3Er1/3) | STO | 350 | 28.2 (9.8) | 790 | 200 | 89.2 | 5.5 |
| SmBCO | Sm | LAO | 220 | 20.5 (7.3) | 830 | 150 | 92.6 | 3.4 |
| GdBCO | Gd | LAO | 190 | 25.1 (9.3) | 810 | 50 | 94.6 | 4.0 |
| ErBCO | Er | STO | 240 | 21.9 (8.2) | 780 | 150 | 92.2 | 4.3 |
Thin-film characterization
Crystallographic orientation and crystallinity of the films were analyzed by X-ray diffraction (XRD) using a Bruker D8 diffractometer with Cu Kα radiation. Self-field critical current density, Jsfc, at 77 K was measured inductively with a Cryoscan (THEVA, 50 μV criterion, corresponding to 1 μV cm−1 in transport measurements11). The values of Jc at different magnetic fields, Jc(B), were measured on a 14-T Quantum Design Physical Property Measurement System (PPMS) with a 1 μV cm−1 criterion. Also, the critical temperature Tc (defined as Tc,90, i.e. the temperature at which the resistance is 90% of the value above the transition) was measured by transport in the same PPMS. The transport data were measured on 10–20 μm wide and 1 mm long tracks prepared by photolithography with wet-chemical etching.Electron microscopy
STEM samples were prepared using the in situ lift-out technique52 using focused-ion-beam (FIB) milling in a FEI Strata 400S DualBeam system. A protective Pt layer was deposited by sequential electron- and ion-beam-induced deposition on the region of interest to protect it from ion-beam bombardment during TEM sample preparation. The final thinning step was performed using a low Ga+-ion energy of 2 keV to reduce the thickness of the amorphous surface layer on the TEM samples.53,54A FEI Titan3 80–300 operated at 300 kV with a spherical aberration coefficient Cs = 1.2 mm for the probe-forming lens was used for high- and low-angle annular dark-field (LAADF/HAADF) STEM imaging and STEM-EELS spectrum imaging. In the latter, an EELS spectrum is collected for each probe position in a selected sample region. The probe convergence semi-angle was adjusted to 9 mrad (50 μm condenser-2 aperture) for STEM imaging. The inner/outer collection semi-angles for HAADF (LAADF) STEM were about 40 mrad/200 mrad (11 mrad/67 mrad), corresponding to a nominal camera length of 115 mm (460 mm). In both cases, the STEM signal was collected by a Fischione Model 3000 ADF detector. For STEM-EELS, a Gatan Imaging Filter (GIF) Tridiem 865 ER spectrometer was used, and EELS spectra were collected on a Gatan UltraScan 1000 CCD camera. For STEM-EELS, the 70 μm condenser-2 aperture was chosen to increase the beam current (∼200–300 pA), resulting in a convergence semi-angle of about 11.5 mrad. A nominal camera length of 29.5 mm was used along with an annular dark-field (ADF) detector (Gatan 805 BF/DF STEM detector) in the GIF entrance plane, resulting in a collection semi-angle of about 20 mrad. The largest available energy dispersion of 0.5 eV per channel (2048 channels total) and a drift-tube offset of 800 eV was chosen to capture an energy window spanning from the Ba-M edges (Ba M5: 781 eV) to the Hf-M edges (Hf M5: 1662 eV), including all REEs apart from Y. Integration times per EELS spectrum ranged between 80 ms and 150 ms, depending on the TEM-sample region and probe current to achieve a reasonable signal-to-noise ratio for further processing. The ADF-STEM signal of the Gatan ADF detector was used for sample-drift correction. The STEM-EELS acquisition was controlled with the “TEM Imaging & Analysis” (TIA) microscope software.
A FEI Tecnai Osiris operated at 200 kV with ChemiSTEM technology55 was used for HAADF-STEM and STEM-EDXS spectrum imaging. The convergence semi-angle was ∼10.7 mrad (70 μm condenser-2 aperture), and the inner and outer HAADF collection semi-angles were about 57 mrad and 200 mrad. The data was acquired with the Bruker Esprit 1.9 software. The simultaneously acquired HAADF-STEM signal was used for sample-drift correction.
Data evaluation
Multi-dimensional STEM-EDXS/EELS datasets of shape (x, y|E) with the spatial coordinates x and y and the energy E were processed with principal component analysis (PCA) using the HyperSpy Python package (version 1.7.1)56/temDM DigitalMicrograph plugin (basic version 1.96)57 to increase the signal-to-noise ratio by dimensionality reduction.58 The number of relevant principal components for reconstruction was carefully chosen by inspecting the PCA scree plot, score maps, and factor loadings so as not to introduce/remove spectral features in the datasets. In addition, the raw data was used to validate the PCA-treated results by comparing summed-up raw spectra from different sample regions with PCA-denoised signals. All elemental maps in this work display the background-corrected net X-ray peak intensities (for EDXS) or core-loss-edge intensities (for EELS).The net intensities from X-ray peaks were extracted by multiple linear least-squares fitting of Gaussian X-ray line families59 using HyperSpy, where the peak positions (peak widths) are known in sufficient accuracy from tabulated values (the detector resolution). This method allows separating overlapping X-ray peaks in contrast to simple peak integration in an energy window (see Fig. S5, ESI† for an example fit). Quantification was carried out using a standardless Cliff-Lorimer approach using Bruker Esprit 2.1 to compare relative changes in composition between different sample regions. Raw spectra from specific sample regions in a spectrum image were summed up by masking (so-called “masked sum spectra”60) and then used for quantification. The required masks were generated by applying a graph-cut threshold61 using Fiji62 to qualitative elemental maps.
For EELS datasets, core-loss-edge net-intensities were extracted by a combined model fit consisting of a power-law background model and Hartree–Slater ionization cross-section for each core-loss edge using the commercial EELS package for DigitalMicrograph (version 3.43.3213.00) by Gatan. In this procedure, the electron-energy loss near-edge structure (ELNES) regions for each edge cannot be easily modeled and were excluded from the fitting process (40 eV ELNES energy window, starting from the edge onset). For the REE signals (cf.Fig. 4c–e), the exclusion of the ELNES region is problematic for extracting the REE M4,5 core-loss edges because (i) their signals are generally relatively weak due to the low REE concentration (e.g., ∼1.5 at% per REE in (Gd,Dy,Y,Ho,Er)BCO) and (ii) the weak edges are additionally overlapping (cf. spectra in Fig. 4c). In this case, the ELNES regions of REEs cannot be excluded from the model fit. As a result, the model-fitting procedure used to extract the elemental signals did not yield useful fit results for the REE M4,5 core-loss edges (not shown). Therefore, the REE white-line intensities were extracted using non-linear least squares (NLLS) fitting of a power-law background model and Gaussian functions to the REE-M5 white lines in DigitalMicrograph. The extracted Gaussian-peak intensities are used to analyze the spatial distributions of the REEs. Crystal structures were analyzed by comparison of Fourier-transformed HAADF-STEM images and calculated diffraction patterns of known crystal structures (Fig. S2, ESI†) from the Inorganic Crystal Structure Database (ICSD).63
Experimental results
General properties of the investigated REBCO films
This first section briefly introduces the REBCO nanocomposite films of this study. Five different films were investigated (Table 1), namely two mixed-REE films (5-REBCO and 3-REBCO, see also ref. 33) and three single-REE films (SmBCO, GdBCO, and ErBCO, see also ref. 4 and 64). While this work focuses on the microstructural properties, the cited references contain more details about the superconducting properties of the samples. All films contain the same BHO concentration of 12 mol% as confirmed by STEM-EDXS data (cf. Fig. S7, ESI†). Average BHO-nanoparticle sizes between 21 and 28 nm were determined by STEM using the procedure described in the ESI,† Fig. S1. The nanoparticle sizes may vary between films seemingly due to finite counting statistics from cross-section STEM images but also in reality due to differences in optimum crystallization temperatures (Tcryst) affecting nanoparticle growth. The superconducting properties of the analyzed samples are summarized in Table 1. All of them present Jsfc values at 77 K between 3.4 and 5.5 MA cm−2, indicating good quality of the samples. Such values are among the largest ever reported for the 5-REBCO, 3-REBCO, and SmBCO. For the GdBCO and ErBCO, the Jsfc values at 77 K can be considered standard. Also, the Tc values are within the expected range for each composition.65Chemical composition of BaHfO3 particles in a (Gd,Dy,Y,Ho,Er)BCO film
The (Gd,Dy,Y,Ho,Er)Ba2Cu3O7−δ film (denoted as 5-REBCO) film has a thickness of ∼220 nm, and the BHO nanoparticles are mostly dispersed in the REBCO matrix (Fig. 2a). The nanoparticles mainly appear darker compared to REBCO in LAADF-STEM diffraction-contrast imaging. The average area-equivalent diameter of the randomly oriented BHO nanoparticles in the film is 24.6 nm, with a standard deviation of 6.9 nm as measured from 186 BHO particles (Fig. S1, ESI†). HAADF-STEM imaging with higher magnification (Fig. 2b) reveals epitaxial REBCO growth on STO(001) with the crystallographic relationship (001)[100]REBCO‖(001)[100]STO. A few stacking faults (SFs) consisting of an additional CuO plane are visible as dark horizontal lines. The SFs are mainly caused by the crystalline BHO nanoparticles in the film. A SF shifts the REBCO structure laterally by b/2 (in addition to a c/6 shift in growth direction), which is used here to deduce the crystalline orientation of the orthorhombic REBCO unit cell.66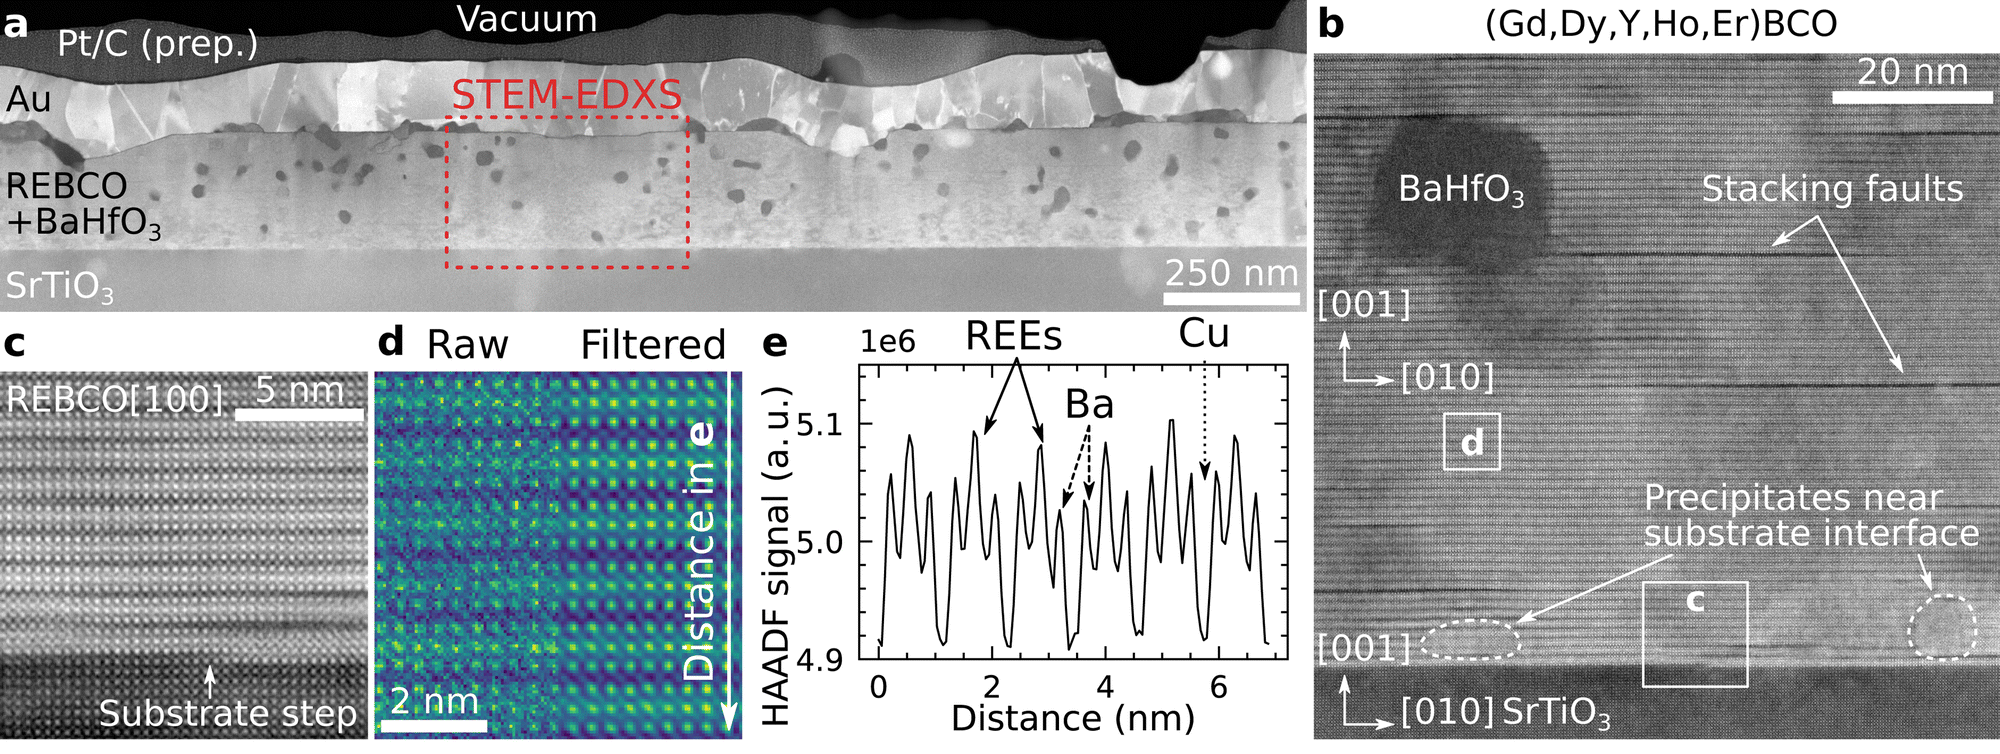 | ||
| Fig. 2 Representative STEM images for a (Gd,Dy,Y,Ho,Er)BCO–BHO nanocomposite (5-REBCO). (a) Overview cross-section LAADF-STEM image of the film with a thickness of ∼220 nm. Most BHO nanoparticles appear dark inside the film and bright at the film/substrate interface (examples marked by dashed regions in b). The STEM-EDXS acquisition region for Fig. 3 is marked by a red-dashed frame. The Pt and Au layers result from TEM-sample preparation and the contacting for electrical measurements, respectively. (b) Higher-magnification HAADF-STEM image showing stacking faults (dark horizontal lines), a BHO particle, and precipitates near the film/substrate interface. (c) Cropped film/substrate-interface region from b showing an atomic step at the SrTiO3–substrate surface. (d) The cropped region from b shows a few unit cells of REBCO, which are more clearly visible in the average background subtraction-filtered image (right). (e) Intensity line profile of the summed-up HAADF-STEM signal along the vertical (c-) direction from the raw image in (d). The REE planes appear with higher HAADF-STEM intensity compared to the BaO and CuO planes and confirm the successful incorporation of REEs into the REBCO structure. | ||
In addition to BHO nanoparticles with a dark appearance in the film, crystalline precipitates with higher (or similar) intensity relative to the film are observed at the film/substrate interface (areas marked with dashed lines in Fig. 2b). Such precipitates are identified as BHO and RE2O3 phases with the orientations (001)[100]BHO‖(001)[100]REBCO and (001)[110]RE2O3‖(001)[100]REBCO (Fig. S2 and S3, ESI†). The intensity differences of BHO particles near the film/substrate interface (bright) and in the film (dark) in the LAADF-STEM images result from increased Bragg diffraction for particles aligned in a low-index zone-axis orientation near the film/substrate interface (i.e., syntaxially aligned with the film/substrate), which results in a higher intensity on the LAADF detector. RE2O3 particles are also present at the film/substrate interface, which show similar contrast and are not readily discernable from BHO solely from the LAADF- and HAADF-STEM images. However, the phases can be identified by chemical analysis with EDXS/EELS (cf. arrows in Fig. 3a marking a RE2O3 precipitate) or their crystalline structure at high magnification (Fig. S3, ESI†). The BHO particles at the substrate are typically smaller than the randomly oriented BHO nanoparticles in the film.67
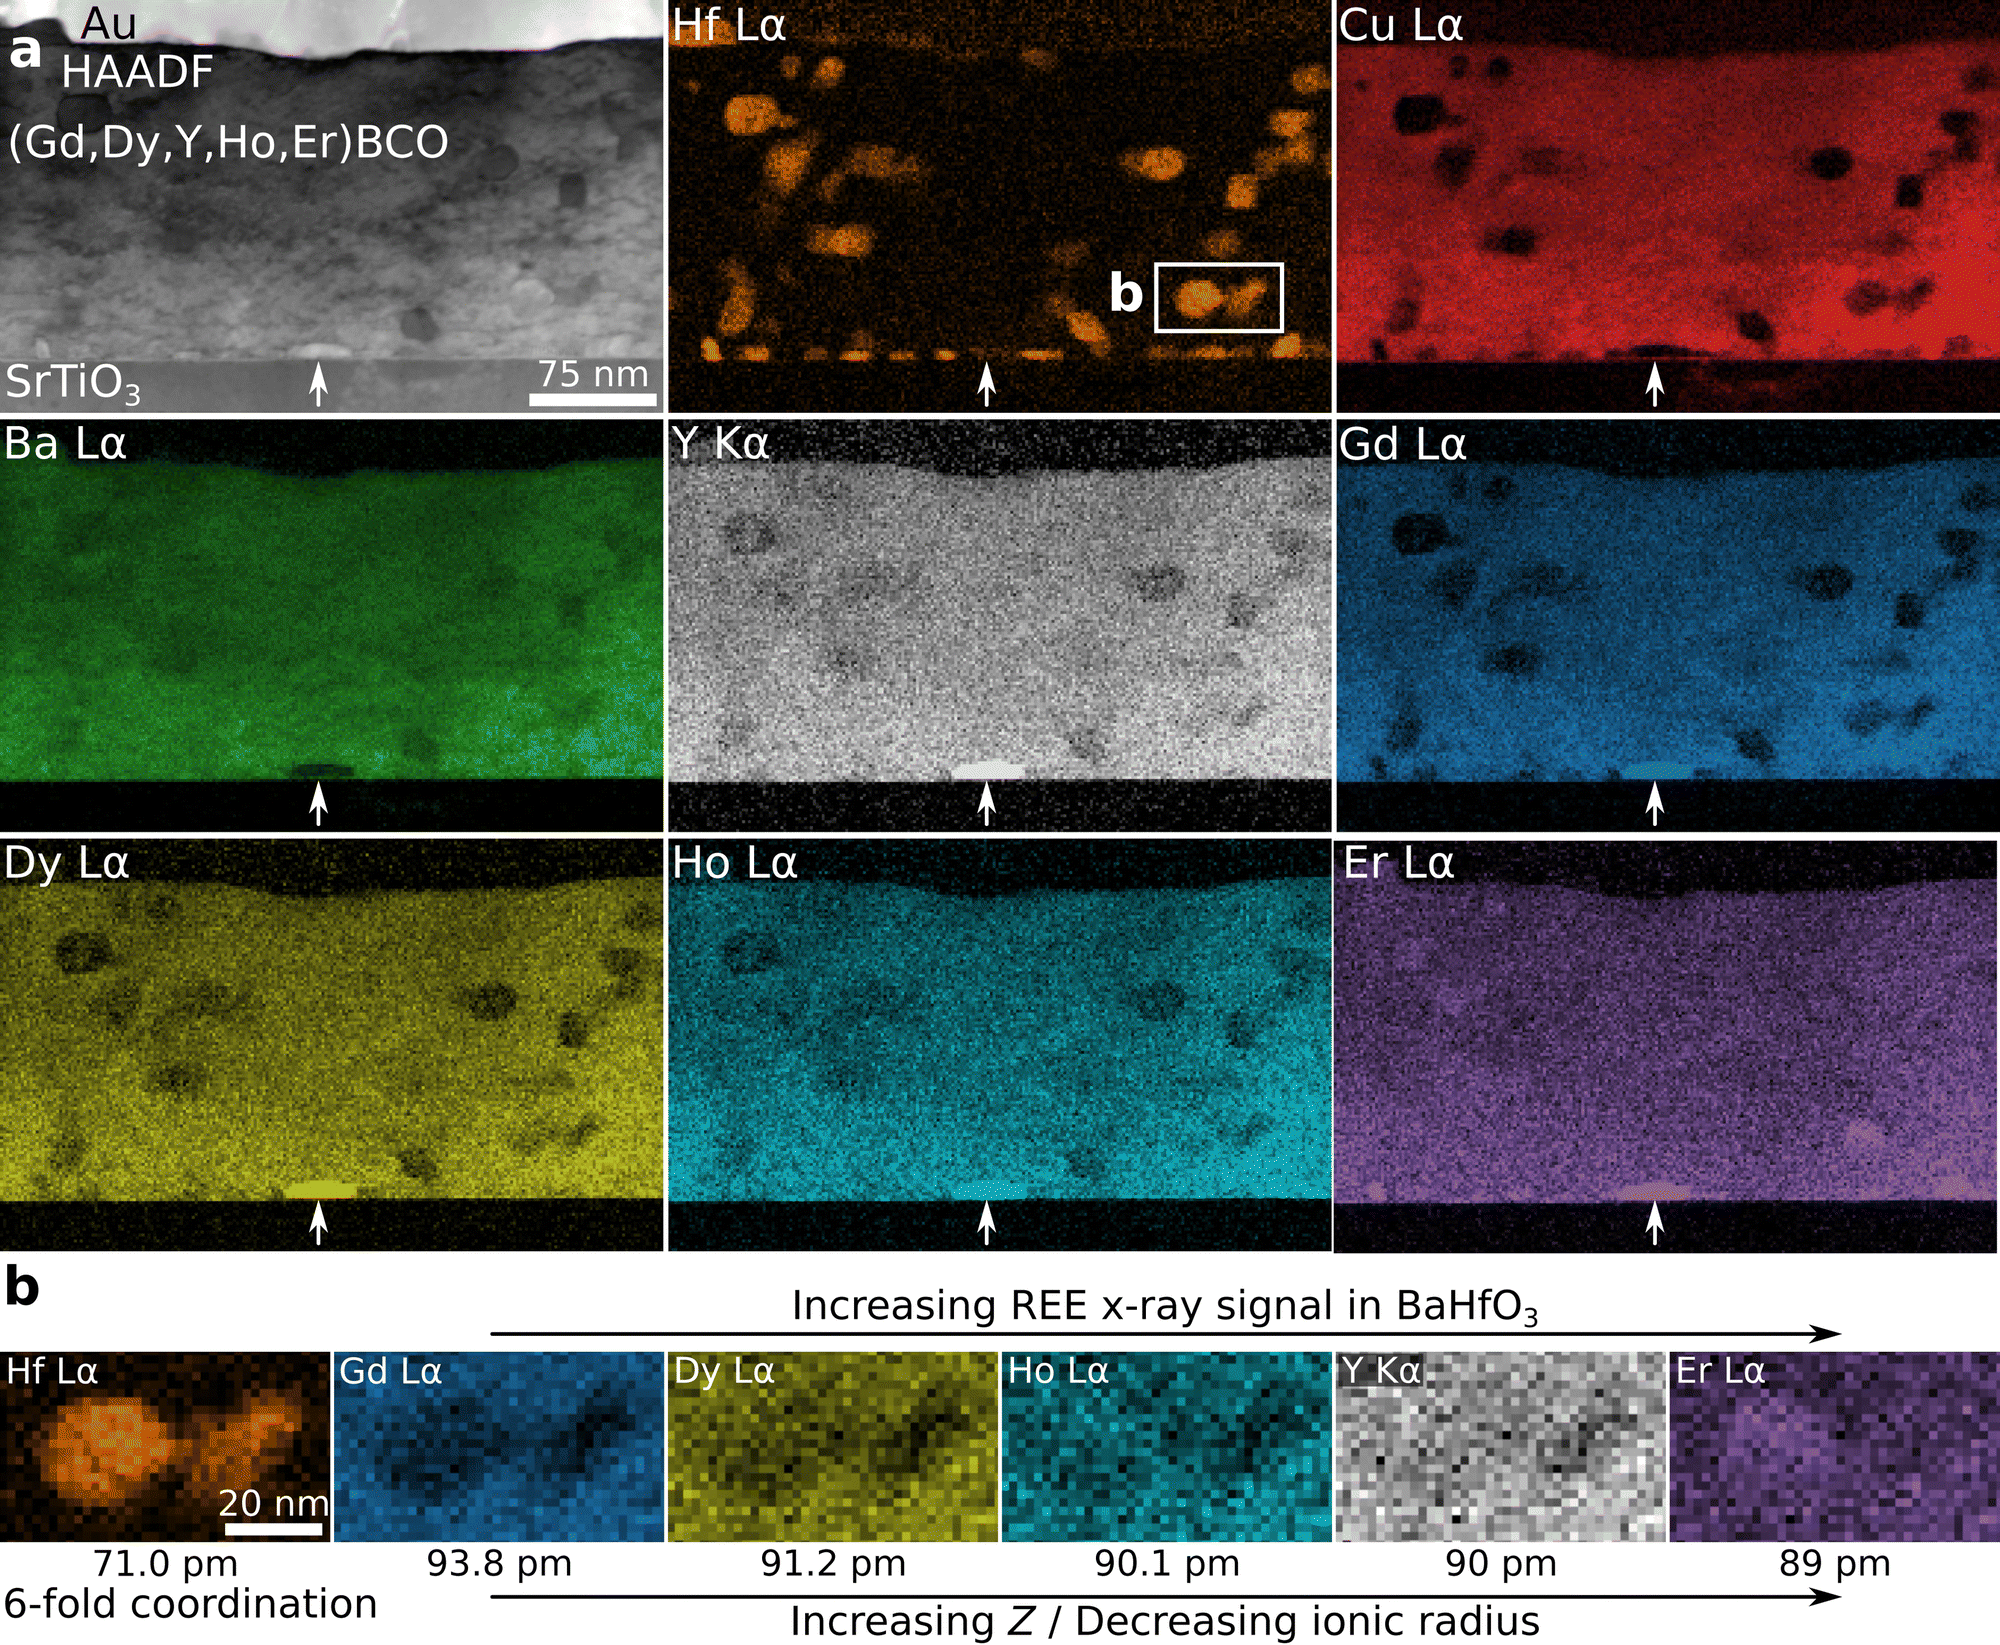 | ||
| Fig. 3 STEM-EDXS analysis of sample 5-REBCO in the region marked by a red-dashed frame in Fig. 2a. (a) HAADF-STEM image and PCA-filtered qualitative elemental maps. The BHO nanoparticles are dispersed in the film but also appear at the film/substrate interface (cf. Hf map). A REE-rich precipitate, RE2O3, is located at the film/substrate interface (marked by the white arrows). BHO and REE-rich precipitates seem to form more frequently at the film/substrate interface but are smaller than in the matrix. The Au layer acts as a contact layer for electrical measurements. (b) Differences in the REE X-ray intensities are observed in elemental REE maps near two representative BHO nanoparticles depending on the REE's ionic radius. Ionic radii are given for Hf4+ and REE3+ with 6-fold coordination.70 | ||
 | ||
| Fig. 4 STEM-EELS analysis of a (Gd,Dy,Y,Ho,Er)BCO film (5-REBCO) with BHO nanoparticles. (a) Overview ADF-STEM image with the STEM-EELS acquisition region marked in red. The Au layer was deposited as a contact layer for electrical measurements. (b) Summed-up EELS spectrum of all acquisition points showing all relevant ionization edges marked by vertical lines. (c) Normalized EELS spectra from summed-up raw signals from the regions shown in the ADF signal in (e), i.e., for REBCO (orange) and BHO (blue, offset by −0.3 for better visibility). Differences in the M5 white-line intensities for the different REs are observed. (d) Normalized M5 white-line intensities after background subtraction for REBCO (solid) and BHO (dashed) spectra, which are shown in (c). Opposite trends are observed for the M5 white-line intensities. Er shows a stronger signal in the BHO region than in the REBCO region. Gd and Dy show a depletion in the BHO region compared to the REBCO region. The Ho-M5 intensity is similar in both regions. The trend is similar to the EDXS analysis in Fig. 3b. (e) ADF-STEM signal and qualitative elemental maps extracted from the PCA-filtered STEM-EELS dataset. The second row shows the M5 white-line intensities of the REEs, i.e., pixel-wise extraction of the M5 net intensities as shown in (d). | ||
In Fig. 2c, an atomic step is visible at the STO surface, which causes an offset along the c-direction of the surrounding REBCO unit cells. The misalignment is annihilated by a SF above the first REBCO unit cell, which prevents the formation of an extended antiphase boundary. The latter defect type was not observed in any investigated film. Fig. 2d shows a raw (left) and average-background-subtraction-filtered68 (ABSF, right) HAADF-STEM image from an undisturbed film region marked in Fig. 2b. The REBCO structure can be identified in the filtered image, with the REE planes showing the highest and CuO planes the lowest atomic-number (Z-)contrast.69 This is also visible in the line profile of the HAADF intensity along the c-direction shown in Fig. 2e, where the whole width of the raw image in Fig. 2d was summed up. This measurement qualitatively shows that the REEs are located on the expected atomic sites (i.e., the Y site in YBCO) in the REBCO structure.33 In the raw image, slight variations of the HAADF-STEM intensities on the same atomic sites are visible, which are caused by noise, small sample thickness fluctuations caused by FIB preparation, and possible TEM-sample contamination.
A STEM-EDXS dataset of the region marked in Fig. 2a was collected to analyze the film composition as displayed in Fig. 3. The Hf map reveals the location of the BHO particles in the film and near the film/substrate interface (Fig. 3a). Near the interface, BHO precipitates are more frequent but about 20% to 40% smaller than in the matrix (cf. Hf map). The Cu map reveals the REBCO film. The second and third rows present the REE signals showing similar elemental distributions except within the BHO particles. A REE-rich precipitate is found near the film/substrate interface (marked by arrows in Fig. 3a), which is identified as (Gd,Dy,Y,Ho,Er)2O3 (Fig. S2 and S3, ESI†). Besides this RE2O3 precipitate, a homogeneously distributed signal for all REEs is observed in the REBCO region. However, for the BHO nanoparticles, a slight difference in the REE X-ray signals is visible at close inspection (Fig. 3b). As an example, the region marked in the Hf map in Fig. 3a with two adjacent BHO particles is displayed at higher magnification in Fig. 3b. In the BHO region, the Gd (smallest Z/largest ionic radius) signal shows the strongest depletion, and the Er (largest Z/smallest ionic radius) signal is even slightly increased in the region of the BHO particle compared to the surrounding REBCO matrix. The Dy signal shows a slight depletion, and Ho and Y (with similar ionic radii) show a similar intensity, albeit slightly lower, as in the film region. Generally, a trend is visible for REEs with smaller effective ionic radii showing higher X-ray signals – and therefore higher concentrations – in BHO (horizontal arrows in Fig. 3b). This observation hints at a possible REE incorporation in BHO in accordance with other publications.36,38,40
Notably, the elemental maps shown in Fig. 3 were extracted from a PCA-filtered EDXS dataset. Principal component analysis can introduce artifacts into the dataset if, e.g., an insufficient number of principal components is used for reconstruction.71 We thoroughly checked our analysis approach and the possibility of a misidentification of X-ray peaks by comparing the PCA-treated results with unfiltered EDXS data (see Fig. S4 and S5, ESI† for details). The unfiltered, summed-up EDXS spectra from BHO nanoparticles and REBCO matrix show a similar trend in REE signals, so that PCA-induced artifacts can be ruled out.
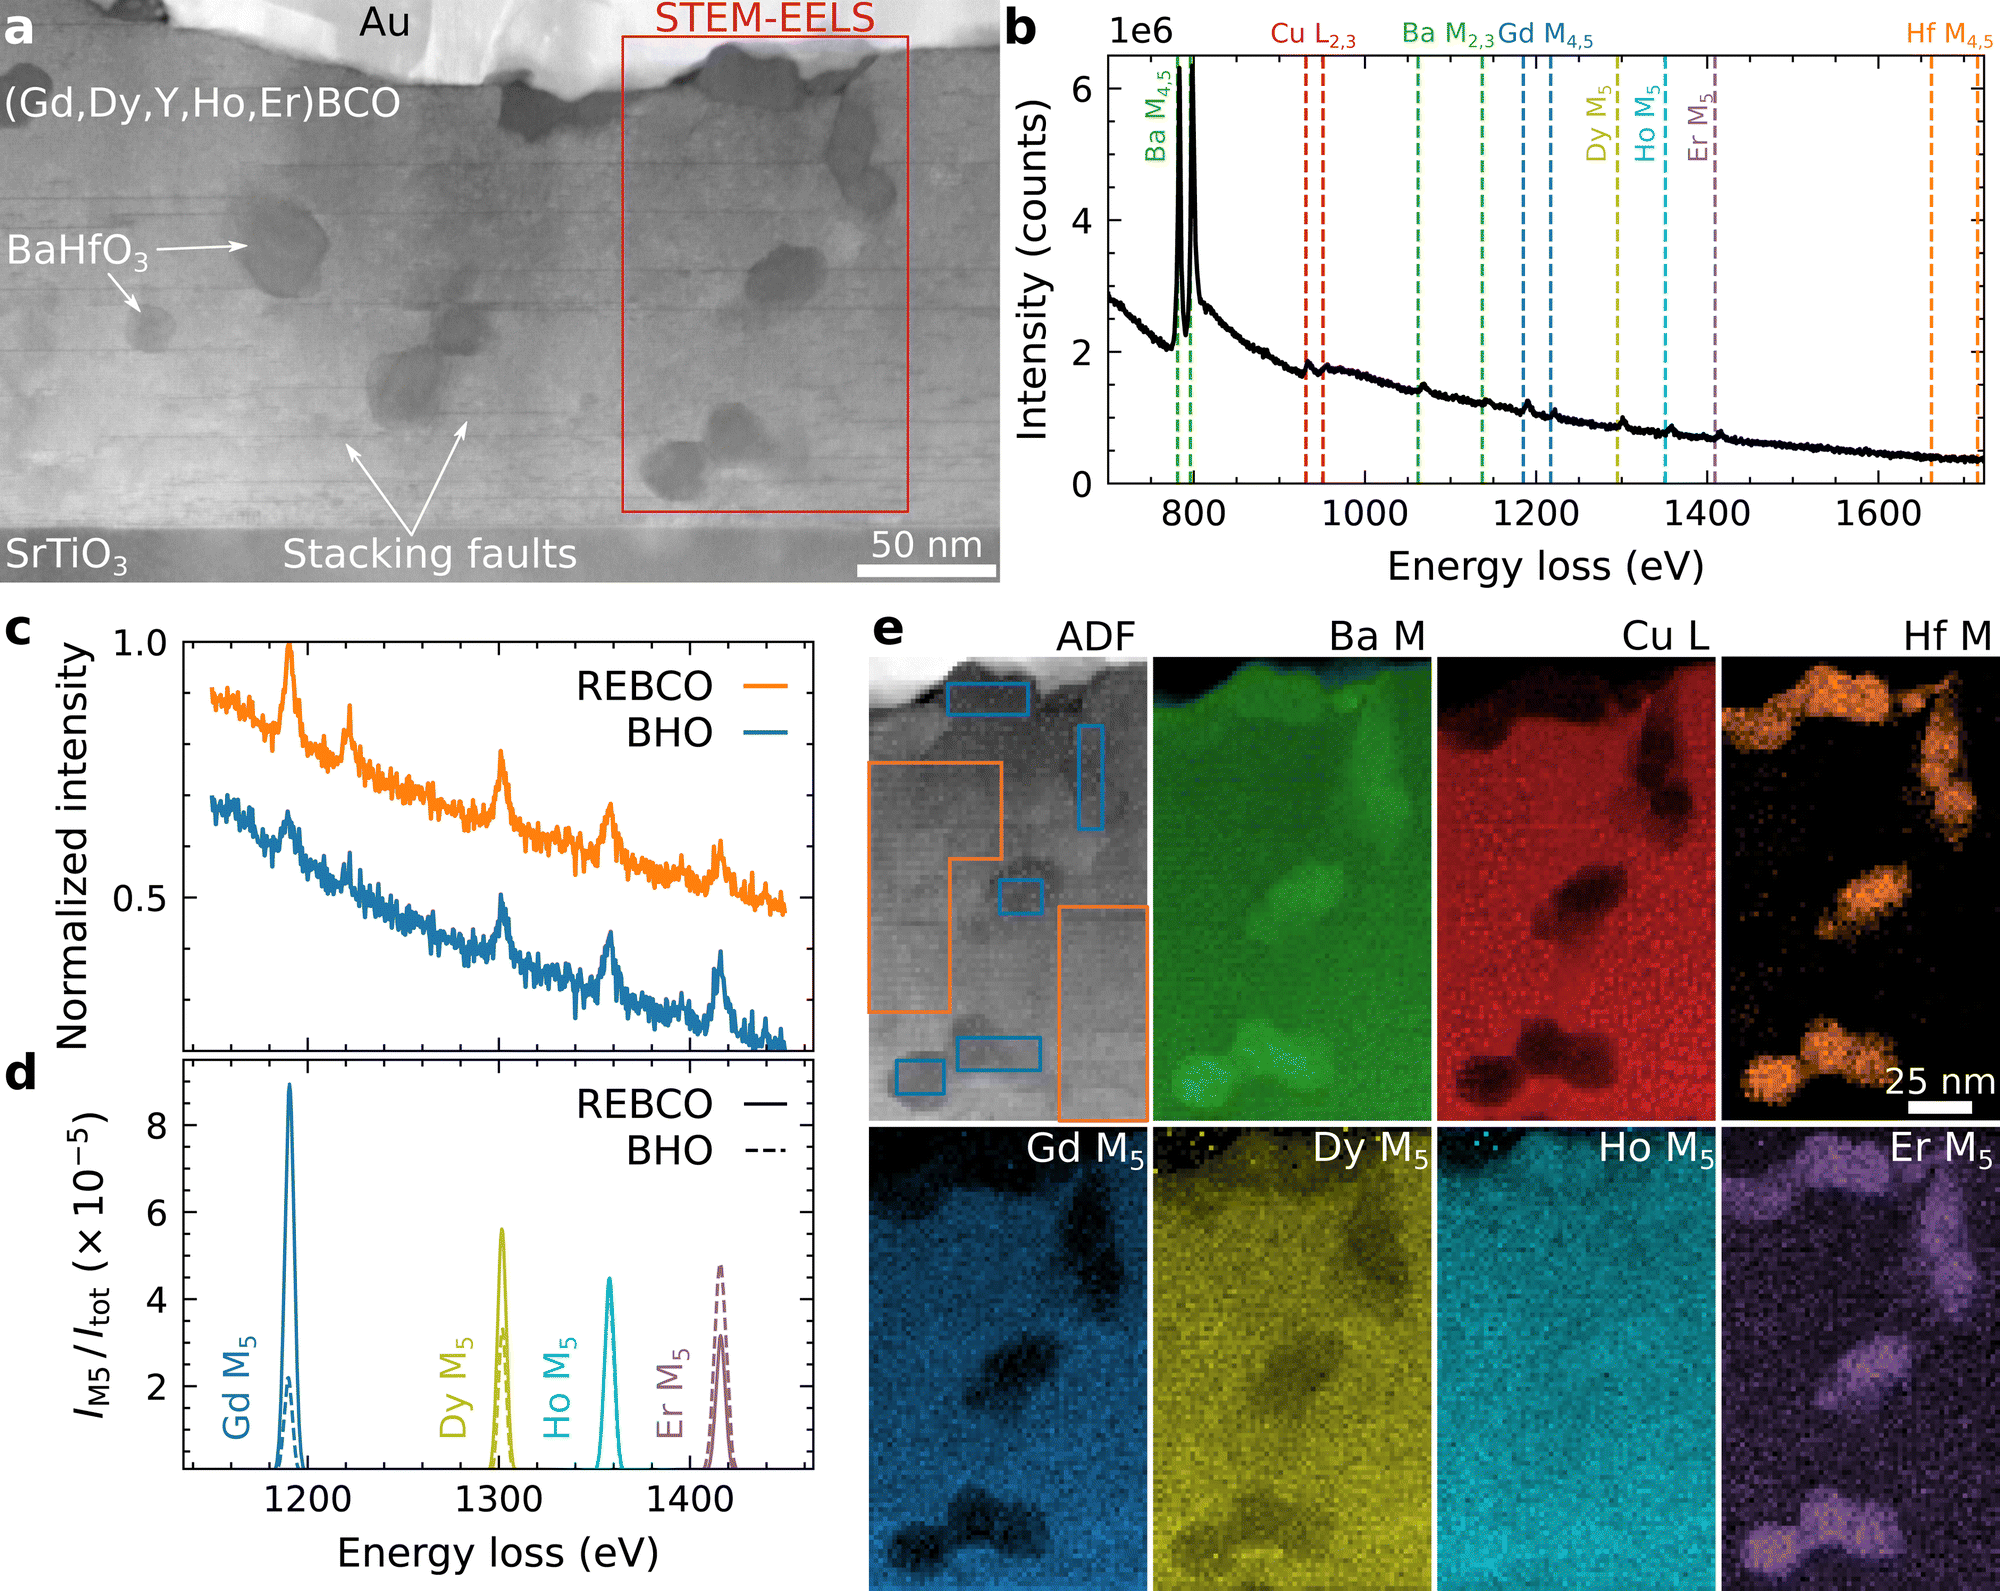
Additional STEM-EELS analyses of BHO-nanoparticle regions were conducted (Fig. 4) to get a better understanding of the composition of the BHO nanoparticles and to rule out possible artifacts in our EDXS measurements. The overview ADF-STEM image (Fig. 4a) shows similar microstructural features (e.g. SFs) as Fig. 2b. The STEM-EELS dataset was acquired in a region (marked in red) containing a few BHO nanoparticles. The summed-up spectrum from all acquisition points (Fig. 4b) shows the core-loss edges (marked by dashed vertical lines) of the analyzed energy-loss interval. Ba shows the most pronounced M4,5 white-line peaks and less intense M2,3 edges. The Cu-L2,3 edges are also visible. Since the REEs are only present in small concentrations (∼1.5 at% per REE), only the more intense M5 white-line peaks are observable, but not the following energy edges. These peaks are used to analyze the spatial distribution of the REEs. Yttrium has no core-loss edge in the investigated energy interval and is excluded in the following EELS results. We suspect that it is distributed similarly to Ho (as for EDXS in Fig. 3) due to their comparable ionic radii. The Hf-M4,5 edges have weak edge intensities and are not visible in the displayed spectrum.
We first analyze the sum spectra derived from the raw EELS data set to rule out possible artifacts due to PCA-filtering of the EELS dataset. Fig. 4c and d show an analysis of the REE M5 white-line intensities by summation of raw EELS spectra from the marked regions in the ADF-STEM image in Fig. 4e, i.e., REBCO matrix (orange) and BHO nanoparticles (blue). The M5 white lines are visible above the background for all REEs. To extract the M5-peak intensities, sequential NLLS fitting of (i) a power-law background model and (ii) Gaussian functions at each M5 white line was used (Fig. 4d). The M5-peak intensities (IM5) were normalized with the total number of counts (Itot) in the extracted REBCO/BHO spectra, respectively, for easier comparison.
Gd shows the most significant difference between the REBCO (solid line) and BHO (dashed line) regions with higher intensity in REBCO (Fig. 4d). Er, on the other hand, shows a stronger signal in BHO compared to REBCO. The Dy and Ho signals lie in between, and for Ho, a nearly unchanged signal between the BHO and REBCO regions is observed. The M5-white-line intensities show a similar trend as the REE-Lα intensities in EDXS (Fig. 3), albeit the differences between the REEs are more pronounced in the EELS measurements. The investigated REEs with smaller effective ionic radii show a stronger tendency of incorporation into the BHO nanoparticles.
In principle, the local REE bonding environment can also modify the energy-loss near-edge structure (ELNES), including the extracted M5-white-line intensities. However, (i) since the STEM-EDXS results in Fig. 3 show the same general trend and (ii) EDXS is mainly sensitive to compositional changes, the measured change in M5 white-line intensity for the REEs is interpreted as a change in composition.
After analyzing the raw signal, the STEM-EELS dataset was denoised with PCA, and qualitative elemental maps were extracted for Ba, Cu, and Hf (top row in Fig. 4e) and the REEs Gd, Dy, Ho, and Er (bottom row in Fig. 4e). The BHO particles can be located in the Hf M map. The REE M5 white-line-intensity maps (Fig. 4e) show the same trend as the REE-Lα signals in Fig. 3b. The Gd signal shows the most substantial depletion at the BHO nanoparticles, whereas the Er signal is enhanced compared to the surrounding REBCO matrix.
Chemical composition of BaHfO3 particles in other REBCO films
Up to here, only the results of a single sample (5-REBCO) with a REE mixture of five REEs were shown. In the following, we will compare those results with STEM-EDXS and STEM-EELS analyses for another mixed-REE sample (i) (Y,Ho,Er)BCO (3-REBCO) and three different single-REE films (ii) SmBCO, (iii) GdBCO, and (iv) ErBCO (see also Table 1). All films were prepared with the same nominal content of 12 mol% BHO for comparison with sample 5-REBCO. Gd and Er were chosen for the single-REE nanocomposites because they have the most significant difference in ionic radii for the REEs present in 5-REBCO. In this way, the observations for Gd and Er in GdBCO and ErBCO can be compared with the behavior of Gd and Er in 5-REBCO. SmBCO was chosen to investigate the effect of an even larger ionic radius than Gd on the REE–BHO mixing. Representative LAADF-STEM cross-section images of 3-REBCO and the single-REE samples, similar to Fig. 2 for 5-REBCO, are available in the ESI† (Fig. S6).Fig. 5 shows elemental EELS maps extracted with the same procedure as in Fig. 4. The maps of Ho and Er for 3-REBCO show a similar respectively slightly increased signal on the BHO particle compared to the surrounding matrix (Fig. 5a). This trend is similar to the 5-REBCO sample (see Fig. 3 and 4), and this observation confirms that the REE-dependent mixing between REE and BHO is not an artifact observed in a single, random REBCO sample. A substantial reduction of the REE signals on BHO is observed for the single-REE SmBCO and GdBCO films (Fig. 5b and c). This qualitatively agrees with the results for 5-REBCO, where Gd also shows a substantial depletion in BHO (Fig. 3b and 4e). The strong depletion of the Sm signal in BHO follows the same trend because Sm has an even larger ionic radius than Gd.
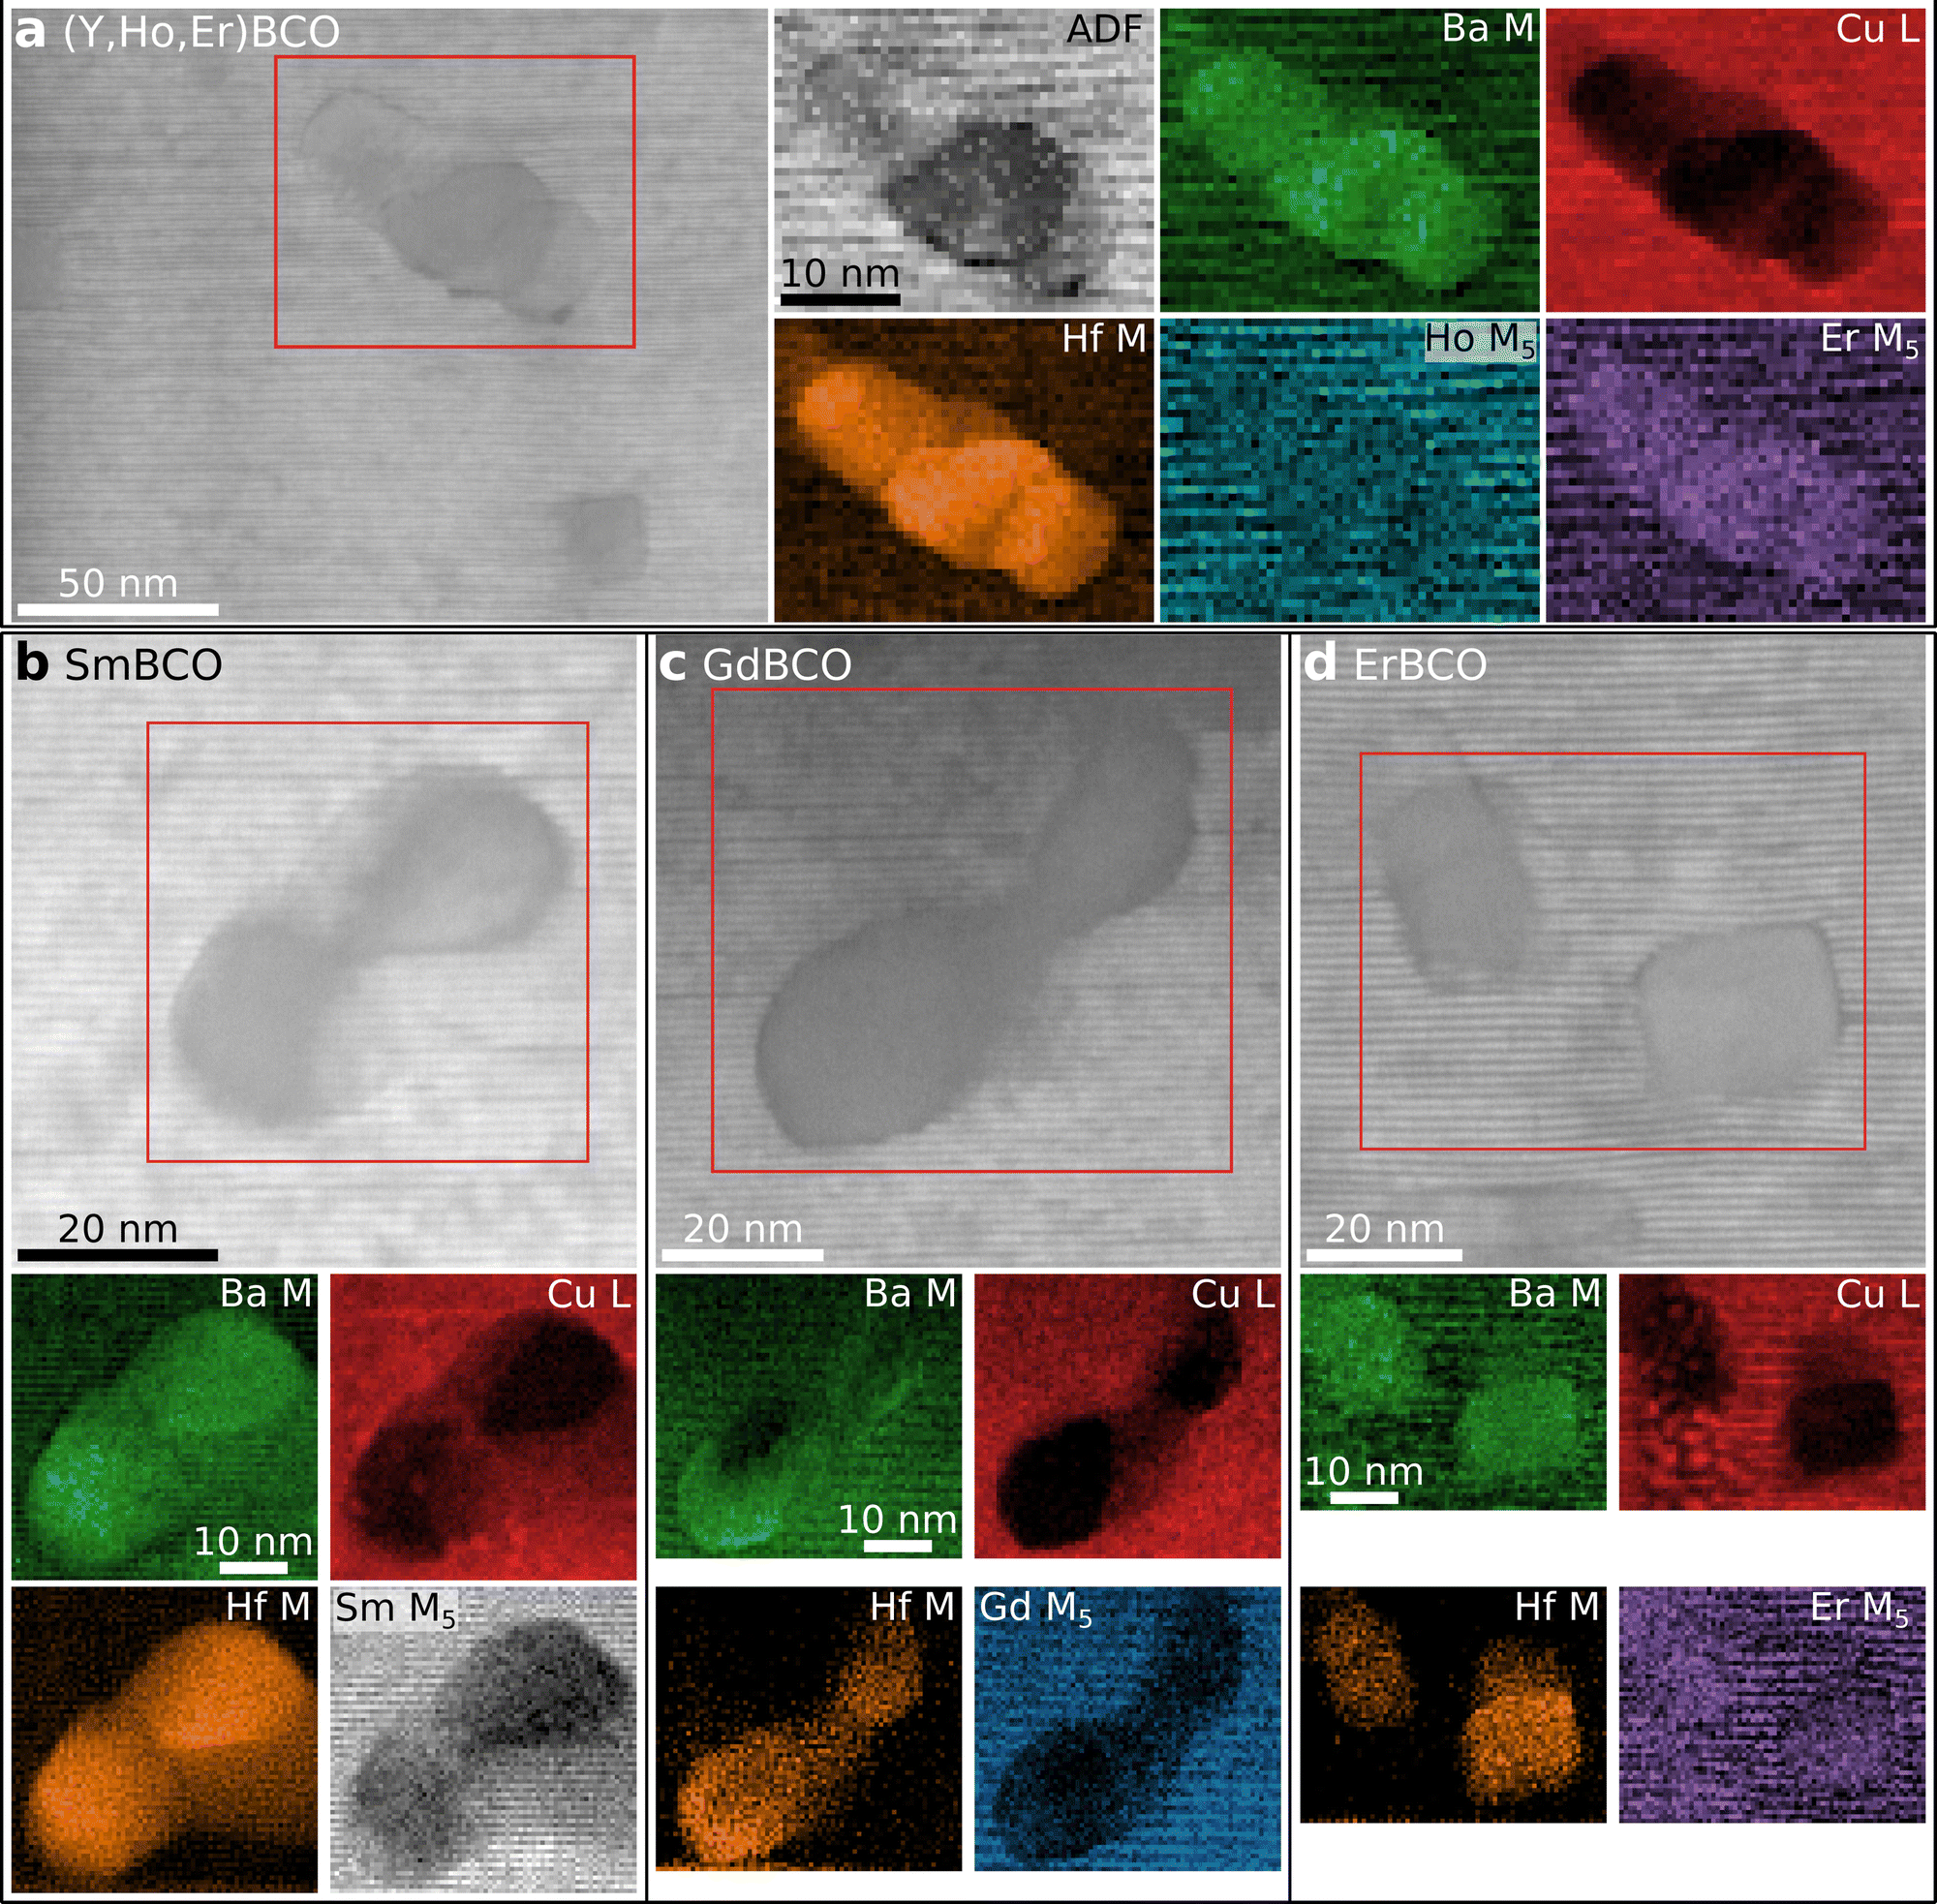 | ||
| Fig. 5 STEM-EELS analysis for REBCO samples with varying REE composition. (a) The mixed-REE sample 3-REBCO shows a similar trend as 5-REBCO in Fig. 4 with an increased Er signal in BHO regions. (b)–(d) EELS elemental maps for single-REE nanocomposites. Substantial depletion of REE signal near BHO is observed for (b) Sm and (c) Gd, but not for (d) Er. (d) For ErBCO, the Er signal is similar for the BHO nanoparticle and REBCO matrix regions. This differs from the mixed-REE samples, where an increased Er signal was observed near BHO relative to the REBCO matrix (cf. (a) and Fig. 3b and 4e). | ||
For the ErBCO–BHO nanocomposite, a similar Er signal in the ErBCO matrix and BHO is observed (Fig. 5d). Even though this also follows the trend above of pronounced Er–BHO mixing, this result is different from the REE mixtures, where a higher Er concentration is observed in BHO compared to the matrix (cf. intensity difference between the BHO nanoparticles and the REBCO matrix in the Er map in Fig. 5d with Fig. 3b and 4e). This observation suggests that the REE–BHO mixing not only depends on the REE but also if mixed- or single-REE REBCO nanocomposites are considered, i.e., on the presence of other REEs.
To investigate the latter aspect further, we quantified the relative changes in REE concentrations between the REBCO matrix and BHO using STEM-EDXS. The BHO nanoparticles with a diameter of ∼25 nm (Table 1) are embedded within the REBCO matrix in a thin TEM sample (∼50 nm thickness) and may be randomly intersected by the TEM-sample surfaces after sample preparation. In the following analysis, we assume that relative changes between the REBCO and BHO compositions can be approximated by averaging data from as many nanoparticles as possible with sufficient spatial resolution, for which we used STEM-EDXS. Masked-sum spectra for the regions containing BHO particles and the REBCO matrix were extracted from the raw EDXS datasets (see Fig. S5 and S7, ESI†). Notably, the results of this approach should be interpreted carefully because we assume a similar BHO particle size and TEM-sample thickness for all samples. However, the actual size of the BHO particles varies between the different samples due to the different fabrication parameters (cf.Table 1).
The chemical composition was quantified from the masked-sum spectra (cf. Table S2 in the ESI†). Then, the relative difference in REE concentration between the REBCO matrix and the BHO nanoparticles ΔC = (CREE,BHO/CREE,matrix) − 1 was calculated, where CREE,BHO and CREE,matrix are the quantified REE concentrations in BHO and the REBCO matrix, respectively. The values of ΔC are plotted as a function of the ionic radius for REE3+ with CN 6 (Fig. 6). The latter is the expected valence state of REEs in BHO with 6-fold coordination on the Hf site. In Fig. 6, ΔC > 0 (ΔC < 0) corresponds to a higher (lower) REE concentration in BHO compared to the REBCO matrix. A homogenization of the REE concentration between the REBCO matrix and BHO particles corresponds to ΔC = 0 (dashed line in Fig. 6).
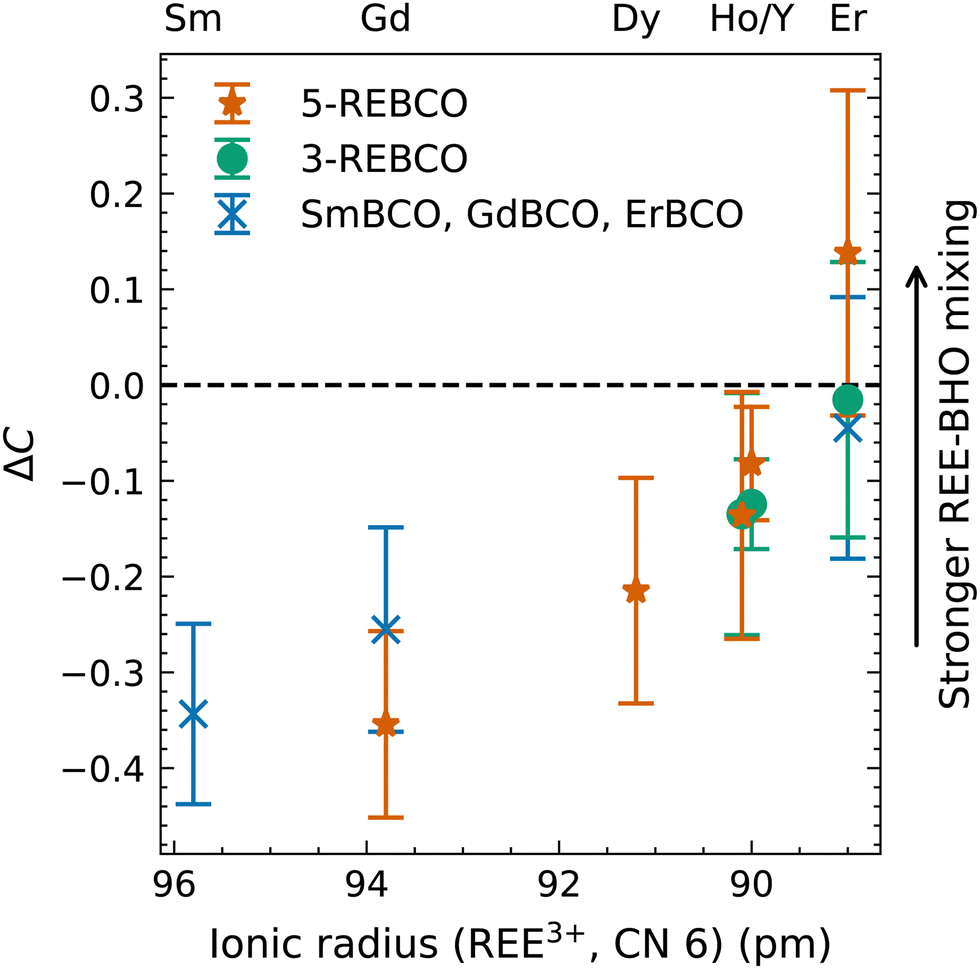 | ||
| Fig. 6 Relative difference in REE concentration ΔC = (CREE,BHO/CREE,matrix) − 1 between the REBCO matrix and the BHO nanoparticles by STEM-EDXS. Increasing ΔC corresponds to increased REE–BHO intermixing. Different symbols (×, ●, ★) correspond to different sample types (single-REE REBCO, 3-REBCO, 5-REBCO). A decreasing ionic radius (or increasing Z) leads to increased REE incorporation into BHO. The REE incorporation is also more pronounced for mixed-REE samples, as seen by comparing the Er values for the different sample types. Error bars correspond to the propagated errors from the reported errors (one standard deviation) on the quantified element concentrations C by the Bruker Esprit software. | ||
The results in Fig. 6 show a trend toward increasing incorporation (increasing ΔC) of REEs in BHO for smaller ionic radii. For 5-REBCO, enrichment of Er in BHO is observed (ΔC > 0), which was also observed in the previously shown EELS measurements (Fig. 4). Another observed effect is that the degree of REE incorporation differs in mixed-REE compared to single-REE REBCO. This can be seen by comparing ΔC for Er for the three Er-containing samples ErBCO, 3-REBCO, and 5-REBCO (cf. Er values in Fig. 6). Erbium incorporation relative to the REBCO matrix for 5-REBCO is the most pronounced, while it is least apparent for ErBCO, with 3-REBCO lying in between. This result suggests that if multiple REEs are present, the REEs with smaller ionic radii (here Er) will preferentially be contained in BHO. This effect is possibly connected to the ionic radii of the REEs in the REBCO matrix. For the Er-containing films, 5-REBCO has a larger average REE ionic radius (102.36 pm) than 3-REBCO (101.27 pm) and ErBCO (100.4 pm). Another metric to consider is the ion-size variance,26 which is higher when more REEs are mixed. These aspects may dictate the incorporation of Er into BHO.
Note that ΔC in Fig. 6 only shows the relative difference of the REE concentrations between REBCO and BHO. The absolute REE concentrations in REBCO and BHO can be calculated from the quantified REE concentrations (cf. Table S2 in the ESI†). The latter must be interpreted carefully (i) due to an overlap of BHO and REBCO EDXS signals in the nanocomposite and (ii) limited accuracy of standardless EDXS quantification. Nevertheless, the absolute REE concentrations in REBCO of 8.2 at% (SmBCO), 7.5 at% (GdBCO), 7.6 at% (ErBCO), 7.7 at% (3-REBCO), and 7.8 at% (5-REBCO) are all in relatively good agreement with the nominal REE concentration of 1/13 at% = 7.7 at% for REBa2Cu3O7. The absolute REE concentrations in BHO are 5.4 at% (SmBCO), 5.6 at% (GdBCO), 7.3 at% (ErBCO), 7.0 at% (3-REBCO), and 6.7 at% (5-REBCO). The higher REE concentrations are generally found for the nanocomposites with higher Er content (ErBCO, 3-REBCO, and 5-REBCO). Overall, these results show that the “loss” of REEs due to incorporation into BHO should be considered in single-REE and mixed-REE nanocomposite fabrication, e.g., by compensating with a higher REE concentration in the precursor materials when using REEs with smaller ionic radii. Furthermore, the size of the nanoparticles increases by the incorporation of REEs at the Hf sites in a large reservoir of Ba, which increases the volume density of the nanoparticles beyond the intended value. For correct data interpretation of the in-field transport properties within the strong-pinning theory, this has to be compensated for or taken into account, especially while comparing different REBCO phases and/or BMO3 particles.
Discussion
In the following, possible reasons for the observed trends in REE incorporation into BHO and other commonly used BMO compounds, namely BaZrO3 (BZO), BaTiO3 (BTO), and BaSnO3 (BSO), are discussed based on the ionic radii R of the REEs and their substitution sites (see also Table S3 in the ESI†). For perovskites with ABO3 stoichiometry, both A2+,CN12 and B4+,CN6 are possible substitution sites for REEs.42,44–46The ionic radius of an element depends on the oxidation state and the CN. For REE incorporation into the perovskites, we assume a constant REE oxidation state of 3+ and the same CN as the substitution site for the REEs in analogy to ref. 45. Indeed, we found no changes in REE ELNES in the EELS signals between BHO and REBCO regions in our experiments (see Fig. S8 and S9, ESI†), indicating a constant trivalent REE. The values for all ionic radii R were taken from the literature.70,72
The experimentally observed higher REE3+ concentrations in BMO nanoparticles for REEs with larger Z (i.e., smaller ionic radii) are correlated to the Goldschmidt tolerance factor t73 to get insights into possible substitution sites (Fig. 7). The tolerance factor t is a qualitative criterion for the stability of perovskites with ABO3 stoichiometry.42 It is calculated as
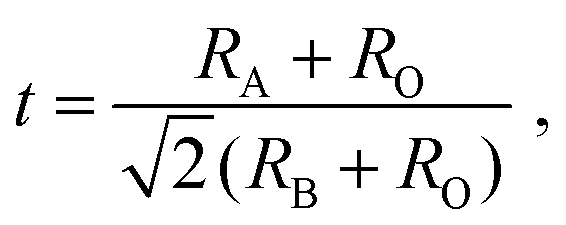 | (1) |
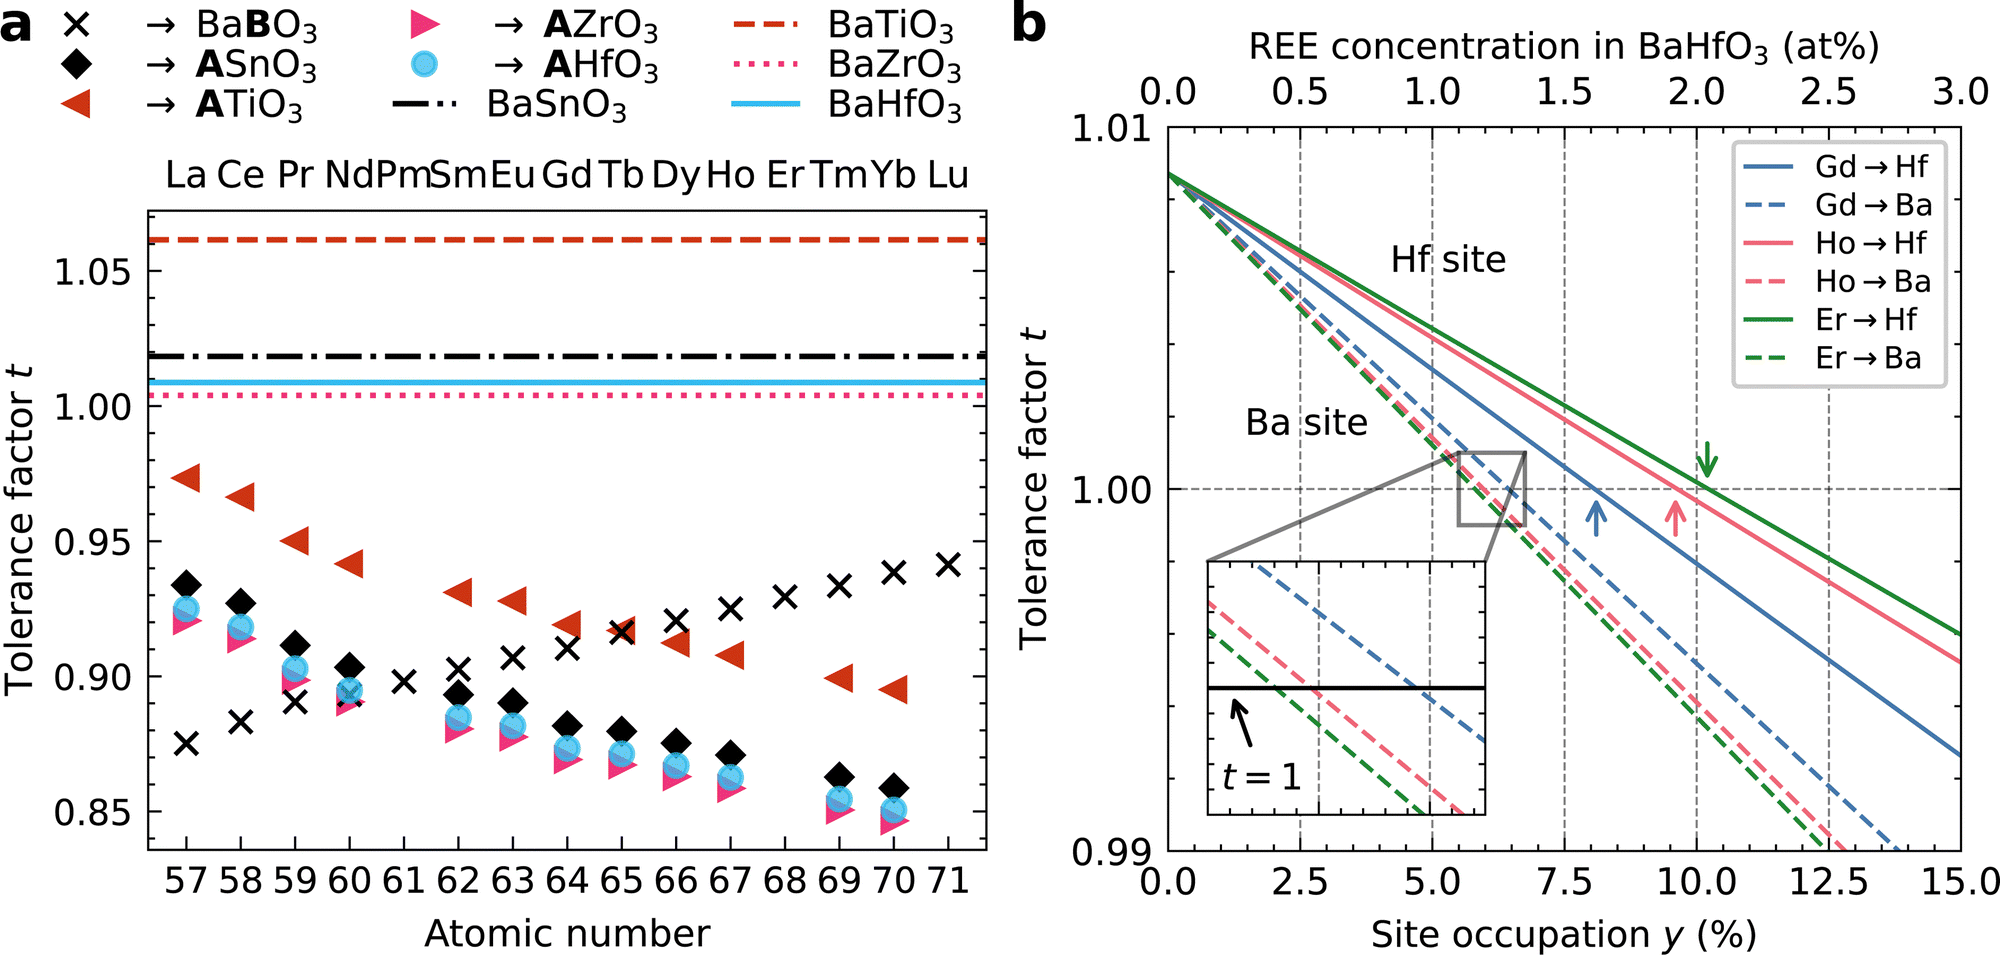 | ||
| Fig. 7 Goldschmidt tolerance factor t for REE3+ incorporation into different Ba-based perovskites. A value of t = 1 is associated with the highest perovskite stability. (a) Horizontal lines mark t for pure perovskite phases without REEs. Symbols show calculated t for a full REE substitution in the bold position (A or B lattice position in an ABO3 perovskite). (b) Tolerance factor t for a partial substitution of selected REEs (Gd, Ho, and Er) on the Ba (dashed lines) or Hf position (solid lines) in BaHfO3. The site occupation y of Ba or Hf with REEs is given in percent. The relative REE concentration in at% is shown at the top and is given by y/5 for BHO. The crossover positions for t = 1 correspond to the optimal site occupations yopt for the respective REE (marked with arrows for Hf-site substitution). See the main text for a detailed discussion. | ||
Here, t is applied to investigate the possible substitution of elements into the perovskite sublattice based on their ionic radii.42 The symbols display the t values for the respective REE3+ being substituted on the B site of BaBO3 with a CN 6 (×) or on the A site with CN 12 (other symbols). The behavior of Y (RY = 90.0 pm) may be comparable with Ho (RHo = 90.1 pm) due to their similar ionic radii. The values in Fig. 7a are calculated assuming a full occupation of the A- or B-lattice site with REEs. The substitution site is marked with the bold letter in the figure legend. In contrast, a partial occupation is investigated in Fig. 7b, as discussed further below. In both cases, necessary additional substitution on the A site respectively oxygen vacancies necessary for charge neutrality (as described for STO:Eu44) are neglected for simplicity.
Notably, t is below 1 for all considered REE-substituted perovskites independent of the substitution site (symbols in Fig. 7a). This means that (partial) REE incorporation into the investigated BMO perovskites with t > 1 can be interpreted as a mechanism to reduce t to achieve the most stable cubic perovskite phase with t = 1. If t is closer to 1 for a given REE and substitution site in Fig. 7a, a higher concentration in BMO is necessary to achieve t = 1. With this interpretation, we can compare the observed trends for the REE concentrations in BHO (higher Z leading to higher REE concentrations) with those for the t values.
A positive slope is observed in Fig. 7a for B-site substitution (×), whereas a negative slope is found for A-site substitution in BMO (other symbols). The positive slope for the B-site substitution means that, for example, more Er than Gd is required in BHO to achieve t = 1. This agrees with the observed trend that REEs with larger Z show higher concentrations in BHO (cf.Fig. 3–6), i.e. more Er than Gd in BHO. In contrast, an inverse trend in experimentally observed REE concentrations should be observed for the negative slope for A-site substitution according to Fig. 7a, which is not the case. Overall, the tolerance factor qualitatively agrees with the measured trend of REE concentrations in BHO for B-site (Hf site) substitution. This also matches the results of ref. 42 for BTO.
The t values in Fig. 7a can be interpreted yet in another way to qualitatively predict the substitution site: a t value closer to 1 may be associated with a higher substitution probability42 since the resulting REE-substituted perovskite phase has a t value closer to 1 and, hence, a higher perovskite stability. This interpretation suggests that the substitution site in BMO may change from B- to A-site for decreasing Z because the t values for A-site substitution are closer to 1 for REEs with smaller Z (Fig. 7a). For BHO, REEs with Z ≥ 60 (Nd) are more likely to populate the Hf site in BHO (×), whereas for Z < 60, the Ba site is preferred (•). Near this crossover point, a mixture of A- and B-site substitution is possible.42 Similar trends and crossover positions near Z = 60 are visible for BZO (▶) and BSO (♦).
In this work, all investigated REEs in the REBCO–BHO nanocomposites have Z ≥ 60. In this range, only B-site substitution is predicted based on Fig. 7a, and the positive slope means that REEs with higher Z have higher substitution probability into BMO, leading to higher REE concentrations. Again, this trend for B-site substitution fits with the shown experimental results (cf.Fig. 3–6). However, it is possible that the REE–BHO mixing behavior might change for Z < 60, but this aspect could not be investigated with our selection of REEs.
Besides optimizing t, charge compensation may explain the preferential Hf-site substitution by REE3+ in BHO, as discussed by Lim et al.46 A substitution of REE3+ on the Hf4+ site is accompanied by the generation of O vacancies to compensate for the different charges from Hf4+ and REE3+. This process may be advantageous compared to the substitution of REEs on Ba2+-sites in BHO, which requires cation vacancies or excess O and could result in secondary-phase formation (e.g., HfO2). Such secondary phases were not observed in our samples. Furthermore, Majkic et al.40 showed direct evidence for the substitution of Y on the Zr site of BZO in their (Gd,Y)BCO films by atomic-resolution STEM-EDXS measurements. They concluded that the actual stoichiometry of their BZO nanoparticles is Ba2+(Zr1−y4+REEy3+)O3−δ. Our findings for BHO agree with their conclusion for BZO. Hence, we suspect a stoichiometry of Ba2+(Hf1−y4+REEy3+)O3−δ for the BHO nanoparticles. Interestingly, the Gd signal in their atomic-resolution STEM-EDXS analysis was less clearly visible than the Y signal. Based on our results, we suspect that less Gd was incorporated into BZO compared to Y due to the larger ionic radius of Gd, resulting in a too-low Gd signal to resolve Gd on the Zr site.
For the other perovskites besides BHO, the values of t show the same trend but with a vertical shift due to differences in B-site ionic radii (Fig. 7a). The perovskites BHO, BZO, and BSO are comparable. For BTO (◀), the crossover point between preferential A- or B-site substitution based on t is at Z = 65 (Tb). This suggests that REE incorporation into BTO nanoparticles may differ from BHO, BZO, and BSO.
Besides BMO, barium-based double-perovskite nanoparticles with the stoichiometric formula Ba2BB′O5.5 or Ba2BB′′O6 are also used in REBCO films.74–79 These double perovskites consist of a trivalent REE on the B site (e.g., B = Y3+) and an element with valence four (e.g., B′ = Hf4+) or five (e.g., B′′ = Nb5+) on the B′ or B′′ sites. The case of Ba2RE3+Hf4+O5.5 is consistent with our findings for REE-substitution for Hf in the perovskite BHO, even though both crystal structures may not be directly comparable. Many publications emphasize the high chemical inertness of double perovskites in REBCO.74–76,79,80
Note that the tolerance factor is only a qualitative metric to predict perovskite-phase stability based on ionic radii. The substitution-site probability may be affected by other aspects such as charge compensation,44,46 exact A/B cation ratio,42 or oxygen partial pressure pO2.42 The latter two factors are especially important to consider for REBCO–BMO nanocomposites. Firstly, Ba is present in REBCO and BMO, and the A/B ratio in BMO may be affected by the surrounding Ba-containing REBCO matrix during fabrication. Secondly, REBCO is annealed in an O atmosphere with specific pO2 to optimize the superconducting properties of the nanocomposite (Table 1). Despite these limitations, the tolerance factor may still give valuable guidelines for predicting preferred A- or B-site substitution. For example, the crossover position at Z = 60 (Nd) between A- and B-site substitution for REEs into BZO (without REBCO) predicted in Fig. 7a is in good agreement with the work of Islam et al.,81 who used density functional theory to predict the REE substitution site in BZO based on energy minimization of the system.
Fig. 7a shows that the pristine perovskite phases all have t > 1 (horizontal lines) and that REE incorporation reduces t. The displayed t values (symbols in Fig. 7a) were calculated assuming a complete substitution of the A or B cations with REEs. In reality, a partial substitution of REEs on the cation positions is more reasonable, considering that the perovskite phase strives toward t = 1 and not to t < 1.
Fig. 7b shows the calculated t values for a partial substitution of three exemplary REEs (Gd, Ho, and Er) into BHO. For a varying REE concentration y in the range [0,1] on the Hf site, Ba(Hf1−yREEy)O3−δ, RB in eqn (1) becomes
| RB = y·RREE,CN6 + (1 − y)·RHf, | (2) |
| RA = y·RREE,CN12 + (1 − y)·RBa, | (3) |
Starting at t > 1 for pure BHO (y = 0), a linear decrease in t is observed for increasing REE occupation y for both substitution sides. The slope depends on the REE and the substitution site. Generally, A-site substitution (dashed lines in Fig. 7b) reaches t = 1 for lower concentrations y than B-site substitution (solid lines in Fig. 7b). A mixed A/B-site substitution results in a line between the dashed and dotted line for a given REE (not shown here). Inspection of the crossover positions for the optimal t = 1 gives a similar interpretation to Fig. 7a, i.e. that B-site substitution fits better with our experimental results. This can be seen by comparing the crossover positions for B-site substitution (solid lines, crossover marked with colored arrows in Fig. 7b), where REEs with larger Z (such as Er) require higher concentrations y in BHO to reach t = 1 than REE with lower Z (such as Gd). Again, this agrees with the observed trend of the REE concentration in BHO (cf.Fig. 3–6). In contrast, the trend for A-site substitution is reversed (see inset in Fig. 7b) and so would be the measured REE concentrations in BHO.
The optimal REE concentration yopt for t = 1 on the Hf site in BHO (cf. colored arrows in Fig. 7b), can be calculated using
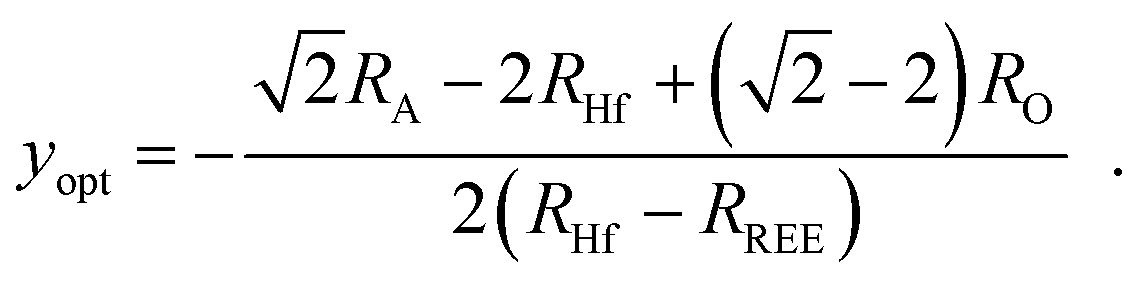 | (4) |
The measured REE concentrations from EDXS lead to calculated tolerance factors that are smaller than the optimal value t = 1, independent of the substitution site. For example, the measured Er concentration in BHO of 7.3 at% (corresponding to a site substitution y = 7.3% × 5 = 36.5%) for ErBCO results in t = 0.98 for B-site substitution and t = 0.95 for A-site substitution. A value t < 1 is unexpected when starting from t > 1 (Fig. 7b) for the pure perovskite phases without REEs, since it “overshoots” the optimal perovskite phase for t = 1. The crystallization process of the REBCO–BHO nanocomposite in the CSD method may explain this aspect. For CSD, the BMO phases typically crystallize before the REBCO phase.82 Miura et al.83 observed BHO formation at around 630 °C, significantly lower than the final Tcryst (Table 1). As a result, the crystalline BMO particles are essentially embedded in a REE-rich (amorphous) REBCO precursor solution. For our case of 12 mol% BHO, the REE:Hf atomic ratio is about 7:1. The high REE concentration may suggest an initial REE-rich perovskite (Ba,REE)(Hf,REE)O3−δ phase with possible REE substitutions on A and B site, resulting in a tolerance factor t ≪ 1. Then, the REEs are gradually removed from the perovskite to increase t toward 1. In this explanation, t = 1 is approached from t < 1 instead of t > 1 for the pure perovskite phase without REEs (Fig. 7b). The initial removal of REEs from the REE-rich perovskite with t ≪ 1 might be quite rapid, then asymptotically approach t = 1, and finally the REE concentration is fixed by stopping the REBCO–BHO crystallization (or oxygenation) process. This explanation suggests that the final REE concentration in BHO may also be affected by time-temperature curve used during crystallization (maybe even oxygenation), where the REEs are able to migrate out of the BMO particles at elevated temperatures. The final REE concentration in CSD may also differ from other fabrication methods, such as pulsed laser deposition, where the BMO and REBCO phases crystallize simultaneously.83
As a final aspect, eqn (4) can also be used to compare different BMO materials for a given REE. An interesting case is BTO, since it has a relatively large deviation from t = 1 (Fig. 7a) and differs quite significantly from the other shown BMO phases. Taking again Er with REr = 89.0 pm as an example, we find yEr = 10.2% for BHO and yEr = 43.3% for BTO (RTi = 60.5 pm instead of RHf = 71 pm in eqn (4)). This analysis suggests that a stronger incorporation of REEs into BTO compared to BHO is expected (for B-site substitution).
Overall, we want to emphasize that the discussion based on the tolerance factor in Fig. 7 is qualitative and considers only the phase stability of the BMO nanoparticles from a geometrical point of view. In addition to the factors affecting REE substitution into BMO (charge compensation,44,46 A/B cation ratio, pO242), aspects about the REE-dependent phase formation84 and stability85 of the REBCO phase are also important. For the latter, YBCO is considered as the most stable REBCO phase21,85,86 and an exchange of Ba/REE with M-site elements from BMO may be favorable for REBCO phase stability. Overall, a complex interaction between two crystalline phases – REBCO and BMO – during film fabrication dictates the final REE distribution. Even though our work gives new insights into this complicated behavior, further experiments with other REBCO–BMO nanocomposites are required to better understand REE–BMO intermixing and its predictability using a simple metric such as t.
Conclusions
In this work, we applied analytical scanning transmission electron microscopy to investigate the local chemistry of BaHfO3 nanoparticles in five different REBCO–BaHfO3 nanocomposites with varying REE concentrations (mixed- and single-REE REBCO). The two main results regarding the intermixing between REEs and BHO nanoparticles are:(1) The REE incorporation into BHO increases for REEs with smaller ionic radii.
(2) The REE incorporation into BHO is different in single-REE and mixed-REE nanocomposites. For the latter, REEs with smaller ionic radii mix more strongly with BHO compared to single-REE REBCO.
From these observations, it can be concluded that these REE–BHO-intermixing effects should be considered for the choice of REEs in REBCO–BMO nanocomposites. The loss of REEs from the main REBCO phase into the nanoparticles may be compensated by, e.g., increasing the REE content in the precursor materials. This is particularly important for REEs with small ionic radii. Additionally, the dependence of REE–BHO intermixing on the ionic radii for different REEs complicates the fabrication of mixed-REE nanocomposites. Based on calculated values for the Goldschmidt tolerance factor, the discussion for REE–BHO intermixing was extended to other barium oxides (BaZrO3, BaTiO3, and BaSnO3). Similar trends as for BHO can be expected for these compounds, albeit BaTiO3 may differ the most from the BHO case. However, further experimental studies on other combinations of REBCO–BMO nanocomposites are necessary to understand the interaction of REEs with BMO perovskites even better. Since only CSD-grown films were analyzed, the REE–BMO intermixing should also be studied for other fabrication techniques (e.g., pulsed laser deposition). The results of this study add to the knowledge of APC engineering in REBCO nanocomposites to enhance REBCO performance for technical applications.
Author contributions
LG, PC, JH, BH, and DG conceptualized the work and methodology. PC and ME prepared the samples, performed XRD measurements, and measured the superconducting properties. LG performed STEM experiments, STEM-data analyses, and created visualizations. BH, JH, and DG supervised the project and acquired funding. All authors contributed to the writing of the original draft and the review.Data availability statement
Raw data files and Jupyter notebooks for data treatment and calculations are available on Zenodo.93Conflicts of interest
There are no conflicts to declare.Acknowledgements
We want to acknowledge the developers and maintainers of various Python packages used in this work: NumPy,87 HyperSpy,56 Matplotlib,88 pandas,89 uncertainties,90 mendeleev,91 and SciencePlots.92Notes and references
- J. G. Bednorz and K. A. Müller, Z. Phys. B: Condens. Matter, 1986, 64, 189–193 Search PubMed.
- M. K. Wu, J. R. Ashburn, C. J. Torng, P. H. Hor, R. L. Meng, L. Gao, Z. J. Huang, Y. Q. Wang and C. W. Chu, Phys. Rev. Lett., 1987, 58, 908–910 Search PubMed.
- C. Kwon, L. R. Kinder, Y. Gim, Y. Fan, J. Y. Coulter, M. P. Maley, S. R. Foltyn, D. E. Peterson and Q. X. Jia, IEEE Trans. Appl. Supercond., 1999, 9, 1575–1578 Search PubMed.
- M. Erbe, P. Cayado, W. Freitag, K. Ackermann, M. Langer, A. Meledin, J. Hänisch and B. Holzapfel, Supercond. Sci. Technol., 2020, 33, 094002 Search PubMed.
- D. Larbalestier, A. Gurevich, D. M. Feldmann and A. Polyanskii, Nature, 2001, 414, 368–377 Search PubMed.
- S. R. Foltyn, L. Civale, J. L. MacManus-Driscoll, Q. X. Jia, B. Maiorov, H. Wang and M. Maley, Nat. Mater., 2007, 6, 631–642 Search PubMed.
- Y. Shiohara, T. Taneda and M. Yoshizumi, Jpn. J. Appl. Phys., 2011, 51, 010007 Search PubMed.
- X. Obradors and T. Puig, Supercond. Sci. Technol., 2014, 27, 044003 Search PubMed.
- A. K. Jha and K. Matsumoto, Front. Phys., 2019, 7, 82 Search PubMed.
- J. L. MacManus-Driscoll and S. C. Wimbush, Nat. Rev. Mater., 2021, 6, 587–604 Search PubMed.
- M. Erbe, J. Hänisch, R. Hühne, T. Freudenberg, A. Kirchner, L. Molina-Luna, C. Damm, G. Van Tendeloo, S. Kaskel, L. Schultz and B. Holzapfel, Supercond. Sci. Technol., 2015, 28, 114002 Search PubMed.
- M. Inoue, Y. Yamaguchi, T. Sakakibara, K. Imamura, K. Higashikawa, T. Kiss, S. Awaji, K. Watanabe, H. Tobita, M. Yoshizumi and T. Izumi, IEEE Trans. Appl. Supercond., 2013, 23, 8002304 Search PubMed.
- S. Awaji, Y. Yoshida, T. Suzuki, K. Watanabe, K. Hikawa, Y. Ichino and T. Izumi, Appl. Phys. Express, 2015, 8, 023101 Search PubMed.
- G. Blatter, M. V. Feigel’man, V. B. Geshkenbein, A. I. Larkin and V. M. Vinokur, Rev. Mod. Phys., 1994, 66, 1125–1388 Search PubMed.
- J. P. F. Feighan, A. Kursumovic and J. L. MacManus-Driscoll, Supercond. Sci. Technol., 2017, 30, 123001 Search PubMed.
- H. Yamasaki, Supercond. Sci. Technol., 2019, 32, 09LT01 Search PubMed.
- J. L. MacManus-Driscoll, B. Maiorov, J. Durrell, S. Foltyn, Q. X. Jia, L. Civale, H. Wang, A. Kursumovic and D. E. Peterson, Supercond. Sci. Technol., 2006, 19, S55–S59 Search PubMed.
- P. Cayado, M. Erbe, S. Kauffmann-Weiss, A. Jung, J. Hänisch and B. Holzapfel, RSC Adv., 2018, 8, 42398–42404 Search PubMed.
- P. Cayado, M. Li, M. Erbe, Z. Liu, C. Cai, J. Hänisch and B. Holzapfel, R. Soc. Open Sci., 2020, 7, 201257 Search PubMed.
- J. Feighan, M. H. Lai, A. Kursumovic, D. Zhang, H. Wang, J. H. Lee, S. Moon and J. L. MacManus-Driscoll, Supercond. Sci. Technol., 2021, 34, 045012 Search PubMed.
- M. Murakami, N. Sakai, T. Higuchi and S. I. Yoo, Supercond. Sci. Technol., 1996, 9, 1015–1032 Search PubMed.
- J. L. MacManus-Driscoll, S. R. Foltyn, Q. X. Jia, H. Wang, A. Serquis, B. Maiorov, L. Civale, Y. Lin, M. E. Hawley, M. P. Maley and D. E. Peterson, Appl. Phys. Lett., 2004, 84, 5329–5331 Search PubMed.
- A. R. Devi, V. S. Bai, P. V. Patanjali, R. Pinto, N. H. Kumar and S. K. Malik, Supercond. Sci. Technol., 2000, 13, 935–939 Search PubMed.
- M. Muralidhar and M. Murakami, Supercond. Sci. Technol., 2000, 13, 1315–1321 Search PubMed.
- C. Cai, J. Hänisch, T. Gemming and B. Holzapfel, IEEE Trans. Appl. Supercond., 2005, 15, 3738–3741 Search PubMed.
- J. L. MacManus-Driscoll, S. R. Foltyn, B. Maiorov, Q. X. Jia, H. Wang, A. Serquis, L. Civale, Y. Lin, M. E. Hawley, M. P. Maley and D. E. Peterson, Appl. Phys. Lett., 2005, 86, 032505 Search PubMed.
- H. Jian, D. Shao, Z. Yang, X. Zhu and Y. Sun, Phys. C, 2013, 488, 39–45 Search PubMed.
- A. Sarkar, Q. Wang, A. Schiele, M. R. Chellali, S. S. Bhattacharya, D. Wang, T. Brezesinski, H. Hahn, L. Velasco and B. Breitung, Adv. Mater., 2019, 31, 1806236 Search PubMed.
- Y. Shukunami, A. Yamashita, Y. Goto and Y. Mizuguchi, Phys. C, 2020, 572, 1353623 Search PubMed.
- K. Wang, Q. Hou, A. Pal, H. Wu, J. Si, J. Chen, S. Yu, Y. Chen, W. Lv, J. Y. Ge, S. Cao, J. Zhang and Z. Feng, J. Supercond. Novel Magn., 2021, 34, 1379–1385 Search PubMed.
- A. Yamashita, Y. Shukunami and Y. Mizuguchi, R. Soc. Open Sci., 2022, 9, 211874 Search PubMed.
- J. Chen, R. Huang, X. Zhou, D. Zhou, M. Li, C. Bai, Z. Liu and C. Cai, J. Rare Earths, 2023, 41, 1091–1098 Search PubMed.
- P. Cayado, L. Grünewald, M. Erbe, J. Hänisch, D. Gerthsen and B. Holzapfel, RSC Adv., 2022, 12, 28831–28842 Search PubMed.
- J. L. MacManus-Driscoll, S. R. Foltyn, Q. X. Jia, H. Wang, A. Serquis, L. Civale, B. Maiorov, M. E. Hawley, M. P. Maley and D. E. Peterson, Nat. Mater., 2004, 3, 439–443 Search PubMed.
- R. Kita, S. Kato, T. Nakamura, O. Miura, R. Teranishi, S. Yasunaga, H. Kai, M. Mukaida, A. Ichinose, K. Matsumoto, M. S. Horii and Y. Yoshida, Phys. C, 2008, 468, 1391–1394 Search PubMed.
- K. Yamada, M. Mukaida, H. Kai, R. Teranishi, A. Ichinose, R. Kita, S. Kato, S. Horii, Y. Yoshida, K. Matsumoto and S. Toh, Appl. Phys. Lett., 2008, 92, 112503 Search PubMed.
- D. M. Feldmann, T. G. Holesinger, B. Maiorov, S. R. Foltyn, J. Y. Coulter and I. Apodaca, Supercond. Sci. Technol., 2010, 23, 095004 Search PubMed.
- J. Díez-Sierra, H. Rijckaert, M. Rikel, J. Hänisch, M. Sadewasser, L. Koliotassis, A. Meledin, P. López-Domínguez, M. Falter, J. Bennewitz, M. Bäcker and I. V. Driessche, Supercond. Sci. Technol., 2021, 34, 114001 Search PubMed.
- H. Yun and K. A. Mkhoyan, Microsc. Microanal., 2021, 27, 3298–3299 Search PubMed.
- G. Majkic, J. S. Jeong, H. Yun, F. C. R. Hernandez, E. Galstyan, R. Pratap, H. Cheng, A. Stokes, K. A. Mkhoyan and V. Selvamanickam, Supercond. Sci. Technol., 2021, 34, 115002 Search PubMed.
- H. Kai, M. Mukaida, S. Horii, A. Ichinose, R. Kita, S. Kato, K. Matsumoto, Y. Yoshida, R. Teranishi, K. Yamada and N. Mori, Phys. C, 2007, 463–465, 895–899 Search PubMed.
- Y. Tsur, T. D. Dunbar and C. A. Randall, J. Electroceram., 2001, 7, 25–34 Search PubMed.
- Y. Sakabe, Y. Hamaji, H. Sano and N. Wada, Jpn. J. Appl. Phys., 2002, 41, 5668 Search PubMed.
- C. Jiang, L. Fang, M. Shen, F. Zheng and X. Wu, Appl. Phys. Lett., 2009, 94, 071110 Search PubMed.
- A. Dobrowolska and E. Zych, Chem. Mater., 2010, 22, 4652–4659 Search PubMed.
- H. Lim, S. Jang, D. Lee and Y. S. Lee, J. Korean Phys. Soc., 2021, 78, 510–515 Search PubMed.
- P. Schweiss, W. Reichardt, M. Braden, G. Collin, G. Heger, H. Claus and A. Erb, Phys. Rev. B: Condens. Matter Mater. Phys., 1994, 49, 1387–1396 Search PubMed.
- T. Pagnier, I. Charrier-Cougoulic, C. Ritter and G. Lucazeau, Eur. Phys. J.: Appl. Phys., 2000, 9, 1–9 Search PubMed.
- T. Maekawa, K. Kurosaki and S. Yamanaka, J. Alloys Compd., 2006, 407, 44–48 Search PubMed.
- K. Momma and F. Izumi, J. Appl. Crystallogr., 2011, 44, 1272–1276 Search PubMed.
- M. Erbe, J. Hänisch, T. Freudenberg, A. Kirchner, I. Mönch, S. Kaskel, L. Schultz and B. Holzapfel, J. Mater. Chem. A, 2014, 2, 4932–4944 Search PubMed.
- R. M. Langford and C. Clinton, Micron, 2004, 35, 607–611 Search PubMed.
- J. Mayer, L. A. Giannuzzi, T. Kamino and J. Michael, MRS Bull., 2007, 32, 400–407 Search PubMed.
- M. Schaffer, B. Schaffer and Q. Ramasse, Ultramicroscopy, 2012, 114, 62–71 Search PubMed.
- P. Schlossmacher, D. O. Klenov, B. Freitag and H. S. von Harrach, Microsc. Today, 2010, 18, 14–20 Search PubMed.
- F. de la Peña, E. Prestat, V. T. Fauske, P. Burdet, J. Lähnemann, P. Jokubauskas, T. Furnival, M. Nord, T. Ostasevicius, K. E. MacArthur, D. N. Johnstone, M. Sarahan, T. Aarholt, J. Taillon, pquinn-dls, V. Migunov, A. Eljarrat, J. Caron, C. Francis, T. Nemoto, T. Poon, S. Mazzucco, actions-user, N. Tappy, N. Cautaerts, S. Somnath, T. Slater, M. Walls, F. Winkler and DENSmerijn, 2022, hyperspy/hyperspy Release v1.7.1 DOI:10.5281/zenodo.6659919.
- P. Potapov, Ultramicroscopy, 2016, 160, 197–212 Search PubMed.
- I. T. Jolliffe and J. Cadima, Philos. Trans. R. Soc., A, 2016, 374, 20150202 Search PubMed.
- D. E. Newbury and N. W. M. Ritchie, J. Mater. Sci., 2015, 50, 493–518 Search PubMed.
- D. E. Newbury and D. S. Bright, Scanning, 2006, 27, 15–22 Search PubMed.
- Y. Boykov and V. Kolmogorov, IEEE Trans. Pattern Anal. Mach. Intell., 2004, 26, 1124–1137 Search PubMed.
- J. Schindelin, I. Arganda-Carreras, E. Frise, V. Kaynig, M. Longair, T. Pietzsch, S. Preibisch, C. Rueden, S. Saalfeld, B. Schmid, J. Y. Tinevez, D. J. White, V. Hartenstein, K. Eliceiri, P. Tomancak and A. Cardona, Nat. Methods, 2012, 9, 676–682 Search PubMed.
- A. Belsky, M. Hellenbrandt, V. L. Karen and P. Luksch, Acta Crystallogr., Sect. B: Struct. Sci., 2002, 58, 364–369 Search PubMed.
- J. Hänisch, K. Iida, P. Cayado, M. Erbe, L. Grünewald, T. Hatano, T. Okada, D. Gerthsen, S. Awaji and B. Holzapfel, Supercond. Sci. Technol., 2022, 35, 084009 Search PubMed.
- S. I. Bondarenko, V. P. Koverya, A. V. Krevsun and S. I. Link, Low Temp. Phys., 2017, 43, 1125–1151 Search PubMed.
- B. Mundet, R. Guzmán, E. Bartolomé, A. R. Lupini, S. Hartman, R. Mishra and J. Gázquez, in Superconductivity: From Materials Science to Practical Applications, ed. P. Mele, K. Prassides, C. Tarantini, A. Palau, P. Badica, A. K. Jha and T. Endo, Springer International Publishing, Cham, 2020, pp. 189–212 Search PubMed.
- T. Thersleff, PhD thesis, Technische Universtiät Dresden, 2011.
- R. Kilaas, J. Microsc., 1998, 190, 45–51 Search PubMed.
- S. J. Pennycook, Ultramicroscopy, 1989, 30, 58–69 Search PubMed.
- R. D. Shannon, Acta Crystallogr., Sect. A: Cryst. Phys., Diffr., Theor. Gen. Crystallogr., 1976, 32, 751–767 Search PubMed.
- P. Potapov and A. Lubk, Adv. Struct. Chem. Imaging, 2019, 5, 4 Search PubMed.
- A. A. B. Baloch, S. M. Alqahtani, F. Mumtaz, A. H. Muqaibel, S. N. Rashkeev and F. H. Alharbi, Phys. Rev. Mater., 2021, 5, 043804 Search PubMed.
- V. M. Goldschmidt, Naturwissenschaften, 1926, 14, 477–485 Search PubMed.
- J. K. Thomas, J. Koshy, J. Kurian, Y. P. Yadava and A. D. Damodaran, J. Appl. Phys., 1994, 76, 2376–2379 Search PubMed.
- P. P. Rejith, S. Vidya and J. K. Thomas, Cryogenics, 2015, 72, 1–8 Search PubMed.
- G. Ercolano, S. A. Harrington, H. Wang, C. F. Tsai and J. L. MacManus-Driscoll, Supercond. Sci. Technol., 2010, 23, 022003 Search PubMed.
- L. Opherden, M. Sieger, P. Pahlke, R. Hühne, L. Schultz, A. Meledin, G. Van Tendeloo, R. Nast, B. Holzapfel, M. Bianchetti, J. L. MacManus-Driscoll and J. Hänisch, Sci. Rep., 2016, 6, 21188 Search PubMed.
- T. G. Holesinger, M. D. Feldmann, B. Maiorov, L. Civale, J. A. Kennison, Y. J. Coulter, P. D. Dowden, J. F. Baca, P. H. Tobash, E. D. Bauer and K. R. Marken, Materials, 2011, 4, 2042–2056 Search PubMed.
- S. H. Wee, A. Goyal, Y. L. Zuev, C. Cantoni, V. Selvamanickam and E. D. Specht, Appl. Phys. Express, 2010, 3, 023101 Search PubMed.
- J. Koshy, J. Kurian, J. K. Thomas, Y. P. Y. Y. P. Yadava and A. D. D. A. D. Damodaran, Jpn. J. Appl. Phys., 1994, 33, 117 Search PubMed.
- M. S. Islam, P. R. Slater, J. R. Tolchard and T. Dinges, Dalton Trans., 2004, 3061–3066 Search PubMed.
- M. Miura, M. Yoshizumi, T. Izumi and Y. Shiohara, Supercond. Sci. Technol., 2009, 23, 014013 Search PubMed.
- M. Miura, B. Maiorov, M. Sato, M. Kanai, T. Kato, T. Kato, T. Izumi, S. Awaji, P. Mele, M. Kiuchi and T. Matsushita, NPG Asia Mater., 2017, 9, e447 Search PubMed.
- C. Andreouli and A. Tsetsekou, Phys. C, 1997, 291, 274–286 Search PubMed.
- J. A. G. Nelstrop and J. L. MacManus-Driscoll, Phys. C, 2002, 377, 585–594 Search PubMed.
- J. L. MacManus-Driscoll, J. A. G. Nelstrop, A. Berenov and X. Qi, Phys. C, 2003, 384, 507–513 Search PubMed.
- C. R. Harris, K. J. Millman, S. J. van der Walt, R. Gommers, P. Virtanen, D. Cournapeau, E. Wieser, J. Taylor, S. Berg, N. J. Smith, R. Kern, M. Picus, S. Hoyer, M. H. van Kerkwijk, M. Brett, A. Haldane, J. F. del Río, M. Wiebe, P. Peterson, P. Gérard-Marchant, K. Sheppard, T. Reddy, W. Weckesser, H. Abbasi, C. Gohlke and T. E. Oliphant, Nature, 2020, 585, 357–362 Search PubMed.
- J. D. Hunter, Comput. Sci. Eng., 2007, 9, 90–95 Search PubMed.
- The Pandas Development Team, 2023, pandas-dev/pandas (version v2.0.1) DOI:10.5281/zenodo.3509134.
- E. O. Lebigot, Uncertainties: a Python package for calculations with uncertainties, 2010, https://pythonhosted.org/uncertainties/.
- Ł. Mentel, mendeleev – A Python resource for properties of chemical elements, ions and isotopes (version 0.9.0), 2021 DOI:10.5281/zenodo.5233824.
- J. D. Garrett, Echedey Luis, H.-H. Peng, T. Cera, Gobinathj, H. Tian, M. Keçeci, S. Iyer, Yuming Liu and Cjw, garrettj403/SciencePlots (version 2.0.1), 2022 DOI:10.5281/zenodo.4106649.
- L. Grünewald, P. Cayado, M. Erbe, J. Hänisch, B. Holzapfel and D. Gerthsen, Supplementary Information for Analytical electron microscopy study of the composition of BaHfO3 nanoparticles in REBCO films, 2023 DOI:10.5281/zenodo.8041867.
Footnotes |
| † Electronic supplementary information (ESI) available: Additional STEM analyses and details of data treatment. See DOI: https://doi.org/10.1039/d3ma00447c |
| ‡ Authors contributed equally to this work. |
| This journal is © The Royal Society of Chemistry 2023 |