
 Open Access Article
 This Open Access Article is licensed under a Creative Commons Attribution-Non Commercial 3.0 Unported Licence
Unveiling the capability of graphitic carbon nitride–rhenium disulfide nanocomposite as an electrochemical sensing platform for the detection of dimetridazole from human serum samples†
M.
Mufeeda
ab,
Pushpalatha V.
Vaishag
ab,
Menon
Ankitha
 b and
P. Abdul
Rasheed
*ab
b and
P. Abdul
Rasheed
*ab
aDepartment of Biological Sciences and Engineering, Indian Institute of Technology Palakkad, Palakkad, Kerala 678 557, India. E-mail: abdulrasheed@iitpkd.ac.in
bDepartment of Chemistry, Indian Institute of Technology Palakkad, Palakkad, Kerala 678 557, India
First published on 8th August 2023
Abstract
The increase in pharmaceutical contamination has become a pressing environmental issue that poses a threat to public health on a global scale and has a far-reaching impact on the existence of every corner of the world. Its extensive consumption and improper disposal lead to various adverse effects on humans, animals, and the environment. Herein, we present a novel approach for the electrochemical sensing of dimetridazole (DMZ) using a graphitic carbon nitride–rhenium disulfide (CN–ReS2) composite. Dimetridazole is an antimicrobial medication used in animal feed and used as a drug in human and veterinarian medicine to treat protozoal infections. Considering its negative impacts, it is highly essential to detect the presence of DMZ in our bodies and the environment. It is noteworthy that this is the first time, CN–ReS2 is being reported for electrochemical sensing applications. The CN–ReS2 composite was synthesized using a one-step hydrothermal method, and the material characterization revealed that ReS2 forms flower-like structures on the flaky sheets of CN. The CN–ReS2 composite demonstrated enhanced electrochemical activity towards the reduction of dimetridazole in addition to its high operational and storage stability. The electrocatalytic activity of the composite was optimized by the precise tuning of the CN and ReS2 weight ratios, and it was found that 3% ReS2 (CN–ReS2-3) shows an enhanced electrochemical response. The developed sensor displayed a promising limit of detection of 19.8 nM in a wide linear range of 50–1000 nM and with a good sensitivity of 0.246 μA nM−1 cm−2. The developed sensor also showed rapid detection (within 5 s), excellent selectivity, storage stability, repeatability, reproducibility, and flexibility in addition to real sample applications. A prototype of the sensor was also made, and the response was evaluated with a conventional three-electrode sensor. The results of this study suggests that CN–ReS2 has great potential for use as an immobilization platform for highly sensitive and selective electrochemical sensing applications.
1. Introduction
Since the discovery of antibiotics in the early 1920s, their use has attained substantial advancement in the healthcare industry and food sector.1 The effects of these medications have aided in supplementing animal feed, which has resulted in improved growth and prevention of infections for decades.2 Normally, 5 to 10 g kg−1 of antibiotics in feed were the recommended levels in the 1950s, which has increased to nearly 20-fold to meet the needs of the growing human population, thereby causing serious health issues.3 Dimetridazole (DMZ) is majorly known to act against anaerobic and protozoal infections in poultry owing to its antibacterial and anti-protozoal activity.4,5 DMZ is chemically 1,2-dimethyl-5-nitroimidazole (C5H7N3O2), which is a commonly administered veterinary drug that falls under the nitroimidazole category of antibiotics. In humans, DMZ is known to be effective against skin ulcers, trichomonas, mouth infections, and pelvic inflammatory diseases.4,6 Reports prove that the excessive use of DMZ is known to cause mutations in bacteria and mammalian cells, which eventually promotes the spread of malignant tumors.7 Owing to its mutagenic and carcinogenic effects, their use for food-producing animals as veterinary medicines or feed additives has been forbidden within the European Union for decades.5,7 Apart from these harmful health issues, the overdosage of DMZ indirectly resulted in its accumulation in water bodies, which contaminated the ground-water systems.8,9 Thus, there is an urgent need for the fabrication of rapid analytical sensor tools with satisfactory sensor parameters for the detection of DMZ.Conventional detection of DMZ includes liquid chromatography,10 high-performance liquid chromatography,11,12 gas chromatography,13,14 and capillary electrophoresis.15,16 Its intrinsic drawbacks include time dependence, cost-effectiveness, extremely sophisticated instrumentation, the need for trained operators, high analytical costs, poor sensitivity, and selectivity.17 Conversely, the electrochemical analysis technique offers numerous advantages, such as being quick, portable, more sensitive, and affordable, with a lower detection limit.17 Various electrochemical sensors have been reported recently for the electrochemical detection of DMZ. Ali et al. developed an MIP-based electrochemical sensor by incorporating DMZ as a template.5 The electro polymerization was carried out on a glassy carbon electrode (GCE) using poly-arginine (P-Arg) and a molecularly imprinted polymer (MIP). The modified electrode GCE/P-Arg@MIP was characterized by the voltammetric and differential pulse voltammetry method and was able to detect DMZ with a promising limit of detection (LOD) of 0.1 nM. Yang et al. also reported a MIP-based sensor with gold nanoparticles coated on mesoporous carbon and porous graphene-modified GCE.18 This electrochemical sensor displayed an enhanced sensor response for DMZ with a LOD of 0.5 nM and two linear ranges from 2.0 to 250 nM and 250 nM to 3.0 μM. Umesh et al. reported on the preparation of a composite of selenium nanorods (Se)-doped cobalt oxide (Co3O4) nanoflowers encapsulated with graphene oxide (GO) and used as an electrochemical sensing platform for DMZ detection after coating on GCE.19 The developed sensor displayed a linear range of 0.02–83.72 μM with a LOD of 3.4 nM for DMZ detection.
Carbonaceous materials combined with other functional materials can tailor the electronic properties of the parent material and impart numerous active sites. This leads to an enhancement in the electrochemical activity of the composite compared to the carbonaceous material.19 Sriram et al.20 synthesized Ni–Fe-layered double hydroxide nanosheets/sulfur-doped carbon nitride (CN) heterostructure by applying green and ecologically benign synthesis methods with improved electrocatalytic activity. The use of this composite in the developed sensor supports its perceptions with higher sensitivity, wide linear-range responses of 0.008–110.77 μM, and a LOD of 1.6 nM along with appreciable stability and selectivity. The same research group introduced yttrium orthovanadate confined to CN sheets for the electrochemical detection of DMZ.4 The modification and tuning of the CN with the yttrium orthovanadate helped to exhibit appreciably good responses towards the reduction in DMZ. The developed sensor indicated two linear ranges of 0.001–153.3 and 176.64–351.6 μM with a low LOD of 0.8 nM.
These studies prove that in the context of electrochemical sensors, carbon-based sensing materials are well known owing to their superior electrocatalytic properties. CN has already been established as the base carbonaceous material for making the composite for the electrochemical detection of DMZ. CN with a formula of g-C3N4 resembles graphene in its structure, but it is a polymeric-layered material with semiconductor behaviour with excellent optical, mechanical, and thermal properties.21–23 The layers of CN are stacked by weak van der Waals forces and hence can be easily exfoliated into nanosheets, thereby providing increased surface area.24 The presence of N atoms permits the donation of electrons, and the presence of the tri-s-triazine ring structure boosts electronic conductivity.25 The incorporation of metallic or non-metallic constituents into the CN facilitates auxiliary binding and adsorption sites that modulate the sensor performance owing to its better utility and functionalities.26–28
2D/2D heterostructures have evolved as one of the remarkable materials for the development and fabrication of newer electrochemical technologies that reflect enhanced properties in comparison to their counterparts.29 These possess abundant active sites and impart superior electrochemical activity because of the presence of ample charge carriers at the interfaces. Transition metal dichalcogenides (TMDC) with a lamellar structure and highly exposed edge sites are highly favourable for the formation of these 2D/2D heterostructures with materials, such as CN, which, in turn, imparts a catalytic nature towards the electrochemical sensing.30 Among the various TMDCs, rhenium disulphide (ReS2) is rapidly gaining popularity and attention owing to its extraordinary physiochemical properties and a direct band gap.31 However, the poor electron transport capability of ReS2 limits its wider application in different fields.32,33 To overcome this, researchers have utilized ReS2 to fabricate composites with CN and used them as catalysts in photocatalytic applications.34–36 However, there is no report on electrochemical sensors based on CN–ReS2 composite to the best of our knowledge.
In this study, we propose a simple one-pot hydrothermal synthesis method to prepare CN–ReS2, which is used to modify carbon cloth (CC) for the electrochemical determination of DMZ. The CN–ReS2 composite provided an enhanced sensor response by introducing sufficient active sites and facilitating an electron transfer network owing to the synergistic effects between ReS2 and CN. Moreover, CN could provide a large specific surface area, which enabled anchoring and uniform distribution of ReS2 for rapid analyte adsorption, thereby enhancing the electrochemical response. The strong electron donating nature of nitrogen through the C–N covalent bonds, along with its intercalation with Re–S, enhances the active sites of electronic conductivity, making the CN–ReS2 composite an ideal candidate for sensor platform development.37,38 To the best of our knowledge, this is the first report introducing CN–ReS2 composite for the development of an electrochemical sensor; here, we tested with DMZ.
2. Experimental section
2.1. Materials
Details about the chemicals and reagents are provided in the ESI.†2.2. Synthesis of graphitic carbon nitride (CN)
CN was synthesized by heating 2 g of melamine in a silica crucible at 823 K for 4 hours using a previously reported technique of thermal condensation.39 The resulting solid product, which is yellow, is then finely ground using a mortar and pestle to obtain a fine powder of CN. A schematic representation of the conversion of melamine to CN is provided in Scheme S1 (ESI†).2.3. Synthesis of ReS2
ReS2 was synthesized using a one-step hydrothermal method as per previous reports.40 Specifically, 536 mg of ammonium perrhenate (NH4ReO4), 417 mg of hydroxylamine hydrochloride (NH2OH-HCl), and 685 mg of thiourea (CS(NH2)2) was combined with 60 mL of deionized (DI) water and stirred for 30 minutes. The resulting colourless solution was then carefully transferred to a Teflon-lined stainless-steel autoclave and kept in a conventional furnace at 180 °C for 24 hours. The obtained product was subsequently washed with DI water and ethanol and dried in an oven at 60 °C overnight. Finally, the resulting black-coloured powder was ground well and designated as ReS2. Scheme S2 (ESI†) shows the hydrothermal synthesis method for the synthesis of ReS2.2.4. Synthesis of CN–ReS2 composite
The CN–ReS2 composite was synthesized through a similar in situ hydrothermal process as mentioned for the synthesis of ReS2 along with specific amounts of CN. Initially, a mixture of 20 g ammonium perrhenate (NH4ReO4), 25.5 g thioacetamide (C2H5NS), and 19.5 g hydroxylamine hydrochloride (NH2OH-HCl) was dissolved in 30 mL of DI water and stirred for 10 minutes. Next, 250 mg of CN was slowly added to the mixture and sonicated for 2 hours. The resulting yellow suspension was then transferred to an autoclave and subjected to a hydrothermal reaction at 823 K for 12 hours. Thus, a black-coloured solution was obtained and washed with water multiple times. The precipitate was collected and dried at 60 °C for 6 hours. This final product was labeled CN–ReS2-3 because it was prepared by a percentage ratio of 97![[thin space (1/6-em)]](https://www.rsc.org/images/entities/char_2009.gif) :3 (CN:ReS2). Other compositions, CN–ReS2-1 and CN–ReS2-6 with varying weight percentages were synthesized by varying the amounts of NH4ReO4, C2H5NS, and NH2OH-HCl while keeping the amount of CN constant.
:3 (CN:ReS2). Other compositions, CN–ReS2-1 and CN–ReS2-6 with varying weight percentages were synthesized by varying the amounts of NH4ReO4, C2H5NS, and NH2OH-HCl while keeping the amount of CN constant.
2.5. Fabrication of modified electrodes
Fabrication of the working electrode was performed by modifying CC with CN–ReS2 composites (1 mg mL−1) and kept for drying for 3 h in a closed atmosphere. A 1 mg mL−1 solution of the desired CN–ReS2 composite was prepared by dissolving 1 mg of CN–ReS2 in 1 mL of dimethyl sulfoxide (DMSO) and sonicated for 20 min to obtain uniform dispersion. The modification of CC was carried out by dropping 50 μL of CN–ReS2 suspension and drying it at 60 °C in the oven for 15 minutes. The CCs were modified with pristine CN and ReS2 of the same concentration for comparison purposes. The area of the working electrode was maintained at 1 cm2 throughout the experiment to avoid measurement errors. All electrochemical analyses were carried out by applying a CHI6038 electrochemical workstation using Pt wire as the counter electrode and a calomel electrode as the reference electrode. A 0.1 M phosphate buffer (PB) solution was used as the electrolyte in all the experiments. A prototype device was designed using an acrylic sheet with provisions to maintain the working electrode, counter, and reference electrode and tested the electrochemical sensing capability. Ag/AgCl wire electrode was used as the reference electrode, and a carbon cloth thread was used as the counter electrode.2.6. Real samples
Milk and tomato juice samples were procured from institutional stores, and 2 mL of the sample was dispensed into polypropylene centrifugal tubes and diluted 10 times using a 0.1 M PB solution. Subsequently, the known concentration of DMZ (100 nM and 1 μM) was spiked to this, and the resulting samples were vigorously agitated to ensure uniform dispersion; subsequent analysis was carried out accordingly.4 The resultant mixture was used as the electrolyte for the electrochemical experiments. Similarly, human serum samples were diluted 10 times and spiked with a known concentration of DMZ (100 nM and 1 μM).3. Results and discussion
3.1. Characterization of CN–ReS2 composite
The CN–ReS2 composite was synthesized by an in situ hydrothermal process, as mentioned in the experimental section, with specific amounts of CN while varying the concentration of ReS2. Scheme 1 shows the steps for the synthesis of CN–ReS2 composite and the fabrication of an electrochemical sensor for the detection of DMF.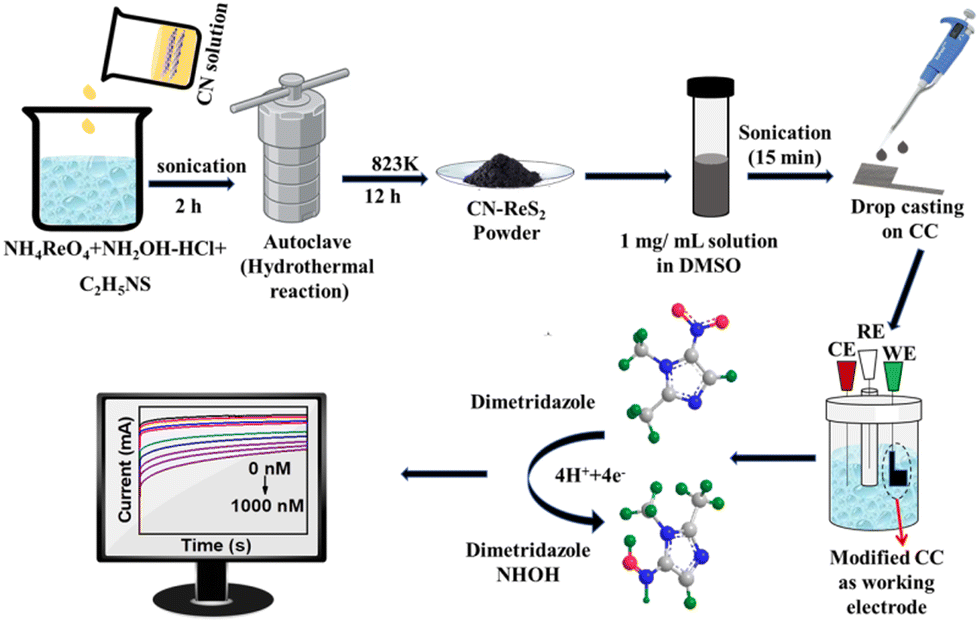 | ||
| Scheme 1 Schematic diagram showing the steps for the synthesis of CN–ReS2 composite and the fabrication of an electrochemical sensor for the detection of DMZ. | ||
Scanning electron microscopy (SEM: Carl Zeiss Gemini SEM 300) and transmission electron microscopy (TEM: JEOL 3010) images were used to characterize the morphology of the synthesized composite. The surface morphologies of CN and CN–ReS2 are depicted in Fig. 1(a) and (b), respectively. The SEM image of CN demonstrates the stacked sheet-like morphology of CN, which forms a solid aggregate in a non-uniform dimension.20 As observed in Fig. 1(b), ReS2 forms numerous clusters that resemble flower-like structures on the flaky sheets of CN. Here, ReS2 and CN maintain their distinct morphologies, suggesting that the ReS2 is tightly bound to the CN surface. The elemental composition and spatial distribution of the CN–ReS2 composite were examined by elemental mapping through energy-dispersive spectroscopy (EDS) measurements. Fig. S1 (ESI†) demonstrates the uniform distribution of carbon (C), nitrogen (N), sulfur (S), and rhenium (Re) elements within the CN–ReS2 composite, which confirms the uniform distribution of ReS2 in the composite. There are no other elements present in the EDS spectra (Fig. S2, ESI†), which confirms that there are no impurities present in the composite. Fig. 1(c) shows the TEM image of the CN–ReS2 composite, which demonstrates the flower-like self-assembled structures on nanosheets of CN with approximate diameters of 50 nm.41 The high-resolution TEM (HRTEM) image of CN–ReS2 is depicted in Fig. 1(d), where a lattice fringe of 0.60 nm was observed, and this can be designated to the (002) planes of ReS2.41
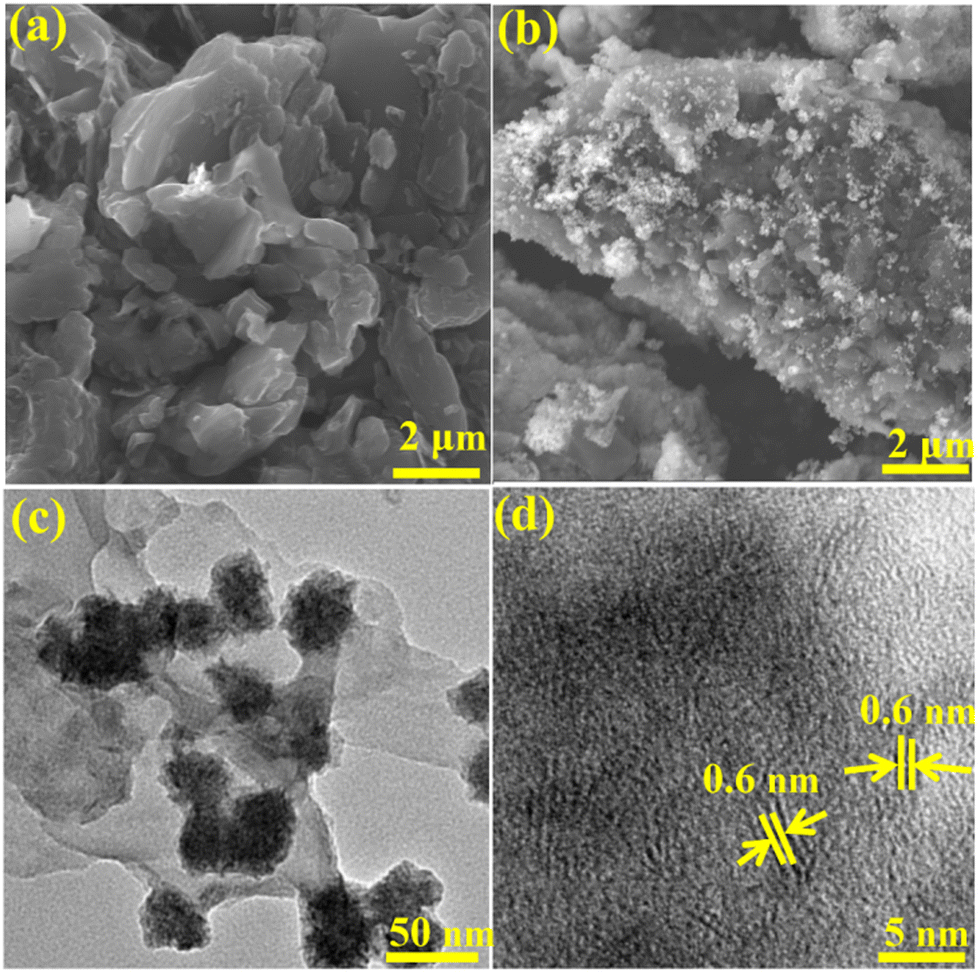 | ||
| Fig. 1 (a) SEM image of CN, (b) SEM image of CN–ReS2 nanocomposite, (c) TEM image of CN–ReS2 composite, and (d) HRTEM image of CN–ReS2 composite. | ||
To study the nature and chemical composition of the synthesized CN–ReS2 composite, X-ray diffraction (XRD: Rogaku XRD Smart Lab) analysis was performed, and the XRD patterns are illustrated in Fig. 2. The two characteristic different peaks of CN at an angle of 27.4° and 13° resulted from (100) and (002) planes of CN, respectively.42 The XRD peaks of ReS2 show three peaks at 14.6°, 33.8° and 58.9°, corresponding to the (100), (002) and (![[1 with combining macron]](https://www.rsc.org/images/entities/char_0031_0304.gif) 22) lattice planes of ReS2, respectively (JCPDS No. 89-0341).41 This shows good indication of the triclinic phase of ReS2.43 The XRD pattern of the CN–ReS2 composite shows the characteristic peaks of both ReS2 and CN, as mentioned above, which confirms the formation of the composite. To understand the extent of the functionalization present in the composite, FTIR studies were conducted. As shown in Fig. S3 (ESI†), the sharp bands at 1631, 1547 and 1397 cm−1 were assigned to aromatic C–N stretching vibration.44 The bands at 1204 cm−1 correspond to the secondary bridging of N (C–NH–C).45 The FTIR spectra of ReS2 show a strong band at 1033 cm−1 and 1408 cm−1, corresponding to the S
22) lattice planes of ReS2, respectively (JCPDS No. 89-0341).41 This shows good indication of the triclinic phase of ReS2.43 The XRD pattern of the CN–ReS2 composite shows the characteristic peaks of both ReS2 and CN, as mentioned above, which confirms the formation of the composite. To understand the extent of the functionalization present in the composite, FTIR studies were conducted. As shown in Fig. S3 (ESI†), the sharp bands at 1631, 1547 and 1397 cm−1 were assigned to aromatic C–N stretching vibration.44 The bands at 1204 cm−1 correspond to the secondary bridging of N (C–NH–C).45 The FTIR spectra of ReS2 show a strong band at 1033 cm−1 and 1408 cm−1, corresponding to the S![[double bond, length as m-dash]](https://www.rsc.org/images/entities/char_e001.gif) O stretching. The peak at 3371 cm−1 corresponds to N–H stretching, and the peaks at 1444 cm−1 and 857 cm−1 correspond to SO stretching, which clearly confirms the presence of the sulfur group.46 Additionally, the broad peaks ranging from 3147 cm−1 to 3371 cm−1 are due to the stretching vibration of hydrogen bonds.46
O stretching. The peak at 3371 cm−1 corresponds to N–H stretching, and the peaks at 1444 cm−1 and 857 cm−1 correspond to SO stretching, which clearly confirms the presence of the sulfur group.46 Additionally, the broad peaks ranging from 3147 cm−1 to 3371 cm−1 are due to the stretching vibration of hydrogen bonds.46
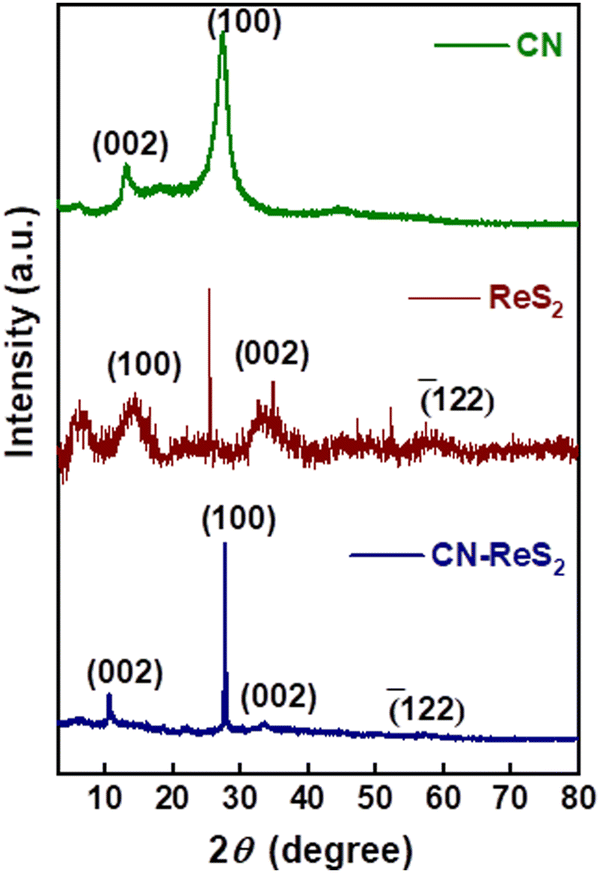 | ||
| Fig. 2 XRD patterns of CN, ReS2 and CN–ReS2 composites. | ||
The elemental composition and chemical states of the elements were studied using XPS. Fig. S4 (ESI†) depicts the XPS survey spectrum of CN–ReS2 nanocomposite. Fig. 3(a) denotes the high-resolution XPS spectra of the C 1s, which show three distinct peaks at 284.6 eV, 288.0 eV, and 289.2 eV. The dominant peak observed at 288.0 eV corresponds to carbon in C–N–C binding and at approximately 289.2 eV indicates the presence of O–CO bonds.47Fig. 3(b) demonstrates a sp2-hybridized state, which is bonded to nitrogen in a C–N–C coordination.48 A newly signal distinct deconvoluted peak is discovered in the N 1s signal. The peak at 400.9 eV corresponds to amino groups containing hydrogen (CN–H), and there is a minor contribution from deprotonated nitrogen atoms at 397.1 eV.49 Additionally, there are extra peaks around 399.8 eV, which can be attributed to tertiary nitrogen in N–(C)3 groups.50Fig. 3(c) illustrates noticeable peaks at 49.39 eV and 46.9 eV, as expected for the Re 4f5/2 and Re 4f7/2 states of the Re4+ species, respectively. The deconvoluted peaks of the Re 4f doublets exhibited the anticipated 2.4 eV multiplet splitting.51Fig. 3(d) depicts the S 2p scan in which two primary peaks were observed at 162.5 eV and 163.9 eV, corresponding to the 2p3/2 and 2p1/2 states, respectively, confirming the formation of ReS2.52
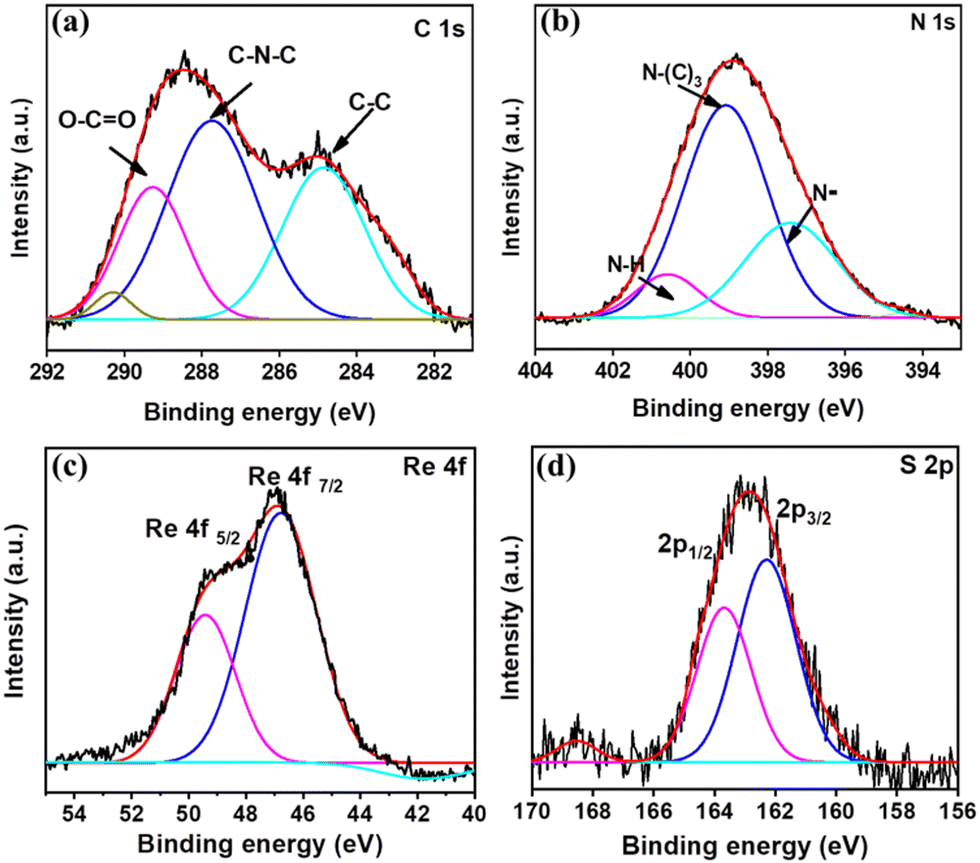 | ||
| Fig. 3 High-resolution XPS spectra of (a) C 1s, (b) N 1s, (c) Re 4f, and (d) S 2p. | ||
3.2. Electrochemical analysis
The electrochemical activity of CN–ReS2-modified CC electrodes was rigorously assessed using cyclic voltammetry (CV) analysis in a solution containing a mixture of 10 mM [Fe(CN)6]3−/4− and 0.1 M KCl, over a potential range of −0.3 to 0.6 V, at a scan rate of 100 mV s−1. The CV data are provided in Fig. 4(a), which shows that the electrochemical activity of the CN–ReS2 composite is higher than that of bare CN and ReS2. In addition, the CN–ReS2-3-modified CC electrode displayed the highest response compared to the other composites (CN–ReS2-1 and CN–ReS2-6). This could be due to the optimum content of ReS2 on the CN surface, which enhances electron transfer and results in enhanced electrochemical activity.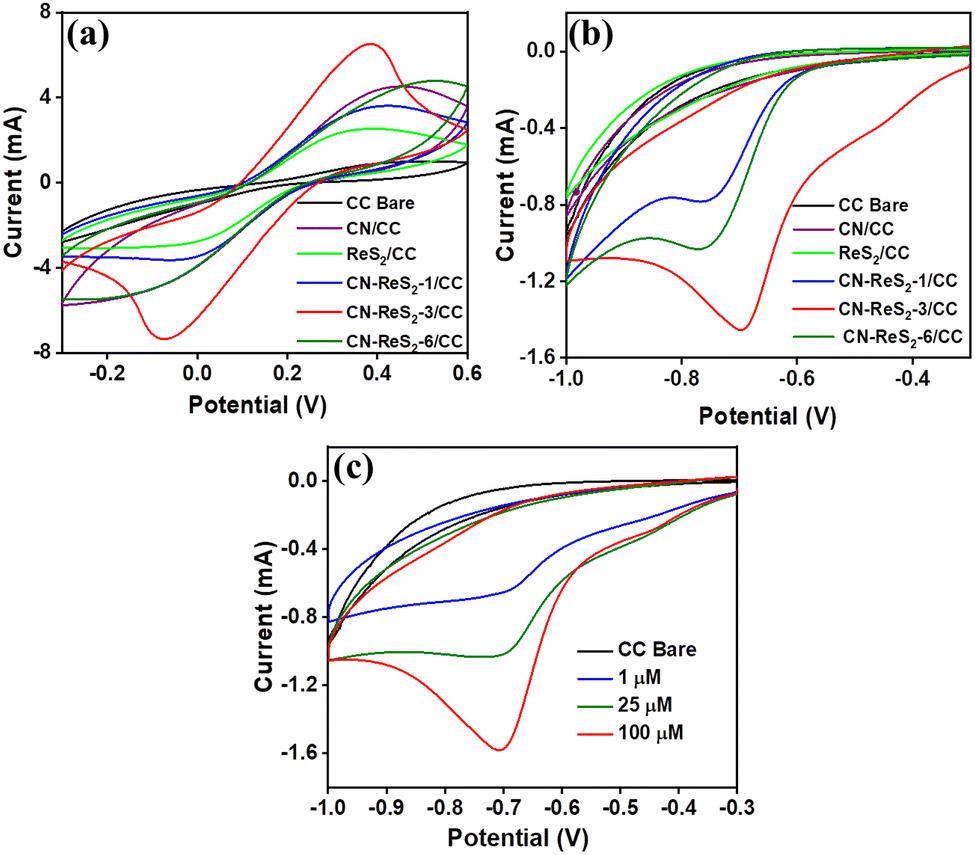 | ||
| Fig. 4 (a) CV responses of bare CC and CC modified with CN, ReS2, CN–ReS2-1, CN–ReS2-3, and CN–ReS2-6 in 10 mM [Fe(CN)6]3−/4− and 0.1 M KCl, (b) CV responses of CC, CC modified with CN, ReS2 and different compositions of CN–ReS2 in the presence of 100 μM DMZ. (c) CV responses of CN–ReS2-3 in the presence of different concentrations of DMZ. | ||
Next, we evaluated the electrochemical behaviour of the CN–ReS2-modified electrodes in the presence of 100 μM DMZ in PB (pH 7.0) at a scanning rate of 100 mV s−1. As expected, the CN–ReS2-3 revealed a remarkable reduction peak current of −1.45 mA at a peak potential of −0.7 V, which is higher than those of other composites and pure constituents (Fig. 4(b)). The enhanced electrocatalytic activity of the CN–ReS2 composite can be attributed to the synergistic effect between CN and ReS2, which results in improved charge transfer kinetics and electrochemical performance.40 When ReS2 and CN come into contact, their respective band edges align in a way that favours electron transfer from one material to the other. Here, we assume that electron transfer occurs from ReS2 to CN owing to the lower energy gap value of ReS2 than CN.34 This charge transfer leads to a redistribution of charge carriers in the materials, enhancing the electron transfer.
Based on the optimization experiments shown above, we selected CN–ReS2-3-modified CC for further sensing experiments. Initially, we took CV plots of CN–ReS2-3-modified CC in the presence of varying concentrations of DMZ. Fig. 4(c) shows the response of the CN–ReS2-3-modified CC in the presence of different concentrations of DMZ. Here, the reduction peak current increases as the concentration of DMZ increases. These findings strongly suggest the potential of CN–ReS2 composite for the electrochemical sensing of DMZ.
To explore the effects of scan rate on the reduction in DMZ, we investigated the CV responses of CN–ReS2-modified CC with varying scan rates ranging from 20 to 100 mV s−1 in the presence of 1 μM DMZ in a 0.1 M PB solution (pH 7). As shown in Fig. S5 (ESI†), the progressive increase in the reduction peak current demonstrated a proportional relationship with increasing scan rate with a linear regression coefficient of R2 = 0.995. This linear dependence between the peak reduction current and scan rate confirmed that the reduction in DMZ on the CN–ReS2-modified CC is a surface-confined adsorption process.
3.3. Quantitative detection of DMZ
Towards the quantitative detection of DMZ by the CN–ReS2-modified CC, we performed the chronoamperometric analysis at −0.7 V with different concentrations of DMZ. As shown in Fig. 5(a), the current response increases with the increase in DMZ concentrations from 50 to 1000 nM. There is a clear difference between the DMZ concentrations of 50 nM and the background response, which is measured in 0.1 M PB solution (at 0 nM of DMZ). The calibration graph presented in Fig. 5(b) demonstrates a linear fit between the reduction peak current (at t = 10 s) and different DMZ concentrations, with a linear regression coefficient of R2 = 0.999. The LOD of the sensor was calculated using the 3 Sigma method, and it is found to be 19.8 nM with a wide linear range of 50–1000 nM. The sensitivity of the developed sensor was calculated as 0.246 μA nM−1 cm−2. Table 1 shows a comparison of previously reported sensors for the detection of DMZ, and the response of our sensor is comparable to that of other reported sensors.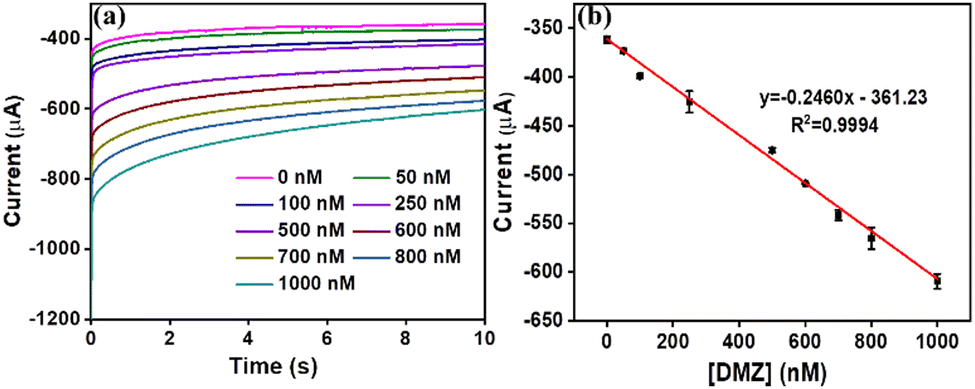 | ||
| Fig. 5 (a) Chronoamperometric analysis of CN–ReS2 modified CC at different concentrations of DMZ (b) calibration plot showing the linear relationship of current vs. concentration of DMZ. | ||
| Material | Technique | Linear range | Sensitivity | LOD | Ref. |
|---|---|---|---|---|---|
| Ag | CV | 0.001–0.8 μM | — | 201 nM | 53 |
| Se-Co3O4@GO-NC | Differential pulse voltammetry (DPV) | 0.02–83.72 mM | 1.898 μA μM−1 cm−2 | 3.4 nM | 19 |
| Mn-SnO@rGO | DPV | 0.009–1291 μM | — | 2 nM | 54 |
| Al@MIS | DPV | 0.01–100 mM | — | 3.6 nM | 55 |
| 3D Cu2O/ErGO | DPV | 30–150 nM | — | 3.5 μM | 17 |
| Au NPs@MIP | DPV | 2–250 nM | — | 0.5 nM | 56 |
| NiFe-LDH@S-GCN | i–t | 0.008–110.77 μM | 14.16 μA μM−1 cm−2 | 1.6 nM | 20 |
| rGO/PB MCs | i–t | 0.02–1360.1 μM | 2.2935 μA μM−1 cm−2 | 3.2 nM | 57 |
| GCE/P-Arg@MIP | DPV | 0.1 nM to 10 μM | — | 0.1 nM | 58 |
| YVO4@CN | i–t | 0.001–153.3 μM | 4.98 μA μM−1 cm−2 | 0.8 nM | 59 |
| PWNPs/R-GO | DPV | 0.001–965 μM | 1.4 μA μM−1 cm−2 | 1.2 nM | 60 |
| CN–ReS2-3 | i–t | 50–1000 nM | 0.246 μA nM−1 cm−2 | 19.8 nM | Present work |
3.4. Storage stability, repeatability and reproducibility of CN–ReS2 modified CC
The reliability of the sensor could be enhanced by better operational stability, repeatability, and reproducibility. Consequently, the CV was taken for CN–ReS2-3-modified CC over 10 segments in a 0.1 M PB solution, and it is found to be stable (Fig. S6(a), ESI†). Further, to examine the storage stability of the proposed sensor, chronoamperometric responses for the CN–ReS2-3/CC electrode were taken after 10 days of storage at 4 °C in the refrigerator. Fig. S6(b) (ESI†) clearly depicts the excellent stability of the modified electrode with more than 97.1 ± 1.8% recovery even after 10 days of preservation, which assures the promising stable nature of the developed sensor. A set of chronoamperometric measurements was performed to evaluate the repeatability of the sensor using the same electrodes at two different concentrations (100 nM and 1 μM). Fig. S7(a) (ESI†) depicts a set of repetitive chronoamperometric measurements performed with the same electrode to evaluate the repeatability of the sensor, and no significant variation in the current response with a relative standard deviation (RSD) of 0.6–1% was observed for various analyte concentrations. Fig. S7(b) (ESI†) displays the promising reproducibility nature of the sensor, in which chronoamperometric data with two different concentrations of DMZ were carried out using two different modified electrodes (RSD in the range of 0.4–2.2%).3.5. Selectivity and flexibility of CN–ReS2/CC sensor
Ensuring selectivity is a crucial aspect of DMZ detection because it helps to avoid any unwanted overlap or interference of DMZ responses with other species that possess comparable reduction potentials. The ability to selectively distinguish and respond to the target analyte, DMZ, while minimizing or eliminating the impact of potentially interfering substances is essential to achieving accurate and reliable results. Fig. 6(a) shows the effectiveness of the proposed selectivity of the sensor validated by examining the chronoamperometric responses of the CN–ReS2/CC sensor in the presence of 10 times the concentration of interfering compounds. The corresponding chronoamperometric curves are illustrated in Fig. S8(a) (ESI†). The concentration of interfering molecules was 100 μM (Ascorbic Acid (AA), Dopamine (DA), Glucose (Glu), Sodium Chloride (NaCl), Uric Acid (UA), metronidazole (MET), and Tinidazole (TIN)), while the concentration of DMZ was 1 μM. The mixture of interfering molecules with DMZ was also evaluated to verify the selectivity of the sensor. Surprisingly, the presence of these interfering substances did not produce significant changes in the current response, indicating the negligible effect of these compounds on DMZ quantification using the developed sensor. This outcome attests to the appropriate selectivity of the proposed sensor, which can distinguish DMZ from other species with comparable reduction potentials. The flexibility of the sensor was evaluated by folding the electrode into a bending form, followed by conducting a chronoamperometric analysis with different concentrations of DMZ. The analysis of the data illustrated that there was no significant variation in the current response towards DMZ sensing, even when the modified CC was in the bent form, as depicted in Fig. S8(b) (ESI†). Consequently, it is found that the developed electrode can serve as a flexible sensing platform for the real-time detection of DMZ and the development of wearable sensors.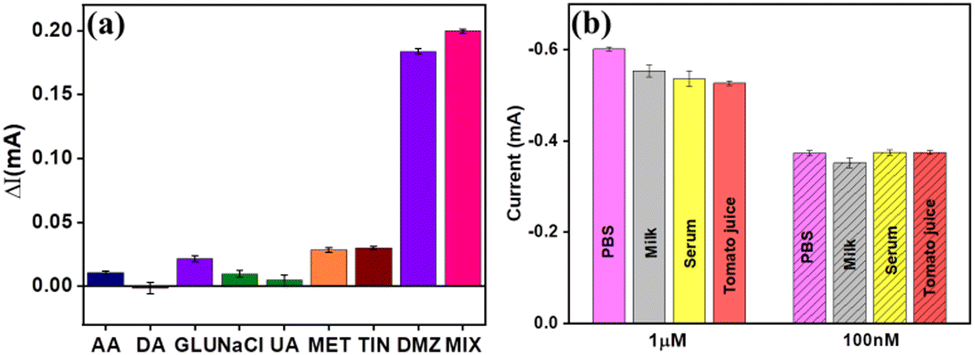 | ||
| Fig. 6 (a) The bar plot showing the selectivity of the sensor towards DMZ in the presence of different interfering molecules, such as AA, DA, Glu, NaCl, UA, MET and TIN. (b) The bar plot shows the response of the CN–ReS2-3-modified CC sensor for the detection of DMZ from real samples, such as milk, serum, and tomato juice. | ||
3.6. Real sample analysis
To assess the practical feasibility of a sensor for real-time applications, it is necessary to monitor its performance when exposed to actual samples. In this study, the viability of the developed CN–ReS2-3/CC electrode was evaluated by conducting recovery tests on milk, tomato juice, and serum samples using the standard addition method. Specifically, known amounts of DMZ were spiked into selected samples within the linear range of detection to assess the ability of the electrode to detect the target analyte in real samples. Fig. 6(b) shows the excellent capability of the developed sensor for the real-time detection of DMZ.3.7. Validation of the sensor using a prototype model
An electrochemical sensor prototype is developed using an acrylic material with 3 provisions through which the three electrodes can be inserted, as shown in Fig. 7(a). Here, the carbon cloth was modified using CN–ReS2-3 chosen as the working electrode, Ag wire as the reference and pure carbon thread as the counter electrode. The electrolyte solution containing the analyte (DMZ) was dropped on the grove so that all three electrodes are well dipped in the solution. Further, all the electrodes were connected to a potentiostat device, and measurements were taken. The chronoamperometric response from the prototype device is given in Fig. 7(b), and the calibration plot between the current (at t = 10 s) and the concentration of DMZ is demonstrated in Fig. 7(c). The data from the prototype device are comparable to the conventional three-electrode sensor system. However, the current response is slightly lower because the area of the working electrode is half the area of the electrode used in the conventional system. These kinds of sensors can be developed using a very low-cost method, and they are portable, making them more favourable for the real-time detection of DMZ. Overall, the developed CN–ReS2 composite sensor displayed highly promising repeatability and reproducibility that actually helps in multiple continuous sensing without compromising the sensing parameters. In addition, it shows excellent recovery in real sample applications, and the prototype device works like a conventional sensor system.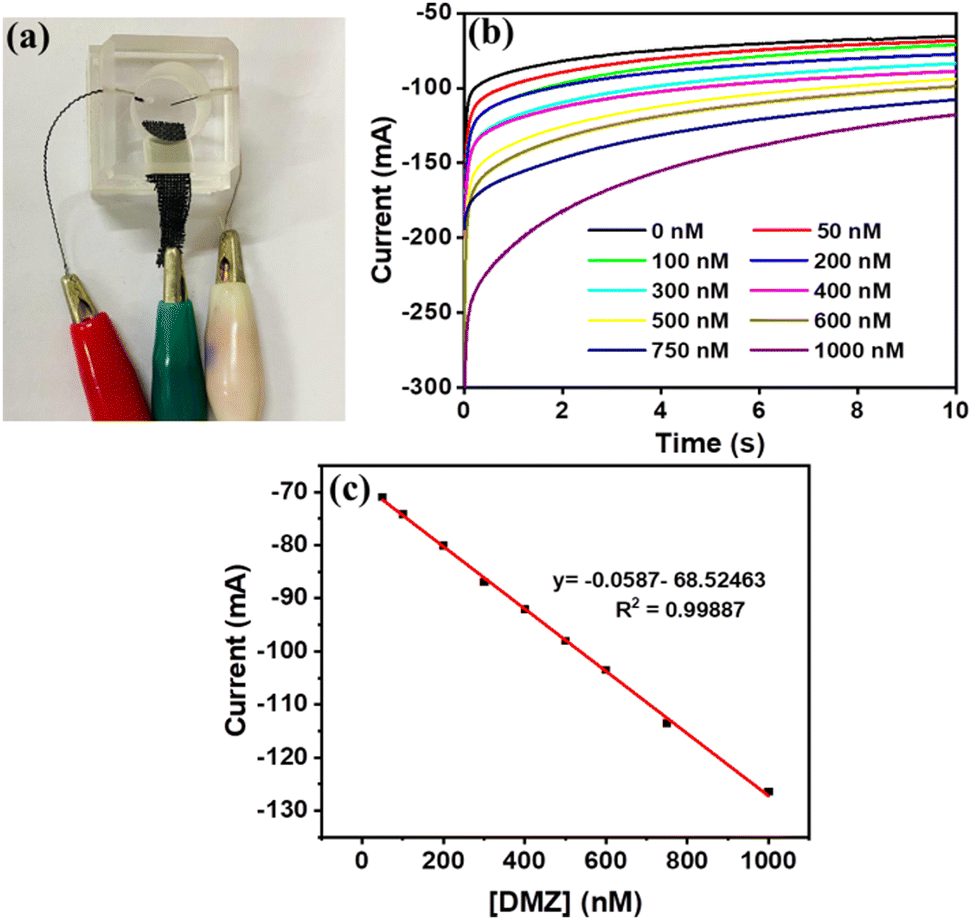 | ||
| Fig. 7 (a) Prototype device fabricated using acrylic with provisions to insert three electrodes. (b) Chronoamperometric data and (c) the calibration plot between the current and the DMZ concentration showing the response of the prototype sensor, which is comparable to the conventional three-electrode system. | ||
4. Conclusions
We introduced CN–ReS2 composite for the effective electrochemical detection of DMZ. The CN–ReS2 composite was synthesized by applying a straightforward one-step hydrothermal approach using ReS2 and CN precursors. From the electrochemical analysis, we found that the CN–ReS2 composite with a 3% weight ratio of ReS2 showed enhanced performance compared to pure CN and ReS2 and other compositions. The strong electron donating nature of nitrogen in the CN and the intercalation of ReS2 enhance the active sites of electronic conductivity, making the composite ideal for the development of electrochemical sensors. This developed sensor can detect DMZ as low as 19.8 nM and is highly selective over other interferents, such as AA, DA, UA, Glu, NaCl, and KCl, even at 10 times higher concentrations of DMZ. The matrix structure of the composite allows for fast charge transfer, and it exhibits a wide linear range response with high sensitivity and stability for DMZ detection in addition to its excellent repeatability and reproducibility. Additionally, we demonstrated that this modified sensor is applicable in real-time applications because it can successfully detect DMZ levels in milk, serum, and tomato juice samples along with the validation of sensor response using a low-cost portable prototype device.Conflicts of interest
There are no conflicts to declare.Acknowledgements
PAR acknowledges Ramalingaswami re-entry fellowship (BT/RLF/Re-entry/75/2020) from the Department of Biotechnology (DBT), Govt. of India. MA acknowledges the PMRF fellowship (3102903) from Govt. of India. The authors acknowledge the central instrumentation facility, Indian Institute of Technology Palakkad for material characterizations.References
- U. Gadde, W. H. Kim, S. T. Oh and H. S. Lillehoj, Anim. Health Res. Rev., 2017, 18, 26–45 CrossRef CAS PubMed.
- J. Castanon, Poult. Sci., 2007, 86, 2466–2471 CrossRef CAS PubMed.
- D. Apata, Int. J. Poult. Sci., 2009, 8, 404–408 CrossRef.
- B. Sriram, J. N. Baby, S.-F. Wang, Y.-F. Hsu, A. Sherlin and M. George, Inorg. Chem., 2021, 60, 13150–13160 CrossRef CAS PubMed.
- M. Ali, M. Bacchu, M. Daizy, C. Tarafder, M. Hossain, M. Rahman and M. Khan, Anal. Chim. Acta, 2020, 1121, 11–16 CrossRef CAS PubMed.
- I. J. D. Priscillal and S.-F. Wang, Nanoscale, 2023, 15, 8693–8705 RSC.
- M. Arias, O. P. Chevallier, S. F. Graham, A. Gasull-Gimenez, T. Fodey, K. M. Cooper, S. R. H. Crooks, M. Danaher and C. T. Elliott, Food Chem., 2016, 199, 876–884 CrossRef CAS PubMed.
- M. Zaghdoudi, F. Fourcade, I. Soutrel, D. Floner, A. Amrane, H. Maghraoui-Meherzi and F. Geneste, J. Hazard. Mater., 2017, 335, 10–17 CrossRef CAS PubMed.
- B. Thirumalraj, A. Krishnapandi, S.-M. Chen, S. MSP and H. Choe, ACS Sustain. Chem. Eng., 2020, 8, 17882–17892 CrossRef CAS.
- M. Petrović, B. Škrbić, J. Živančev, L. Ferrando-Climent and D. Barcelo, Sci. Total Environ, 2014, 468, 415–428 CrossRef PubMed.
- G. Stubbings and T. Bigwood, Anal. Chim. Acta, 2009, 637, 68–78 CrossRef CAS PubMed.
- A. Gentili, D. Perret and S. Marchese, TrAC, Trends Anal. Chem., 2005, 24, 704–733 CrossRef CAS.
- C. Ho, D. W. Sin, K. Wong and H. P. Tang, Anal. Chim. Acta, 2005, 530, 23–31 CrossRef CAS.
- J.-H. Wang, J. Chromatogr. A, 2001, 918, 435–438 CrossRef CAS PubMed.
- M. Hernández-Mesa, A. M. García-Campaña and C. Cruces-Blanco, Food Chem., 2014, 145, 161–167 CrossRef PubMed.
- X. Yang, X. Cheng, Y. Lin, Z. Tan, L. Xie and M. M. Choi, J. Chromatogr. A, 2014, 1325, 227–233 CrossRef CAS PubMed.
- X. Ma, J. Li, J. Luo, C. Liu and S. Li, Anal. Methods, 2018, 10, 3380–3385 RSC.
- G. Yang and F. Zhao, Sens. Actuators, B, 2015, 220, 1017–1022 CrossRef CAS.
- N. Umesh, J. A. Jesila, S.-F. Wang, K. S. Devi, M. Govindasamy, A. A. Alothman and R. A. Alshgari, Colloids Surf., B, 2021, 200, 111577 CrossRef CAS PubMed.
- B. Sriram, J. N. Baby, S.-F. Wang, R. Ranjitha M, M. Govindasamy and M. George, ACS Sustain. Chem. Eng., 2020, 8, 17772–17782 CrossRef CAS.
- U. Rajaji, S. V. Selvi, S.-M. Chen, S. Chinnapaiyan, T.-W. Chen and M. J. M. A. Govindasamy, Microchim. Acta, 2020, 187, 1–10 CrossRef PubMed.
- L. Jiang, X. Yuan, Y. Pan, J. Liang, G. Zeng, Z. Wu and H. Wang, Appl. Catal., B, 2017, 217, 388–406 CrossRef CAS.
- M. Inagaki, T. Tsumura, T. Kinumoto and M. Toyoda, Carbon, 2019, 141, 580–607 CrossRef CAS.
- Y. Wang, L. Liu, T. Ma, Y. Zhang and H. Huang, Adv. Funct. Mater., 2021, 31, 2102540 CrossRef CAS.
- R. S. Chouhan, I. Jerman, D. Heath, S. Bohm, S. Gandhi, V. Sadhu, S. Baker and M. Horvat, Nano Select, 2021, 2, 712–743 CrossRef CAS.
- T. Kokulnathan and T.-J. Wang, ACS Appl. Nano Mater., 2020, 3, 2554–2561 CrossRef CAS.
- P. Veerakumar, C. Rajkumar, S.-M. Chen, B. Thirumalraj and K.-C. Lin, J. Electroanal. Chem., 2018, 826, 207–216 CrossRef CAS.
- G. Jaysiva, S. Manavalan, S.-M. Chen, P. Veerakumar, M. Keerthi and H.-S. Tu, ACS Sustain. Chem. Eng., 2020, 8, 11088–11098 CrossRef CAS.
- F. Ezzah Ab Latif, A. Numan, N. M. Mubarak, M. Khalid, E. C. Abdullah, N. A. Manaf and R. Walvekar, Coord. Chem. Rev., 2022, 471, 214755 CrossRef CAS.
- Y. Hu, Y. Huang, C. Tan, X. Zhang, Q. Lu, M. Sindoro, X. Huang, W. Huang, L. Wang and H. Zhang, Mater. Chem. Front., 2017, 1, 24–36 RSC.
- M. Rahman, K. Davey and S.-Z. Qiao, Adv. Funct. Mater., 2017, 27, 1606129 CrossRef.
- Q. Zhang and L. Fu, Chem, 2019, 5, 505–525 CAS.
- J. Li, Y. Tong, Z. Sun, Y. Chen, Y. Wang, L. Zhou, Y. Jiang, P. Li, C. Wang and L. Du, Acta Biomater., 2022, 149, 287–296 CrossRef CAS PubMed.
- H. Li, Z. Liang, Q. Deng, M. T. Hu, N. Du and W. Hou, ChemCatChem, 2019, 11, 1633–1642 CrossRef CAS.
- X. Wang, Y. Xue, Z. Liang, J. Tian, X. Zhang and X. Chen, Mater. Today Adv., 2022, 15, 100257 CrossRef CAS.
- X. Ma and H. Cheng, J. Colloid Interface Sci., 2023, 634, 32–43 CrossRef CAS PubMed.
- L. Chen and J. Song, Adv. Funct. Mater., 2017, 27, 1702695 CrossRef.
- M. Ankitha, N. Shabana and P. A. Rasheed, Graphene 2D Mater, 2023, 8, 27–37 CrossRef.
- Y. Zhao, D. Yu, H. Zhou, Y. Tian and O. Yanagisawa, J. Mater. Sci., 2005, 40, 2645–2647 CrossRef CAS.
- F. Wang, J. Hu, R. Liang, W. Lei, Z. Lou, X. Pan, B. Lu and Z. Ye, Int. J. Hydrog. Energy, 2022, 47, 29284–29294 CrossRef CAS.
- C. Xing, H. Zhao, G. Yu, L. Guo, Y. Hu, T. Chen, L. Jiang and X. Li, ChemCatChem, 2020, 12, 6385–6392 CrossRef CAS.
- X. Kang, Y. Kang, X. Hong, Z. Sun, C. Zhen, C. Hu, G. Liu and H. Cheng, Prog. Nat. Sci.: Mater. Int., 2018, 28, 183–188 CrossRef CAS.
- F. Qi, Y. Chen, B. Zheng, J. He, Q. Li, X. Wang, B. Yu, J. Lin, J. Zhou, P. Li and W. Zhang, J. Mater. Sci., 2016, 52, 3622–3629 CrossRef.
- S. Sunasee, K. H. Leong, K. T. Wong, G. Lee, S. Pichiah, I. Nah, B. H. Jeon, Y. Yoon and M. Jang, Environ. Sci. Pollut. Res. Int., 2019, 26, 1082–1093 CrossRef CAS PubMed.
- N. D. Shcherban, P. Mäki-Arvela, A. Aho, S. A. Sergiienko, P. S. Yaremov, K. Eränen and D. Y. Murzin, Catal. Sci. Technol., 2018, 8, 2928–2937 RSC.
- N. B. Egorov and E. A. Isaeva, Inorg. Mater., 2022, 58, 899–905 CrossRef CAS.
- Y. Gao, F. Hou, S. Hu, B. Wu, Y. Wang, H. Zhang, B. Jiang and H. Fu, ChemCatChem, 2018, 10, 1330–1335 CrossRef CAS.
- M. Ramalingam, V. K. Ponnusamy and S. N. Sangilimuthu, Environ. Sci. Pollut. Res., 2020, 27, 17481–17491 CrossRef CAS PubMed.
- C. Fettkenhauer, X. Wang, K. Kailasam, M. Antonietti and D. Dontsova, J. Mater. Chem. A, 2015, 3, 21227–21232 RSC.
- X. Lin, S. Du, C. Li, G. Li, Y. Li, F. Chen and P. Fang, Catal. Lett., 2020, 150, 1898–1908 CrossRef CAS.
- S. Ntsimango, S. Gandidzanwa, S. V. Joseph, E. C. Hosten, M. Randall, A. L. Edkins, S. M. Khene, P. Mashazi, T. Nyokong and A. R. Abrahams, ChemistryOpen, 2022, 11, e202200037 CrossRef CAS PubMed.
- Y. Yan, K.-Y. Song, M. Cho, T. H. Lee, C. Kang and H.-J. Lee, Materials, 2019, 12, 1563 CrossRef CAS PubMed.
- J. Zoubir, Y. Elkhotfi, C. Radaa, N. Bougdour, A. Idlahcen, I. Bakas and A. Assabbane, Sens. Int., 2021, 2, 100105 CrossRef.
- S. V. Selvi, U. Rajaji, S.-M. Chen and J. N. Jebaranjitham, Colloids Surf., A, 2021, 631, 127733 CrossRef CAS.
- C. Hu, J. Deng, X. Xiao, X. Zhan, K. Huang, N. Xiao and S. Ju, Electrochim. Acta, 2015, 158, 298–305 CrossRef CAS.
- G. Yang and F. Zhao, Sens. Actuators, B, 2015, 220, 1017–1022 CrossRef CAS.
- I. D'Adamo, F. Ferella and P. Rosa, Curr. Opin. Green Sustain. Chem., 2019, 19, 37–44 CrossRef.
- M. R. Ali, M. S. Bacchu, M. Daizy, C. Tarafder, M. S. Hossain, M. M. Rahman and M. Z. H. Khan, Anal. Chim. Acta, 2020, 1121, 11–16 CrossRef CAS PubMed.
- B. Sriram, J. N. Baby, S. F. Wang, Y. F. Hsu, V. A. Sherlin and M. George, Inorg. Chem., 2021, 60, 13150–13160 CrossRef CAS PubMed.
- J. Anupriya, N. Karuppusamy, S.-M. Chen and K.-Y. Lin, J. Environ. Chem. Eng., 2022, 10, 108800 CrossRef CAS.
Footnote |
| † Electronic supplementary information (ESI) available. See DOI: https://doi.org/10.1039/d3ma00377a |
| This journal is © The Royal Society of Chemistry 2023 |