DOI:
10.1039/D3MA00228D
(Paper)
Mater. Adv., 2023,
4, 3356-3368
Preparation of citric acid/porous starch composite adsorbents and their adsorption studies†
Received
11th May 2023
, Accepted 8th July 2023
First published on 17th July 2023
Abstract
Recently, studies on the removal of methylene blue (MB) in an efficient and environmentally friendly manner and the effective treatment of wastewater polluted by dyes have attracted significant interest from researchers in fields ranging from fundamental environmental research to applied chemical engineering. Herein, a citric acid (CA)-based polymeric adsorbent, porous starch-citric acid (PST-CA), was initially prepared via a dry and wet reaction by introducing polyhydroxy compounds as the starting material, which was further successfully used for the adsorption treatment of MB. The effects of adsorbent dose, solution pH, contact time, the initial concentration of solution and temperature on the adsorption were thoroughly investigated. In particular, a series of tests revealed that the adsorption mechanism between the adsorbent and MB is chemisorption, mainly relying on electrostatic and hydrogen bonding interactions. The maximum theoretical adsorption capacities of PST-CA-G and PST-CA-S for MB were 381.67 mg g−1 and 882.96 mg g−1, respectively. The results of the regeneration tests and the generalization tests showed that this adsorbent is more suitable for the adsorption of cationic dyes and it has favorable reusability. Also, CA-based polymeric adsorbents have great potential for use in dye wastewater applications.
Introduction
Dye-containing wastewater from industrial applications is increasing daily,1–3 and when discharged directly into rivers, it greatly affects the survival of numerous organisms. Thus, the effective treatment of dye wastewater is of great significance to prevent water shortage, protect the environment, and promote sustainable economic development, especially in developing industrial countries. In particular, owing to their advantages of low cost, simple operation, low energy consumption, easy installation, insensitivity to toxic pollutants, ability to remove various types of dyes, and excellent efficiency, exploring advanced adsorption materials is one of the most favorite techniques for the treatment of wastewater.4–6
Porous starch (PST) is a modified advanced starch product, which is generally prepared by bioenzymatic,7 chemical,8 and physical methods.9 PST can be used as an adsorbent material with the advantages of safe, non-toxic, and biodegradable nature, attracting significant attention from academic and industrial researchers. In comparison to natural unmodified starch, PST has a unique pore structure and enlarged specific surface area, leading to the presence of more adsorption sites and better adsorption performance.10 Therefore, PST has been used to adsorb oil, grease, and gas pollutants, which can be retained for a longer period compared to original starch.11 Also, to further enhance the adsorption performance and introduce new functional properties, the chemical modification of PST by grafting specific functional groups has been extensively performed. In general, the chemical modification methods include a series of classic organic reactions, such as etherification, esterification, and cross-linking reactions.12 For example, epichlorohydrin-modified PST exhibited a higher adsorption capacity for MB owing to its polymeric cross-linked architecture.13 In addition, sodium trimetaphosphate covalently modified cross-linked PST has lower solubility and higher thermal stability, exhibiting more porous structures on its outer surface, as indicated by SEM observations, and better adsorption towards water, oil, and MB.14 Thus, the fabrication of cross-linked polymeric architectures is an efficient method to promote the thermal stability and adsorption performance of PST.
Herein, we initially prepared PST via the freezing method, and then synthesized two types of citric acid (CA)/porous starch composite adsorbents, i.e., PST-CA-G and PST-CA-S, via dry and wet methods, respectively (Fig. 1). Due to the low cost, non-volatility and non-toxicity of CA, it has been employed widely as a type of green cross-linking agent, e.g., for polycarboxylic acids15–17 and PST to introduce functional groups such as ester and carboxyl groups during specific adsorption. Both PST-CA-G and PST-CA-S were fully characterized by SEM-EDS, FT-IR, XRD, TGA, BET and XPS. The effects of a series of factors such as contact time, adsorbent dosage, initial solution concentration, solution pH and temperature on the adsorption performance of PST-CA-G and PST-CA-S were also thoroughly studied in-depth for the removal of cationic dyes from water. The adsorption behaviors of PST-CA-G and PST-CA-S were further analyzed using the adsorption kinetic model, adsorption isotherm model and adsorption thermodynamic model. Moreover, FT-IR, XPS and density functional theory (DFT) were used to investigate the mechanism of the adsorption process. The adsorption capacities of PST-CA-G and PST-CA-S for different types of dyes were also evaluated using generalized experiments.
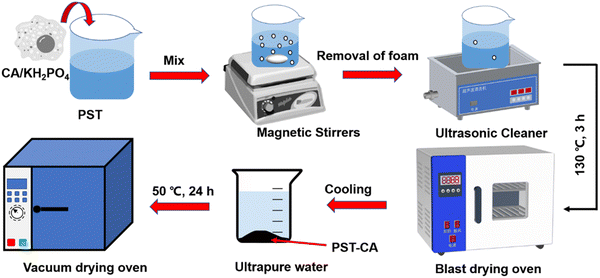 |
| | Fig. 1 Schematic diagram showing the preparation of PST-CA. | |
Materials and methods
Materials
The chemical reagents used in the experiments including citric acid (CA), water-soluble starch, potassium dihydrogen phosphate (KH2PO4), methylene blue (MB) and anhydrous ethanol were obtained from Shanghai Macklin Biochemical Co. Ultrapure water was made in the laboratory.
Preparation of PST-CA
Preparation of PST.
Firstly, 10 g of water-soluble starch was added to a 250 mL three-neck flask. Then, 100 mL of ultrapure water was measured and poured into the three-neck flask, and the starch solution was stirred well on a magnetic stirrer. Subsequently, the starch solution was heated to 90 °C in a water bath for 1 h, forming a paste. The starch paste was poured into a Teflon beaker and cooled to room temperature. Then, the beaker was placed in a medical refrigerator-freezer and pre-chilled at 2–8 °C for 1 week. The formed starch gel was placed in the lower level of the refrigerator and frozen at −26 °C for 3 days. Next, the frozen starch gel was soaked in anhydrous ethanol, thawed at room temperature, washed, and repeated several times to completely replace the water in the starch with anhydrous ethanol. Finally, the product was placed in a blast drying oven and dried at 50 °C to a constant weight to obtain pure white PST, which was ground for further use.
Preparation of PST-CA-S.
Wet preparation: 1.0 g CA, 1.0 g PST, and 0.25 g KH2PO4 were accurately weighed in a 50 mL beaker, and then 10 mL ultrapure water was added and stirred at 60 °C in a water bath until the ingredients were well mixed. The mixed solution was transferred to a vacuum drying oven and reacted at 130 °C for 2 h to obtain a black-brown solid product, which was named PST-CA-S. The solid product was removed and cooled to room temperature, soaked and washed several times with ultrapure water to remove the unreacted raw materials and impurities. Finally, the washed solid product was placed in a blast dryer and dried to constant weight at 50 °C.
Preparation of PST-CA-G.
Dry preparation: 1.0 g CA, 1.0 g PST, and 0.25 g KH2PO4 were accurately weighed in a 50 mL beaker, and then 10 mL anhydrous ethanol was added and stirred in a water bath at 60 °C until the ingredients were well mixed. After the anhydrous ethanol evaporated, the mixed solution was transferred to a vacuum drying oven and reacted at 130 °C for 2 h to obtain a light-yellow solid product, which was named PST-CA-G. The solid product was removed and cooled to room temperature, soaked and washed several times with ultrapure water to remove unreacted raw materials and impurities. Finally, the washed solid product was placed in a blast dryer and dried to a constant weight at 50 °C. Fig. 1 shows the process for the preparation of the PST-CA polymeric adsorbent.
Characterization of PST-CA
The characterization techniques included field-emission scanning electron microscopy-energy spectrometry (SEM-EDS), single-crystal X-ray diffraction (XRD), Fourier transform infrared spectroscopy (FT-IR), simultaneous thermal analysis (TGA), X-ray photoelectron spectroscopy (XPS), and specific surface area and pore size analysis (BET).
MB adsorption experiment
Firstly, 20 mL of the desired concentration of MB solution was added to a 100 mL conical flask with an initial pH of 7.0, and then 10 mg of adsorbent was added, and the conical flask was placed in a gas bath thermostatic shaker and shaken at an oscillation rate of 130 rpm at 30 °C until the adsorption reached equilibrium. Then, the absorbance of the MB solution after adsorption was measured using a UV spectrophotometer, and the residual concentration of MB solution was determined using the standard curve of MB. The adsorption capacity, qe (mg g−1), and removal rate, R%, of MB by the adsorbent were calculated using eqn (1) and (2), respectively, as follows:18| |  | (1) |
| |  | (2) |
where C0 and Ce are the initial concentration and equilibrium concentration of MB (mg L−1) and m and V are the substrate mass (g) and solution volume (L), respectively.
Adsorption kinetics
Adsorption kinetics can describe the time required to complete the adsorption process. Generally, two classical adsorption kinetic models are used to analyze the adsorption behavior of CA-based polymeric adsorbents on MB, i.e., the quasi-first-order kinetic model (pseudo-first-order) and quasi-second-order kinetic model (pseudo-second-order).| |  | (3) |
| |  | (4) |
where K1 (min−1) and K2 (g mg−1 min−1) are the adsorption rate constants and pseudo-second-order adsorption rate constants, respectively, qe (mg g−1) is the adsorption capacity, and qt (mg g−1) is the adsorption capacity at time t.
Adsorption isotherm
To investigate the relationship between the initial concentration of the adsorbent and its equilibrium adsorption capacity, the equilibrium adsorption data were fitted using two adsorption isotherm models, i.e., Langmuir (5) and Freundlich (6). The parameters related to the adsorption properties and the maximum adsorption capacity were obtained, as follows:| |  | (5) |
| |  | (6) |
where Ce (mg L−1) is the equilibrium concentration, qe (mg g−1) is the equilibrium adsorption capacity, qm is the maximum adsorption capacity, and KF and n are constants of the Freundlich equation. KL is a constant for the Langmuir equation.
Adsorption thermodynamics
The thermodynamics of adsorption was determined using three basic thermodynamic parameters, namely, the Gibbs free energy change (ΔG0, kJ mol−1), enthalpy change (ΔH0, kJ mol−1) and entropy change (ΔS0, J mol−1 K−1). These parameters were used to determine whether the adsorption process is exothermic or heat-absorbing, spontaneous or not, and if the stoichiometry at the solid–liquid interface is increasing or not, respectively. This is important for exploring the adsorption mechanism.19,20 The main equations involved are as follows:| |  | (7) |
| |  | (8) |
where Kd (L g−1) is the distribution factor, qe (mg g−1) is the equilibrium adsorption capacity, Ce (mg L−1) is the equilibrium concentration, R (8.314 J mol−1 K−1) is the general gas constant, and T (K) is the absolute temperature.
Results and discussion
Characterization of PST-CA
SEM analysis.
Photographs of the white powder of ST, white blocks of PST, light-yellow particles of PST-CA-G and dark brown particles of PST-CA-S are shown in Fig. 2(a), (d), (g) and (j), respectively. The detailed morphology of ST was mostly an irregular spherical shape with a relatively smooth surface, as shown in the SEM images. In contrast, the morphology of PST prepared by the freezing method was different from that of ST, which had a rough surface with folds and pores in its structure. The morphology of PST-CA-G is a platelet structure, and its surface was relatively smooth without folds and pores. Different from PST-CA-G, the surface of PST-CA-S became uneven with irregular blocks, many folds and pores, as well as layered structures, which may provide more recognition sites during adsorption. The above-mentioned results indicate the successful preparation of PST, PST-CA-G and PST-CA-S. Particularly, there were large differences between the detailed morphologies of PST-CA-G and PST-CA-S prepared via the dry and wet methods, respectively.
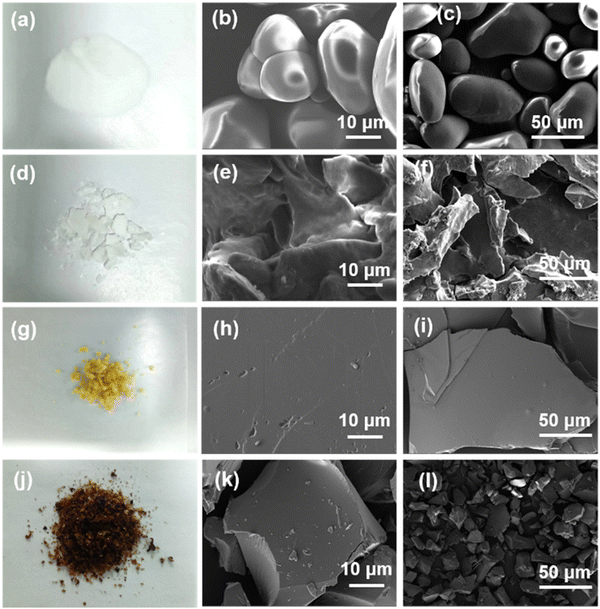 |
| | Fig. 2 (a) Photographs of ST. (b) and (c) SEM images of ST. (d) Photographs of PST. (e) and (f) SEM images of PST. (g) Photographs of PST-CA-G. (h) and (i) SEM images of PST-CA-G. (j) Photographs of PST-CA-S. (k) and (l) SEM images of PST-CA-S. | |
FT-IR analysis.
The structures of PST, PST-CA-G and PST-CA-S were analyzed by FT-IR, and the results are shown in Fig. 3(a). The characteristic peak at 2933 cm−1 corresponds to the absorption peak of the stretching vibration of C–H. The characteristic peak at 1652 cm−1 is attributed to the absorption peak of the stretching vibration of C–O. Compared to PST, PSI-CA-G and PST-CA-S showed new apparently sharp characteristic absorption peaks at 1743 cm−1, which can be attributed to the stretching vibration of C![[double bond, length as m-dash]](https://www.rsc.org/images/entities/char_e001.gif) O in the ester group. This demonstrates that an esterification cross-linking reaction occurred between PST and CA. In addition, the intensity of the absorption peak of PST-CA-S at 1743 cm−1 was greater than that of PST-CA-G, indicating a higher degree of cross-linking between PST and CA in PST-CA-S. The above analysis shows that the products obtained by the dry and wet methods were very similar in terms of their detailed structures, but their degree of cross-linking was very different.
O in the ester group. This demonstrates that an esterification cross-linking reaction occurred between PST and CA. In addition, the intensity of the absorption peak of PST-CA-S at 1743 cm−1 was greater than that of PST-CA-G, indicating a higher degree of cross-linking between PST and CA in PST-CA-S. The above analysis shows that the products obtained by the dry and wet methods were very similar in terms of their detailed structures, but their degree of cross-linking was very different.
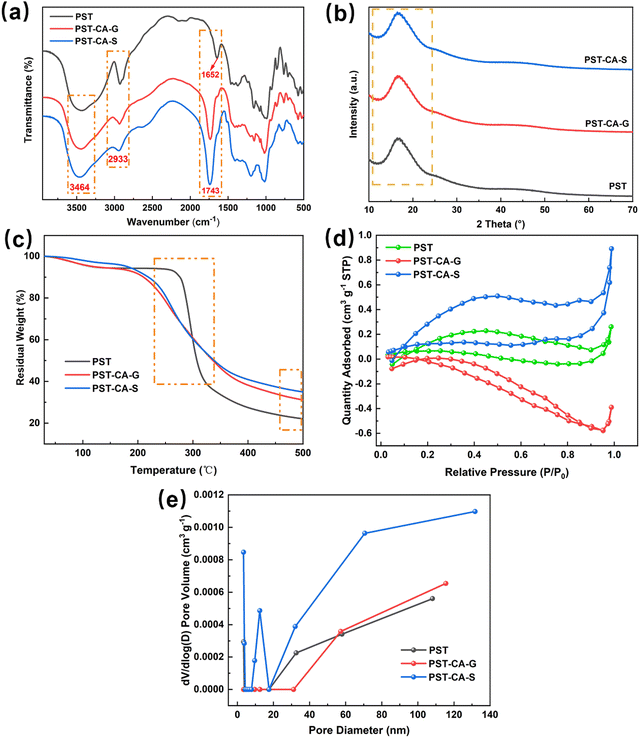 |
| | Fig. 3 (a) FT-IR plot. (b) XRD plot. (c) TGA. (d) N2 adsorption–desorption isotherm. (e) Pore size distribution curve. | |
XRD analysis.
The XRD patterns further revealed the differences in the detailed structure of PST, PST-CA-G and PST-CA-S, as shown in Fig. 3(b), because the diffraction intensity and diffraction angle in the diffraction patterns are related to the size and shape of the grains in the internal crystalline region of the substances. Interestingly, PST, PST-CA-G and PST-CA-G all exhibited a broad characteristic peak at 2θ ≈ 16.70°, indicating that their structures are amorphous and similar in terms of crystalline structure.
TGA.
The TGA curves of PST, PST-CA-G and PST-CA-S are shown in Fig. 3(c). The slow weight loss before 150 °C in the TGA plot is mainly caused by the evaporation of water from the material. After the initial decomposition temperature, the weight loss of PST, PST-CA-G and PST-CA-S decreased rapidly in accordance with an increase in temperature, and their initial decomposition temperatures were 244.9 °C, 163.9 °C and 173.6 °C, respectively. This revealed that the thermal stability of the porous starch decreased after esterification cross-linking. In addition, the maximum weight loss rate temperatures of PST, PST-CA-G and PST-CA-S were 296.7 °C, 257.2 °C and 258.5 °C, respectively, indicating that they had similar thermal stability.
BET analysis.
To further study the pore structures of PST-CA-G and PST-CA-S, their N2 adsorption–desorption isotherms at 77 K were measured. As shown in Fig. 3(d), the N2 adsorption–desorption isotherms of PST, PST-CA-G and PST-CA-S are type IV adsorption isotherms, and desorption curves show hysteresis, indicating that most of the pores in the materials are mesopores. According to Fig. 3(e), the pore size distributions of PST-CA-G and PST-CA-G are very different. In addition, the cumulative specific surface area, total pore volume and average pore size of PST, PST-CA-G and PST-CA-S are listed in Table 1. The BET specific surface areas of PST-CA-G and PST-CA-S are 0.0754 m2 g−1 and 0.5416 m2 g−1, while their average pore sizes are 64.310 nm and 3.396 nm, respectively. Thus, PST- CA-G and PST-CA-S have a small specific surface area and underdeveloped pore structures, and the functional groups on their surface can play a major role during the dye adsorption process.
Table 1 Pore parameters of PST, PST-CA-G and PST-CA-S
| Material |
ET specific surface area (N2 m2 g−1) |
Total pore volume (N2 cm3 g−1) |
Average pore size (nm) |
| PST |
0.2831 |
0.001 |
17.811 |
| PST-CA-G |
0.0754 |
0 |
64.310 |
| PST-CA-S |
0.5416 |
0.001 |
3.396 |
By analyzing the above-mentioned characterization results, the PST-CA adsorbent materials were successfully prepared, the pore structure of PST-CA-G prepared by the dry method and PST-CA-S prepared by the wet method was different, and the specific surface area of PST-CA-S was larger than that of PST-CA-G, which is beneficial to provide more adsorption sites for MB.
Study on the adsorption performance
Comparison of PST-CA-S- and PST-CA-G-adsorbed MB.
The adsorption effect for MB by the PST-CA adsorbents obtained by different preparation methods was thoroughly compared. The results showed that the adsorption capacities of PST, PST-CA-G and PST-CA-S were different. For example, the adsorption capacity of PST was only 16.6 mg g−1, while that of the PST-CA adsorbents obtained by esterification and cross-linking of PST with CA was significantly improved. This indicates that the introduction of CA greatly improved the adsorption performance of PST. Particularly, the adsorption capacity of PST-CA-S prepared by the wet method was 188.2 mg g−1, while that of PST-CA-G prepared by the dry method was 167.6 mg g−1, which showed that the PST-CA-S exhibited a better adsorption performance than PST-CA-G. This may be due to the rougher surface of PST-CA-S, larger specific surface area and higher number of ester and carboxyl groups introduced due to its higher degree of cross-linking, which can provide more adsorption sites for MB. (For more information on the comparison graph of the adsorption effect, please refer to the ESI,† Fig. S1).
Effect of adsorbent dose.
The effect of the adsorbent dose on the adsorption performance of PST-CA-G and PST-CA-S is summarized and illustrated in Fig. 4(a). As shown, the higher the adsorbent dosage employed, the better the removal of MB achieved, owing to the fact that more accessible adsorption sites were available for MB molecules in the adsorption system at a higher adsorbent dosage, increasing the chance of MB adsorption. The adsorption and removal rates of MB were about 90% and 85% for PST-CA-G and PST-CA-S at 10 mg and 20 mg, respectively. Then, it increased slightly with a further increase in the dose. On the contrary, the adsorption capacity decreased gradually with an increase in the adsorbent dose, for example, the adsorption capacities of PST-CA-S and PST-CA-G decreased from 556.17 mg g−1 and 402.80 mg g−1 to 152.73 mg g−1 and 139.07 mg g−1 when the dose increased from 5 mg to 25 mg, respectively. It may be owing to the fact that when the adsorbent dosage was low, the surface adsorption sites on the surface could be fully utilized, leading to a high adsorption capacity. Alternatively, when the amount of adsorbent was high enough, although the total number of adsorption sites available for MB was higher, some of the adsorption sites were covered due to the increase in agglomeration between the adsorbent particles. This led to a decrease in the adsorption efficiency and adsorption capacity. In addition, PST-CA-S exhibited a better adsorption performance than PST-CA-G, as shown in Fig. 4(a). Considering the adsorption performance of the adsorbent and cost, a suitable adsorbent dose of 10 mg was selected and used in the following experiments.
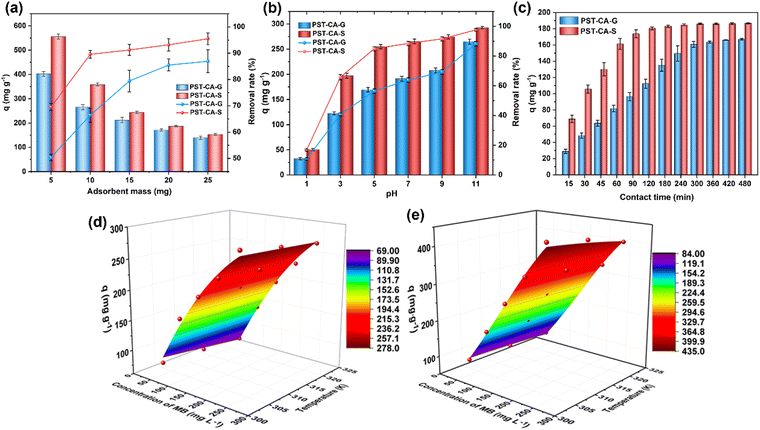 |
| | Fig. 4 (a) Effect of adsorbent dose. (b) Effect of solution pH. (c) Effect of contact time. Effect of initial concentration and temperature of MB solution on the adsorption performance of (d) PST-CA-G and (e) PST-CA-S. | |
Effect of pH.
The pH of the solution is an important factor influencing the adsorption process, which affects not only the form of the ionic pollutants present in the solution but also the surface electrical properties of the adsorbent, leading to a change of the interaction of the adsorbent. The effect of solution pH on the adsorption performance of PST-CA-G and PST-CA-S is shown in Fig. 4(b). The adsorption capacity and removal rate of MB for both adsorbents increased with an increase in the solution pH. For example, when the pH value increased from 1.0 to 11.0, the adsorption capacities increased from 32.23 mg g−1 and 50.20 mg g−1 to 264.87 mg g−1 and 292.74 mg g−1, respectively. Also, the removal rates increased from 10.75% and 16.74% to 88.29% and 97.58%, respectively. This may be owing to the fact that when the pH of the solution is low, there are more positively charged protons in the solution, and these protons can compete with MB to occupy the adsorption sites, finally disturbing the adsorption of MB by PST-CA-G and PST-CA-S. In addition, when the pH of the solution is low, the H+ in the solution protonates the adsorbent surface, which causes electrostatic repulsion of the positively charged MB, thus reducing the adsorption efficiency. As shown in Fig. 4(b), the adsorption efficiency of PST-CA-G and PST-CA-S for MB was higher when the pH of the solution was higher, which is due to the large amount of OH− in the higher pH solution, deprotonating the adsorbent surface and enhancing the electrostatic interaction between the absorbents and MB. In addition, an increase in the solution pH from 5.0 to 11.0 promoted the removal rate of MB by PST-CA-S to a lesser extent than PST-CA-G, indicating that the pH value of the solution had a greater influence on the adsorption performance of PST-CA-G, which was more resistant to acid and alkali cations.
Effect of contact time.
The effect of contact time on the adsorption performance of PST-CA-G and PST-CA-S was investigated, and the results are shown in Fig. 4(c). The adsorption capacity of PST-CA-S for MB increased rapidly in the first 60 min and almost reached the equilibrium state at 180 min, while the adsorption capacity of PST-CA-G for MB was in a fast growth period in the first 300 min and almost reached the equilibrium state at 420 min. The fast growth rate of the adsorption capacity in the initial stage was mainly due to the fact that the adsorbent surface had more free adsorption sites and the concentration of MB molecules in the solution was higher and the diffusion resistance was lower, and thus the free MB molecules were more likely to be adsorbed and the adsorption rate was faster. Thereafter, with a further extension of the contact time, the free adsorption sites on the adsorbent surface gradually decreased, and the content of MB molecules in the liquid phase gradually decreased, resulting in a slower adsorption rate of MB by the adsorbent. In addition, the adsorption capacity of PST-CA-S reached 86.33% of the equilibrium adsorption capacity within 60 min, while the adsorption capacity of PST-CA-G reached only 48.87% of the equilibrium adsorption capacity at this time, as shown in Fig. 4(c). Under the same adsorption conditions, PST-CA-S reached the equilibrium adsorption state faster than PST-CA-G, indicating that PST-CA-S has a better adsorption performance than PST-CA-G.
Effect of initial concentration and temperature.
To investigate the effects of the initial concentration and temperature of MB solution on the adsorption performance of PST-CA-G and PST-CA-S, the adsorption capacities of PST-CA for MB at different MB solution concentrations were tested at 303 K, 313 K and 323 K, as shown in Fig. 4(d) and (e). The adsorption capacities of both PST-CA-G and PST-CA-S increased with an increase in the initial concentration of the solution. The adsorption capacities of PST-CA-G and PST-CA-S for MB increased from 80.24 mg g−1 and 93.26 mg g−1 to 286.68 mg g−1 and 945.64 mg g−1, respectively, as the concentration of MB solution increased from 50 mg L−1 to 250 mg L−1 at a temperature of 303 K. This is mainly due to the larger concentration gradient driving force at a higher MB solution concentration, which can promote the mass transfer between the solid and liquid phases and enhance the interaction between the MB molecules and the adsorbent. When the concentration of MB solution further increased, the increasing trend of adsorption capacity of PST-CA-G and PST-CA-S became slower, and PST-CA-G showed a more obvious effect. This is probably because as adsorption proceeded, the main factor affecting the adsorption capacity was no longer the concentration of the MB solution, but the existing vacant adsorption sites of the adsorbent. A large number of adsorption sites was already occupied by MB molecules, which made it difficult for the MB molecules in the solution to be adsorbed effectively in the later stages, and the adsorption process gradually tended to an equilibrium state. In addition, the adsorption capacity of PST-CA-G and PST-CA-S for MB decreased with an increase in temperature, indicating that an increase in temperature is not favorable for the adsorption of MB by the adsorbent. This may be caused by the disruption of the hydrogen bonding interaction between PST-CA-G and PST-CA-S and MB. Additionally, because the higher the temperature, the more intense the Brownian distal motion, and the increased migration rate of MB molecules accelerated their departure rate to the adsorbent surface.
Study of adsorption behavior
Adsorption isotherm.
To further understand the adsorption processes of MB on PST-CA-G and PST-CA-S, the experimental data were analyzed using both the Langmuir and Freundlich adsorption isotherm models, and the fitted curves are shown in Fig. 5(a)–(d), and the correlation parameters are listed in Table 2. Interestingly, according to the fitted results of PST-CA-G and PST-CA-S, the correlation coefficients of the Langmuir model fitted at different temperatures are very close to that of the Freundlich model, indicating that both the Langmuir and Freundlich models are suitable for describing the adsorption processes of PST-CA-G and PST-CA-S towards MB. Particularly, it also indicates that both uniform monolayer and inhomogeneous multilayer adsorption may exist in the adsorption process. Thus, the adsorption process may be complicated by both uniform and inhomogeneous multilayer adsorption. The adsorption capacity of both PST-CA-G and PST-CA-S decreased with an increase in temperature, revealing that an increase in temperature is detrimental to the adsorption process. The theoretical maximum adsorption capacities of PST-CA-G and PST-CA-S obtained by fitting the Langmuir model at 303 K were 381.67 mg g−1 and 882.96 mg g−1, respectively. In addition, the constant 1/n value of the Freundlich model is related to the inhomogeneity of the adsorbent surface and can be used to measure the ease of the adsorption process. As is known, when the 1/n value is between 0 and 1, the adsorption process is more favorable. Thus, the 1/n values for both PST-CA-G and PST-CA-S are between 0 and 1, revealing that MB molecules are more easily adsorbed on top of both. Generally, the KF value can be used to evaluate the adsorption capacity of the adsorbent, and the higher the KF value, the better the adsorption performance of the adsorbent. Thus, as shown in Table 2, PST-CA-S had a higher KF value than PST-CA-G, indicating that PST-CA-S has a better adsorption performance than PST-CA-G.
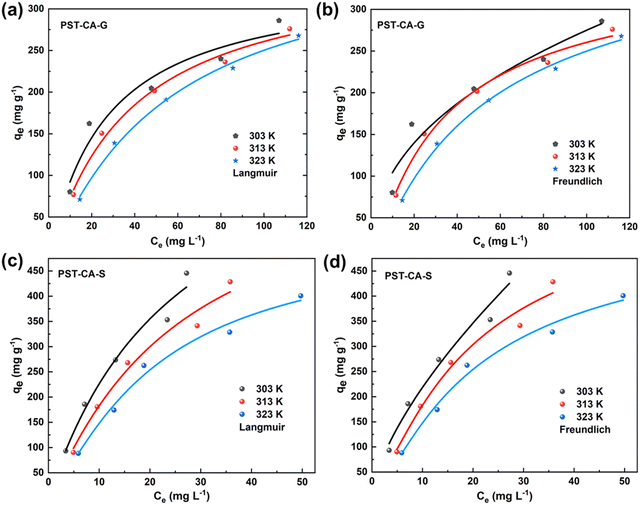 |
| | Fig. 5 PST-CA-G and PST-CA-S adsorption MB isotherm fitting curves: (a) and (c) Langmuir fitting curves and (b) and (d) Freundlich fitting curves, respectively. | |
Table 2 Parameters associated with the Langmuir and Freundlich adsorption isotherm models
| Adsorbent |
Temperature (K) |
Isothermal adsorption model categories and related parameters |
| Langmuir |
Freundlich |
|
q
max (mg g−1) |
K
L (L mg−1) |
R
2
|
1/n |
K
F (L mg−1) |
R
2
|
| PST-CA-G |
303 |
381.67 |
0.03779 |
0.9913 |
0.6652 |
434.0762 |
0.9928 |
| 313 |
354.13 |
0.02449 |
0.9764 |
0.6979 |
372.5979 |
0.9788 |
| 323 |
337.46 |
0.01399 |
0.9361 |
0.7628 |
39.6202 |
0.9268 |
| PST-CA-S |
303 |
882.96 |
0.03795 |
0.9644 |
0.4208 |
670.8418 |
0.9677 |
| 313 |
691.27 |
0.02926 |
0.9560 |
0.6437 |
580.3128 |
0.9553 |
| 323 |
525.80 |
0.02192 |
0.9724 |
0.7135 |
47.2363 |
0.9734 |
Adsorption thermodynamics.
The linear fit curves of ln![[thin space (1/6-em)]](https://www.rsc.org/images/entities/char_2009.gif) Kdversus 1/T for PST-CA-G and PST-CA-S adsorbed MB are shown in Fig. S2 (ESI†), and the parameters obtained from the fit are listed in Table S1 (ESI†), revealing that ΔH0 is negative for both PST-CA-G and PST-CA-S with −25.4462 kJ mol−1 and −25.9051 kJ mol−1, respectively. Thus, the adsorption process of MB by both adsorbents is exothermic. The ΔS0 of both PST-CA-G and PST-CA-S was negative with −66.1701 J mol−1 K−1 and −58.5321 J mol−1 K−1, respectively, indicating that the degree of freedom of the system becomes lower after adsorption. In addition, the ΔG0 of both PST-CA-G and PST-CA-S are negative, indicating that the adsorption proceeds spontaneously. Thus, the adsorption between PST-CA-G and PST-CA-S and MB is an exothermic reaction, which proceeds spontaneously. Also, an increase in the temperature is detrimental to the adsorption process, which is consistent with the results of the adsorption isotherm.
Kdversus 1/T for PST-CA-G and PST-CA-S adsorbed MB are shown in Fig. S2 (ESI†), and the parameters obtained from the fit are listed in Table S1 (ESI†), revealing that ΔH0 is negative for both PST-CA-G and PST-CA-S with −25.4462 kJ mol−1 and −25.9051 kJ mol−1, respectively. Thus, the adsorption process of MB by both adsorbents is exothermic. The ΔS0 of both PST-CA-G and PST-CA-S was negative with −66.1701 J mol−1 K−1 and −58.5321 J mol−1 K−1, respectively, indicating that the degree of freedom of the system becomes lower after adsorption. In addition, the ΔG0 of both PST-CA-G and PST-CA-S are negative, indicating that the adsorption proceeds spontaneously. Thus, the adsorption between PST-CA-G and PST-CA-S and MB is an exothermic reaction, which proceeds spontaneously. Also, an increase in the temperature is detrimental to the adsorption process, which is consistent with the results of the adsorption isotherm.
Adsorption kinetics.
To better investigate the adsorption behavior of PST-CA-G and PST-CA-S on MB, two classical kinetic models, i.e., the quasi-first-order and quasi-second-order kinetic models, were used to analyze the adsorption process of PST-CA-G and PST-CA-S on MB, and the fitted curves are shown in Fig. 6, and the related kinetic parameters are listed in Table 3. The fitted results showed that the correlation coefficient of the quasi-second-order kinetic model (R2 = 0.99851) was significantly higher than that of the quasi-first-order kinetic model (R2 = 0.92640) for PST-CA-S. The equilibrium adsorption capacity value of 195.69 mg g−1 was obtained, which is closer to the experimental adsorption capacity of 186.80 mg g−1, indicating that the quasi-second-order model is more suitable for describing the adsorption process of PST-CA-S, and it is assumed that the adsorption process mainly involves chemisorption. In the case of PST-CA-G, the correlation coefficient R2 of both the quasi-first-order and quasi-second-order kinetic models was higher, and the correlation coefficient R2 of the quasi-second-order kinetic model was 0.99803, which is closer to one. However, the equilibrium adsorption capacity obtained by fitting the quasi-first-order kinetic model was closer to the experimental value (167.13 mg g−1). This indicates that the adsorption process of PST-CA-G may involve both chemisorption and physical adsorption, but chemisorption is dominant. The above-mentioned results provide a basis for the possible chemisorption of MB on PST-CA-G and PST-CA-S.
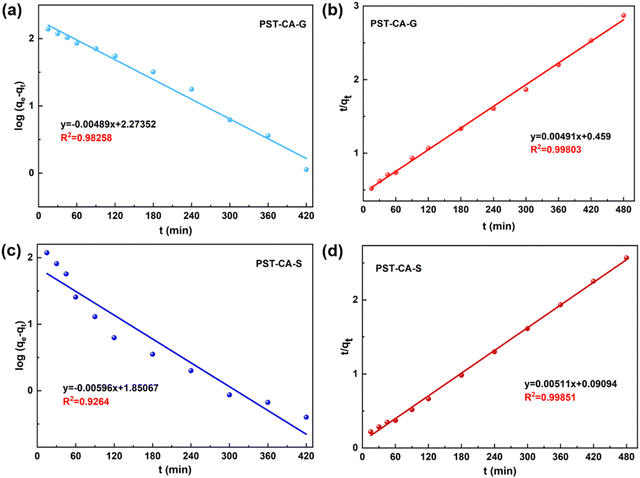 |
| | Fig. 6 Kinetic fitting curves of PST-CA-G and PST-CA-S adsorbed MB: (a) and (c) quasi-first-order kinetic fitting curves and (b) and (d) quasi-second-order kinetic fitting curves, respectively. | |
Table 3 Parameters associated with quasi-first-order and quasi-second-order kinetic models
| Adsorbent |
Kinetic model categories and related parameters |
| Quasi-first-order kinetic model |
Quasi-second-order kinetic model |
|
q
e, cal (mg g−1) |
K
1 (min−1) |
R
2
|
q
e, cal (mg g−1) |
K
2 (min−1) |
R
2
|
| PST-CA-G |
187.72 |
0.00212 |
0.98258 |
203.67 |
0.00005 |
0.99803 |
| PST-CA-S |
70.90 |
0.00259 |
0.92640 |
195.69 |
0.00029 |
0.99851 |
Study of adsorption mechanism
EDS energy spectrum adsorption validation.
To verify that MB was indeed adsorbed on PST-CA-G and PST-CA-S, the elemental distribution before and after adsorption was characterized by EDS, and the results are shown by Fig. S3 (ESI†). Both PST-CA-G and PST-CA-S contained only two elements, i.e., C and O, and the content of O in PST-CA-S is 34.89%, which is higher than that in PST-CA-G, indicating that PST-CA-S contains more O-containing functional groups. Also, Fig. S3 (ESI†) show that the new elements N, S, and Cl appeared in both PST-CA-G and PST-CA-S after the adsorption of MB with elemental weights of N: 1.25%, S: 5.28%, and Cl: 0.77% and N: 6.96%, S: 25.11%, and Cl: 1.10%, respectively. The presence of N, S, and Cl elements confirmed that MB was successfully adsorbed on PST-CA-G and PST-CA-S, and that PST-CA-S has a superior adsorption capacity.
Mechanism hypothesis.
The exploration of the adsorption mechanism is an important guideline for the study of the adsorption process. The results of adsorption experiments showed that the prepared adsorbents PST-CA-G and PST-CA-S had a good adsorption performance for MB, and it was speculated by data fitting that the adsorption process may involve chemisorption. The possible adsorption mechanisms proposed based on the above analysis are shown in Fig. 7. Electrostatic interaction between MB and the carboxyl groups appeared in PST-CA-G and PST-CA-S. It is presumed that electrostatic interaction played a key role in driving the adsorption process based on the effect of pH change of MB solution on the adsorption performance of PST-CA-G and PST-CA-S. Additionally, the hydroxyl groups contained in PST-CA-G and PST-CA-S can generate hydrogen bonding interaction with MB, which is also an important interaction to promote the adsorption of MB on PST-CA-G and PST-CA-S.
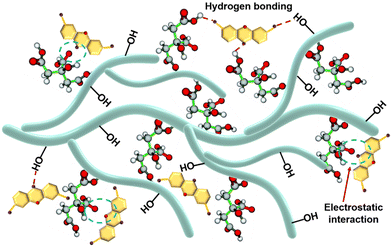 |
| | Fig. 7 Schematic diagram of the adsorption mechanism of MB on PST-CA-G and PST-CA-S. | |
Infrared spectroscopic analysis.
To investigate the adsorption mechanism of PST-CA-G and PST-CA-S on MB, FT-IR analysis was performed on the samples before and after adsorption, as shown in Fig. 8. In the case of the unoccupied PST-CA-G and PST-CA-S absorbents, the absorption peaks at 3464 cm−1 corresponded to the stretching vibration of the hydroxyl group, and the absorption peak at 1743 cm−1 is attributed to the stretching vibration of C![[double bond, length as m-dash]](https://www.rsc.org/images/entities/char_e001.gif) O in the ester group. After the adsorption of MB, new characteristic peaks corresponding to stretching vibrations of C
O in the ester group. After the adsorption of MB, new characteristic peaks corresponding to stretching vibrations of C![[double bond, length as m-dash]](https://www.rsc.org/images/entities/char_e001.gif) N (1599 cm−1) and aromatic C–H (861 cm−1) appeared in the FT-IR spectra. Also, the appearance of these characteristic peaks indicated that MB was successfully adsorbed on PST-CA-G and PST-CA-S. In addition, the intensity of both the hydroxyl peak at 3464 cm−1 and the C
N (1599 cm−1) and aromatic C–H (861 cm−1) appeared in the FT-IR spectra. Also, the appearance of these characteristic peaks indicated that MB was successfully adsorbed on PST-CA-G and PST-CA-S. In addition, the intensity of both the hydroxyl peak at 3464 cm−1 and the C![[double bond, length as m-dash]](https://www.rsc.org/images/entities/char_e001.gif) O peak at 1743 cm−1 was significantly weakened and blue-shifted after the adsorption of MB. These changes indicate that the O-containing functional groups in PST-CA-G and PST-CA-S played an important role in the adsorption process, suggesting that there may be electrostatic interactions between PST-CA-G and PST-CA-S and MB and hydrogen bonding interactions. In addition, the intensity of the C
O peak at 1743 cm−1 was significantly weakened and blue-shifted after the adsorption of MB. These changes indicate that the O-containing functional groups in PST-CA-G and PST-CA-S played an important role in the adsorption process, suggesting that there may be electrostatic interactions between PST-CA-G and PST-CA-S and MB and hydrogen bonding interactions. In addition, the intensity of the C![[double bond, length as m-dash]](https://www.rsc.org/images/entities/char_e001.gif) O characteristic peak of PST-CA-S at 1743 cm−1 diminished more than that of PST-CA-G, which may be due to the better adsorption performance of PST-CA-S on MB. Overall, the adsorption processes on PST-CA-G and PST-CA-S for MB may be dominated by chemisorption.
O characteristic peak of PST-CA-S at 1743 cm−1 diminished more than that of PST-CA-G, which may be due to the better adsorption performance of PST-CA-S on MB. Overall, the adsorption processes on PST-CA-G and PST-CA-S for MB may be dominated by chemisorption.
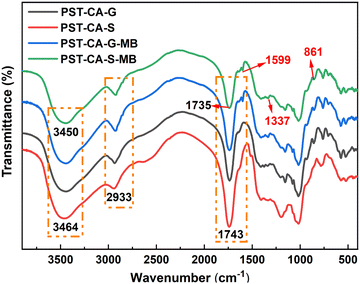 |
| | Fig. 8 FT-IR spectra of PST-CA-G and PST-CA-S before and after the adsorption of MB. | |
XPS analysis.
To further investigate the adsorption mechanism of PST-CA-G and PST-CA-S for MB, XPS analysis was performed on the samples before and after adsorption. As shown in Fig. 9(a) and (b) and Table 4, N 1s and S 2p peaks appeared in the XPS full spectra of PST-CA-G and PST-CA-S after the adsorption of MB compared to that before the adsorption, indicating that MB was successfully adsorbed on their surfaces. In addition, the adsorption mechanism was further analyzed using the high-resolution XPS spectra of C 1s. As shown in Fig. 9(c) and (d), the high-resolution XPS spectra of C 1s of PST-CA-G and PST-CA-S can be divided into three peaks corresponding to C–C bond (285.28 eV and 285.18 eV), C–OH bond (286.78 eV and 286.74 eV), and O–C![[double bond, length as m-dash]](https://www.rsc.org/images/entities/char_e001.gif) O bond (289.28 eV and 289.16 eV), respectively. The binding energies of the C–C, C–OH and O–C
O bond (289.28 eV and 289.16 eV), respectively. The binding energies of the C–C, C–OH and O–C![[double bond, length as m-dash]](https://www.rsc.org/images/entities/char_e001.gif) O bonds in PST-CA-G shifted to 285.12 eV, 286.26 eV and 288.74 eV after the adsorption of MB, respectively. Alternatively, the binding energies of the C–C, C–OH and O–C
O bonds in PST-CA-G shifted to 285.12 eV, 286.26 eV and 288.74 eV after the adsorption of MB, respectively. Alternatively, the binding energies of the C–C, C–OH and O–C![[double bond, length as m-dash]](https://www.rsc.org/images/entities/char_e001.gif) O bonds in PST-CA-S shifted to 284.98 eV, 286.18 eV and 288.67 eV, respectively. The results indicated that the O-containing functional groups in PST-CA-G and PST-CA-S interacted with MB during the adsorption process, which is also consistent with the FT-IR results.
O bonds in PST-CA-S shifted to 284.98 eV, 286.18 eV and 288.67 eV, respectively. The results indicated that the O-containing functional groups in PST-CA-G and PST-CA-S interacted with MB during the adsorption process, which is also consistent with the FT-IR results.
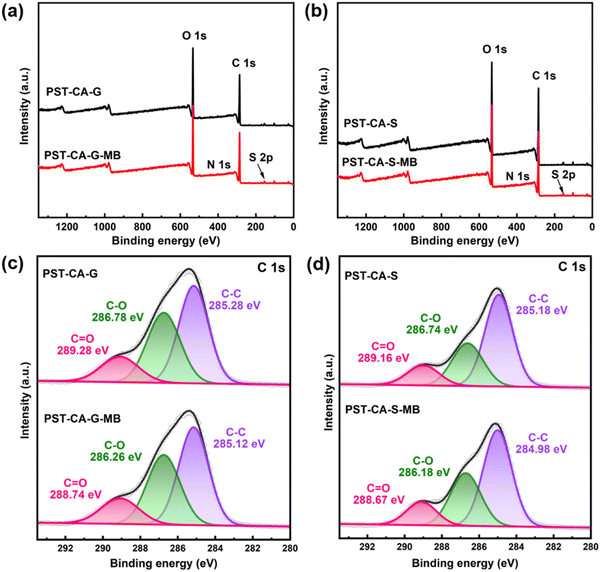 |
| | Fig. 9 (a) and (b) Full scan and (c) and (d) high-resolution spectra of C 1s of XPS before and after the adsorption of MB by PST-CA-G and PST-CA-S, respectively. | |
Table 4 Elemental content of PST-CA-G and PST-CA-S before and after adsorption of MB
| Material |
C 1s (%) |
O 1s (%) |
N 1s (%) |
S 2p (%) |
| PST-CA-G |
66.50 |
33.50 |
— |
— |
| PST-CA-G-MB |
69.71 |
29.26 |
0.88 |
0.15 |
| PST-CA-S |
72.73 |
27.27 |
— |
— |
| PST-CA-S-MB |
69.54 |
26.41 |
2.86 |
1.19 |
Computational simulation analysis.
To further elucidate the adsorption mechanism of PST-CA-G and PST-CA-S for MB, DFT simulations were performed and PST-CA-G and PST-CA-S were unified into one model, i.e., PST-CA. Firstly, the adsorption energy was calculated and the results are shown in Table 5. The total energy of PST-CA-MB was −4921.0061 Ha, the energy of PST-CA was −3738.3405 Ha, and the energy of MB was −1182.6151 Ha. The calculated adsorption energy of PST-CA for MB was −132.1565 kJ mol−1. IGMH analysis was performed based on this to determine the interaction between PST-CA-G and PST-CA-S with MB, as shown in Fig. 10. The interaction regions are mostly green, indicating that there is strong van der Waals interactions between PST-CA-G and PST-CA-S and MB. In addition, a few regions show a distinct blue color, which can be attributed to the hydrogen bonding interaction between N–H–C in MB and the hydroxyl groups in PST-CA-G and PST-CA-S as well as the electrostatic interaction with the carboxyl groups.
Table 5 Adsorption energy of MB on PST-CA calculated by the first principles approach
| PST-CA-MB Total energy (Ha) |
PST-CA Energy (Ha) |
MB energy (Ha) |
Adsorption energy (Ha) |
Adsorption energy (kJ mol−1) |
| −4921.0061 |
−3738.3405 |
−1182.6151 |
−0.0505 |
−132.1565 |
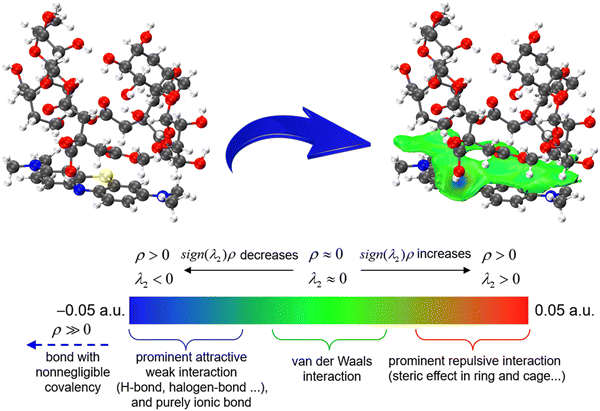 |
| | Fig. 10 IGMH analysis of the intermolecular interaction between PST-CA and MB. The blue part is the strong attraction region, which is generally hydrogen bonding, halogen bonding or other strong attraction electrostatic interactions, while the green part is the general strength interactions, such as van der Waals interactions. | |
Comparison with other adsorbents
To accurately evaluate the adsorption performance of PST-CA-G and PST-CA-S, their adsorption capacities were compared with other types of starch-based adsorbents for MB, and the relevant data are shown in Table 6. After careful comparison, we believe that due to the adsorption capacities of PST-CA-G and PST-CA-S, they have good potential for future application.
Table 6 Comparison of the maximum adsorption capacity of PST-CA-G and PST-CA-S with other starch-based adsorbents for MB
| Material |
Adsorption capacity (mg g−1) |
Ref. |
| Hierarchically porous activated starbons |
891.0 |
19
|
| Starch phosphate carbamate |
62.52 |
20
|
| Starch-based hydrogels |
2967.66 |
21
|
| Starch with 2-carboxyethyl acrylate |
16.28 |
22
|
| Porous wheat starch |
16.86 |
23
|
| Starch cross-linked trimetaphosphate |
42.70 |
24
|
| Starch based amphoteric hydrogel |
133.65 |
25
|
| Cassava starch-based hydrogel |
417.0 |
26
|
| ZnO/Cassava starch-based hydrogel |
74.0 |
27
|
| Polyethyleneimine-grafted starch |
383.14 |
28
|
| Clinoptilolite/starch/CoFe2O4 |
31.81 |
29
|
| Sodium alginate/graphene oxide/nanocrystalline cellulose |
10% NC in a matrix of SA/GO |
30
|
| Montmorillonite-reduced graphene oxide composite aerogel |
450.90 |
31
|
| A porous monolith polysaccharide-based adsorbent aerogel |
105.18 |
32
|
| Modified palygorskite |
527.22 |
33
|
| Porous 3D network rectorite/chitosan gels |
162.6 |
34
|
| PST-CA-G |
381.67 |
This work |
| PST-CA-S |
882.96 |
This work |
Regeneration and reuse of adsorbent and versatility testing
In practical industrial applications, the reusability performance of the adsorbent is a very important index from the perspective of cost effectiveness. As shown in Fig. S4 (ESI†), the adsorption capacity of PST-CA-G and PST-CA-S gradually decreased with an increase in the cycle regeneration. This may be caused by the fact that the desorption process was not carried out completely, resulting in some MB appearing in the adsorbent and occupying some of the adsorption sites, finally affecting the adsorption performance of the adsorbent. In addition, the functional groups on the adsorbent surface were lost during each adsorption-desorption process, and the adsorbent was also lost during repeated washing with ultrapure water, leading to a gradual decrease in the adsorption capacity of the adsorbent. After five adsorption-desorption cycles, the adsorption capacities of PST-CA-G and PST-CA-S decreased from 168.27 mg g−1 and 178.40 mg g−1 to 147.87 mg g−1 and 161.46 mg g−1 for MB, and the adsorption removal rates remained above 70% and 80%, respectively, indicating that PST-CA-G and PST-CA-S have good reusability and practical application potential.
To study the adsorption performance of PST-CA-G and PST-CA-S for different types of dyes, MB, CR, MG, TZ and RB were selected as the target dyes. The specific operation steps and conditions of the adsorption experiments are shown in Fig. S5 (ESI†). The adsorption performance of PST-CA-G and PST-CA-S was better for the cationic dyes MB, MG and RB, with adsorption and removal rates of more than 70%. In contrast, the adsorption performance for the anionic dyes CR and TZ was poor, with adsorption and removal rates of less than 40%. The above-mentioned results indicate that both PST-CA-G and PST-CA-S have a good adsorption performance for cationic dyes, which is probably because the positively charged cationic dyes are more likely to interact electrostatically with the carboxyl groups on the surfaces of PST-CA-G and PST-CA-S, and this interaction is dominant in the adsorption process. (For more information on the comparison of their adsorption performance, please refer to the ESI,† Fig. S6).
Conclusions
In summary, we prepared PST via the freezing method, and then synthesized two CA/PST composite adsorbents, i.e., PST-CA-G and PST-CA-S, via dry and wet methods, respectively. The adsorption performance, adsorption behavior and adsorption mechanism of PST-CA-G and PST-CA-S on MB were systematically studied. The maximum theoretical adsorption capacities of PST-CA-G and PST-CA-S were 381.67 mg g−1 and 882.96 mg g−1 for MB at 30 °C with an increase in pH and contact time, respectively. Particularly, the adsorption removal rates for PST-CA-G and PST-CA-S remained above 70% and 80%, respectively, after five adsorption-desorption cycles, indicating that they both have good reusability. Therefore, this work shows that the synthesized PST-CA adsorbent has good adsorption performance and can treat various types of dye wastewater. These remarkable results highlight the potential use of porous composite adsorbents to treat different dye wastewaters. In the future, its application in other pollutant areas can also be continued to be developed.
Author contributions
Ye He: experiment, data curation, and writing original draft. Yangyang Zheng: experiment, data curation, and writing original draft. Chang Liu: experiment, data curation, and writing original draft. Leqian Song: Theoretical calculations; Huacheng Zhang: proposed this project, wrote the paper.
Conflicts of interest
There are no conflicts to declare.
References
- A. Tkaczyk, K. Mitrowska and A. Posyniak, Sci. Total Environ., 2020, 717, 137222 CrossRef CAS PubMed.
- D. Lan, H. Zhu, J. Zhang, S. Li, Q. Chen, C. Wang, T. Wu and M. Xu, Chemosphere, 2022, 293, 133464 CrossRef CAS PubMed.
- T. Shindhal, P. Rakholiya, S. Varjani, A. Pandey, H. H. Ngo, W. Guo, H. Y. Ng and M. J. Taherzadeh, Bioengineered, 2021, 12, 70–87 CrossRef CAS PubMed.
- W. Li, B. Mu and Y. Yang, Bioresour. Technol., 2019, 277, 157–170 CrossRef CAS PubMed.
- M. T. Yagub, T. K. Sen, S. Afroze and H. M. Ang, Adv. Colloid Interface Sci., 2014, 209, 172–184 CrossRef CAS PubMed.
- Y. Zhou, J. Lu, Y. Zhou and Y. Liu, Environ. Pollut., 2019, 252, 352–365 CrossRef CAS PubMed.
- R. Wei, R. Xu, K. Zhang, F. Liang and Y. Yao, Nanotechnology, 2021, 32, 045605 CrossRef CAS PubMed.
- X. Han, H. Wen, Y. Luo, J. Yang, W. Xiao and J. Xie, Food Hydrocolloids, 2022, 124, 107288 CrossRef CAS.
- J. Chen, Y. Wang, J. Liu and X. Xu, Int. J. Biol. Macromol., 2020, 148, 1169–1181 CrossRef CAS PubMed.
- D. N. Hj. Latip, H. Samsudin, U. Utra and A. K. Alias, Crit. Rev. Food Sci. Nutr., 2021, 61, 2841–2862 CrossRef CAS PubMed.
- Y. WeiRong and Y. HuiYuan, Starch/Staerke, 2002, 54, 260–263 CrossRef.
- M. Shirazi, T. G. M. van de Ven and G. Garnier, Langmuir, 2003, 19, 10829–10834 CrossRef CAS.
- L. Guo, G. Li, J. Liu, Y. Meng and Y. Tang, Carbohydr. Polym., 2013, 93, 374–379 CrossRef CAS PubMed.
- G. A. Duarte, M. C. Bezerra, S. H. P. Bettini and A. A. Lucas, Carbohydr. Polym., 2023, 311, 120733 CrossRef CAS PubMed.
- P. Song and H. Wang, Adv. Mater., 2020, 32, 1901244 CrossRef CAS PubMed.
- V. G. Muir and J. A. Burdick, Chem. Rev., 2021, 121, 10908–10949 CrossRef CAS PubMed.
- A. Awadhiya, D. Kumar and V. Verma, Carbohydr. Polym., 2016, 151, 60–67 CrossRef CAS PubMed.
- T. Saeed, A. Naeem, I. U. Din, M. Farooq, I. W. Khan, M. Hamayun and T. Malik, J. Hazard. Mater., 2022, 427, 127902 CrossRef CAS PubMed.
- H. Li, V. L. Budarin, J. H. Clark, M. North and X. Wu, J. Hazard. Mater., 2022, 436, 129174 CrossRef CAS PubMed.
- Z. Mu, D. Liu, J. Lv, D.-F. Chai, L. Bai, Z. Zhang, G. Dong, J. Li and W. Zhang, J. Environ. Chem. Eng., 2022, 10, 108425 CrossRef CAS.
- L. Chen, Y. Zhu, Y. Cui, R. Dai, Z. Shan and H. Chen, Chem. Eng. J., 2021, 405, 126953 CrossRef CAS.
- N. Ullah, F. Haq, A. Farid, M. Kiran, Z. A. Al Othman, A. M. Aljuwayid, M. A. Habila, A. Bokhari, S. Rajendran and K. S. Khoo, Environ. Res., 2023, 219, 115091 CrossRef CAS PubMed.
- Y. Xie, M.-N. Li, H.-Q. Chen and B. Zhang, Food Chem., 2019, 274, 351–359 CrossRef CAS PubMed.
- Y. Xie, B. Zhang, M.-N. Li and H.-Q. Chen, Food Chem., 2019, 289, 187–194 CrossRef CAS PubMed.
- D. Sarmah and N. Karak, Carbohydr. Polym., 2020, 242, 116320 CrossRef CAS PubMed.
- J. Arayaphan, P. Maijan, P. Boonsuk and S. Chantarak, Int. J. Biol. Macromol., 2021, 168, 875–886 CrossRef CAS PubMed.
- P. Kongseng, P. Amornpitoksuk and S. Chantarak, Macromol. Mater. Eng., 2023, 308, 2200481 CrossRef CAS.
- Q. Chen, Y. Zhao, Q. Xie, C. Liang and Z. Zong, Carbohydr. Polym., 2021, 273, 118579 CrossRef CAS PubMed.
- R. Foroutan, S. J. Peighambardoust, S. Hemmati, H. Khatooni and B. Ramavandi, Int. J. Biol. Macromol., 2021, 189, 432–442 CrossRef CAS PubMed.
- M. T. Al-Shemy, A. Al-Sayed and S. Dacrory, Sep. Purif. Technol., 2022, 290, 120825 CrossRef CAS.
- S. Zhou, J. Yin, Q. Ma, B. Baihetiyaer, J. Sun, Y. Zhang, Y. Jiang, J. Wang and X. Yin, Sep. Purif. Technol., 2022, 296, 121416 CrossRef CAS.
- S. Tarashi, H. Nazockdast, S. Shafaghsorkh and G. Sodeifian, Sep. Purif. Technol., 2022, 287, 120587 CrossRef CAS.
- W. Wang, G. Tian, Z. Zhang and A. Wang, Chem. Eng. J., 2015, 265, 228–238 CrossRef CAS.
- Y. Lu, P. R. Chang, P. Zheng and X. Ma, Appl. Clay Sci., 2015, 107, 21–27 CrossRef CAS.
|
| This journal is © The Royal Society of Chemistry 2023 |
Click here to see how this site uses Cookies. View our privacy policy here.  Open Access Article
 ,
Ye
He‡
 ,
Chang
Liu‡
 ,
Leqian
Song
 and
Huacheng
Zhang
 *
*


![[double bond, length as m-dash]](https://www.rsc.org/images/entities/char_e001.gif) O in the ester group. This demonstrates that an esterification cross-linking reaction occurred between PST and CA. In addition, the intensity of the absorption peak of PST-CA-S at 1743 cm−1 was greater than that of PST-CA-G, indicating a higher degree of cross-linking between PST and CA in PST-CA-S. The above analysis shows that the products obtained by the dry and wet methods were very similar in terms of their detailed structures, but their degree of cross-linking was very different.
O in the ester group. This demonstrates that an esterification cross-linking reaction occurred between PST and CA. In addition, the intensity of the absorption peak of PST-CA-S at 1743 cm−1 was greater than that of PST-CA-G, indicating a higher degree of cross-linking between PST and CA in PST-CA-S. The above analysis shows that the products obtained by the dry and wet methods were very similar in terms of their detailed structures, but their degree of cross-linking was very different.

![[thin space (1/6-em)]](https://www.rsc.org/images/entities/char_2009.gif) Kdversus 1/T for PST-CA-G and PST-CA-S adsorbed MB are shown in Fig. S2 (ESI†), and the parameters obtained from the fit are listed in Table S1 (ESI†), revealing that ΔH0 is negative for both PST-CA-G and PST-CA-S with −25.4462 kJ mol−1 and −25.9051 kJ mol−1, respectively. Thus, the adsorption process of MB by both adsorbents is exothermic. The ΔS0 of both PST-CA-G and PST-CA-S was negative with −66.1701 J mol−1 K−1 and −58.5321 J mol−1 K−1, respectively, indicating that the degree of freedom of the system becomes lower after adsorption. In addition, the ΔG0 of both PST-CA-G and PST-CA-S are negative, indicating that the adsorption proceeds spontaneously. Thus, the adsorption between PST-CA-G and PST-CA-S and MB is an exothermic reaction, which proceeds spontaneously. Also, an increase in the temperature is detrimental to the adsorption process, which is consistent with the results of the adsorption isotherm.
Kdversus 1/T for PST-CA-G and PST-CA-S adsorbed MB are shown in Fig. S2 (ESI†), and the parameters obtained from the fit are listed in Table S1 (ESI†), revealing that ΔH0 is negative for both PST-CA-G and PST-CA-S with −25.4462 kJ mol−1 and −25.9051 kJ mol−1, respectively. Thus, the adsorption process of MB by both adsorbents is exothermic. The ΔS0 of both PST-CA-G and PST-CA-S was negative with −66.1701 J mol−1 K−1 and −58.5321 J mol−1 K−1, respectively, indicating that the degree of freedom of the system becomes lower after adsorption. In addition, the ΔG0 of both PST-CA-G and PST-CA-S are negative, indicating that the adsorption proceeds spontaneously. Thus, the adsorption between PST-CA-G and PST-CA-S and MB is an exothermic reaction, which proceeds spontaneously. Also, an increase in the temperature is detrimental to the adsorption process, which is consistent with the results of the adsorption isotherm.

![[double bond, length as m-dash]](https://www.rsc.org/images/entities/char_e001.gif) O in the ester group. After the adsorption of MB, new characteristic peaks corresponding to stretching vibrations of C
O in the ester group. After the adsorption of MB, new characteristic peaks corresponding to stretching vibrations of C![[double bond, length as m-dash]](https://www.rsc.org/images/entities/char_e001.gif) N (1599 cm−1) and aromatic C–H (861 cm−1) appeared in the FT-IR spectra. Also, the appearance of these characteristic peaks indicated that MB was successfully adsorbed on PST-CA-G and PST-CA-S. In addition, the intensity of both the hydroxyl peak at 3464 cm−1 and the C
N (1599 cm−1) and aromatic C–H (861 cm−1) appeared in the FT-IR spectra. Also, the appearance of these characteristic peaks indicated that MB was successfully adsorbed on PST-CA-G and PST-CA-S. In addition, the intensity of both the hydroxyl peak at 3464 cm−1 and the C![[double bond, length as m-dash]](https://www.rsc.org/images/entities/char_e001.gif) O peak at 1743 cm−1 was significantly weakened and blue-shifted after the adsorption of MB. These changes indicate that the O-containing functional groups in PST-CA-G and PST-CA-S played an important role in the adsorption process, suggesting that there may be electrostatic interactions between PST-CA-G and PST-CA-S and MB and hydrogen bonding interactions. In addition, the intensity of the C
O peak at 1743 cm−1 was significantly weakened and blue-shifted after the adsorption of MB. These changes indicate that the O-containing functional groups in PST-CA-G and PST-CA-S played an important role in the adsorption process, suggesting that there may be electrostatic interactions between PST-CA-G and PST-CA-S and MB and hydrogen bonding interactions. In addition, the intensity of the C![[double bond, length as m-dash]](https://www.rsc.org/images/entities/char_e001.gif) O characteristic peak of PST-CA-S at 1743 cm−1 diminished more than that of PST-CA-G, which may be due to the better adsorption performance of PST-CA-S on MB. Overall, the adsorption processes on PST-CA-G and PST-CA-S for MB may be dominated by chemisorption.
O characteristic peak of PST-CA-S at 1743 cm−1 diminished more than that of PST-CA-G, which may be due to the better adsorption performance of PST-CA-S on MB. Overall, the adsorption processes on PST-CA-G and PST-CA-S for MB may be dominated by chemisorption.
![[double bond, length as m-dash]](https://www.rsc.org/images/entities/char_e001.gif) O bond (289.28 eV and 289.16 eV), respectively. The binding energies of the C–C, C–OH and O–C
O bond (289.28 eV and 289.16 eV), respectively. The binding energies of the C–C, C–OH and O–C![[double bond, length as m-dash]](https://www.rsc.org/images/entities/char_e001.gif) O bonds in PST-CA-G shifted to 285.12 eV, 286.26 eV and 288.74 eV after the adsorption of MB, respectively. Alternatively, the binding energies of the C–C, C–OH and O–C
O bonds in PST-CA-G shifted to 285.12 eV, 286.26 eV and 288.74 eV after the adsorption of MB, respectively. Alternatively, the binding energies of the C–C, C–OH and O–C![[double bond, length as m-dash]](https://www.rsc.org/images/entities/char_e001.gif) O bonds in PST-CA-S shifted to 284.98 eV, 286.18 eV and 288.67 eV, respectively. The results indicated that the O-containing functional groups in PST-CA-G and PST-CA-S interacted with MB during the adsorption process, which is also consistent with the FT-IR results.
O bonds in PST-CA-S shifted to 284.98 eV, 286.18 eV and 288.67 eV, respectively. The results indicated that the O-containing functional groups in PST-CA-G and PST-CA-S interacted with MB during the adsorption process, which is also consistent with the FT-IR results.


