
 Open Access Article
 This Open Access Article is licensed under a Creative Commons Attribution-Non Commercial 3.0 Unported Licence
Engineering a manganese-based oxide heterostructure cathode for high-performance aqueous potassium-ion storage†
Zheng
Guan
a,
Yunan
Wang
a,
Mingyue
Zhang
a,
Jie
Liu
b,
Shuangwen
Li
c,
Di
Guo
 *a and
Xiaoxia
Liu
*a
*a and
Xiaoxia
Liu
*a
aDepartment of Chemistry, Northeastern University, Shenyang, 110819, China. E-mail: guodi@mail.neu.edu.cn; xxliu@mail.neu.edu.cn
bSchool of Resources and Civil Engineering, Northeastern University, Shenyang, 110819, China
cSchool of Materials Engineering, North China Institute of Aerospace Engineering, Langfang, 065000, China
First published on 4th April 2023
Abstract
Advances in aqueous potassium-ion batteries (APIBs) are hindered by the lack of cathode materials with fast K+ transport kinetics and stable structures during K+ intercalation/deintercalation. Herein, a birnessite/spinel Mn3O4 heterostructure cathode is rationally fabricated via a two-step hydrothermal method for aqueous K+ storage. Such structure design provides sufficient heterointerfaces and regulates the electronic structure of the Mn atoms in the material, which greatly facilitates the adsorption of K+. Meanwhile, the Mn dz2 orbital disrupts the long-range collinear Jahn–Teller order of the pure layered birnessite or spinel Mn3O4 phase, leading to the remission of Mn dissolution. Due to these merits, the K0.52MnO2·0.22H2O/Mn3O4 cathode exhibits a high reversible capacity of 147 mA h![[thin space (1/6-em)]](https://www.rsc.org/images/entities/char_2009.gif) g−1 at 100mAg−1 in mild K2SO4 electrolyte, a superior rate capability of 99 mA h g−1 at 2 A g−1, and 91.7% capacity retention after 2000 charge/discharge cycles. This work may provide an efficient strategy for the rational design of heterostructures and suppressing the dissolution of Mn to obtain high-performance cathodes for APIBs.
g−1 at 100mAg−1 in mild K2SO4 electrolyte, a superior rate capability of 99 mA h g−1 at 2 A g−1, and 91.7% capacity retention after 2000 charge/discharge cycles. This work may provide an efficient strategy for the rational design of heterostructures and suppressing the dissolution of Mn to obtain high-performance cathodes for APIBs.
1. Introduction
With a global push towards electric transportation and smart grids, it is crucial to develop large-scale, sustainable and eco-friendly electrochemical energy storage devices with high energy/power density.1–6 It is known that lithium-ion batteries are currently the most widely used energy storage devices, but further applications of lithium-ion batteries have been restricted by the limited lithium resource.7–10 Among the next-generation rechargeable batteries, aqueous potassium-ion batteries (APIBs) have attracted attention due to their high voltage plateau, low-cost and high safety. However, the potassium storage mechanism is mainly based on the intercalation reaction. Due to the large radius and poor transport mechanics of potassium ions, it often becomes a bottleneck restricting the further breakthrough of cathode performance.11–19Among the cathode materials for APIBs, the Prussian blue material with large channels for intercalation/deintercalation of ions is the first choice, as shown in Chart 1.20–28 Nevertheless, vacancy defects that exist in the Prussian blue structure result in the reduction of its structural stability and the interruption of electron transport channels, further leading to the deterioration of cyclic stability and the low reversible capacity.29,30 Therefore, it is necessary to explore the promising alternative cathode materials. Among many candidates, manganese oxides (including MnO2, Mn2O3, Mn3O4, etc.) with various phase structures (layered structure, spinel, tunnel phases, etc.) and rich polymorphs (α-MnO2, β-MnO2, δ-MnO2, etc.) show high electrochemical activity and bright development prospect. These structure characteristics endow Mn-based oxide materials with varying electrochemical properties and potential applications in APIBs.31–35 Unfortunately, the Mn-based oxides usually suffer from rapid capacity fading because of Mn dissolution. So far, the corrosion from electrolytes has been widely accepted as being responsible for Mn dissolution upon cycling, during which high-valence Mn cations can be readily reduced to Mn3+ or even Mn2+ as a result of charge compensation involving Mn. In addition, the well-known Jahn–Teller effect in Mn3+ also facilitates Mn dissolution by forming Mn2+via the disproportionation reaction of Mn3+ (Mn4+ + e− → Mn3+; 2Mn3+ → Mn4+ + Mn2+).36,37
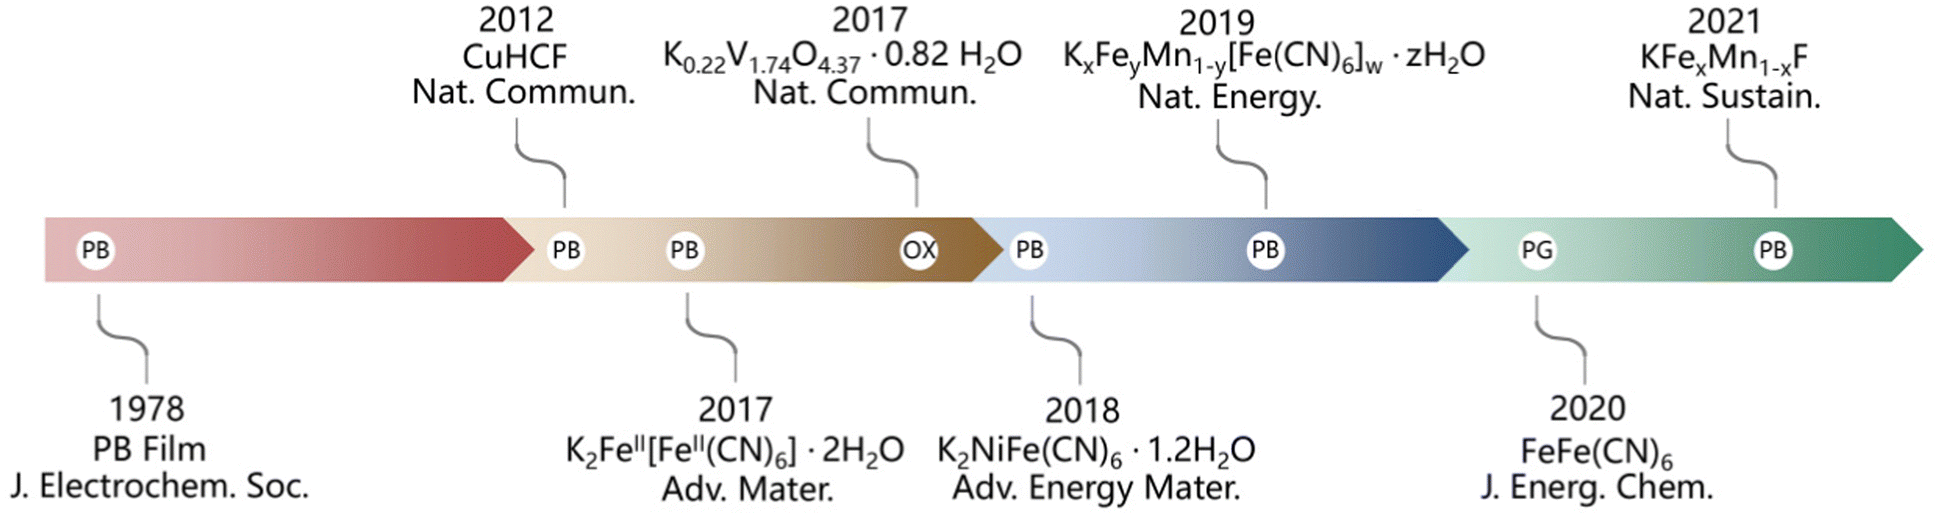 | ||
| Chart 1 Main progress in cathode materials of aqueous potassium ion batteries. | ||
With the Mn dissolution mechanisms verified by many research works, various strategies have been gradually developed, including surface modification, atom doping, ion or molecule pre-intercalation, electrolyte optimization and so on.38–45 Lu and his colleagues fabricated a potassium manganese hexacyanoferrate cathode featuring an in situ cation engineered surface where iron is substituted for manganese. This alternative strategy could reduce the dissolution of manganese and improve the stability of the electrode structure and surface chemical properties.25 Zhang's group prepared a layer of Al2O3 coating on the surface of the manganese-based material through atomic layer deposition, as a protective shell alleviating the dissolution of manganese.43 Although these reported works can increase the stability of Mn-based materials markedly, some new problems such as reducing the capacity of Mn active components, sacrificing energy density and complex preparation processes are raised. Therefore, it is crucial to design manganese based materials with a highly stable structure through simple and feasible approaches under the premise of ensuring capacity.
Recently, researchers have discovered that fabricating heterostructures is beneficial to maintain the stability of the structure. Moreover, heterostructure electrodes usually have high reversible capacity, some of which even broke through the theoretical capacity limit.46–48 Heterostructures are formed from different semiconductor materials with a similar crystal configuration, atomic spacing and thermal expansion coefficients. The introduction of a heterojunction can change the charge distribution of different chemical compositions due to various band structures, carrier concentrations and Fermi energy levels.49–51 Zou et al. synthesized MnO/Mn2O3 for Li-ion battery energy storage, which showed high stability and high rate capability during 10000 charge/discharge cycles.47 Fan et al. synthesized a NaV6O15/V2O5 heterostructure for aqueous zinc-ion batteries, which exhibited high stability after 3000 charge/discharge cycles.48 These works demonstrated that heterostructure design can accelerate the ionic kinetic ability, maintain the structure stability and alleviate the collapse of the structure caused by volume change.
Here, a layered birnessite/spinel Mn3O4 heterostructure material is fabricated through a two-step hydrothermal method as a cathode material for APIBs. The structure transformation from birnessite to spinel can be realized through the reduction reaction and K-ion intercalation via the secondary hydrothermal route. By controlling the time of the secondary hydrothermal route, the K content, crystal water content and micro-morphology of the manganese-based heterostructure can be regulated. As anticipated, the heterostructure at the interface between the birnessite phase and spinel Mn3O4 provides more active sites for K+ storage and reduces the dissolution of Mn, thereby enhancing the stability of the cathode. Consequently, the specific capacity of the optimized sample KMO-2 (K0.52MnO2·0.22H2O + Mn3O4 (50.12%)) could reach 147 mA h g−1 at 100 mA h g−1. It is maintained at 91.7% initial capacity after 2000 cycles at a current density of 1 A g−1. The potassium ion storage mechanism has been proposed and discussed using experiments and theoretical calculations. The results provide a viable opportunity for the fabrication of high-performance Mn-based oxide cathodes for high-performance APIBs.
2. Experimental section
2.1 Materials
Potassium permanganate (KMnO4), potassium hydroxide (KOH) and potassium sulphate (K2SO4) were purchased from Sinopharm Chemical Reagent (Beijing) Co., Ltd. Nitric acid (HNO3) was purchased from Damao Chemical Reagent Factory (Tianjin). All the above reagents were analytically pure and do not require further purification. Carbon cloth was purchased from Fuel Cell Earth (United States).2.2 Synthesis of pure birnessite (KMO)
The electrode was mainly prepared via a two-step hydrothermal route, and the active material was directly grown on the conductive carbon cloth, without the use of any binder and additives. A piece of 3 × 3 cm2 carbon cloth was first placed in deionized water and anhydrous ethanol for ultrasound treatment for 15 minutes, respectively. After that the carbon cloth was washed with a large amount of deionized water, and then was dried under vacuum conditions. The dried carbon cloth was immersed in 30 ml 30% HNO3 for 120 min at 120 °C. Then, the wet carbon cloth was placed in 30 mL of 12.4 mmol KMnO4 solution and the hydrothermal reaction was carried out in a 50 mL PTFE reactor for 300 min at 150 °C, followed by vacuum drying at 60 °C for 48 h. The dried sample is denoted as KMO. The sample was directly grown on the carbon cloth substrate with an average loading mass of 2.5 ± 0.3 mg cm−2.2.3 Synthesis of a birnessite/spinel Mn3O4 heterostructure (KMO-X)
The obtained KMO was immersed in 30 mL of 3 M KOH solution for 120 min, 300 min and 480 min at 205 °C, to prepare heterostructure electrodes denoted as KMO-1, KMO-2 and KMO-3, respectively. The carbon cloth containing active materials can be directly used as the cathode for APIBs. During the secondary hydrothermal reaction, there was no significant change in active material loading by weighing the substrate mass before and after the reaction.2.4 Material characterization
Morphology characterization and elemental analysis were analyzed using a scanning electron microscope (SEM, HITACHI, SU8010, Japan) equipped with an energy dispersive X-ray spectroscopy (EDX) detector and a transmission electron microscope (TEM, JEM-ARM200F, JEOL, Japan). The structure of the samples was characterized by XRD (X Pertpro, Netherlands). X-ray photoelectron spectroscopy (XPS) was performed on an XPS spectrometer (ESCALAB 250Xi, Thermo Scientific Escalab, USA) with Cu-Kα radiation (λ = 1.54 Å) as the excitation source. The data were analyzed using the C 1s peak at 284.8 eV as the reference. The mass percentages of K and Mn in the sample were measured accurately by ICP (Angilent ICPOES730, USA) and the content of crystal water was measured by TG (mettler TG-DSC 3+, USA). Thermogravimetric analysis was performed under a N2 atmosphere from 25 to 300 °C at a heating rate of 3 °C min−1.2.5 Electrochemical measurements
Electrochemical measurements were conducted on a multichannel electrochemical analyzer (VMP3, Bio-Logic-Science Instruments, France). A series of KMO-X samples were directly used as the working electrode, carbon cloth was used as the counter electrode, and the saturated calomel electrode (SCE) was used as the reference electrode to fabricate a three-electrode system. Electrochemical tests were performed using a VMP3 channel in a saturated potassium sulphate solution in the potential range of 0–1.1 V. Electrochemical impedance spectroscopy (EIS) experiments were conducted in the frequency range from 10 mHz to 100 kHz at the open circuit potential with a perturbation of 10 mV on a CHI 660E electrochemical workstation (CH Instruments Inc.). All electrochemical tests were performed at room temperature.2.6 Density-functional theory (DFT) details
All spin-polarized DFT computations were performed using the Vienna ab initio simulation package (VASP) based on the projector augmented wave (PAW) method. Electron–ion interactions were described using standard PAW potentials. A plane-wave basis set was employed to expand the smooth part of the wave functions with a cut-off kinetic energy of 400 eV. The generalized gradient approximation in the form of Perdew–Burke–Ernzerhof (PBE) was adopted for the exchange–correlation function. The van der Waals interaction was described via the DFT-D3 method.To study the mechanistic chemistry of surface reactions, the surface was modelled with a slab model. A sufficiently large vacuum region of 15 Å was used to ensure that the periodic images were well separated. During the geometry optimizations, the bottom atoms were fixed at the bulk position when the surface properties were calculated. In this work, the Brillouin-zone integrations were conducted using Monkhorst–Pack grids of special points with a separation of 0.06 Å−1. The convergence criterion for the electronic self-consistent loop was set to 10−5 eV. The atomic structures were optimized until the residual forces were below 0.03 eV Å−1. The heterostructure interface between birnessite and Mn3O4 was used as the active site to simulate the adsorption process for K. It is well known that the active sites near the hetero-interface are more active than others. All adsorptive binding energies (Eads) used in this paper were defined as:
| Eads = Etotal − (EA + EB) |
3. Results and discussion
As illustrated in Fig. 1a, the layered birnessite/spinel Mn3O4 heterostructure is fabricated via a facile two-step hydrothermal route, featuring a modulated interface where part of the birnessite layered structure is converted into the spinel phase. Firstly, the pristine birnessite nanosheets (denoted as KMO) were grown on the carbon cloth via a hydrothermal reaction at 150 °C for 300 min. Subsequently, a secondary hydrothermal reaction in KOH solution at a higher temperature of 205 °C was conducted on KMO. By controlling the reaction times of 120 min, 300 min and 480 min, the samples with various components can be achieved, denoted as KMO-1, KMO-2, and KMO-3, respectively. The morphologies of the samples were characterized by scanning electron microscopy (SEM). In Fig. 1b, birnessite nanosheets were grown uniformly at the surface of carbon cloth. After the secondary hydrothermal process, it is clearly observed that vertically aligned nanosheets in KMO are gradually converted into larger nanosheets with some thin nanowires (Fig. 1c–e). With an increase in the hydrothermal time, more nanowires appeared gradually until most of the nanosheets turned into nanowires in KMO-3. The SEM image in Fig. S1 (ESI†) shows pure Mn3O4 nanowires obtained via extending the secondary hydrothermal time to 960 min, suggesting that the birnessite phase transformed to the spinel phase during the secondary hydrothermal step.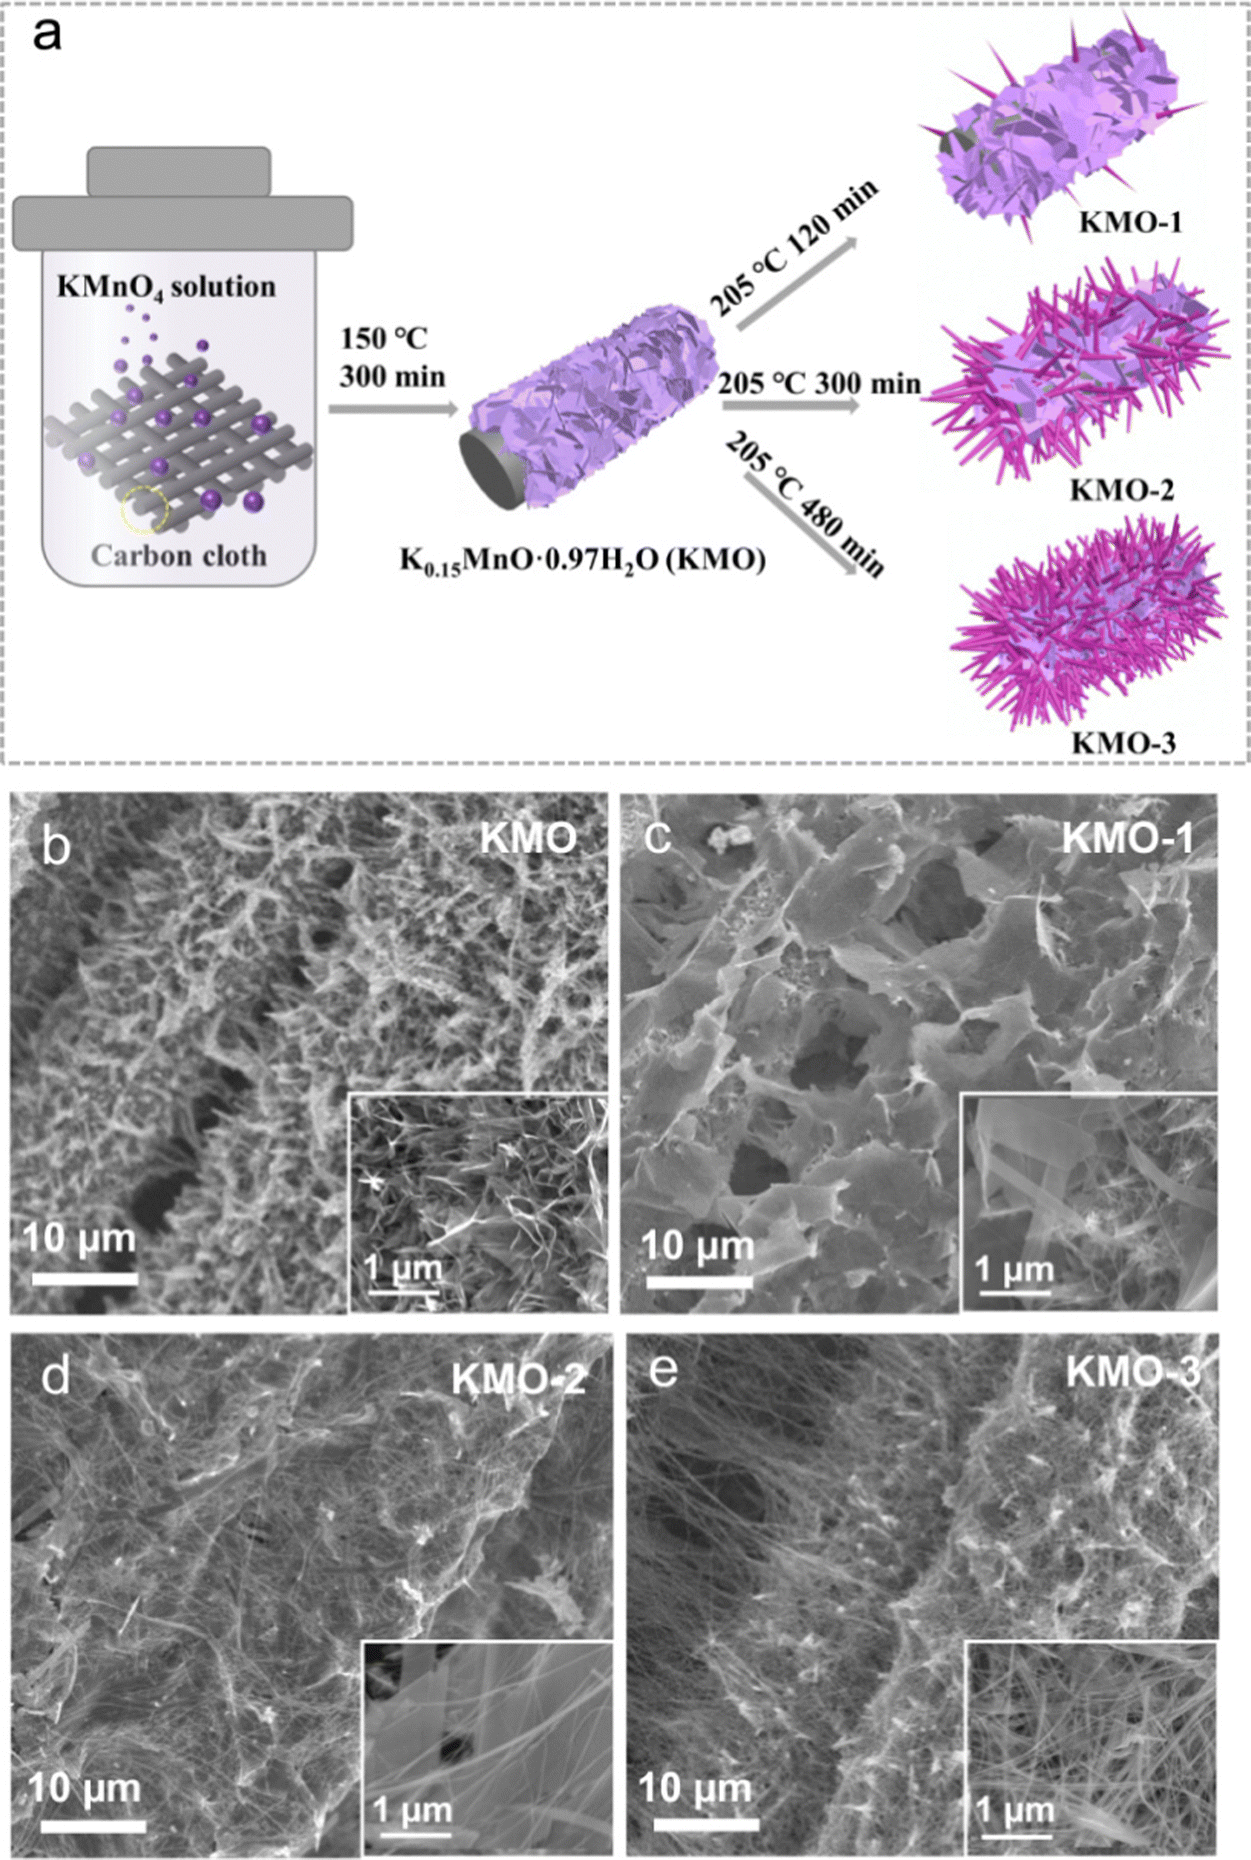 | ||
| Fig. 1 (a) The illustration of the synthesis process of the Mn-based oxide heterostructure. (b–e) Low magnification SEM images of KMO–KMO-3 samples. Inset: High magnification SEM images of KMO–KMO-3. | ||
The XRD patterns of KMO, KMO-1, KMO-2 and KMO-3 are shown in Fig. 2a. The XRD patterns show that the peak intensity of the as-synthesized KMO is weak and similar to that of the amorphous structure, and the broad peak located at 25.5° is attributed to the carbon cloth substrate. While the XRD characteristic peaks of the KMO-1, KMO-2 and KMO-3 samples correspond to the structure of birnessite (JCPDS No. 80-1098), belonging to the C2/m space group. The diffraction peaks at 12.5°, 25.2°, 37.3° and 42.6° correspond to the (001), (002), (−111) and (−112) planes, respectively. Among these samples, the diffraction peak of KMO-2 is sharp and the intensity is the highest. Notably, the sharp peak at 12.5° is related to the (001) plane of birnessite with a large layer space (0.70 nm) to create sufficient space and accommodation sites for hydrated potassium ions. In the enlarged XRD patterns in Fig. 2b, a small amount of the spinel Mn3O4 phase is discovered to emerge gradually in the secondary hydrothermal reaction. This phenomenon suggests that birnessite can be reduced to Mn3O4 (JCPDS No. 18-0803) during the secondary hydrothermal reaction process. However for KMO-1 and KMO-3 XRD patterns, it is difficult to distinguish obvious characteristic peaks for the Mn3O4 phase. To confirm the phase transition, a control experiment of prolonging the secondary hydrothermal time to 960 min was carried out. The obtained product is proved to be pure spinel Mn3O4 based on the XRD spectra (Fig. S2, ESI†), indicating the strong reductive effect of carbon cloth in the alkaline environment.32 The component evolution during the two-step hydrothermal process was further investigated by X-ray photoelectron spectroscopy (XPS). The full XPS survey scans of the KMO–KMO-3 samples in Fig. 2c demonstrate the existence of K, Mn, O, and C elements. In Fig. 2d, the binding energy separation (ΔE) difference between the two characteristic peaks of the Mn 3s orbital is 4.86 eV, 5.12 eV, 5.18 eV and 5.01 eV for KMO, KMO-1, KMO-2 and KMO-3, respectively, illustrating that Mn is reduced after the secondary hydrothermal step, which are further supported by the Mn 2p XPS spectra of the four samples. Fig. 2e displays the XPS fitting spectra of Mn 2p3/2 and Mn 2p1/2 of KMO, KMO-1, KMO-2 and KMO-3. For KMO, the Mn 2p3/2 orbital peaks located at 643.0 eV and 642.3 eV are associated with Mn4+ and Mn3+ oxidation. It can be found that the Mn 2p orbital peaks of KMO-1, KMO-2 and KMO-3 moved to the lower binding energy position relative to KMO slightly, revealing that part of Mn4+ transformed to Mn3+ and Mn2+ after the secondary hydrothermal reaction. The satellite peak of Mn2+ appears at 646.5 eV, further confirming the existence of Mn2+. Based on the fitting peak area, the content of Mn4+, Mn3+ and Mn2+ in KMO–KMO-3 can be calculated and are shown in Table S1 (ESI†). In Fig. 2f, the content of Mn4+ in the sample reduced dramatically and the content of Mn3+ and Mn2+ increased gradually with an increase in the secondary hydrothermal reaction time. The TGA curves of KMO–KMO-3 in Fig. S3 (ESI†) show that the crystal water contents in KMO, KMO-1, KMO-2 and KMO-3 are estimated to be 3.16, 2.18, 0.36, and 1.94 wt%, respectively (Table S2, ESI†). According to the inductively coupled plasma (ICP) measurements, the overall K/Mn atomic ratios for KMO–KMO-3 samples were calculated to be 0.15, 0.17, 0.21, and 0.18, respectively (Table S3, ESI†). Therefore, the molecular formulae of KMO, KMO-1, KMO-2 and KMO-3 are determined to be K0.15MnO2·0.97H2O, K0.43MnO2·1.49H2O (Mn3O4, wt 46.9%), K0.52MnO2·0.22H2O (Mn3O4, wt 50.1%), and K0.57MnO2·1.64H2O (wt 54.3%), respectively (Table S4, ESI†). It is well-known that birnessite has a sufficient layer space and is suitable for rapid K+ diffusion, but generally limited by low potassium content and much interlayer crystal water. It is difficult to achieve high specific capacity and long cycle life for the birnessite cathode. KMO-2 possesses higher potassium content and lower content interlayer crystal water than KMO, implying the successful intercalation of K+ and deintercalation of crystal water during the second-step hydrothermal reaction. During the secondary hydrothermal process, the content of birnessite reduces while more spinel Mn3O4 gradually generates, revealing that the manganese in birnessite is reduced to low-valence manganese with the increase of K content. This suggests that the fabrication of heterostructures contributes more electron density changes in Mn4+, and can be beneficial for rapid alkali-ion intercalation.49
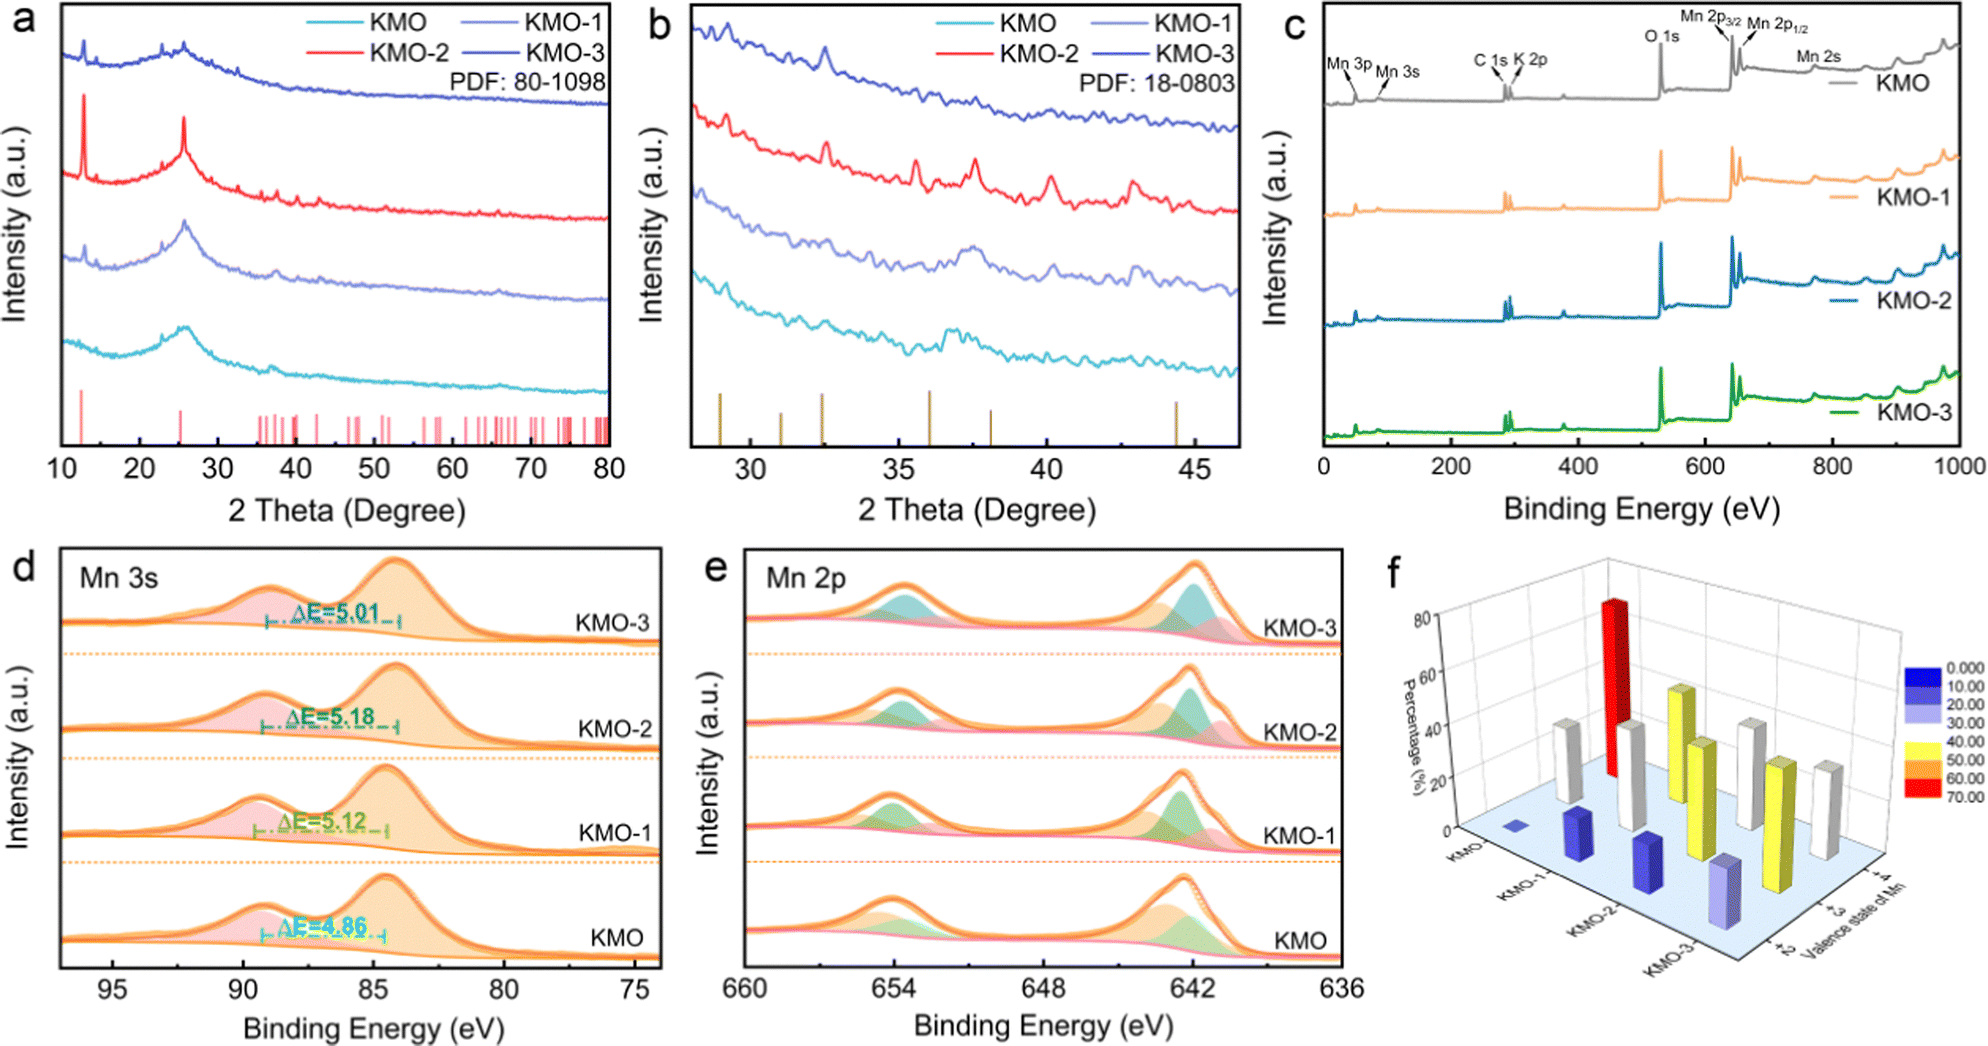 | ||
| Fig. 2 (a) XRD patterns in the 2θ regions of 10°–80° for the KMO–KMO-3 samples. (b) XRD patterns in the 2θ region of 25°–46° for the KMO–KMO-3 samples. (c) XPS spectra of the KMO, KMO-1, KMO-2 and KMO-3 samples. (d) Mn 3s core-level XPS spectra of the KMO–KMO-3 samples. (e) Mn 2p core-level XPS spectra of the KMO–KMO-3 samples. (f) Comparison of different Mn valence (+2, +3 and +4) contents in the KMO–KMO-3 samples. | ||
The microstructures of KMO–KMO-3 were further investigated by transmission electron microscopy (TEM) in Fig. 3. Fig. 3a–d display the TEM images of the KMO–KMO-3 samples, showing the composites including 2D birnessite nanosheets and 1D Mn3O4 nanowire morphology with smooth surfaces. The high-resolution TEM (HRTEM) images are shown in Fig. 3e–h. Clear lattice fringes with interplanar spaces of 0.247, 0.248, 0.247, and 0.248 nm for the (110) plane are observed for KMO, KMO-1, KMO-2, and KMO-3, respectively. The selected area electron diffraction (SAED) illustrates the (110) and (−112) diffraction dots, exhibiting polycrystalline feature and can be well indexed to birnessite. An interlayer distance of 0.67 nm is related to the (001) plane of the birnessite crystal, as shown in Fig. S4 (ESI†). Impressively, the HRTEM image of KMO-2 shows two regions with well-resolved lattice fringes with interplanar spacings of 0.247 nm and 0.153 nm, corresponding to the (110) plane of birnessite and the (224) plane of Mn3O4, respectively, and an obvious heterojunction is generated in the middle region (Fig. 3g). Therefore, the birnessite/Mn3O4 heterostructure is fabricated via the two-step hydrothermal reaction. The SAED pattern and TEM image of Mn3O4 nanowires in the KMO-2 sample are displayed in Fig. S5 (ESI†) to further validate that the generated nanowires are spinel Mn3O4.
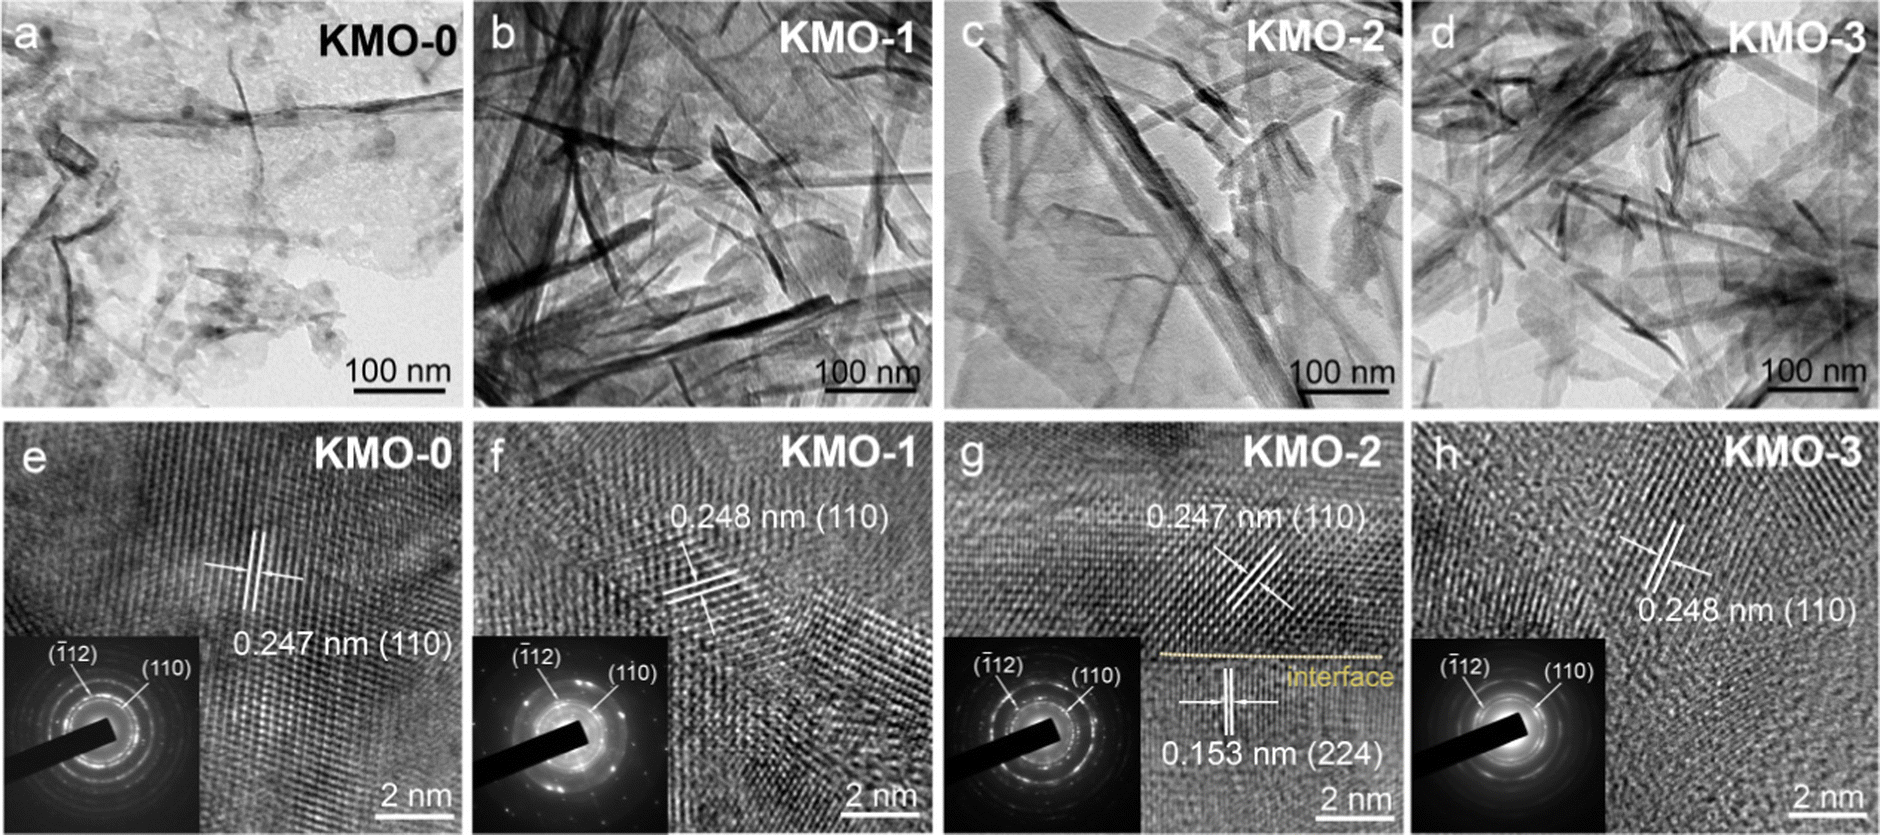 | ||
| Fig. 3 (a–d) TEM images of the KMO–KMO-3 samples. (e–h) HRTEM images of the KMO–KMO-3 samples (insets show the SAED patterns). | ||
The K+ storage performances of the KMO–KMO-3 samples in K2SO4 aqueous electrolyte were investigated using cyclic voltammetry (CV) and galvanostatic measurements in the potential range of 0–1.1 V (vs. SCE), with the results presented in Fig. 4. Fig. 4a shows the cyclic voltammetry curves of KMO, KMO-1, KMO-2 and KMO-3 at 0.3 mV s−1. For the KMO electrode, the CV curve exhibits a typical pseudocapacitive characteristic, and a pair of wide redox peaks (1.0 V/0.93 V vs. SCE) and a pair of weak peaks (0.58 V/0.4 V vs. SCE) are observed. After the two-step hydrothermal reaction, three pronounced oxidation peaks appear at around 0.37 V, 0.59 V, and 1.05 V (vs. SCE) in the CV curves of KMO-1–KMO-3 electrodes, accompanied by two reduction peaks at around 0.34 V and 1.0 V. These redox peaks after the secondary hydrothermal reaction become more pronounced, indicating enhanced K+ insertion/extraction in the layered/spinel heterostructure. Fig. S6 (ESI†) shows the initial three cycles of cyclic voltammetry curves for KMO–KMO-3 at a scan rate of 0.3 mV s−1. It can be seen that mainly four oxidation peaks are located at 0.40 V, 0.59 V, 0.78 V, and 1.05 V, respectively, during the first cycle for KMO-1, KMO-2 and KMO-3. The peak current intensity of KMO-2 is obviously higher than those of other samples and exhibits better reversibility. The galvanostatic charge–discharge curves at 100 mA g−1 of the four samples are shown in Fig. 4b. According to eqn (S1) (ESI†), the calculated capacity of KMO, KMO-1, KMO-2 and KMO-3 is 106 mA h g−1, 112 mA h g−1, 147 mA h g−1 and 99 mA h g−1 at 100 mA g−1, respectively. The galvanostatic charge/discharge curves of the KMO–KMO-3 electrodes at various current densities of 50–2000 mA g−1 are presented in Fig. S7 (ESI†). The four samples all display high coulombic efficiency and good reversibility. However, the capacity of KMO-3 with a higher K content electrode decreased significantly, which can be attributed to too high content of Mn3O4 and rare heterogeneous interfaces in the KMO-3 electrode. The K-storage performance of the Mn3O4 electrode in saturated K2SO4 electrolyte was investigated, as shown in Fig. S8 (ESI†). After the two-step hydrothermal reaction for 960 min, the material is basically converted to Mn3O4 according to the XRD pattern (Fig. S1†). The CV curves and charge/discharge curves of spinel Mn3O4 exhibit typical pseudocapacitive characteristics during the potassium storage process, and its capacity (51 mA h g−1 at 50 mA g−1) is obviously lower than that of the layered birnessite electrode. Hence, with an increase in the second-step hydrothermal reaction time, the increased K content in birnessite is beneficial for improved capacity, but consequent higher Mn3O4 content in the composite electrode would drag down the average capacity. Fig. S8d (ESI†) displays the cyclic stability of Mn3O4 for 2000 cycles at 1 A g−1. Even after 2000 cycles, Mn3O4 still retains 95% capacity retention, indicating that the heterostructure plays an important role in the enhanced K+ storage capability. The charge/discharge specific capacities of KMO–KMO-3 electrodes at different current densities as a function of cycle number are compared in Fig. 4c. When the current density increased from 50 to 2000 mA g−1, the capacity retention of KMO-0, KMO-2, KMO-1 and KMO-3 is 32%, 63%, 48% and 55%, respectively. Based on Mo's theoretical study, increasing K content can lead to faster K+-ion diffusion because of the concerted ionic diffusion behavior of multiple ions with low energy barriers.45 Therefore, the KMO-2 electrode with a heterostructure composed of birnessite with high K content and the Mn3O4 phase exhibits the best rate capability with fast K+ intercalation/deintercalation. The cyclic stabilities of the KMO–KMO-3 samples are further compared in Fig. 4d. After 1000 charge/discharge cycles at a current density of 1 A g−1, the KMO, KMO-1, KMO-2, and KMO-3 electrode retain 78.5%, 85.8%, 96.4% and 87% capacity retention, respectively, indicating that KMO-2 exhibits excellent cyclic stability.
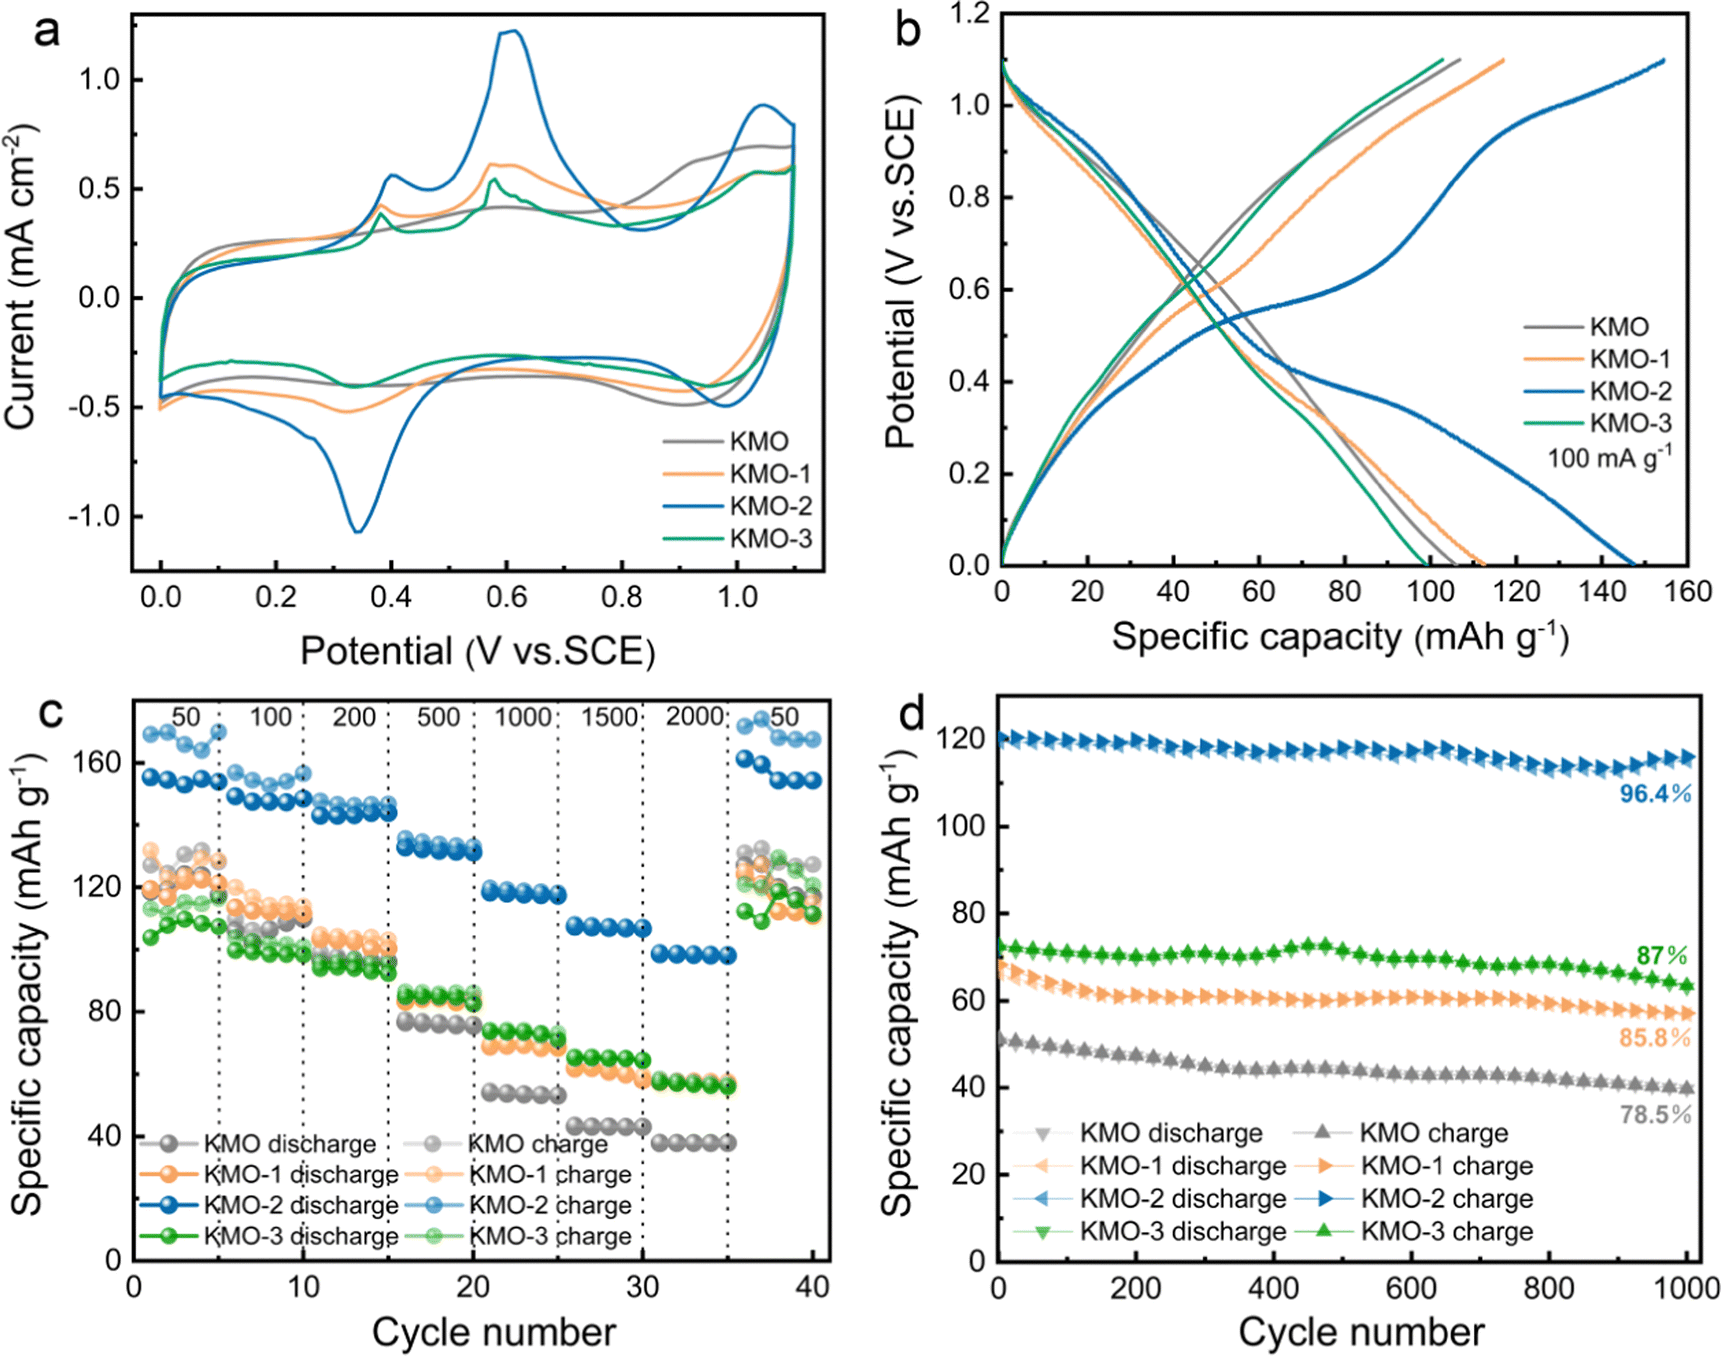 | ||
| Fig. 4 (a) CV curves of the KMO–KMO-3 samples at a scan rate of 0.3 mV s−1. (b) Charge/discharge curves of the KMO–KMO-3 samples at a current density of 100 mA g−1. (c) Rate capabilities of the KMO–KMO-3 electrodes. (d) Cyclic performances of the KMO–KMO-3 samples at 1 A g−1 for 1000 cycles. | ||
The electrochemical kinetics of KMO–KMO-3 electrodes was investigated to further explain their superior rate performance. Fig. S9 (ESI†) presents the CV curves for the four samples at different scan rates ranging from 0.1 to 5 mV s−1. The log(i) versus log(ν) plot for the cathodic and anodic peaks shows the current dependence on the scan rate. A b value of 0.5 indicates that the current is controlled by semiinfinite diffusion while b = 1 indicates capacitive behaviour. For the four samples, the b value is in the range of 0.5–1, indicating that the material capacity is the contribution of diffusion-controlled capacity and the surface capacitance together. Via the CV curves, the capacitance-control and diffusion-control capacitance can be calculated accurately through eqn (S2) and (S3) (ESI†) by quantitative analysis. In addition, the b value of the KMO-2 electrode is lower than those of other electrodes (Fig. S9, ESI†), which may be ascribed to more intercalation of K+ into the internal hetero-interface. The capacitive contribution process turns into more dominant gradually upon the increased scan rate, which can be explained by the rapid capacitive behaviour of potassium ion storage at the electrode surface. Fig. S10 (ESI†) shows that the capacitive-controlled contribution of KMO-2 is 65% via the CV curve at 0.3 mV s−1, proving the fast reaction kinetics.52,53
As displayed in Fig. 5a, the first loop and fifth loop curves of KMO-2 nearly overlap, implying a good reversibility. After the 25th charge/discharge cycle, the KMO-2 electrode delivers a reversible capacity of 119 mA h g−1 at a high current density of 1 A g−1. The long-term cyclic stability of the KMO-2 electrode was further determined at 1 A g−1 (Fig. 5b). KMO-2 maintains 91.7% initial capacity after 2000 cycles and the coulombic efficiency is close to 99% during the charge/discharge process, revealing both excellent structural stability and high reversibility. Compared with recently reported electrode materials in APIBs, as shown in Table S5 (ESI†), the prepared KMO-2 electrode outperforms most of the APIB cathodes and exhibits superior K-storage performance and rate capability. After 2000 charge/discharge cycles, the charge/discharge platform does not become obvious and the capacity decreases slightly. To explore the reason for good stability of KMO-2 electrode, the XRD spectra of KMO-2 after cycling was analyzed. Fig. 5c exhibits that the peak intensities of the (001) and (002) planes reduce significantly after 2000 charge/discharge cycles, suggesting that the heterostructure tends to be amorphous. According to the previous research work,41 the amorphous phase is conducive to the transport of ions within the bulk phase and increases the electron conductivity. Compared with the crystal material, the ion diffusion in the amorphous phase is greatly improved. In Fig. 5d, the XPS spectra of the Mn 2p orbital after long-term cycling shows that the Mn4+ content decreased by 9.5%, due to the irreversible K-ion intercalation/deintercalation which is the main reason for capacity fade. The outstanding K+ storage capability of the KMO-2 heterostructure electrode is probably owing to its reversible structural changes during the depotassiation/potassiation process. To verify this speculation, ex situ XRD was performed upon the second charging/discharging as shown in Fig. 5e and f. The (001) peak shifted significantly to a lower angle direction upon charging to 1.1 V (Fig. 5e), which is commonly observed in layered cathodes for rechargeable batteries, indicating the increasing interplanar space due to the enhanced coulombic repulsion between the MnO6 slabs upon K+ extraction. The (001) interplanar spacing overall continuously increases and reduces upon depotassiation and potassiation. The reversible peak shift of the (001) plane suggests a reversible K+ exchange in the heterostructure electrode during the charge/discharge.
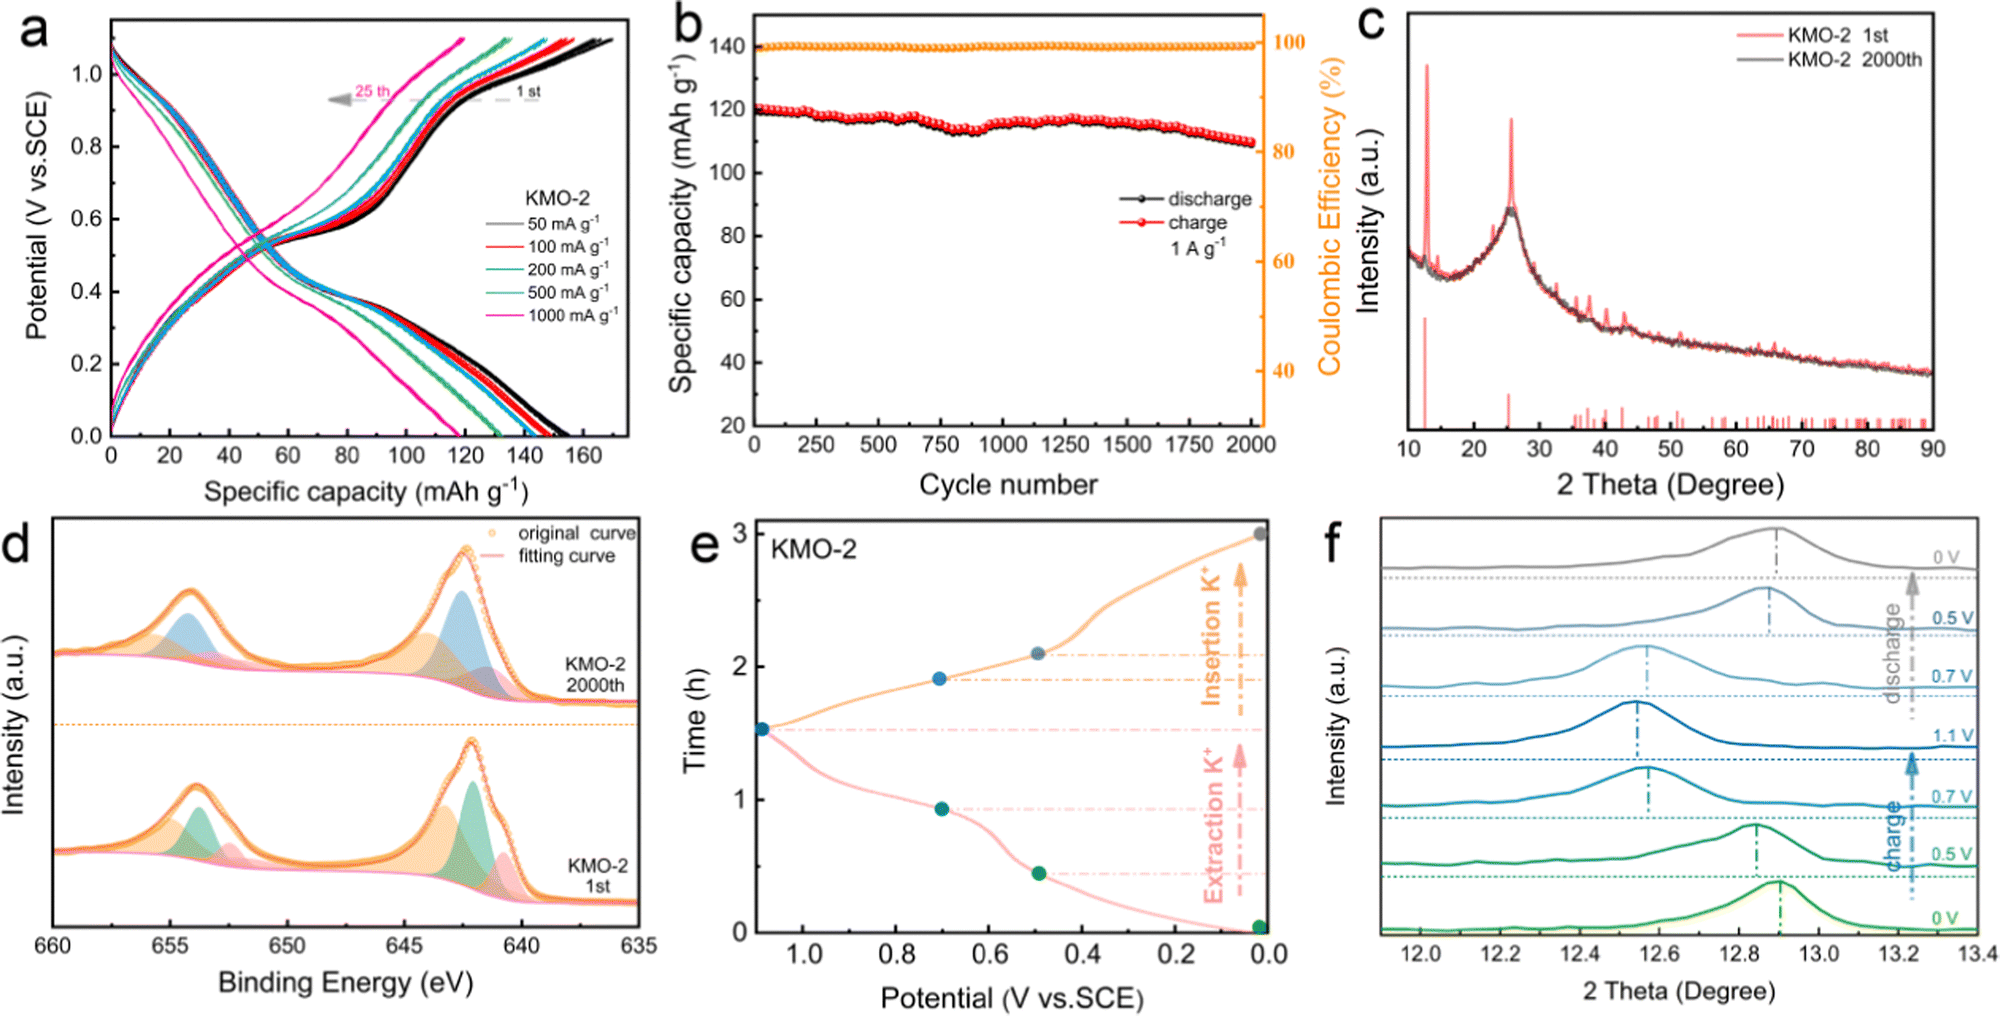 | ||
| Fig. 5 (a) The galvanostatic charge/discharge profiles of the KMO-2 electrode at different current densities from the 1st cycle to the 25th cycle. (b) Long-term cyclic stability and corresponding coulombic efficiency of the KMO-2 sample at 1 A g−1 for 2000 cycles. (c) The XRD patterns and (d) the XPS spectra of the KMO-2 electrode after the 1st cycle and after 2000 cycles, respectively. (e) Charge/discharge curve of the KMO-2 sample at 20 mA g−1. (f) Ex situ XRD patterns of the KMO-2 sample upon the second cycle. | ||
To elucidate the mechanism of the K+ storage in the heterostructure, the densities of states in the birnessite, spinel Mn3O4 and heterostructure electrodes were investigated by first-principles computation. As displayed in Fig. 6a, compared with the energy band structures of birnessite and Mn3O4, the heterostructure shows obvious metallic characteristics, as the band gap is 0 eV. The birnessite and spinel Mn3O4 has a band gap of 1.79 eV and 0.60 eV, respectively. In general, the wider band gap means worse electrical conductivity that results in more difficult electron transfer. This result implies that the heterostructure composed of birnessite and Mn3O4 improves the electronic conductivity. Nevertheless, the practical use of Mn-based oxide cathodes in APIBs has been hindered by the synergistic Jahn–Teller effect associated with high spin Mn3+, which leads to severe structural degradation and rapid capacity decay. In Fig. 6b, single-electron occupation in the double-degenerate eg level results in a local Jahn–Teller distortion, with the Mn–O bonds elongated along one octahedral axis.50 For a detailed description of the electronic structure, Fig. 6c shows the Mn dz2 density of states of birnessite, spinel Mn3O4 and heterostructure, respectively. A significant change can be observed in the density of states for the heterostructure, which moves above the Fermi level. The heterostructures of birnessite and spinel Mn3O4 lead to redistribution of the Mn 3dz2 state, which may provide more electrons to participate in the 3d state of manganese atoms at the bottom of the conduction band. The charge compensation effect between Mn and O reduces the transition energy of electrons from the valence band to the conduction band. As a result, the electron rearrangement in the 3d state of manganese atoms in the heterostructure can disturb the long-range order of the original dz2 orbital in birnessite or spinel Mn3O4, effectively suppressing the Jahn–Teller effect and maintaining long lifetime of the electrode. After geometric optimization for the interface formed by birnessite and Mn3O4, it is found that the O atoms of birnessite tend to bind with the Mn atoms of Mn3O4, as shown in Fig. 6d, which will also contribute to the strong binding force between birnessite and Mn3O4. Moreover, the Gibbs free energy calculations show that K+ adsorption energy decreases after introducing Mn3O4. For the heterostructure, the Gibbs free energy of K-ion adsorption is −4.18 eV, which is significantly lower than the Gibbs free energy of K ions on the birnessite (−0.25 eV) and spinel Mn3O4 (−2.63 eV). The lower Gibbs adsorption energy of the heterostructure indicates the larger electrochemical active surface area for the adsorption, induced by heterogeneous interface effects. The more active sites from the heterostructure can absorb more potassium ions and promote the surface kinetics, resulting in high rate capacity.
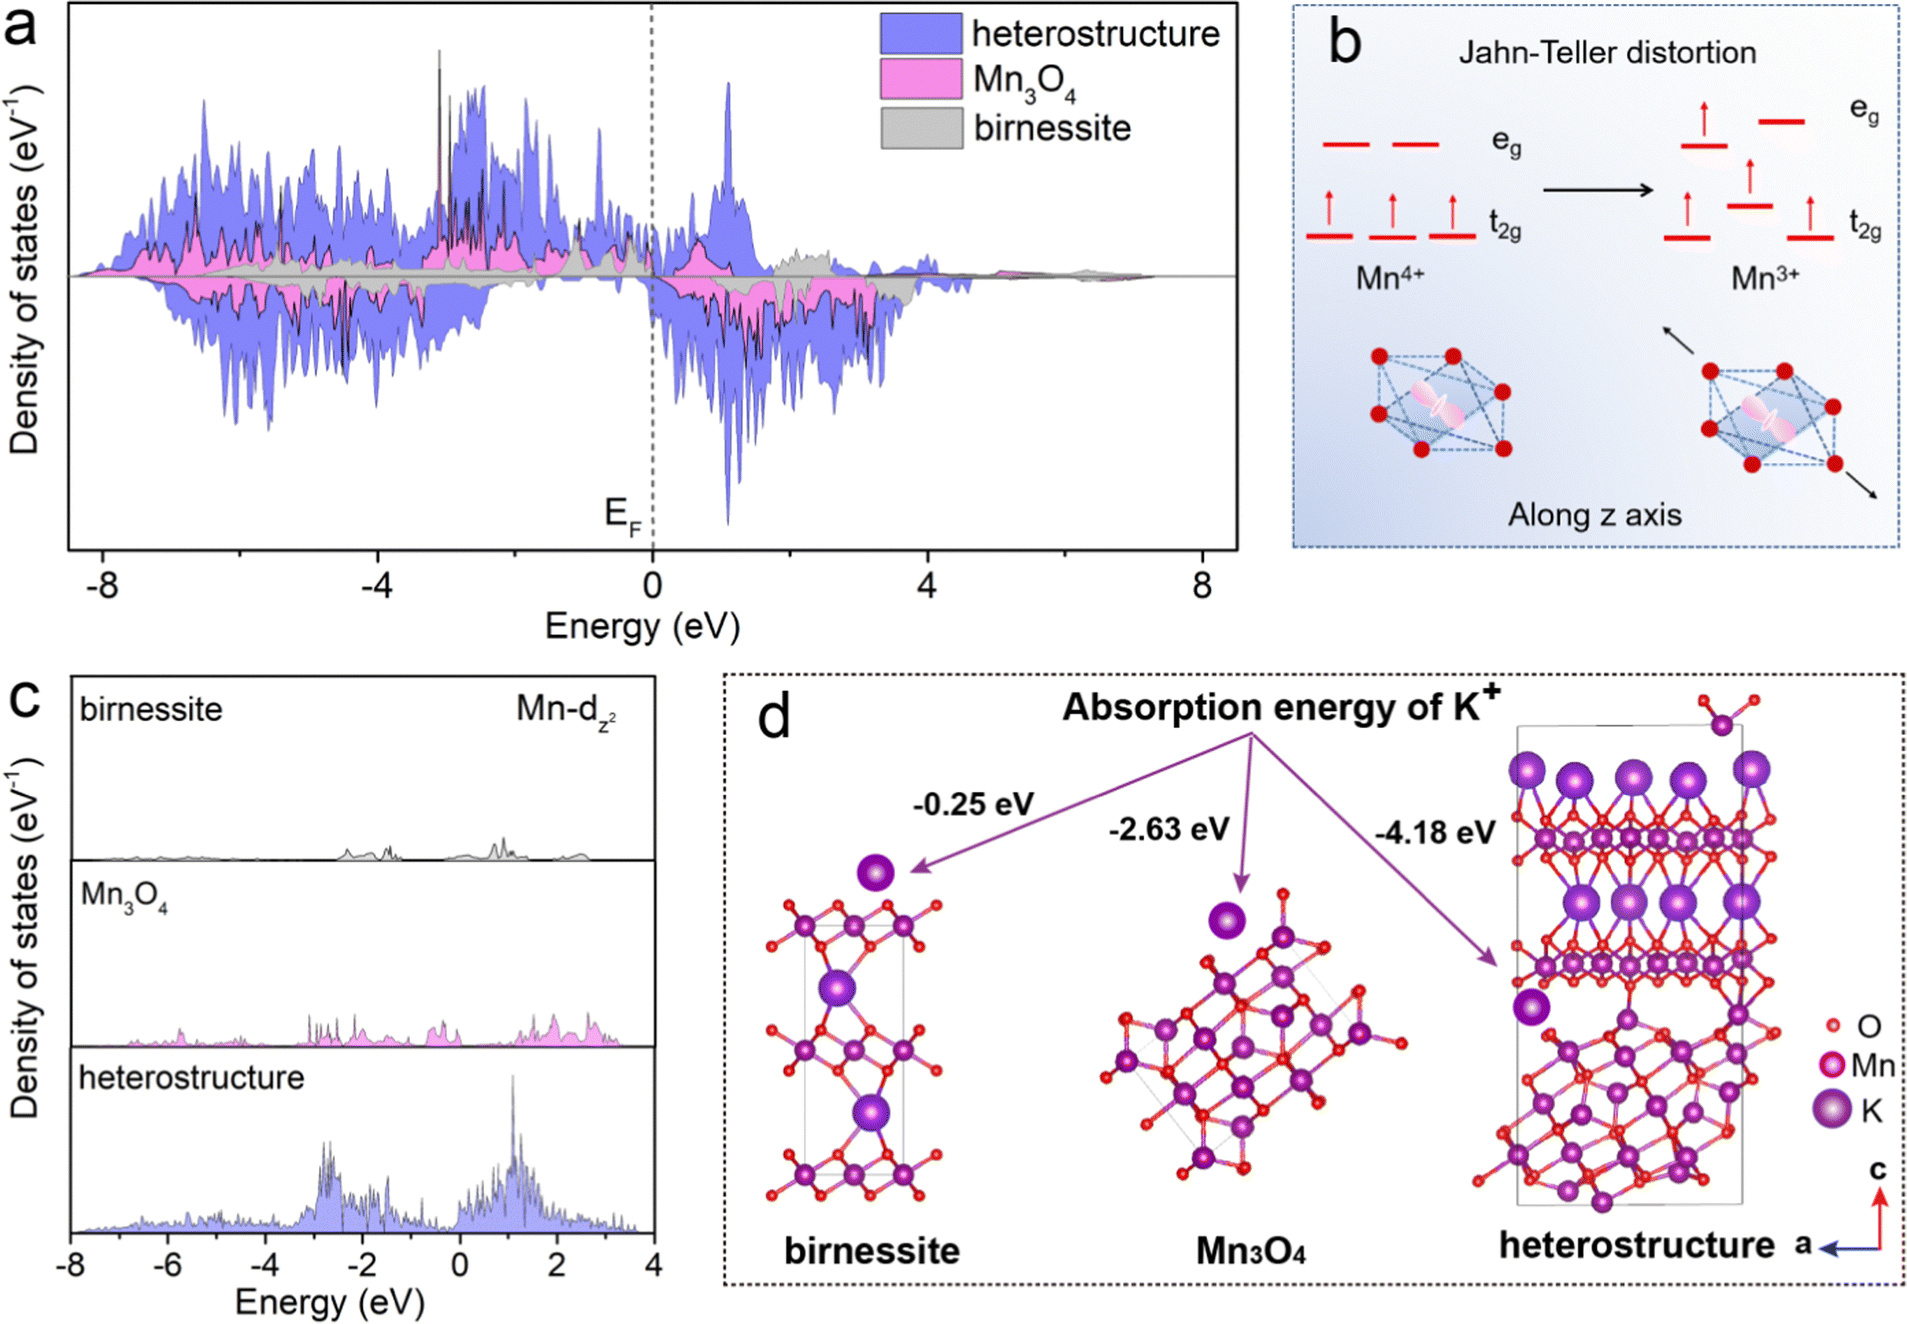 | ||
| Fig. 6 (a) The birnessite, Mn3O4 and heterostructure model structures corresponding to the state density. The dashed gray line is the Fermi energy (EF). (b) Splitting of the eg levels of d orbitals in an octahedral environment caused by Jahn–Teller distortion. (c) Partial density of states of Mn-dz2 in the birnessite, Mn3O4 and heterostructure. (d) Calculated absorption energies for K+ on the surfaces of perfect birnessite, Mn3O4 and heterostructure model structures. | ||
4. Conclusions
In summary, a Mn-based oxide heterostructure composed of birnessite K0.52MnO2·0.22H2O and spinel Mn3O4 is fabricated via a facile two-step hydrothermal reaction, as the high-performance cathode for APIBs. The optimized birnessite/spinel heterostructure delivers a high specific capacity of 147 mA h g−1 at a current density of 100 mA g−1, as well as superior cycling stability at 91.7% capacity retention after 2000 cycles. We discovered that the layered birnessite/spinel Mn3O4 heterostructure can stabilize the electrode structure and relieve Mn dissolution, as elucidated by ex situ XRD and DFT calculations. This work provides a promising strategy for interface engineering and effective heterostructure design and for promoting the development of Mn-based cathodes for high-performance aqueous potassium-ion batteries.Author contributions
Zheng Guan: conceptualization, data acquisition and analysis, methodology, original draft preparation, writing – original draft. Yunan Wang: investigation, formal analysis, methodology, writing – review & editing. Mingyue Zhang: validation, investigation. Jie Liu: methodology, investigation. Shuangwen Li: funding acquisition, resources. Di Guo: project administration, supervision, writing – review & editing. Xiaoxia Liu: funding acquisition, supervision, writing – review & editing.Conflicts of interest
The authors declare no conflict of interest.Acknowledgements
S. W. L. acknowledges the financial support from the National Natural Science Foundation of China (52003007). X.-X. L. is grateful for the financial support from the LiaoNing Science and Technology Development Foundation Guided by Central Government (2021JH6/10500139). The authors thank Xinli Wang from the Analytical and Testing Center of Northeastern University for TEM data acquisition.Notes and references
- N. Kittner, F. Lill and D. M. Kammen, Nat. Energy, 2017, 2, 1–6 CrossRef.
- C. Zhang, Y. L. Wei, P. F. Cao and M. C. Lin, Renewable Sustainable Energy Rev., 2018, 82, 3091–3106 CrossRef CAS.
- T. M. Gur, Energy Environ. Sci., 2018, 11, 2696–2767 RSC.
- W. Zhang, Y. Dai, R. Chen, Z. Xu, J. Li, W. Zong, H. Li, Z. Li, Z. Zhang, J. Zhu, F. Guo, X. Gao, Z. Du, J. Chen, T. Wang, G. He and I. P. Parkin, Angew. Chem., Int. Ed., 2023, 62, e202212695 CAS.
- W. Zhang, Y. Wu, Z. Xu, H. Li, M. Xu, J. Li, Y. Dai, W. Zong, R. Chen, L. He, Z. Zhang, D. J. L. Brett, G. He, Y. Lai and I. P. Parkin, Adv. Energy Mater., 2022, 12, 2201065 CrossRef CAS.
- R. Chen, H. Tang, Y. Dai, W. Zong, W. Zhang, G. He and X. Wang, ACS Nano, 2022, 16, 19124–19132 CrossRef CAS PubMed.
- J. O. G. Posada, A. J. R. Rennie, S. P. Villar, V. L. Martins, J. Marinaccio, A. Barnes, C. F. Glover, D. A. Worsley and P. J. Hall, Renewable Sustainable Energy Rev., 2017, 68, 1174–1182 CrossRef CAS.
- H. S. Ao, Y. Y. Zhao, J. Zhou, W. L. Cai, X. T. Zhang, Y. C. Zhu and Y. T. Qian, J. Mater. Chem. A, 2019, 7, 18708–18734 RSC.
- D. L. Chao, W. H. Zhou, F. X. Xie, C. Ye, H. Li, M. Jaroniec and S. Z. Qiao, Sci. Adv., 2020, 6, eaba4098 CrossRef CAS PubMed.
- Q. Q. Yao and C. B. Zhu, Adv. Funct. Mater., 2020, 30, 2005209 CrossRef CAS.
- A. Eftekhari, Z. L. Jian and X. L. Ji, ACS Appl. Mater. Interfaces, 2017, 9, 4404–4419 CrossRef CAS PubMed.
- B. Wang, E. H. Ang, Y. Yang, Y. F. Zhang, M. H. Ye, Q. Liu and C. C. Li, Chem. – Eur. J., 2021, 27, 512–536 CrossRef CAS PubMed.
- M. F. Zhou, P. X. Bai, X. Ji, J. X. Yang, C. S. Wang and Y. H. Xu, Adv. Mater., 2021, 33, 2003741 CrossRef CAS PubMed.
- L. W. Jiang, Y. X. Lu, C. L. Zhao, L. L. Liu, J. N. Zhang, Q. Q. Zhang, X. Shen, J. M. Zhao, X. Q. Yu, H. Li, X. J. Huang, L. Q. Chen and Y. S. Hu, Nat. Energy, 2019, 4, 495–503 CrossRef CAS.
- K. Kubota, M. Dahbi, T. Hosaka, S. Kumakura and S. Komaba, Chem. Rec., 2018, 18, 459–479 CrossRef CAS PubMed.
- Q. Zhang, Z. Wang, S. Zhang, T. Zhou, J. Mao and Z. Guo, Electrochem. Energy Rev., 2018, 1, 625–658 CrossRef CAS.
- J. Y. Hwang, S. T. Myung and Y. K. Sun, Adv. Funct. Mater., 2018, 28, 1802938 CrossRef.
- H. Kim, J. C. Kim, M. Bianchini, D. H. Seo, J. Rodriguez-Garcia and G. Ceder, Adv. Energy Mater., 2018, 8, 1702384 CrossRef.
- W. C. Zhang, Y. J. Liu and Z. P. Guo, Sci. Adv., 2019, 5, eaav7412 CrossRef CAS PubMed.
- V. D. Neff, J. Electrochem. Soc., 1978, 125, 886 CrossRef CAS.
- M. Pasta, C. D. Wessells, R. A. Huggins and Y. Cui, Nat. Commun., 2012, 3, 1–7 Search PubMed.
- D. W. Su, A. McDonagh, S. Z. Qiao and G. X. Wang, Adv. Mater., 2017, 29, 1604007 CrossRef PubMed.
- D. S. Charles, M. Feygenson, K. Page, J. Neuefeind, W. Q. Xu and X. W. Teng, Nat. Commun., 2017, 8, 1–8 CrossRef PubMed.
- W. Ren, X. Chen and C. Zhao, Adv. Energy Mater., 2018, 8, 1801413 CrossRef.
- J. Ge, L. Fan, A. M. Rao, J. Zhou and B. Lu, Nat. Sustainability, 2022, 5, 225–234 CrossRef.
- M. T. Xia, X. K. Zhang, T. T. Liu, H. X. Yu, S. Chen, N. Peng, R. T. Zheng, J. D. Zhang and J. Shu, Chem. Eng. J., 2020, 394, 124923 CrossRef CAS.
- M. T. Wang, H. Q. Wang, H. M. Zhang and X. F. Li, J. Energy Chem., 2020, 48, 14–20 CrossRef.
- K. J. Zhu, Z. P. Li, T. Jin and L. F. Jiao, J. Mater. Chem. A, 2020, 8, 21103–21109 RSC.
- R. Chua, Y. Cai, Z. K. Kou, R. Satish, H. Ren, J. J. Chan, L. P. Zhang, S. A. Morris, J. M. Bai and M. Srinivasan, Chem. Eng. J., 2019, 370, 742–748 CrossRef CAS.
- X.-Z. Zhai, J. Qu, S.-M. Hao, Y.-Q. Jing, W. Chang, J. Wang, W. Li, Y. Abdelkrim, H. Yuan and Z.-Z. Yu, Nano-Micro Lett., 2020, 12, 1–15 CrossRef PubMed.
- C. Vaalma, G. A. Giffin, D. Buchholz and S. Passerini, J. Electrochem. Soc., 2016, 163, A1295–A1299 CrossRef CAS.
- B. W. Lin, X. H. Zhu, L. Z. Fang, X. Y. Liu, S. Li, T. Zhai, L. Xue, Q. B. Guo, J. Xu and H. Xia, Adv. Mater., 2019, 31, 1900060 CrossRef PubMed.
- Q. Zhang, C. Didier, W. K. Pang, Y. J. Liu, Z. J. Wang, S. Li, V. K. Peterson, J. F. Mao and Z. P. Guo, Adv. Energy Mater., 2019, 9, 1900568 CrossRef.
- Y. Z. Liu, Z. M. Qin, X. P. Yang and X. Q. Sun, Adv. Funct. Mater., 2022, 32, 2106994 CrossRef CAS.
- L. Q. Mai, J. Z. Sheng, L. Xu, S. S. Tan and J. S. Meng, Acc. Chem. Res., 2018, 51, 950–959 CrossRef CAS PubMed.
- S. Z. Huang, Z. H. Wang, Y. V. Lim, Y. Wang, Y. Li, D. H. Zhang and H. Y. Yang, Adv. Energy Mater., 2021, 11, 2003689 CrossRef CAS.
- W. J. Hyun, C. M. Thomas, N. S. Luu and M. C. Hersam, Adv. Mater., 2021, 33, 2007864 CrossRef CAS PubMed.
- P. Xiong, Y. Y. Wu, Y. F. Liu, R. Z. Ma, T. Sasaki, X. Wang and J. W. Zhu, Energy Environ. Sci., 2020, 13, 4834–4853 RSC.
- Y. Y. Wang, D. Liu, M. L. Sun and J. P. Liu, Mater. Chem. Front., 2021, 5, 7384–7402 RSC.
- N. Zhang, F. Y. Cheng, J. X. Liu, L. B. Wang, X. H. Long, X. S. Liu, F. J. Li and J. Chen, Nat. Commun., 2017, 8, 1–9 CrossRef PubMed.
- R. Z. Zhao, H. X. Di, X. B. Hui, D. Y. Zhao, R. T. Wang, C. X. Wang and L. W. Yin, Energy Environ. Sci., 2020, 13, 246–257 RSC.
- W. J. Hyun, C. M. Thomas, N. S. Luu and M. C. Hersam, Adv. Mater., 2021, 33, 2007864 CrossRef CAS PubMed.
- L. N. Zhao, G. R. Chen, Y. H. Weng, T. T. Yan, L. Y. Shi, Z. X. An and D. S. Zhang, Chem. Eng. J., 2020, 401, 126138 CrossRef CAS.
- H. Y. Shi, Y. Song, Z. M. Qin, C. C. Li, D. Guo, X. X. Liu and X. Q. Sun, Angew. Chem., Int. Ed., 2019, 58, 16057–16061 CrossRef CAS PubMed.
- H. Z. Lv, Y. Song, Z. M. Qin, M. Y. Zhang, D. Yang, Q. Pan, Z. H. Wang, X. J. Mu, J. M. Meng, X. Q. Sun and X. X. Liu, Chem. Eng. J., 2022, 430, 133064 CrossRef CAS.
- X. F. He, Y. Z. Zhu and Y. F. Mo, Nat. Commun., 2017, 8, 1–7 CrossRef PubMed.
- Y. Zou, A. Dong, Z. Guo, L. Ye, Y. Cui, M. Guo, L. Zhao and Q. Jiang, ACS Appl. Nano Mater., 2020, 3, 5612–5624 CrossRef CAS.
- L. L. Fan, Z. H. Li, W. M. Kang and B. W. Cheng, J. Energy Chem., 2021, 55, 25–33 CrossRef CAS.
- F. F. Liu, S. Jin, Q. X. Xia, A. G. Zhou and L. Z. Fan, J. Energy Chem., 2021, 62, 220–242 CrossRef CAS.
- X. H. Zhu, F. Q. Meng, Q. H. Zhang, L. Xue, H. Zhu, S. Lan, Q. Liu, J. Zhao, Y. H. Zhuang, Q. B. Guo, B. Liu, L. Gu, X. Lu, Y. Ren and H. Xia, Nat. Sustainability, 2021, 4, 392 CrossRef.
- Y. Li, J. W. Zhang, Q. G. Chen, X. H. Xia and M. H. Chen, Adv. Mater., 2021, 33, 2100855 CrossRef CAS PubMed.
- Y. Jiang and J. Liu, Energy Environ. Mater., 2019, 2, 30–37 CrossRef.
- W. Zhang, Z. Xu, H. Li, M. Xu, S. Wang, Z. Li, A. Wang, L. Zhang, L. He, S. Li, B. Zhu, Z. Zhang and Y. Lai, Chem. Eng. J., 2022, 433, 133542 CrossRef CAS.
Footnote |
| † Electronic supplementary information (ESI) available. See DOI: https://doi.org/10.1039/d3ma00099k |
| This journal is © The Royal Society of Chemistry 2023 |