 Open Access Article
A report on Se/Eu-doped hydroxyapatite: crystal structure analysis, biological property assessment, and applications in osteosarcoma inhibition and bioimaging†
Shuoshuo
Zhou‡
ab,
Jian
Ren‡
ab,
Lunzhu
Wang
ab,
Liting
Liu
ab and
Chunlin
Deng
 *abc
*abc
aSchool of Materials Science and Engineering, South China University of Technology, Guangzhou 510641, China
bNational Engineering Research Center for Tissue Restoration and Reconstruction, Guangzhou 510006, China
cKey Laboratory of Biomedical Engineering of Guangdong Province, South China University of Technology, Guangzhou 510006, China
First published on 17th April 2023
Abstract
A significant clinical issue in bone diseases is the treatment of post-operative osteosarcoma and the repair of bone defects. Hydroxyapatite (HAp) is a natural bone component with pro-osteogenic properties. Selenium (Se)-doped HAp can successfully prevent osteosarcoma in vitro and in vivo. However, the in vivo distribution and metabolism of Se-doped HAp nanoparticles have not been fully analyzed. The use of europium (Eu)-doped HAp as a fluorescence bioimaging tool is possible for non-destructive observation in vitro and in vivo, but it is still uncommon in osteosarcoma therapy. This study is aimed at creating a new material that will fill the gap in both osteosarcoma inhibition and bioimaging by doping Se and Eu into HAp. In this study, HAp–Se/Eu was hydrothermally synthesized in one step, and the doping of Se as SeO32− partially instead of PO43− and Eu as Eu3+ partially instead of Ca2+ into the HAp lattice structures was confirmed by Rietvelt refinement, XPS, and other techniques. As a result, the inhibition rate of HAp–Se on osteosarcoma cells was up to 80%; HAp–Eu showed red light at 396 nm excitation; HAp–Se–Eu showed improved anti-tumor performance and fluorescence, and its osteosarcoma cell inhibition rate exceeded 90%, allowing for tumor cell imaging. These findings demonstrate that Se and Eu double-element-doped HAp successfully conferred nanomaterials with osteosarcoma inhibition and bioimaging properties, and these nanoparticles could be used for postoperative treatment and imaging of osteosarcoma resection.
Introduction
One of the most prevalent primary bone cancers, osteosarcoma is extraordinarily diverse and extremely aggressive, making therapy challenging.1 The most frequent clinical treatment is a combination of surgical resection and medications,2,3 but significant issues such as the repair of bone defects and postoperative residual microscopic tumor tissue necessitate the development of a biomaterial that effectively inhibits tumor growth and facilitates bone repair.3An outstanding performance material for bone repair, hydroxyapatite (HAp) is a component of bone tissue4 and has great biocompatibility5 and osteoinductivity6 on its own. Additionally, due to its structural properties, elemental doping is feasible because exogenous ions or atomic groups can take the place of the original ions.7 Se-doped HAp has been studied for the inhibition of osteosarcoma and the promotion of bone tissue repair.8–10
The use of selenium (Se), an essential trace element with anti-tumor properties,11,12 can successfully avoid the side effects induced by conventional radiation medications, and has become the current research trend of osteosarcoma treatment. Se has been demonstrated to have a significant role in anti-tumor and bone-formation processes by affecting protein activity. According to Wang et al.,13 Se–HAp dramatically decreased osteosarcoma metastasis in both in vitro and in vivo. Kim et al.14 inhibited selenoproteins to regulate osteoclast differentiation. Despite relatively advanced methods for manufacturing15–17 and biological evaluation8–10,13,16 of Se-doped HAp, its in vivo distribution and metabolic patterns have not been thoroughly investigated to ensure a balance between the nanomaterials' antitumor activity and biosafety, leading to in vivo toxicity of the nanomaterials.18 However, imaging tools may be able to effectively address the issue of nanomaterial in vivo distribution and metabolic patterns.19
Europium (Eu) is a rare earth element that can be efficiently imaged by fluorescence. Currently, fluorescence imaging has become one of the most widely used methods for examining the in vivo dispersion of nanomaterials due to its benefits including invasiveness, low cost, high sensitivity, and real-time imaging.19,20 With rare earth element doped luminous materials, shortcomings like poor light stability and shallow penetration depth can be overcome.21,22 Eu as one of the rare earth elements would present red light when its trivalent ion doped materials are excited at 394 nm,23 which can be used for bioimaging, nondestructive observation, biosensing, imaging-guided illness therapy, etc.24–27 Chang et al.26 effectively maintained the material's photoluminescence characteristics while synthesizing a new composite material made of N-doped carbon dots and Eu/Ga co-doped HAp. The PLLA and Eu3+-doped HAp composites created by Szyszka et al.27 have the ability to promote bone repair and serve as bioimaging tools for the treatment of bone disorders. However, there have been few reports on the use of similar bioimaging tools in tumor therapy. As a result, the goal of this research is to fill the gap in anti-tumour applications for rare earth-doped luminescent imaging materials by developing a new material that can effectively inhibit tumor growth, promote bone repair, and have bioimaging functions.
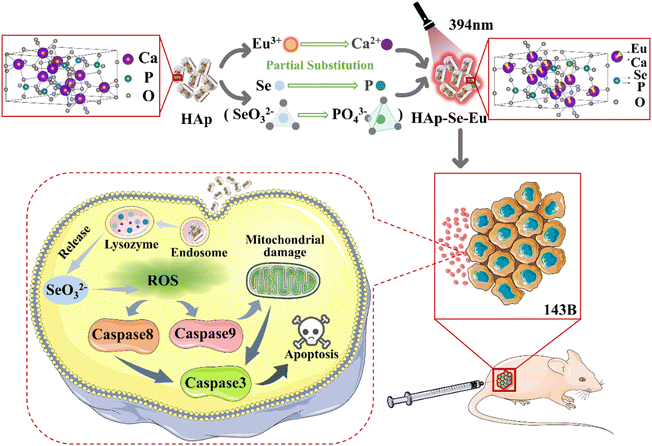
This investigation is focused on Se/Eu-doped HAp(HAp–Se/Eu), and the elemental doping content was gradient adjusted to find the ideal doping content by analyzing the conformational relationships between the material's compositional structure, physicochemical properties, and biological characteristics. Subsequently Se and Eu were doped into HAp with an optimal doping content to obtain HAp–Se–Eu, and the changes in the material's microstructure, physicochemical properties, and biological properties, as well as the molecular mechanisms underlying in vivo and in vitro imaging and the induction of death in osteosarcoma cells, were investigated, as shown in Fig. 1. This research may offer fresh ideas and materials for the postoperative treatment of osteosarcoma in clinical settings and for in vivo imaging of organisms.
Results and discussion
Mono-element doped hydroxyapatite (HAp–Se/Eu)
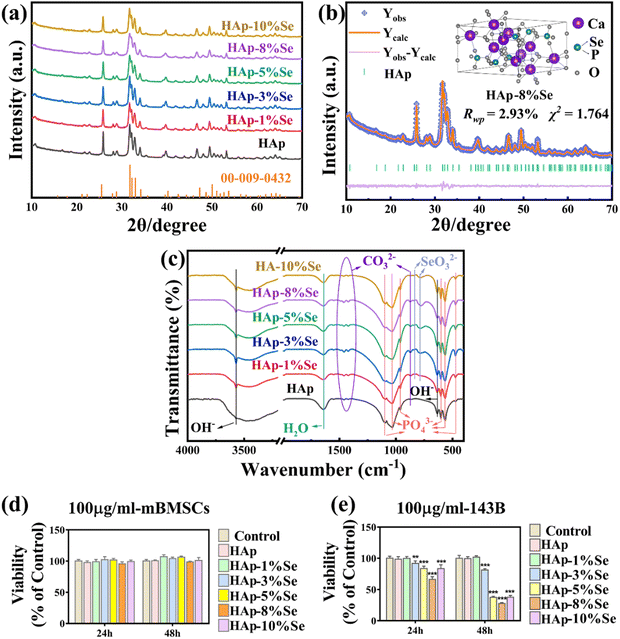
The effects of a single element doping on the phase, functional groups, and morphology of HAp were assessed through the one-step hydrothermal synthesis of HAp–Se and HAp–Eu materials with gradient doping concentration. Additionally, the effects of various selenium doping amounts on cytotoxicity and the effects of various europium doping amounts on the fluorescent properties were tested.The FTIR spectra of the HAp–Se (0%, 1%, 3%, 5%, 8%, and 10%) samples are shown in Fig. 2(c). Functional group analysis of the spectra reveals that 3570 cm−1 and the broad peaks at 3470 cm−1, and 637 cm−1 are the absorption peaks of the stretching and bending vibrations of OH−, respectively. The intensity of the OH− stretching vibration peak is weakened after doping. As some of the PO43− was replaced with CO32− during the synthesis process, the absorption peaks at 1460 cm−1, 1422 cm−1, and 873 cm−1 are related to CO32−.28 Additionally, it is claimed that the absorption peak at 873 cm−1 belongs to HPO42−,28 which may be formed by the hydrolysis of PO43−. The peaks at 1098 cm−1, 1034 cm−1 and 960 cm−1 are ascribed to the P–O stretching vibrations, and those at 602 cm−1, 564 cm−1 and 471 cm−1 are ascribed to the O–P–O bending vibrations, which are the characteristic absorption peaks of PO43−. The peaks at 837 cm−1 and 776 cm−1 are ascribed to the Se–O stretching vibrations and O–Se–O bending vibrations, respectively, which are the typical absorption peaks of SeO32−.15 These findings show that SeO32− was successfully incorporated into the HAp lattice, with no significant differences in the main functional groups of HAp before and after doping, and that Se doping has no appreciable effect on the HAp primary crystal structure.
Fig. 2(d) demonstrates that when mouse bone marrow mesenchymal stem cells (mBMSCs) were co-cultured with HAp–Se (0%, 1%, 3%, 5%, 8%, and 10%) samples for 24 and 48 hours, respectively, cell survival rates were above 90% and the materials met the criteria for biocompatibility. Fig. 2(e) shows that when the samples were co-cultured with 143B osteosarcoma cells for 24 and 48 hours, the cell activity of the group with higher Se doping was significantly lower than that of the undoped samples, suggesting that Se doped samples inhibited tumor cell proliferation, with HAp–8%Se having the most obvious effect with an inhibition rate of about 80%. Therefore, HAp–8%Se was utilized in the succeeding experiments.
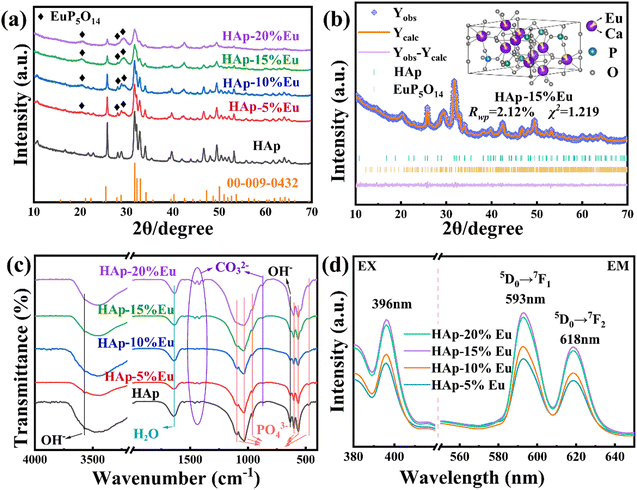
The FTIR spectra of HAp–Eu (0%, 5%, 10%, 15%, and 20%) samples are shown in Fig. 3(c). The functional groups of HAp–Eu were found to be consistent with the undoped HAp by detection and analysis. However, as Eu doping increases, the intensity of the OH− and PO43− parts of the peak fluctuates in a sawtooth pattern. This fluctuation trend is similar to the results of atomic occupation obtained by Rietveld refinement, which indicates that the HAp–Eu structure is still that of HAp but that the content of OH− and PO43− has changed. And the reason for the change is the combined effect of charge compensation and the second phase.
The photoluminescence (PL) excitation and emission spectra of HAp–Eu (5%, 10%, 15%, and 20%) samples are shown in Fig. 3(d). With the excitation at 396 nm, the emission spectra display the strongest peak at 593 nm and a smaller peak at 618 nm, corresponding to the 5D0 → 7F1 and 5D0 → 7F2 transitions,29 respectively. With the emission at 593 nm, the excitation peak is shown at 396 nm, which is caused by the direct excitation of the Eu3+ ground state into higher levels (7F0 → 5L6).29 As observed in the excitation and emission spectra, the peak intensity reached the maximum when Eu doping content was 15%, and the physical picture of the sample also proved that HAp–15%Eu presents the highest fluorescence intensity among all samples, indicating that the optimal doping concentration of HAp–Eu was 15%. If the Eu doping content continues to increase, its fluorescence intensity will decrease due to concentration quenching. Therefore, HAp–15%Eu was utilized in the succeeding experiments.
HAp–Se–Eu
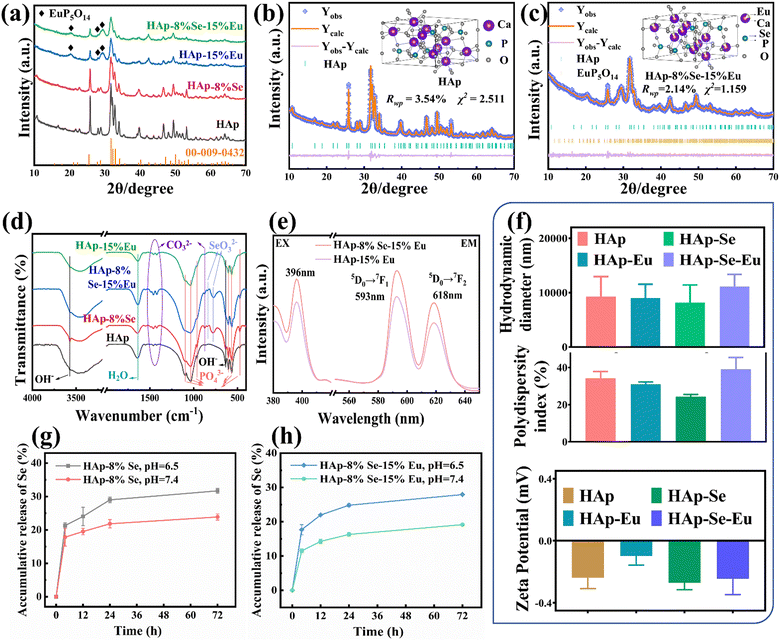
The XRD patterns of HAp, HAp–8%Se, HAp–15%Eu, and HAp–8%Se–15%Eu are displayed in Fig. 4(a). The majority of the diffraction peaks in the HAp–8%Se–15%Eu sample points to the standard HAp card (JCPDS: 00-009-0432). However, the intensity of the HAp typical peaks decreases, and the diffraction peak at 42.0° is enhanced and shifted to the right at 42.4°, and the characteristic peaks appear at 20.2°, 28.2° and 29.3° pointing to EuP5O14 (JCPDS: 01-070-5342), like the HAp–15%Eu sample. It is demonstrated that the main crystal structure of the sample after Se and Eu co-doping still belongs to HAp, but the crystallinity of the sample diminishes as a result of the introduction of the heterogeneous phase EuP5O14 by the addition of Eu.Using GSAS software, Rietveld refinement was performed on the HAp–8%Se–15%Eu sample with Se replacing P and Eu replacing Ca as the initial parameters, HAp as the first phase and EuP5O14 as the second phase. Tables 1 and 2 display the refinement's reliability parameters, cell parameters, atomic coordinates, and occupancy results. Fig. 4(b) and (c) display the refinement outcomes and crystal structure visualization of the HAp and HAp–8%Se–15%Eu. The findings of the refinement are highly reliable, as indicated by Rwp < 5% and χ2 < 3%. Combining Tables 1 and 2, it is found that both Se and Eu can be successfully doped. Single doping of Se results in an increase in the lattice constant a and a modest drop in the lattice constant c, whereas single doping of Eu results in a decrease in lattice constant a and an increase in lattice constant c, which both lead to the increase in lattice expansion and crystal density. However, under the same conditions, the lattice constants a and c, and cell volume of HAp–8%Se–15%Eu decreases, while the cell density increases, and the proportion of Se and Eu atoms increases. This is highly probable because Se and Eu cause the lattice constants c and a respectively to decrease when doped with two elements, resulting in a decrease in cell volume and an increase in density.28 Furthermore, because Se and Eu enter the HAp lattice as anions and cations, partial replacement of Ca2+ by Eu3+ as a nucleation site promotes SeO32− doping into the lattice out of charge compensation, increasing the atomic occupancy of Se.30
| Sample | R wp (%) | R p (%) | χ 2 | Lattice parameters: a & b (Å) | Lattice parameters: c (Å) | Volume of cell (Å3) | Density (g cm−3) |
|---|---|---|---|---|---|---|---|
| HAp | 3.540 | 2.580 | 2.511 | 9.427 | 6.877 | 529.339 | 3.139 |
| HAp–8%Se | 2.930 | 2.250 | 1.764 | 9.436 | 6.877 | 530.302 | 3.225 |
| HAp–15%Eu | 2.120 | 1.660 | 1.219 | 9.426 | 6.882 | 529.515 | 3.661 |
| HAp–8%Se–15%Eu | 2.140 | 1.690 | 1.159 | 9.426 | 6.872 | 528.771 | 3.832 |
| Sample | Atomic parameters | Atom type | ||||||||
|---|---|---|---|---|---|---|---|---|---|---|
| Ca I | Ca II | Eu I | Eu II | P | Se | O I | O II | O III | ||
| HAp | x | 0.333 | 0.247 | — | — | 0.401 | — | 0.326 | 0.582 | 0.340 |
| y | 0.667 | 0.990 | — | — | 0.371 | — | 0.481 | 0.463 | 0.255 | |
| z | 0.002 | 0.250 | — | — | 0.250 | — | 0.250 | 0.250 | 0.074 | |
| Occupancy | 1.023 | 1.036 | — | — | 0.961 | — | 0.992 | 0.960 | 0.969 | |
| HAp–8%Se | x | 0.333 | 0.248 | — | — | 0.401 | 0.401 | 0.327 | 0.582 | 0.339 |
| y | 0.667 | 0.990 | — | — | 0.372 | 0.372 | 0.483 | 0.463 | 0.256 | |
| z | 0.002 | 0.250 | — | — | 0.250 | 0.250 | 0.250 | 0.250 | 0.074 | |
| Occupancy | 0.988 | 1.000 | — | — | 0.957 | 0.043 | 1.080 | 0.983 | 0.996 | |
| HAp–15%Eu | x | 0.333 | 0.243 | 0.333 | 0.243 | 0.402 | — | 0.333 | 0.565 | 0.320 |
| y | 0.667 | 0.975 | 0.667 | 0.975 | 0.375 | — | 0.464 | 0.428 | 0.250 | |
| z | 0.011 | 0.250 | 0.011 | 0.250 | 0.250 | — | 0.250 | 0.250 | 0.057 | |
| Occupancy | 0.907 | 0.854 | 0.093 | 0.146 | 0.939 | — | 1.008 | 1.187 | 0.901 | |
| HAp–8%Se–15%Eu | x | 0.333 | 0.255 | 0.333 | 0.255 | 0.389 | 0.389 | 0.342 | 0.629 | 0.300 |
| y | 0.667 | 0.990 | 0.667 | 0.990 | 0.393 | 0.393 | 0.595 | 0.475 | 0.249 | |
| z | 0.007 | 0.250 | 0.007 | 0.250 | 0.250 | 0.250 | 0.250 | 0.250 | 0.032 | |
| Occupancy | 0.867 | 0.849 | 0.133 | 0.151 | 0.929 | 0.071 | 0.909 | 1.140 | 1.135 | |
This inference is supported by the results shown in Table 3, which displays the Se/P and Eu/(Eu + Ca) ratios as measured by ICP and EDS, and the expected values. Due to the synthesis of calcium-deficiency HAp, the actual content of Eu in the HAp–15%Eu material is higher than expected. The actual Se content of the HAp–8%Se material is lower than expected, most likely due to the SeO32− in the solution not fully participating in the reaction. Only a portion of SeO32− was incorporated into the lattice, while the remainder remained in the solution as ions, resulting in a lower Se content. The Eu content in the HAp–8%Se–15%Eu material is slightly higher than expected, but the deviation from the Eu content of HAp–15%Eu is slowed down when compared to that of HAp–15%Eu; the Se content is slightly lower than expected, but there is a trend of increasing Se content when compared to HAp–8%Se. Because of the incorporation of Eu into the lattice in the form of Eu3+, more SeO32− in solution is involved in the reaction and incorporated into the lattice for charge compensation. The Se ion radius is greater than the P ion radius, and the Ca ion radius is greater than the Eu ion radius. To keep the lattice stable, more Ca2+ is retained in the matrix and the relative Eu content decreases.
| Sample | Expectation | ICP | EDS | |||
|---|---|---|---|---|---|---|
| Se/P | Eu/(Eu + Ca) | Se/P | Eu/(Eu + Ca) | Se/P | Eu/(Eu + Ca) | |
| HAp | 0 | 0 | 0 | 0 | 0 | 0 |
| HAp–15%Eu | 0 | 0.15 | 0 | 0.23 | 0 | 0.22 |
| HAp–8%Se | 0.08 | 0 | 0.04 | 0 | 0.05 | 0 |
| HAp–8%Se–15%Eu | 0.08 | 0.15 | 0.05 | 0.18 | 0.06 | 0.18 |
By comparing the FT-IR spectra of the samples of HAp, HAp–8%Se, HAp–15%Eu, and HAp–8%Se–15%Eu in Fig. 4(d), it was discovered that the positions of the functional groups were essentially consistent.15,28,30 Among these samples, SeO32− vibrational peaks with comparable intensities at 837 cm−1 and 776 cm−1 were found in the samples of HAp–8%Se and HAp–8%Se–15%Eu, demonstrating the successful incorporation of Se into HAp in the form of SeO32−. In HAp–15%Eu and HAp–8%Se–15%Eu samples, vibrational peaks near PO43− at 560 cm−1 were detected, presumably due to O–P–O irregular bending vibrations caused by the heterogeneous phase EuP5O14 introduced after Eu doping. In addition, the intensity of the peaks related to OH−, H2O, CO32−, and PO43− changed after Se and Eu doping, all within the normal fluctuation range. In conclusion, single-element and two-element doping only change the composition of functional groups and have minimal impact on the fundamental structure of HAp.
The PL excitation and emission spectra of the HAp–15%Eu and HAp–8%Se–15%Eu samples are displayed in Fig. 4(e). The HAp–8%Se–15% excitation spectrum had an excitation peak at 396 nm when the emission wavelength was fixed at 593 nm. Similar to the HAp–15%Eu, the emission spectra of the HAp–8%Se–15%Eu leaped at 593 nm (5D0 → 7F1) and 618 nm (5D0 → 7F2) with excitation at 396 nm.29 However, when compared to the HAp–15%Eu, the fluorescence intensity of HAp–8%Se–15%Eu increases, most likely the result of the sensitizing effect of Se doping on the fluorescence of Eu, and this fluorescence intensity could then be employed for imaging.
The hydrodynamic diameter, polydispersity index and zeta potential of HAp, HAp–8%Se, HAp–15%Eu, and HAp–8%Se–15%Eu samples are shown in Fig. 4(f). The polydispersity index <0.7 indicates a narrow particle size distribution of the material. But when combined with the zeta potential and hydrodynamic diameter measurements, the nanomaterials have poor dispersion. The Eu doping exacerbated the degree of agglomeration of the materials, most likely due to a decrease in the size of individual particles and an increase in surface energy, resulting in material instability. However, the addition of Se appears to have no impact on the materials' stability and also reduces the instability caused by Eu doping.
Fig. 4(g) and (h) depict the Se release curves from HAp–8%Se and HA–8%Se–15%Eu samples in a neutral (pH 7.4) normal environment and a weakly acidic (pH 6.5) tumor environment. The two materials showed a similar release trend, with a faster release rate before 24 h and a slower release rate after 24 h, gradually showing a relatively smooth platform. Both samples released ions faster in a weakly acidic environment than in a neutral environment, indicating that the pH of the buffer had a significant effect on the ion release rate. At 72 hours, the release rate of HA–Se, HA–Se–Eu materials in the neutral environment was approximately 20%, while it was approximately 30% in the weakly acidic environment. This could explain why the samples have a strong inhibitory effect on tumor cells while being nontoxic to normal cells.
Besides, Fig. S3 and S4 (ESI†) display the TEM morphology and SEM morphology of the HAp, HAp–8%Se, HAp–15%Eu, and HAp–8%Se–15%Eu samples. Se doping had a slight impact on the length and diameter, converting the material from thicker long rods to thinner short rods. Eu doping greatly reduced the diameter of the material, presenting needle-like morphology, and the particle size distribution was rather uneven. However, co-doping reduces the needle-like morphology and makes the size distribution more homogeneous than single Eu-doping, though material agglomeration still occurs.
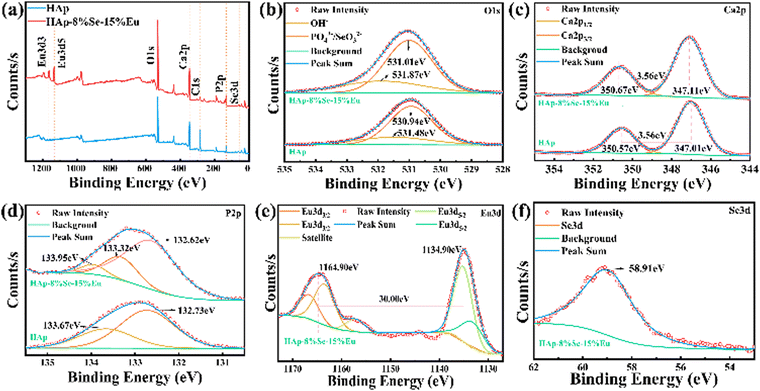
The XPS full-amplitude scans of the HAp and HAp–8%Se–15%Eu samples are shown in Fig. 5, together with the narrow-amplitude scans of typical Ca, P, O, Eu, and Se. As shown in Fig. 5(a), the typical peaks for O1s (531 eV), Ca2p (347.14 eV), P2p (133.14 eV), and C1s (284.76 eV) were found in the full-amplitude scan spectra of both samples, and the typical peaks for Eu3d and Se3d were found in the full spectrum of HAp–8%Se–15%Eu, demonstrating the successful doping of Se15 and Eu.29Fig. 5(b) shows that the O1s peak31 at 531 eV can be divided into a shorter broad peak at 531.48 eV and a higher peak at 530.94 eV in the narrow scan plot. The above two peaks are related to the O in OH− and PO43− respectively. Because of doping, the binding energy increases, as shown by the shift of the shorter broad peak at 531.48 eV to 531.87 eV and the higher peak at 530.94 eV to 531.01 eV. Besides, these two peaks have increased intensity, which are attributed to the enhancement of OH− concentration and the introduction of SeO32− by doping, respectively. The Ca2p31 narrow-amplitude scan spectrum in Fig. 5(c) includes two different spin–orbit components that pertain to Ca2p1/2 and Ca2p3/2 peaks, according to the binding energy level. The difference in binding energies between the two peaks is 3.56 eV. While there is no change in the binding energies before or after doping, there is an increase in the binding energies of Ca2p. This suggests that doping has an impact on the chemical environment of Ca rather than its chemical state. The splitting of P2p31 before doping produced two characteristic peaks, 133.67 eV and 132.73 eV, which were attributed to HPO42− and PO43−, respectively. The presence of HPO42− was confirmed by the absorption peak at 873 cm−1 of the FTIR spectrum. After doping, the chemical state and chemical environment of P were changed, and the splitting resulted in three characteristic peaks, 133.95 eV, 133.32 eV and 132.62 eV corresponding to HPO42−, EuP5O14, and PO43−, respectively. As shown in Fig. 5(e), Eu3d29,32 exhibits two main peaks at 1164.90 eV and 1134.90 eV, respectively. The energy difference between the two main peaks is 30.00 eV, showing that Eu3+ occurs in the sample. The split peaks can be broken down into four orbital peaks and one satellite peak. As shown in Fig. 5(f), Se3d15 has a n orbital characteristic peak at 58.91 eV, demonstrating that Se is tetravalent in the sample and is present as SeO32−.
In vitro biological evaluation
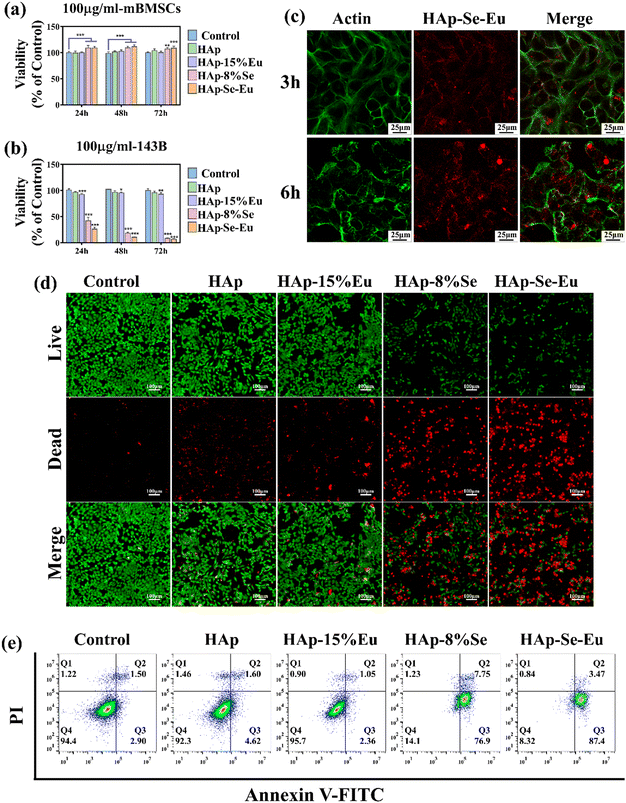
The toxicity of HAp, HAp–15%Eu, HAp–8%Se, and HAp–8%Se–15%Eu on mouse bone mesenchymal stem cells (mBMSCs) and the proliferation inhibition effect on osteosarcoma 143B cells were quantitatively and qualitatively evaluated by CCK-8 and cell live-dead staining, respectively, where the group without any treatment of cells was the control group.The outcomes of the quantitative CCK-8 toxicity experiment were as follows. Since HAp is biocompatible, HAp related materials were not considerably hazardous to normal cells, and even increased the proliferation of mBMSCs at 24 h, 48 h, and 72 h in a small way, as shown in Fig. 6(a). Fig. 6(b) proves that the HAp and HAp–15%Eu groups had little effect on 143B cells, while the HAp–8%Se and HAp–8%Se–15%Eu groups significantly reduced the cell activity of 143B and the cell survival rate decreased with time. This suggests that the HAp–8%Se and HAp–8%Se–15%Eu samples had the ability to inhibit tumor cell proliferation, with the HAp–8%Se–15%Eu having the strongest inhibitory effect, and the inhibition rates of tumor cells at 24 h, 48 h and 72 h were 73.82%, 89.43% and 93.15%, respectively.
Fig. 6(d) illustrates the qualitative assessment of the anti-tumor effect using live/dead staining, with live cells colored green and dead cells colored red. According to the results, the control group's living cells were evenly distributed and had an intact, shuttle-shaped cell morphology, whereas the live cell densities of the HAp and HAp–15%Eu groups were somewhat lower and the densities of the dead cells were slightly higher. In the HAp–8%Se and HAp–8%Se–15%Eu groups, the live cell density was much lower, the cell shape tended to be spherical, and the dead cell density was noticeably higher. In accordance with the quantitative findings of CCK-8, the results showed that HAp and HAp–15%Eu had a marginally inhibitory impact on tumor cells, whereas HAp–8%Se and HAp–8%Se–15%Eu samples considerably reduced tumor cell proliferation and had a considerable anti-tumor effect.
When nanomaterials were co-cultured with 143B cells, they successfully absorb nanoparticles through endocytosis.13Fig. 6(c) displays the pictures of tumor cell images after the HAp–8%Se–15%Eu sample treatment for 3 h and 6 h. The green portion is the cell membrane stained with Actin dye, and the red portion is HAp–8%Se–15%Eu nanoparticles with fluorescence imaging capabilities. At 3 hours, when the cell membrane boundaries are clear, a few nanoparticles move through the cell membrane into the interior of the cell. At 6 hours, the majority of nanoparticles is enriched around the cell membrane, and a few nanoparticles are still there. The aforementioned results showed that tumor cells could effectively take up HAp–8%Se–15%Eu that nanoparticle uptake increased with time, that nanoparticle therapy was harmful to tumor cell membranes as well as cell shape, and that HAp–8%Se–15%Eu's capacity to bioimage was also confirmed.
Tumor cell apoptosis was measured using flow cytometry. Because phosphatidylserine (PS) exposure to the outer cell membrane is a marker of apoptosis, it was detected by Annexin V-FITC,33 in which Annexin V-FITC positivity determined early apoptotic cells, PI positivity determined necrotic cells, both positivity determined late apoptotic cells, and both negativity determined healthy cells. Fig. 6(e) demonstrates that the percentage of healthy cells sharply decreased from 94.4% in the control group, 92.3% in the HAp group, and 95.7% in the HAp–15%Eu to 14.1% in the HAp–8%Se and 8.32% in the HAp–8%Se–15%Eu, while the percentage of apoptotic cells (early and late apoptosis) increased from 4.4% in the control group, 6.22% in the HAp, and 3.41% in the HAp–Eu to 84.65% in the HAp–Se and 90.87% in the HAp–8%Se–15%Eu. The results were in line with the CCK-8 and live/dead staining, demonstrating that Se doping did have a major negative impact on osteosarcoma cells, likely by causing PS externalization to the outer cell membrane leading to apoptosis.33
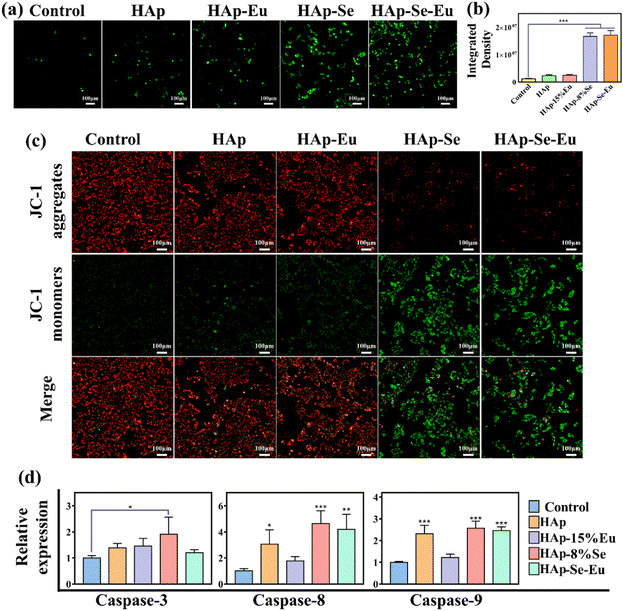
Reactive oxygen species (ROS) detection reagents were employed to confirm whether PS externalization to the outside cell membrane is connected to oxidative stress after nanomaterial treatment of cells. Fig. 7(a) and (b) demonstrate that HAp and HAp–15%Eu treated cells produced more ROS than the control group, and that the ROS generation increased by an order of magnitude following HAp–8%Se and HAp–8%Se–15%Eu treated cells, demonstrating that the nanomaterial treatment did result in oxidative stress. Oxidative stress causes mitochondrial membrane potential to fluctuate, resulting in caspase activation and ultimately apoptosis.13,33 Thus, loss of mitochondrial membrane potential is seen as an early indicator of apoptosis.33 As shown in Fig. 7(c), cells treated with HAp–8%Se and HAp–8%Se–15%Eu showed increased depolarization when compared to the control, HAp, and HAp–15%Eu groups, indicating an increase in the transfer of phosphatidylserine (PS) to the outer cell membrane and an increase in the amount of apoptotic cells.33
Caspase-3, caspase-8, and caspase-9 gene expression levels were experimentally analyzed to investigate the impact of material treatment on the expression of apoptosis-related genes. The expression of the genes for caspase-3, caspase-8, and caspase-9 was up-regulated by HAp, HAp–15%Eu, HAp–8%Se, and HAp–8%Se–15%Eu, as shown in Fig. 7(d), from which it can be observed that HAp–8%Se had the best up-regulation effect on these three genes, and HAp–8%Se–15%Eu also up-regulated caspase-8 and caspase-9 gene expression levels. It showed that HAp–Se and HAp–Se–Eu caused apoptosis through upregulating caspase-3, caspase-8 and caspase-9 gene expression. From the experimental results, two potential pathways were postulated: one involved activating caspase-3 by upregulating caspase-8 and caspase-9 genes to start an exogenous caspase-dependent apoptotic pathway and the other involved encouraging the release of cytochrome C from mitochondria after activating caspase-9 to start an endogenous apoptotic pathway.13
In vivo biological evaluation
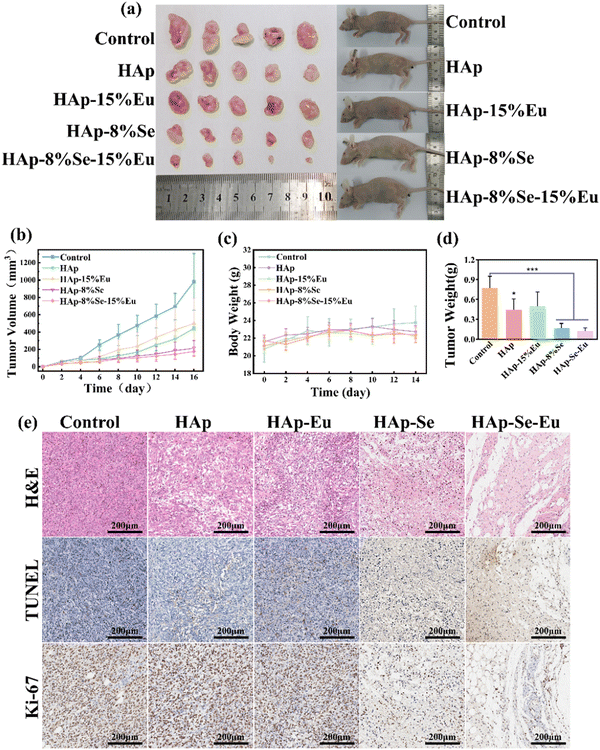
The in vivo animal experiments were taken with reference to the in vitro cell experiments for the material concentration, and the experimental results are shown in Fig. 8. Fig. 8(a), (b) and (d) show that tumors in the control group without nanomaterial treatment increased rapidly in size, and larger solid tumors were obtained when tumors were separated at 16 days. After treatment with nanomaterials, the tumor proliferation rate was somewhat inhibited. The tumor growth rate in the HAp and HAp–15%Eu groups was slower than in the control group, and the size and weight of solid tumors were smaller, but the difference was not significant. HAp–8%Se and HAp–8%Se–15%Eu groups had a more obvious tumor inhibition effect, the tumor growth curves of the two groups inclined to be flat, and the size and weight of solid tumors were significantly reduced compared with the control group, particularly the HAp–8%Se–15%Eu group, which was consistent with the results of in vitro cell experiments. Additionally, Fig. 8(c) shows that at 14 days, the body weight of the mice fluctuated within the usual range, demonstrating that the injection of nanomaterials had no appreciable impact on the physiological health of the animals.13The tumor tissues were stained with H&E, TUNEL, and Ki-67 to further demonstrate the materials' in vivo anti-tumor efficacy, as shown in Fig. 8(e). According to the H&E staining pictures, the tumor cells in the control group had normal morphology and a dense distribution, while those in the HAp and HAp–15%Eu groups had some of the cell structures destroyed and the density of the tumor cells decreased, and those in the HAp–8%Se and HAp–8%Se–15%Eu groups had completely lost their cellular morphology, exuded cellular endocytosis, and contained only a few nuclei sparsely distributed in the exudate. TUNEL staining resulted in positive apoptotic cells with brown nuclei. TUNEL-positive tumor cells were rare in the control group. Despite TUNEL-positive cells increasing in the HAp and HAp–15%Eu groups, they were still barely detectable. However, HAp–8%Se and HAp–8%Se–15%Eu showed a wide range of brown distribution, demonstrating their remarkable pro-tumor cell apoptosis capabilities. Ki-67 staining can detect tumor cell proliferation, and the brown area is positive. Most of the cells in the control, HAp, and HAp–15%Eu groups could be seen to be positive, but the percentage of positive cells in HAp and HAp–15%Eu groups was lower than that of the control group. Moreover, only a small portion of the brown area could be seen in the HAp–8%Se and HAp–8%Se–15%Eu groups, demonstrating that the tumor cells’ capacity to proliferate had been significantly reduced. In conclusion, HAp–8%Se and HAp–8%Se–15%Eu nanomaterials efficiently inhibit tumor cell proliferation and stimulate tumor cell apoptosis in vivo.
To evaluate the effects of nanomaterial treatment on the primary organs of mice, tissue slices of the heart, liver, spleen, lungs, and kidneys of mice were prepared, stained with H&E and analyzed for histomorphology.34 The results shown in Fig. S5 (ESI†) and the findings demonstrated that nanomaterials did not cause organ damage or abnormalities in mice and could be used to inhibit the growth of osteosarcoma while remaining biologically safe.
Experimental section
Chemical agents
Ca(NO3)2·4H2O was purchased from Guangzhou Chemical Regent Factory (China). (NH4)3PO4·12H2O was obtained from Sinopharm Chemical Regent Co., Ltd (China). Na2SeO3 and Eu(NO3)3 were obtained from Shanghai Macklin Biochemical Co., Ltd (China). All these chemicals are of analytical grade.Dulbecco's modified Eagle's medium (DMEM), foetal bovine serum (FBS), phosphate buffered saline (PBS), and 0.25% trypsin-EDTA were all purchased from Gibco (USA). Penicillin–streptomycin solution was purchased from Biosharp (China). Calcein-AM/PI cell viability/cytotoxicity assay kit, cell counting kit 8 (CCK-8), mitochondrial membrane potential assay kit (JC-1), reactive oxygen species assay kit, and Actin-Tracker Green-488 were purchased from Beyotime Biotechnology Co., Ltd (Shanghai, China). The Annexin V-FITC/PI apoptosis detection kit and cell cycle detection kit were purchased from Dojindo Laboratories (Japan).
Preparation of the HAp–Se/Eu nanoparticles
Ca(NO3)2·4H2O, (NH4)3PO4·12H2O, and Na2SeO3, Eu(NO3)3 were used to prepare 0.25 M, 0.15 M, 0.25 M, and 0.25 M solutions as the calcium source, phosphorus source, selenium source and europium source, respectively. The calcium sources and europium sources are combined in a ratio and stirred in a beaker. Likewise, the selenium sources and phosphorus sources are combined in a ratio and stirred in a beaker. And then using a peristaltic pump, add the latter slowly into the former at a rate of 1 mL min−1 while continuing to stir the mixture vigorously. After that, the mixed solution was transferred to a sealed polytetrafluoroethylene reactor, reacted in an oven at 150 °C for 10 hours, and then cooled to room temperature naturally. Samples were collected by centrifugation, washed three times with deionized water and absolute ethanol, and then placed in an oven at 50 °C for 24 h and ground with a mortar to obtain HAp–Se/Eu.The ingredients required for samples preparation are shown in Table 4.
| Sample | Ca(NO3)2 (mol) | (NH4)3PO4 (mol) | Na2SeO3 (mol) | Eu(NO3)3 (mol) | Se/P | Eu/(Eu + Ca) |
|---|---|---|---|---|---|---|
| HAp | 0.00625 | 0.00375 | — | — | 0 | — |
| HAp–1%Se | 0.00625 | 0.0037125 | 0.00003725 | — | 0.01 | — |
| HAp–3%Se | 0.00625 | 0.0036408 | 0.000109 | — | 0.03 | — |
| HAp–5%Se | 0.00625 | 0.0035715 | 0.0001785 | — | 0.05 | — |
| HAp–8%Se | 0.00625 | 0.0034722 | 0.000275 | — | 0.08 | — |
| HAp–10%Se | 0.00625 | 0.00340905 | 0.000341 | — | 0.10 | — |
| HAp–5%Eu | 0.0059375 | 0.00375 | — | 0.0003125 | — | 0.05 |
| HAp–10%Eu | 0.005625 | 0.00375 | — | 0.000625 | — | 0.1 |
| HAp–15%Eu | 0.0053125 | 0.00375 | — | 0.0009375 | — | 0.15 |
| HAp–20%Eu | 0.005 | 0.00375 | — | 0.00125 | — | 0.2 |
| HAp–8%Se–15%Eu | 0.0053125 | 0.0034722 | 0.000275 | 0.0009375 | 0.08 | 0.15 |
Characterization of HAp–Se/Eu nanoparticles
X-Ray diffraction (XRD, Empyrean, Nederland) was used to qualitatively analyze the phases of different samples. The diffraction patterns were collected in the 2θ range 10°–70°, with a step of 0.02° and a scanning rate of 4° min−1. X-Ray photoelectron spectroscopy (XPS, Escalab Xi +, USA) was used to analyze the valence states of the elements on the sample surface and the analyzed elements include Ca, P, C, O, Se, and Eu. The functional groups present in the samples were identified by Fourier transform infrared spectroscopy (FT-IR, Nicolet iS50, USA) within the wavenumber range of 400–4000 cm−1. A transmission electron microscope (TEM, JEM 1400 Plus, Japan) and a scanning electron microscope (SEM, Merlin, Germany) were used to observe the micromorphology of the samples. A fluorescence spectrophotometer (F-7000, Japan) was used to observe the luminous intensity of the samples, the excitation spectrum range was set to 380–420 nm, and the emission spectrum range was set to 550–650 nm. To assess the stability of the samples in solution, the nanoparticle size and a zeta potential analyzer (Litesizer 500, Austria) were used. To detect the ion release from the samples, the samples were suspended in 40 mL of HEPES buffer (10 mM, 0.9% NaCl) at pH 6.5 and pH 7.4 at 1 mg mL−1 and shaken at 120 rpm for 4 h, 12 h, 24 h, and 72 h on a 37 °C shaker to obtain 8 mL of liquid samples, followed by replenishment of the same volume of buffer. The ion concentration of the extracted solutions was determined using an inductively coupled plasma optical emission spectrometer (ICP-OES, Optima 8300, USA). This instrument was also used to determine the content of each element in the matrix of samples.Biological assessment in vitro
Meanwhile, live/dead cells were stained with Calcein-AM/PI cell viability/cytotoxicity assay kit to detect cell viability. mBMSCs and 143B cells were seeded in a 48-well plates at a density of 1.5 × 10⁴ cells per well and cultured for 24 h. Then HAp, HAp–Se, HAp–Eu and HAp–Se–Eu (100 μg mL−1) were added to each well and incubated for 2 days. Add the live and dead dye prepared according to the instructions, and incubate in the dark for 20 minutes, observe and obtain the fluorescent staining image with an inverted fluorescence microscope (Axio Observer.7, Germany). Live cells were observed at 494 nm wavelength, and dead cells were observed at 535 nm.
Biological evaluation in vivo
Conclusions and outlook
Se/Eu mono-element doped (HAp–Se and HAp–Eu) and two-element co-doped (HAp–Se–Eu) hydroxyapatite were successfully prepared. Se was incorporated into HAp as SeO32− partially replacing PO43−, which gave HAp excellent anti-tumor properties with no significant effect on the physical phase or structural dimensions, with Se doping content at 8% endowing it with the best anti-tumor properties. Eu was doped into HAp in the form of Eu3+ partially replacing Ca2+, endowing it with hydroxyapatite fluorescence imaging properties, which shows red light with 396 nm excitation, and the highest fluorescence intensity at 15% Eu doping, but its doping had a large impact on the material phase and size, producing a new phase EuP5O14 and the nanoparticles changed from a rod-like to needle-like morphology.HAp–Se–Eu was synthesized with reference to the optimal doping content of single element doping, and then the nanomaterials were obtained with enhanced anti-osteosarcoma and fluorescence imaging properties. Doping with Se brings the material's Eu3+ content closer to the peak of its fluorescence intensity. As a result, HAp–8%Se–15%Eu has a slightly higher fluorescence intensity than HAp–15%Eu. The enhanced antitumor properties of HAp–8%Se–15%Eu may be partially attributed to the structural and dimensional changes brought about by Eu doping, such as the formation of new phases that causes HAp structural instability, causing more Se to dissolve in solution as ions, or the needle-like nanomaterials that are more toxic to tumor cells, leading to better antitumor performance of HAp–8%Se–15%Eu than HAp–8%Se.
Similar results were obtained from in vitro cellular evaluation and in vivo animal experiments. The nanomaterials were not significantly toxic to healthy cells and mouse tissues, but the Se-containing samples (HAp–Se and HAp–Se–Eu) significantly inhibited tumor growth with an inhibition rate as high as 93.15%. Furthermore, HAp–Se–Eu has bioimaging capabilities, and images with increasing time show the uptake of nanomaterials from extracellular aggregates into the cell. The anti-tumor mechanism of the Se-containing samples was further investigated. SeO32− was released after the material was taken up by cells, causing cellular oxidative stress, stimulating the change of mitochondrial membrane potential, activating caspase, and promoting apoptosis. Finally, phosphatidylserine was externalized in the cell membrane and cellular endocytosis was exocytosed, indicating the apoptosis of tumor cells.
As a result of this study, HAp–Se–Eu nanomaterials with exceptional anti-tumor and bioimaging characteristics have been produced. The anti-tumour properties of the nanomaterials and its osteogenic potential are expected to be used in the post-operative treatment of osteosarcoma resection, and its imaging capabilities can assist in tracing the metabolic pathways of nanomaterials both in vivo and ex vivo. It will eventually solve the clinical problems of tumor recurrence or bone defects after osteosarcoma surgery, as well as fill the gap in the study of antitumor nanomaterials' in vivo metabolic pathways.
Author contributions
Zhou SS and Ren J contributed equally to the materials’ design, preparation, characterisation, and biological evaluation. Wang LZ assisted with data analysis. Liu LT contributed ideas to this study. Deng CL assisted in revising the manuscript. All authors contributed to the general discussion.Conflicts of interest
There are no conflicts to declare.Acknowledgements
This work was financially supported by the National Natural Science Foundation of China (Grant No. 51972120 and No. 51772105) and the Natural Science Foundation of Guangdong Province (Grant No. 2023A1515012952). The authors sincerely thank their colleagues at the National Engineering Research Center for Tissue Restoration and Reconstruction for their help and support.References
- A. Luetke, P. A. Meyers, I. Lewis and H. Juergens, Osteosarcoma treatment – Where do we stand? A state of the art review, Cancer Treat. Rev., 2014, 40(4), 523–532 CrossRef PubMed.
- P. A. Meyers, J. H. Healey and A. J. Chou, et al., Addition of pamidronate to chemotherapy for the treatment of osteosarcoma, Cancer, 2011, 117(8), 1736–1744 CrossRef CAS PubMed.
- R. Belayneh, M. S. Fourman, S. Bhogal and K. R. Weiss, Update on Osteosarcoma, Curr. Oncol. Rep., 2021, 23(6), 71 CrossRef PubMed.
- J. M. Rensberger and M. Watabe, Fine structure of bone in dinosaurs, birds and mammals, Nature, 2000, 406(6796), 619–622 CrossRef CAS PubMed.
- R. M. Kavasi, C. C. Coelho, V. Platania, P. A. Quadros and M. Chatzinikolaidou, In vitro biocompatibility assessment of nano-hydroxyapatite, Nanomaterials, 2021, 11(5), 1152 CrossRef CAS PubMed.
- U. Ripamonti, Osteoinduction in porous hydroxyapatite implanted in heterotopic sites of different animal models, Biomaterials, 1996, 17(1), 31–35 CrossRef CAS PubMed.
- V. Uskoković, Ion-doped hydroxyapatite: An impasse or the road to follow?, Ceram. Int., 2020, 46(8), 11443–11465 CrossRef.
- Y. H. Wang, J. Ma and L. Zhou, et al., Dual functional selenium-substituted hydroxyapatite, Interface Focus, 2012, 2, 378–386 CrossRef PubMed.
- V. Uskoković, M. A. Iyer and V. M. Wu, One ion to rule them all: the combined antibacterial, osteoinductive and anticancer properties of selenite-incorporated hydroxyapatite, J. Mater. Chem. B, 2017, 5(7), 1430–1445 RSC.
- V. M. Wu, M. K. Ahmed, M. S. Mostafa and V. Uskoković, Empirical and theoretical insights into the structural effects of selenite doping in hydroxyapatite and the ensuing inhibition of osteoclasts, Mater. Sci. Eng., C, 2020, 117, 111257 CrossRef CAS PubMed.
- M. P. Rayman, Selenium and human health, Lancet, 2012, 379(9822), 1256–1268 CrossRef CAS PubMed.
- L. Letavayova, V. Vlckova and J. Brozmanova, Selenium: from cancer prevention to DNA damage, Toxicology, 2006, 227(1–2), 1–14 CrossRef CAS PubMed.
- Y. F. Wang, J. L. Wang and H. Hao, et al., In Vitro and in Vivo Mechanism of Bone Tumor Inhibition by Selenium-Doped Bone Mineral Nanoparticle, ACS Nano, 2016, 10(11), 9927–9937 CrossRef CAS PubMed.
- H. Kim, K. H. Lee and J. M. Kim, et al., Selenoprotein W ensures physiological bone remodeling by preventing hyperactivity of osteoclasts, Nat. Commun., 2021, 12, 2258 CrossRef CAS PubMed.
- L. X. Wei, D. W. Pang, L. Y. He and C. L. Deng, Crystal structure analysis of selenium-doped hydroxyapatite samples and their thermal stability, Ceram. Int., 2017, 43(18), 16141–16148 CrossRef CAS.
- A. Barbanente, B. Palazzo and L. D. Esposti, et al., Selenium-doped hydroxyapatite nanoparticles for potential application in bone tumor therapy, J. Inorg. Biochem., 2021, 215, 111334 CrossRef CAS PubMed.
- W. D. Zhang, Y. M. Chai, N. N. Cao and Y. L. Wang, Synthesis and characterization of selenium substituted hydroxyapatite via a hydrothermal procedure, Mater. Lett., 2014, 134, 123–125 CrossRef CAS.
- B. Wang, X. He, Z. Y. Zhang, Y. L. Zhao and W. Y. Feng, Metabolism of Nanomaterials in Vivo: Blood Circulation and Organ Clearance, Acc. Chem. Res., 2013, 46(3), 761–769 CrossRef CAS PubMed.
- B. R. Smith and S. S. Gambhir, Nanomaterials for In Vivo Imaging, Chem. Rev., 2017, 117(3), 901–986 CrossRef CAS PubMed.
- R. Weissleder and M. J. Pittet, Imaging in the era of molecular oncology, Nature, 2008, 452, 580–589 CrossRef CAS PubMed.
- H. Dong, S. R. Du and X. Y. Zheng, et al., Lanthanide Nanoparticles: From Design toward Bioimaging and Therapy, Chem. Rev., 2015, 115(19), 10725–10815 CrossRef CAS PubMed.
- D. J. Naczynski, M. C. Tan and M. Zevon, et al., Rare-earth-doped biological composites as in vivo shortwave infrared reporters, Nat. Commun., 2013, 4, 2199 CrossRef CAS PubMed.
- R. J. Wiglusz, A. Bednarkiewicz, A. Lukowiak and W. Strek, Synthesis and Optical Properties of Eu3+ Ion Doped Nanocrystalline Hydroxyapatites, Spectrosc. Lett., 2010, 43(5), 333–342 CrossRef CAS.
- P. P. Yang, Z. W. Quan and C. X. Li, et al., Bioactive, luminescent and mesoporous europium-doped hydroxyapatite as a drug carrier, Biomaterials, 2008, 29, 4341–4347 CrossRef CAS PubMed.
- S. L. Iconaru, M. Motelica-Heino and D. Predoi, Study on Europium-Doped Hydroxyapatite Nanoparticles by Fourier Transform Infrared Spectroscopy and Their Antimicrobial Properties, J. Spectrosc., 2013, 284285 Search PubMed.
- Q. Chang, W. Xu and Q. Q. Chen, et al., One step synthesis of N-doped carbon dots/hydroxyapatite: Eu, Gd composite with dual-emissive and solid-state photoluminescence, Appl. Surf. Sci., 2020, 508, 144862 CrossRef CAS.
- K. Szyszka, S. Targonska, M. Gazinska, K. Szustakiewicz and R. J. Wiglusz, The comprehensive approach to preparation and investigation of the Eu3+ doped hydroxyapatite/poly(L-lactide) nanocomposites: Promising materials for theranostics application, Nanomaterials, 2019, 9(8), 1146 CrossRef CAS PubMed.
- H. L. Luo, J. Xie and L. L. Xiong, et al., Engineering photoluminescent and magnetic lamellar hydroxyapatite by facile one-step Se/Gd dual-doping, J. Mater. Chem. B, 2018, 6, 3515–3521 RSC.
- S. P. Huang, J. Zhu and K. C. Zhou, Effects of Eu3+ ions on the morphology and luminescence properties of hydroxyapatite nanoparticles synthesized by one-step hydrothermal method, Mater. Res. Bull., 2012, 47(1), 24–28 CrossRef CAS.
- L. X. Wei, H. F. Yang, J. D. Hong, Z. H. He and C. L. Deng, Synthesis and structure properties of Se and Sr co-doped hydroxyapatite and their biocompatibility, J. Mater. Sci., 2019, 54(3), 2514–2525 CrossRef CAS.
- J. G. Acheson, L. Robinson and S. McKillop, et al., TOFSIMS and XPS characterisation of strontium in amorphous calcium phosphate sputter deposited coatings, Mater. Charact., 2021, 171, 110739 CrossRef CAS.
- E. H. H. Hasabeldaim, O. M. Ntwaeaborwa, R. E. Kroon, E. Coetsee-Hugo and H. C. Swart, Pulsed laser deposition of a ZnO:Eu3+ thin film: Study of the luminescence and surface state under electron beam irradiation, Appl. Surf. Sci., 2020, 502(1), 144281 CrossRef CAS.
- M. Kumari, S. Kamat and C. Jayabaskaran, Usnic acid induced changes in biomolecules and their association with apoptosis in squamous carcinoma (A-431) cells: A flow cytometry, FTIR and DLS spectroscopic study, Spectrochim. Acta, Part A, 2022, 274(5), 121098 CrossRef CAS PubMed.
- A. H. Fischer, K. A. Jacobson, J. Rose and R. Zeller, Hematoxylin and Eosin Staining of Tissue and Cell Sections, Cold spring harbor protoc., 2008, 5, 4986 CrossRef PubMed.
Footnotes |
| † Electronic supplementary information (ESI) available. See DOI: https://doi.org/10.1039/d3ma00046j |
| ‡ These authors contributed equally to this study and should be considered co-first authors. |
| This journal is © The Royal Society of Chemistry 2023 |

