
 Open Access Article
 This Open Access Article is licensed under a
 Creative Commons Attribution 3.0 Unported Licence
Macro bead formation based on polyelectrolyte complexation between long-chain polyphosphates and chitosan†
Sajjad
Fanaee
a and
Mark Joseph
Filiaggi
 *ab
*ab
aSchool of Biomedical Engineering, Dalhousie University, Halifax, Nova Scotia B3H 3J5, Canada. E-mail: filiaggi@dal.ca
bDepartment of Applied Oral Sciences, Faculty of Dentistry, Dalhousie University, 5981 University Avenue, Halifax, Nova Scotia B3H 3J5, Canada
First published on 8th March 2023
Abstract
Short chain polyphosphates (PP), mostly tripolyphosphates, have been extensively used in the literature for ionic gelation of polycations or simple cations. However, the literature around the use of longer chain polyphosphates is sparse. These longer chain PPs are of particular interest in biomedical applications as they are present in the human body, playing different roles including facilitating blood coagulation and bone formation. Here, we developed macro beads comprising longer PPs with a degree of polymerization of 22 utilizing a polyelectrolyte complexation reaction with chitosan (CS). A concentration of 15 mg mL−1 was selected for both PP and CS solutions to produce the beads. To improve the diffusion of PPs into CS droplets and promote the complexation reaction in the beads, solution exchange following bead formation, injection size, sonication, and temperature were considered, though none improved the complexation of the beads significantly. However, addition of NaCl to the PP solution caused a significant change in the appearance of the beads and increased the P content of the beads from approximately 2.5 wt% to 18 wt%. ATR-FTIR showed that this increase was accompanied by the consumption of the protonated amine groups. Thermal analysis confirmed the interaction between the components through a notable shift in the exotermic peak of CS dissociation toward lower temperatures. Finally, the impact of curing time (5 min–24 h) on complexation within the beads was demonstrated using ICP, FTIR, and by visual observation. This work is one of the few studies recruiting moderately long chain PPs in a polyelectrolyte complexation strategy for bead formation and elucidates the significant factors affecting this interaction.
Introduction
Polyelectrolyte complexation is the process of phase separation upon mixing two oppositely charged polyelectrolytes. The newly formed polymer-rich phase is generally referred to as a “Polyelectrolyte Complex” (PEC), and in the case where this phase shows liquid-like properties, it can also be referred to as a “Coacervate”; the other polymer-poor phase is the supernatant. In some studies, complexation has been considered a physical crosslinking technique that offers improved compatibility and lower toxicity than chemical crosslinking.1–3In general, a polycation and a polyanion are needed to initiate complexation and form a PEC.4 Chitosan (CS) can act as a positive polymer (Polycation) under acidic conditions and undergo complexation with negatively charged species.4,5 A polysaccharide prepared by deacetylation of Chitin,6,7 CS is widely used in biomedical devices8,9 since it offers a range of beneficial properties including biodegradability,10 hemostasis,11,12 as well as antibacterial13,14 and even osteogenic15,16 properties. Structurally, CS is comprised of two different units, N-acetylglucosamine and glucosamine.17 The amine groups in deacetylated units (glucosamines) can be protonated under acidic conditions at pH values lower than 6.5, rendering CS a polycation.18
Polyphosphates (PP), on the other hand, are interesting inorganic polyanions providing negative charges when dissolved in water.19,20 PPs are made of phosphate units linked together by bridging oxygen atoms.21 PPs are regularly used as water softening agents in industry as they are able to chelate metallic ions.22 However, long chain PPs also possess relevant biological properties that can be beneficial in biomedical devices. Polyphosphates with 60–100 phosphate units in length are released by activated platelets in the body and help in blood clotting by playing different roles in the coagulation cascade.23 They also serve as energy reservoirs in the extracellular matrix and assist with hydroxyapatite deposition and bone mineralization.24,25 Our group has extensively studied the ability of PPs to chelate metal cations,19,20,26,27 but very little is known about the role PP plays as a polyelectrolyte in PECs. The focus of the literature has primarily been on Tripolyphosphates (TPP), very short PPs with a degree of polymerization (Dp) of 3. TPP (Na5P3O10) acts essentially as a simple anion and has been mainly used for ionic gelation, especially in studies seeking to develop nanoparticles for drug and protein delivery.2,28–44
In 1989, Bodmeier et al.45 used TPPs for the first time to produce macro beads of CS-TPP by dropping a CS solution containing an antibiotic into a TPP solution. Subsequently, this technique has been applied by other researchers to study the loading and release of different drugs.46–50 However, there are few studies involving complexation using longer PPs. For example, Mi et al.51,52 used PPs to make beads of CS-PP loaded with an anticancer drug for drug delivery purposes. Using the same technique of dripping the CS solution into the curing solution (PP solution), they compared the drug release properties of these beads with CS-TPP beads and concluded that CS-PP beads offered a steadier release profile in acidic conditions. They also reported an almost even distribution of P from the surface to the core for CS-TPP beads. In contrast, beads cured in PP exhibited high P at the surface, with levels sharply decreasing toward the center of the beads.51,52 Notably, no details were provided regarding the degree of polymerization of the PP used.
One of the parameters known to affect the complexation process is the presence of a monovalent salt, which can generally weaken the interaction between two oppositely charged polyelectrolytes. Theoretically, this effect is justified either by the “charge screening” or “ion-pairing” model.53 Based on the charge screening model, an atmosphere of salt ions is condensed around the oppositely charged polyelectrolytes. This leads to the screening of the charges on the polyelectrolytes such that the strength of the electrostatic reaction between polyelectrolytes is reduced. In the ion-pairing model, the monovalent ions generated by the salt are assumed to form ionic bonds with their oppositely charged polyelectrolytes. In this model, the bonds of polyelectrolyte – salt ion are considered as extrinsic ion pairs, and the polycation–polyanion bonds are considered as intrinsic ion pairs. The fraction of extrinsic bonds determines the strength and the physical properties of the final complex. As this fraction tends to 1, the strength of the interaction decreases and the two polyelectrolytes are only loosely associated.53–56
In this study, we aimed to develop macro beads based on the complexation between chitosan and PP (Dp 22). In this regard, we studied the diffusion of PP molecules into the CS droplets and the effect of temperature, sonication, beads size, salt addition, and curing time on the diffusion and promotion of the interaction between CS and PP. We report for the first time a processing approach to facilitate the use of moderately long chain PPs (Dp 22, Na24P22O67) in a controlled polyelectrolyte complexation with chitosan. This novel work provides the basis for future development of therapeutically loaded PP-CS macrobeads for biomedical applications, while informing subsequent studies to comprehensively understand the key drivers for polyphosphate deployment in polyelectrolyte complexes with relevant polycationic species such as chitosan.
Experimental
Materials and methods
Medium molecular weight CS with a deacetylation degree of 75–85% (Sigma) was used. Sodium polyphosphate with the degree of polymerization of 22 and Na/P molar ratio of 1.07 was prepared as described in our previous work.21 Briefly, a mixture of 120 g sodium phosphate monobasic monohydrate (NaH2PO4·H2O) and 3.28 g sodium carbonate (Na2CO3) was melted at 900 °C for 4 h and quenched on a clean copper plate. The prepared glass was then milled to a fine powder.Beads of (A,B + C) – where A is the concentration of CS solution (mg mL−1), B is the concentration of PP solution (mg mL−1), and C is the concentration of NaCl salt (mM) in PP solution – were produced by dripping the CS solutions of different concentrations into the PP solutions of various concentrations (with or without salt). Here, CS solutions were prepared by dissolution of the desired amounts of CS powder in 1% acetic acid overnight, while PP solutions were prepared in deionized water. For beads generated in the presence of salt, the PP solutions were prepared by dissolving 300 mM NaCl in deionized water prior to dissolving PP powder into the salt solution.
A 3 mL syringe with a 16-gauge needle connected to a piece of tubing placed at 2–3 cm from the PP solution surface was used to deliver the CS solution using an automated injection pump at a rate of 0.5 mL min−1, while 10 mL of PP solution was constantly agitating on a stirrer using a small stir bar at 100 rpm. The bead/precipitate formation was instantaneous. However, in order to provide enough reaction time, following injection of the full CS volume, the beads/precipitates were kept in the curing solutions (PP solutions with/without NaCl) for 24 h (unless otherwise noted) with no stirring, then collected and gently rinsed in 10 mL deionized water. The beads were subsequently frozen and freeze dried overnight using a Labconco® FreeZone® 2.5 Liter freezedryer.
For thermal analysis of the beads, Differential Scanning Calorimetry and Thermal Gravity Analysis (DSC/TGA) were performed using a STA 409 PC LUXX® thermal analyzer (Netzsch, Germany) under nitrogen gas. Approximately 20 mg of each sample was analyzed from 25 °C to 680 °C at the heating rate of 10 °C min−1.
ATR-FTIR (Bruker Vertex 70) with 2 cm−1 resolution was used to verify the presence of the two polyelectrolytes in the beads and semi-quantitatively analyze the extent of complexation reaction in them. The beads were crushed into powder before ATR-FTIR analysis. The spectra were plotted from the wavenumber of 2600–600 cm−1 and analyzed by Origin® 2018.
P elemental analysis of the beads was obtained using an Inductively Coupled Plasma Optical Emission Spectroscopy (ICP) (Optima™ 7300 V ICP-OES, PerkinElmer Instruments, USA). Approximately 10 mg of the beads were dissolved in a 9 mL mixture of concentrated nitric acid and hydrochloric acid with a volume ratio of 2/1. The solutions were diluted twenty-five times and refrigerated until analyzed.
All statistical analyses were performed by GraphPad Prism software using t test (multiple t test where needed), and the statistical significance was reported for p < 0.05.
Results and discussion
Determining CS and PP concentrations for reproducible formation of beads
To find the optimum concentrations of CS and PP solutions for bead formation, a matrix was designed considering different concentrations of each solution. A total of 20 samples was prepared using CS concentrations of 1, 5, 15, and 30 mg mL−1, and PP concentrations of 1, 15, 50, 150, and 500 mg mL−1. Fig. 1 shows all the prepared samples in their PP (curing) solutions. | ||
| Fig. 1 Concentration of CS (MMW) – concentration of PP matrix. (15,15) beads, in yellow frame, where selected for further studies. | ||
At low CS concentration (1 mg mL−1), no beads were formed in any of the PP solutions; however, an opaque, flocculant-like precipitate was observed at the surface. Several papers have noted the concentration of polyelectrolytes as a significant factor in polyelectrolyte complexation. For example it has been reported that an increase in concentration of polyelectrolytes causes formation of larger complex particles,36,57 an increase in the rate of particle formation,58 and produces a greater amount of complex overall.59 It has also been mentioned that at very low concentrations of polyelectrolytes, no macroscopic flocculation occurs.60
At a CS concentration of 5 mg mL−1, the formation of a white precipitate was seen with all concentrations of PP. However, at lower PP concentrations (1, 15, and 50 mg mL−1), complexation was not sufficient to maintain the spherical form of the CS droplets. At PP 150 mg mL−1 some red blood cell-like beads formed. Here, the interactions on the surface of the droplets appeared sufficient to form a complex layer on the surface. However, encapsulated unreacted CS likely diffused out, leading to the observed surface collapse and distinct red blood cell shapes. At PP 500 mg mL−1, the CS droplets were observed to burst and spread on the surface upon contacting the PP solution surface, likely the result of the high viscosity of the PP solution, leading to the formation of thin precipitate layers floating on the surface.
At higher CS concentrations more consistent bead formation was obtained except at the low PP concentration. With a PP of 15 mg mL−1, regular spherical beads formed in the solution although the beads were clear. This is interesting as the complexation is usually accompanied by transition from clear to opaque.55,61–63 A similar result was obtained at a PP concentration of 50 mg mL−1. For higher PP concentrations (150 and 500 mg mL−1) the interaction between CS and PP molecules was robust so that opaque and white complexes formed, though with no regularity in shape and size.
A similar trend was noted for the highest CS concentration 30 mg mL−1. However, the CS droplets were not spherical exiting the tubing attached to the syringe, forming a narrow tail likely due to the high viscosity of the CS solution. Note that CS concentrations higher than 30 mg mL−1 could not be obtained due to solubility limits.
Based on these observations (15,15) beads were selected for further studies, as these concentrations consistently produced uniform spherical beads. Subsequent processing optimization focused on ways to improve the diffusion of PP molecules into the beads and facilitate the CS-PP interaction for complete complexation of the beads from the core to the bead surface.
Attempts to improve the diffusion of PP molecules into the beads
For these additional processing studies, it was assumed in the first instance that opacity in the beads would be proxy evidence of interaction between CS and PP. This assumption is supported by reports from others noting a transition between transparent to opaque or low turbidity to high turbidity (in case of direct mixing of polyelectrolytes) upon polyelectrolyte complexation.61,64,65 However, our selected (15,15) beads were clear and gel-like; even when gently squeezed, they burst and a clear solution of likely unreacted CS was expelled. It was speculated here that upon contact between CS droplets and the PP solution, a surface reaction layer (complex) forms that maintains the spherical shape of the droplet and prevents loss of CS. However, this reaction layer also hinders the diffusion of PP molecules toward the droplet's center and subsequent complexation in interior of the beads (Fig. 2a and b). To qualitatively justify this assumption, (15,15) beads were produced using a TPP (Sigma) solution instead of PP with Dp of 22 (Fig. 2c). In this case, the beads were fully spherical, white, and opaque. Since the TPP molecules are small, they can quickly diffuse in and complex the beads from the surface to the core of the bead (Fig. 2d). This is not the case for (15,15) beads made with PP of Dp 22, with mobility and diffusion likely made more difficult by the larger size of these PP molecules.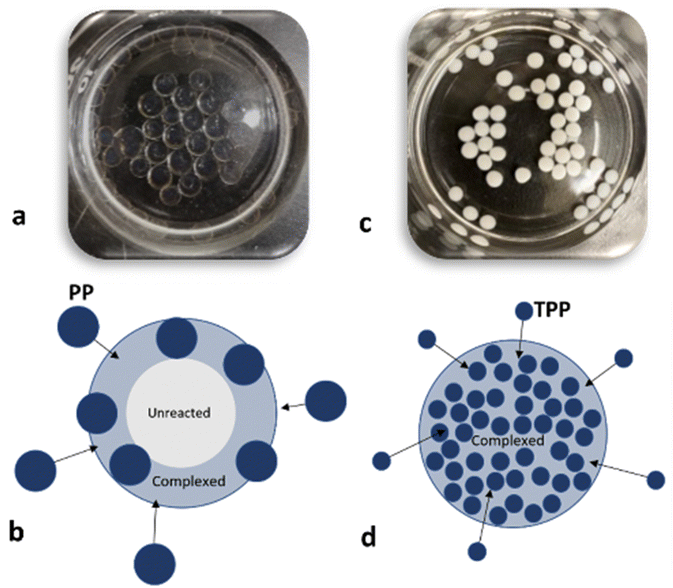 | ||
| Fig. 2 (15,15) beads (a) and the schematic illustrating the complex layer on the surface for (15,15) beads (b). (15,15TPP) beads (c) and the schematic illustrating full complexation of the beads (d). | ||
A study by Mi et al.51 verified this assumption. Here, Energy Dispersive X-Ray analysis (EDX) on cross-sections of their CS-polyphosphoric acid beads showed that the P signal was strong at the bead surface but sharply decreased towards the centre of the bead. In contrast, the P profile of their CS-TPP beads in cross-section showed significantly less variation through the beads. Mi et al. concluded that CS-polyphosphoric acid interaction depends on the diffusion of PP molecules through the complex membrane.51
To promote the diffusion of PP molecules toward the center of the beads and form complexed beads with large PPs (Dp 22), we examined the effect of curing solution exchange post bead formation, temperature, sonication, needle size, and salt addition.
Solution exchange post bead formation
To enhance the PP concentration gradient between the surface and core following (15,15) bead formation, the initial 15 mg mL−1 PP solution was replaced with higher PP concentrations (e.g., 500 mg mL−1). The results showed that the beads turned to irregular complexed beads similar to what was observed from direct injection of CS solution into high concentration PP solutions (compare Fig. 3 with Fig. 1). This experiment was also repeated for PP 150 mg mL−1, yielding the same results (data not shown). When the solution is exchanged and the beads are introduced to a highly concentrated PP solution, the difference in chemical potential of CS inside and outside of the droplets increases and the CS chains tend to exit their droplets. At the same time, the highly concentrated PP solution causes strong complexion of the surface of the CS droplets which in turn causes tension and shrinkage of the surface skin/layer. We believe that the synergistic effect of these phenomena breaks the outer complex layer locally and some of the unreacted CS solution is extruded. Thus, the final product is not fully spherical.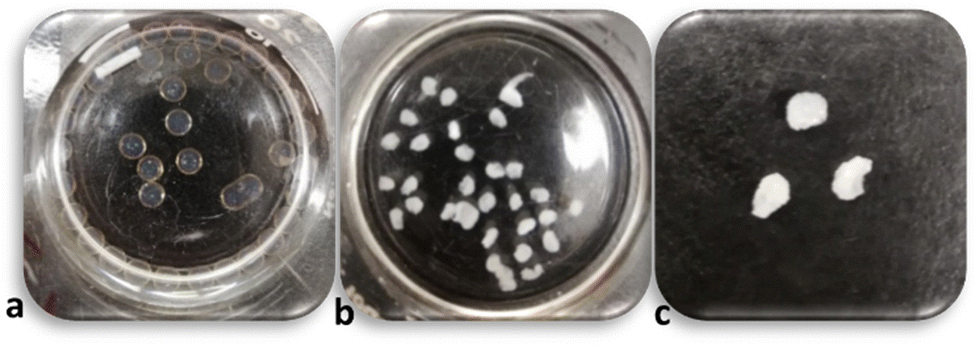 | ||
| Fig. 3 (15,15) after 15 min from formation (a), after 24 h being in PP 500 mg mL−1 (b), and after 24 h being in PP 500 mg mL−1 out of the solution (c). | ||
Needle size
In another effort to increase the flux of PP molecules toward the center of the beads, the center-surface distance (bead radius) was decreased by using a dispensing needle with a smaller inner diameter (30-gauge; 0.16 mm) rather than the 16-gauge needles (1.19 mm) deployed previously. Overall, (15,15) beads prepared using the 30-gauge needle were smaller (<1 mm vs. ∼3 mm) and notably more opaque, suggesting an improvement in the diffusion of PP molecules and more CS-PP interaction due to a higher concentration gradient (smaller radius). However, these beads were not fully spherical and had irregular shapes (Fig. 4a).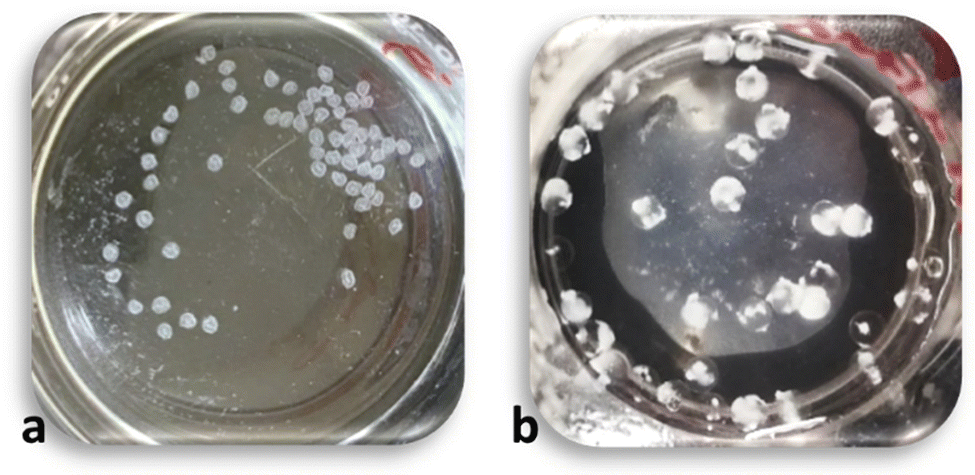 | ||
| Fig. 4 (15,15) beads prepared using a 30-gage needle (a). (15,15) beads after 1 h sonication (b). | ||
Sonication
Sonication was deployed to increase the mobility of PPs by virtue of the ultrasound energy generated. In this approach, the beaker containing the curing solution and the beads formed following CS addition was quickly moved to a sonication bath. Fig. 4b shows the beads after 1 h of sonication. Local cyclic stresses applied to the beads during sonication likely resulted in micro-tears on the surface of the beads leading to further reactions with the inner CS solution and some complex formations appearing like “blisters” on the surface. Thus, sonication was abandoned as a means of improving diffusion and preparing uniformly complexed beads.Temperature
In order to increase the mobility and enhance the diffusion of PP molecules toward the center of the beads, we increased the PP solution temperature from room temperature to 37 °C. After 24 h, the beads prepared and maintained at 37 °C were smaller in size (2 mm vs. 3 mm), less transparent, and settled at the bottom of the beaker, implying that the density had increased (Fig. 5). This settling out of beads over time was observed previously for beads formed using TPP solutions. Both beads at room temperature and 37 °C were soft and gel-like, although those prepared at 37 °C were more resistant to deformation, possibly due to the formation of a slightly thicker complexed layer on the surface. Overall, although increased temperature made a difference in the physical properties and appearance of the beads, the beads were still relatively transparent and released a clear unreacted CS solution when gently squeezed. Further characterization (P content) was not pursued given the relatively minor impact of this processing variable.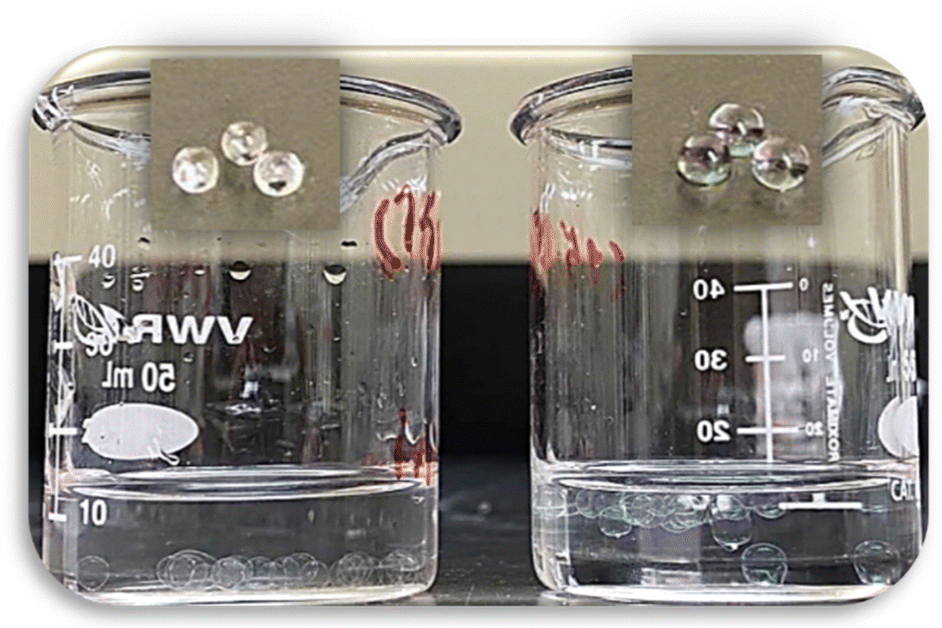 | ||
| Fig. 5 (15,15) beads prepared at 37° (left), and room temperature (right). The respective inset images show the beads outside of their solutions. | ||
Salt addition
The approaches above did not significantly improve the diffusion of PP and the complexation reaction inside the beads. A subsequent review of the PEC literature suggested that the presence of a monovalent salt in the complexation process might help to promote the CS-PP interaction.56,61,66–68 The addition of salt leads to charge screening, reduces the strength of the reaction,53–56 lowers the reaction rate,58 and helps the reaction avoid any kinetic traps and better achieve an equilibrium state.69To incorporate salt, PP solutions were prepared by first dissolving NaCl in water (300 mM) and then adding the desired amounts of PP powder. In early experiments a NaCl concentration of 150 mM (equal to the concentration of NaCl in blood serum) was attempted; however, the beads prepared with these PPs were inconsistent and not overly reproducible. For subsequent studies a higher salt concentration of 300 mM was selected. The result of salt addition is shown in Fig. 6. While (15,15) beads were clear, (15,15 + 300) beads showed a substantially more opaque and white appearance. Unlike the other approaches mentioned above, the beads maintained their regular spherical form. Further characterization of the (15,15 + 300) beads in comparison to (15,15) beads was carried out to better substantiate the appearance of more complete complexation of these beads with salt addition.
 | ||
| Fig. 6 (15,15) beads (a), and (15,15 + 300) beads (b). The inset image on (b) shows an individual bead outside of the solution. | ||
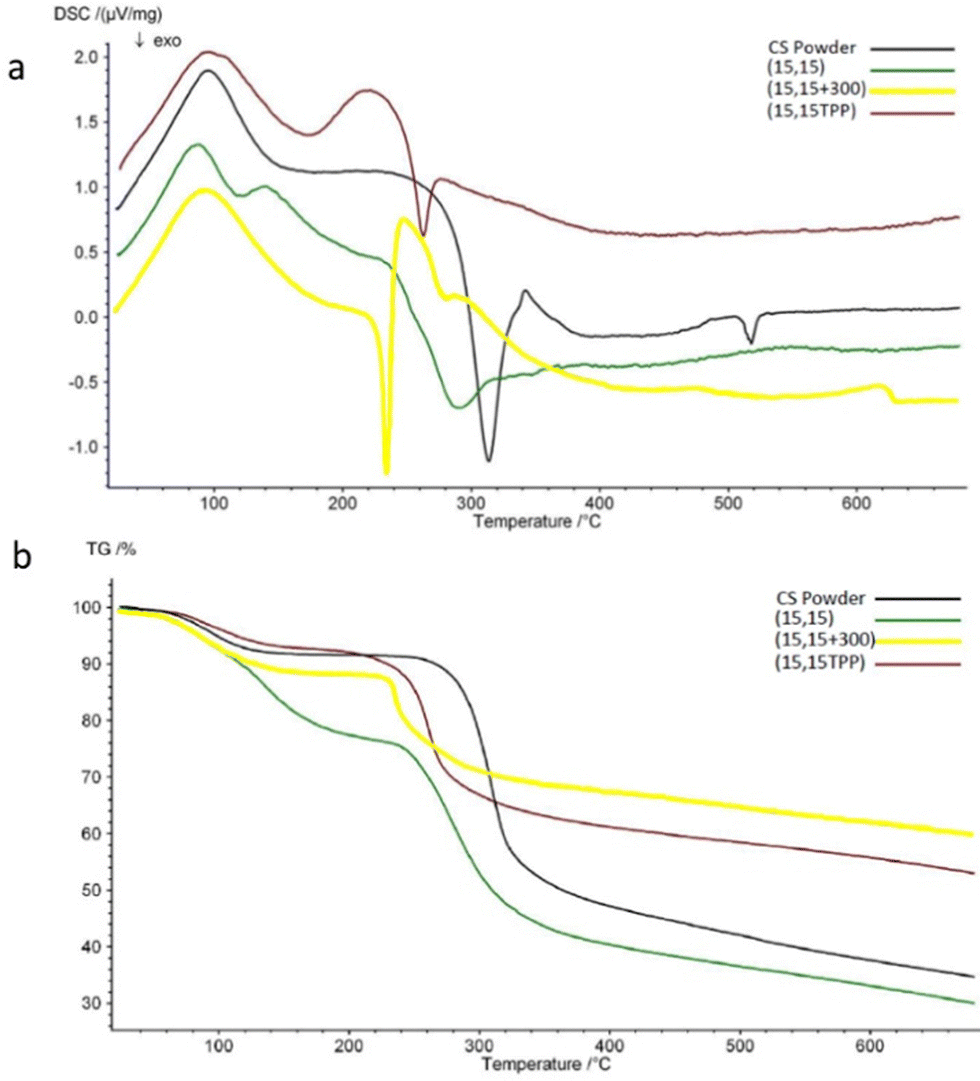
The impact of salt on CS-PP interactions was assessed using DSC/TGA, with CS powder serving as a control (Fig. 7). Key results from the DSC/TGA analysis are summarized in Table 1. All the samples showed an endothermic peak at around 100 °C, associated with a small weight decrease (3–6%) in TGA due to evaporation of residual water.70–72 An exothermic peak is seen for all the samples between 240–320 °C. This peak is related to dissociation and decomposition of CS.35,73 In comparison with CS powder, the exothermic peak of (15,15 + 300) is shifted considerably toward lower temperatures (246 °C vs. 313 °C). This phenomenon has been reported in other studies and has been interpreted as a sign of CS complexation.44,70,72,74 Beads prepared with TPP also showed a noticeable peak shift. These beads had shown a significant opacity (Fig. 2c) as one sign of complexation; here, the peak shift also verifies the relation between change in optical properties and complexation. It is worth noting that for (15,15) beads, this shift was small (11 degrees compared to the exothermic peak of CS), and these beads exhibited almost the same weight loss % as CS. This similar thermal behavior to CS suggests that the more transparent (15,15) beads are mostly unreacted CS solution. The reason behind this peak shift (decrease in thermal stability) is unknown. However, it could be due to the transition from a semi-crystalline structure for CS into an amorphous state for (15,15 + 300) complexed beads75 (Fig. S1, ESI†). The residual amount was higher for the beads prepared in the presence of salt as the portion of inorganic components – NaCl and PP – is higher in these beads.
 | ||
| Fig. 7 DSC spectra (a), and TGA diagrams (b) of different samples. | ||
| Sample | Endothermic peak (°C) | Weight loss (%) at endothermic peak | Exothermic peak (°C) | Weight loss (%) at exothermic peak | Total weight loss (%) at the highest temperature (680 °C) |
|---|---|---|---|---|---|
| CS powder | 96 | 4 | 313 | 34 | 65 |
| (15,15) | 89 | 5.5 | 292 | 40 | 70 |
| (15,15 + 300) | 88 | 3 | 246 | 16 | 40 |
| (15,15TPP) | 96 | 2.7 | 262 | 21 | 47 |
To further verify an increased level of complexation in (15,15 + 300) beads compared to clear (15,15) beads, ATR-FTIR was conducted. Fig. 8 shows the spectra of a freeze-dried CS solution (15 mg mL−1), PP powder (Dp = 22), and beads of (15,15), and (15,15 + 300) from 2600 cm−1 to 600 cm−1. Freeze-dried CS solution showed a broad absorption between 3500 and 3000 cm−1 corresponding to a stretching vibration mode of N–H (overlapped with the O–H stretching vibration mode),28,72 a peak at 2870 cm−1 assigned to C–H stretching,73 a peak at 1420 cm−1 corresponding to bending vibration of O–H,28 a peak at 1376 cm−1 related to C–CH3,76 an absorption band at 1150 cm−1 for antisymmetric stretching of the C–O–C bridge due to saccharide structure,76,77 additional absorption bands at 1060 cm−1 and 1026 cm−1 attributed to skeletal vibrations involving the C–O stretching,76,77 and a peak at 893 cm−1 due to the CS pyranose rings.77 Most importantly, protonated CS has two peaks at around 1530 cm−1 and 1630 cm−1 related to N–H bending in protonated amine groups and C![[double bond, length as m-dash]](https://www.rsc.org/images/entities/char_e001.gif) O stretching in acetyl groups, respectively.72,75–78 The absorbance ratio of these two peaks, ANH2/ACO, can be used to semi-quantitatively compare the extent of the complexation reaction in the samples. During complexation, the protonated amine groups are consumed and react with charged groups on the polyphosphates, while CO groups do not participate in the reaction. Correspondingly, as more complexation takes place, this ratio decreases.72 Here, this ratio for the freeze-dried CS sample was 2.4 ± 0.01 compared to 1.8 ± 0.3 for (15,15) beads and 1.0 ± 0.02 for (15,15 + 300) beads, respectively, indicating that the presence of salt facilitated complexation in (15,15 + 300) beads compared to the beads prepared without salt (15,15). This change in the ratio is seen in Fig. 8. For freeze-dried CS the peak at 1530 cm−1 is significantly higher than 1630 cm−1, while for (15,15) and (15,15 + 300) the difference in height of these two peaks is lower. The ratio was also calculated for (15,15TPP) beads to be 1.27 ± 0.04 (data not shown). These numbers are comparable with those reported by Silvestro et al. for their freeze-dried CS or CS-TPP scaffolds prepared after 8 hours of curing, with ANH2/ACO values of 2.02 and 0.94, respectively.72 Among the related peaks for PP, the two peaks at 865 cm−1 attributed to P–O–P stretching and 1250 cm−1 assigned to antisymmetric stretching vibration of the bridging PO2 are usually used to determine the presence of PP in the samples.79,80 These peaks are present in the spectra of the beads and verify the presence of PP (Fig. 8).
O stretching in acetyl groups, respectively.72,75–78 The absorbance ratio of these two peaks, ANH2/ACO, can be used to semi-quantitatively compare the extent of the complexation reaction in the samples. During complexation, the protonated amine groups are consumed and react with charged groups on the polyphosphates, while CO groups do not participate in the reaction. Correspondingly, as more complexation takes place, this ratio decreases.72 Here, this ratio for the freeze-dried CS sample was 2.4 ± 0.01 compared to 1.8 ± 0.3 for (15,15) beads and 1.0 ± 0.02 for (15,15 + 300) beads, respectively, indicating that the presence of salt facilitated complexation in (15,15 + 300) beads compared to the beads prepared without salt (15,15). This change in the ratio is seen in Fig. 8. For freeze-dried CS the peak at 1530 cm−1 is significantly higher than 1630 cm−1, while for (15,15) and (15,15 + 300) the difference in height of these two peaks is lower. The ratio was also calculated for (15,15TPP) beads to be 1.27 ± 0.04 (data not shown). These numbers are comparable with those reported by Silvestro et al. for their freeze-dried CS or CS-TPP scaffolds prepared after 8 hours of curing, with ANH2/ACO values of 2.02 and 0.94, respectively.72 Among the related peaks for PP, the two peaks at 865 cm−1 attributed to P–O–P stretching and 1250 cm−1 assigned to antisymmetric stretching vibration of the bridging PO2 are usually used to determine the presence of PP in the samples.79,80 These peaks are present in the spectra of the beads and verify the presence of PP (Fig. 8).
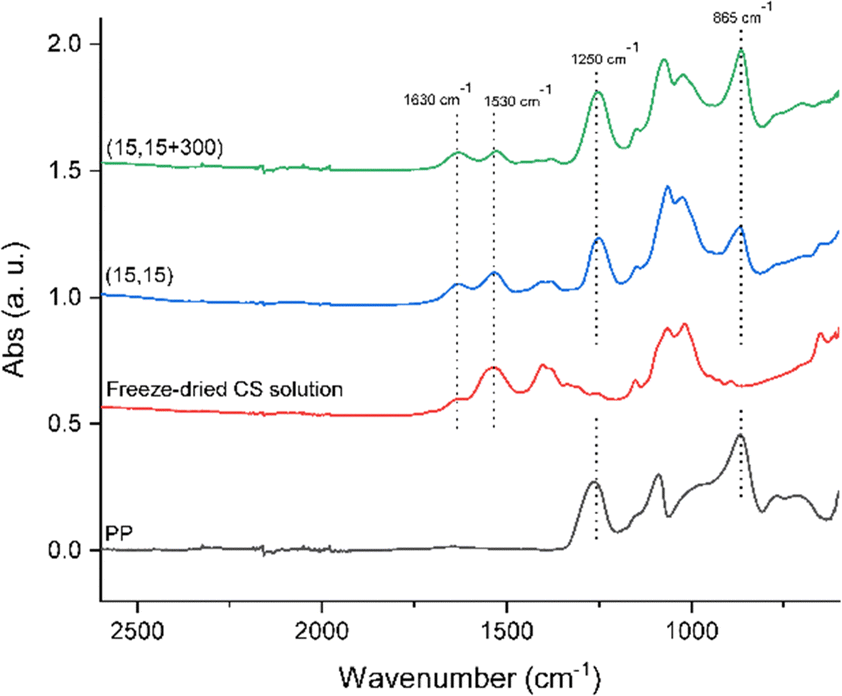 | ||
| Fig. 8 ATR-FTIR spectra of freeze-dried CS solution (15 mg mL−1), PP powder (Dp = 22), and beads of (15,15), and (15,15 + 300) from 2600 cm−1 to 600 cm−1. Note the relative height of the peak at 1530 cm−1 compared to the peak at 1630 cm−1 in these different samples. | ||
The impact of salt on the phosphate content in the beads, a reflection of polyphosphate diffusion and complexation, was also studied by ICP. It was observed that the beads formed in the presence of NaCl had around 18 wt% P, while this number was only about 2.5 wt% for beads with no NaCl, suggesting that the presence of the salt had significantly facilitated the diffusion of PP molecules into the beads (Fig. 9). This finding is in good agreement with our DSC/TGA and FTIR data.
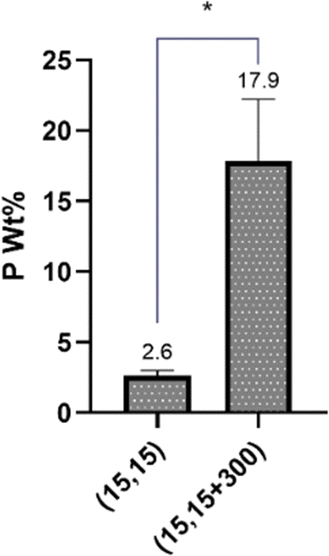 | ||
| Fig. 9 Effect of salt addition on diffusion o PP molecules into the beads measured using ICP. | ||
Effect of time on complexation of the beads
One potential application under consideration for these CS-PP beads is therapeutic delivery. However, the 24 h curing time deployed in these processing studies may result in the loss of drug to the PP solution during this extended residency time in the solution. Crucial for this application, then, is to have a sufficiently low curing time to mitigate any potential drug loss while still ensuring PP diffusion and complexation with the CS bead. Here, the effect of curing time was studied for (15,15 + 300) beads by visual observation, ICP, and ATR-FTIR after 30 sec, 1 min, 5 min, 15 min, 30 min, 1 h, 2 h, and 24 h in PP solution (Fig. 10). It was observed that from 30 sec to 24 h, the beads turned from transparent to white and opaque (Fig. 10a), a sign of diffusion of PPs and complexation with CS. However, little change in the visual appearance of the beads was noted after 30 minutes. ICP analyses further revealed that by increasing the curing time, the P wt% in the beads followed an overall ascending trend, increasing from around 8 wt% at 5 min to almost 18 wt% at 24 h (Fig. 10b). A t-test comparison of each group with the 24 h group showed that the P content in 5 min and 15 min was significantly lower than after 24 h (p < 0.05). However, at higher end of the curing time the P content more closely matched that observed after 24 h. Mi et al.51 noted a similar significant effect of curing time on P content in CS-PP beads (unknown Dp), with minimal impact on P content seen in CS-TPP beads, likely due to the higher diffusion capacity of these much smaller TPP molecules.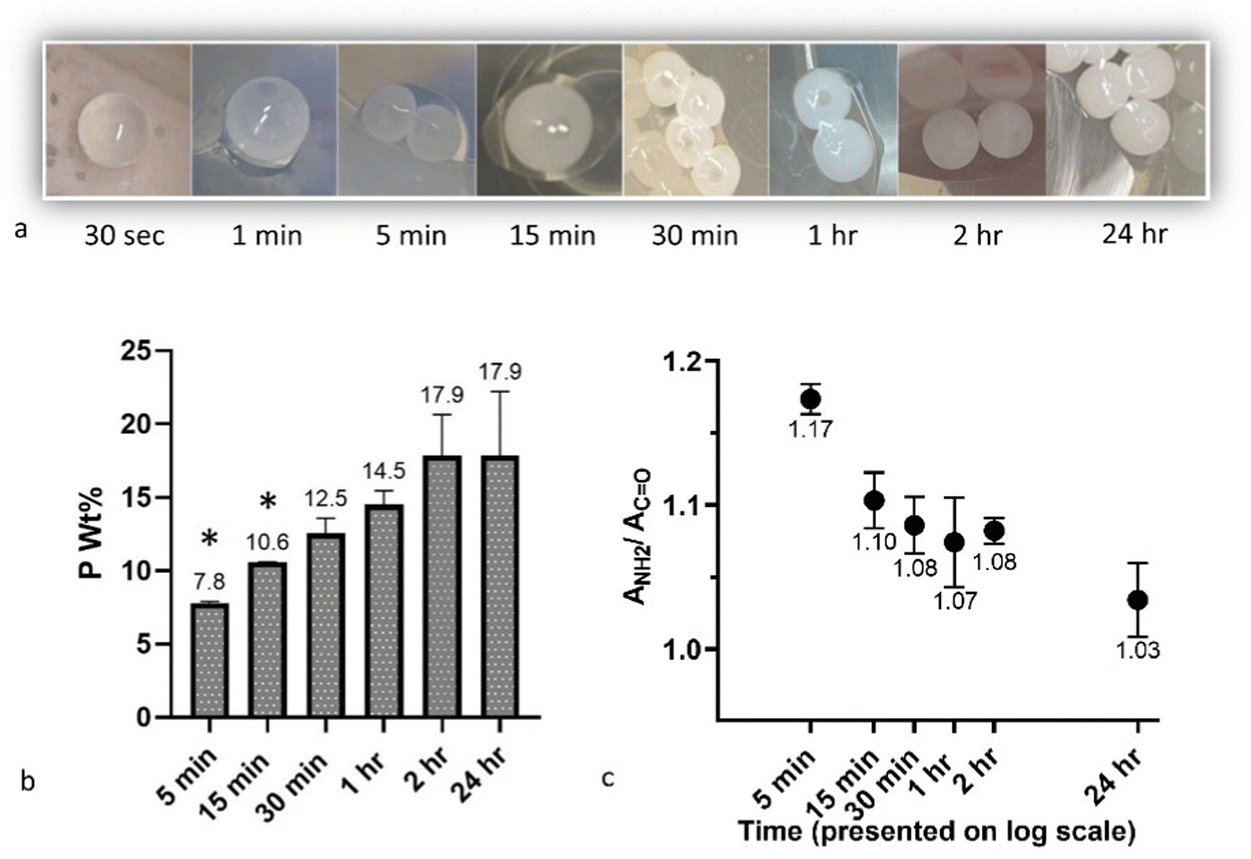 | ||
| Fig. 10 Pictures of (15,15 + 300) beads after 30 sec, 1 min, 5 min, 15 min, 30 min, 1 h, 2 h, and 24 h (a). P content of the beads measured using ICP (b). (ANH2/ACO) calculated from ATR-FTIR spectra of the beads (c). Asterisks indicate significant differences with 24 h curing time (p < 0.05). | ||
ICP data suggest that for drug loading purposes, CS droplets can be cured for less than 24 h to mitigate any potential drug loss, with curing times as low as 2 h yielding almost the same P content as 24 h. However, final curing time should be selected with consideration to its potential impact on other factors, such as final handling properties, therapeutic release profile, and degradation rate.
These findings were further substantiated by ATR-FTIR analyses of the samples to semi-quantitatively show the effect of curing time on the complexation by assessing the ratio of absorbance at around 1530 cm−1 to the absorbance at around 1630 cm−1 (ANH2/ACO) for beads cured for different times (n = 3). An overall trend of declining ratios (indicative of more complexation) with increasing curing time was observed, with average ANH2/ACO of 1.17 and 1.03 noted for 5 min and 24 h, respectively (Fig. 10c). Silvestro et al.72 also have reported a similar effect of reaction time on the ANH2/ACO for CS scaffolds crosslinked in TTP solution, showing that at each CS and TPP concentration, this ratio decreases as crosslinking time increases from 2 h to 8 h.
Conclusions
Monovalent salt (NaCl) additions and curing time were shown to be significant factors in facilitating complexation of CS and PP for macrobead formation. This was in contrast to other processing parameters, including temperature and bead diameter reduction, that produced no significant impact on complexation for these longer PP chains. However, there may be value in utilizing these parameters in conjunction with other more impactful approaches (e.g., salt addition). Addition of 300 mM NaCl to the PP solution was demonstrated to facilitate the diffusion of PP molecules into the CS droplets, with increased opacity indicative of greater complexation within the bead. This interaction was confirmed by thermal, structural, and chemical analysis using DSC/TGA, FTIR, and ICP, respectively. Notably, increased P content as shown by ICP along with an overall decrease in the ANH2/ACO indicated that the presence of PP in the beads was not just the result of physical absorption, but was accompanied by chemical interaction (complexation) with amine groups. Moving forward, this processing strategy could provide a viable approach to complexing larger PP chains of biological relevance with polycations for biomedical applications.
Author contributions
Sajjad Fanaee – design of methodology, conducting the research, performing the experiments, application of statistical techniques to analyse or synthesize study data, and writing the original draft. Mark Joseph Filiaggi – evolution of overarching research goals and aims, oversight and leadership responsibility for the research activity planning and execution, including mentorship external to the core team, funding acquisition, critical review, commentary, and revision of the draft.Conflicts of interest
There are no conflicts to declare.Acknowledgements
The authors gratefully acknowledge funding from the Natural Sciences and Engineering Research Council of Canada (NSERC). The authors would also like to thank Dr Alicia Oickle and Braden Sullivan for their assistance with ICP and FTIR analyses, respectively.References
- M. Gierszewska and J. Ostrowska-Czubenko, Carbohydr. Polym., 2016, 153, 501–511 CrossRef CAS PubMed.
- A. M. Abdelgawad and S. M. Hudson, Int. J. Biol. Macromol., 2019, 136, 133–142 CrossRef CAS PubMed.
- K. C. Gupta and F. H. Jabrail, Appl. Polym. Sci., 2007, 104, 1942–1956 CrossRef CAS.
- V. S. Meka, M. K. G. Sing, M. R. Pichika, S. R. Nali, V. R. M. Kolapalli and P. Kesharwani, Drug Discovery Today, 2017, 22, 1697–1706 CrossRef CAS PubMed.
- A. B. Kayitmazer, A. F. Koksal and E. Kilic Iyilik, Soft Matter, 2015, 11, 8605–8612 RSC.
- M. Rinaudo, Prog. Polym. Sci., 2006, 31, 603–632 CrossRef CAS.
- B. Bellich, I. D’Agostino, S. Semeraro, A. Gamini and A. Cesàro, ‘The good, the bad and the ugly’ of chitosans, Marine drugs, 2016, 14, 99–129 CrossRef PubMed.
- D. Zhao, S. Yu, B. Sun, S. Gao, S. Guo and K. Zhao, Polymers, 2018, 10, 462–478 CrossRef PubMed.
- S. Islam, M. A. R. Bhuiyan and M. N. Islam, J. Polym. Environ., 2017, 25, 854–866 CrossRef CAS.
- P. Roducts, A. Matica and V. Ostafe, New Front. chem., 2017, 26, 75–86 Search PubMed.
- Y. Okamoto, R. Yano, K. Miyatake, I. Tomohiro, Y. Shigemasa and S. Minami, Carbohydr. Polym., 2003, 53, 337–342 CrossRef CAS.
- T. C. Chou, E. Fu, C. J. Wu and J. H. Yeh, Biochem. Biophys. Res. Commun., 2003, 302, 480–483 CrossRef CAS PubMed.
- D. Raafat, K. Von Bargen, A. Haas and H. G. Sahl, Appl. Environ. Microbiol., 2008, 74, 3764–3773 CrossRef CAS PubMed.
- H. K. No, N. Young Park, S. Ho Lee and S. P. Meyers, Int. J. Food Microbiol., 2002, 74, 65–72 CrossRef CAS PubMed.
- P. R. Klokkevold and L. Vandemark, Periodontol., 1996, 67, 1170–1175 CAS.
- C.-J. Yao, M.-H. Liao and S.-H. Liu, Int. J. Nanomed., 2015, 10, 5941–5954 Search PubMed.
- R. Chi, F. Cheung, T. B. Ng, J. H. Wong and W. Y. Chan, Mar. Drugs, 2015, 13, 5156–5186 CrossRef PubMed.
- Y. Luo and Q. Wang, Int. J. Biol. Macromol., 2014, 64, 353–367 CrossRef CAS PubMed.
- A. Momeni and M. J. Filiaggi, Langmuir, 2014, 30, 5256–5266 CrossRef CAS PubMed.
- A. Momeni, E. Mae, E. P. Brennan-pierce, J. Jai, S. Shankar, R. Abraham, P. Colp and M. Joseph, Acta Biomater., 2016, 32, 286–297 CrossRef CAS PubMed.
- A. Momeni and M. J. Filiaggi, J. Non-Cryst. Solids, 2013, 382, 11–17 CrossRef CAS.
- R. E. Hall, Water Softening and Washing, US Pat., 1956515, 1934 Search PubMed.
- S. A. Smith, S. H. Choi, R. Davis-Harrison, J. Huyck, J. Boettcher, C. M. Rienstra and J. H. Morrissey, Blood, 2010, 116, 4353–4359 CrossRef CAS PubMed.
- X. Wang, H. C. Schröder and W. E. G. Müller, Biotechnol. J., 2016, 11, 11–30 CrossRef CAS PubMed.
- X. Wang, H. C. Schröder and W. E. G. Müller, J. Mater. Chem. B, 2018, 6, 2385–2412 RSC.
- A. Momeni and M. J. Filiaggi, Acta Biomater., 2016, 41, 328–341 CrossRef CAS PubMed.
- A. Momeni and M. J. Filiaggi, J. Rheol., 2016, 60, 25–34 CrossRef CAS.
- S. A. Loutfy, H. M. A. El-Din, M. H. Elberry, N. G. Allam, M. T. M. Hasanin and A. M. Abdellah, Adv. Nat. Sci.: Nanosci. Nanotechnol., 2016, 7, 035008 Search PubMed.
- J. D. Giraldo, V. H. Campos-Requena and B. L. Rivas, Polym. Bull., 2019, 76, 3879–3903 CrossRef CAS.
- M. Nitsae, A. Madjid, L. Hakim and A. Sabarudin, Chem. Chem. Technol., 2016, 10, 105–114 CrossRef CAS.
- P. I. P. Soares, A. I. Sousa, J. C. Silva, I. M. M. Ferreira, C. M. M. Novo and J. P. Borges, Carbohydr. Polym., 2016, 147, 304–312 CrossRef CAS PubMed.
- X. Wang, N. Chi and X. Tang, Eur. J. Pharm. Biopharm., 2008, 70, 735–740 CrossRef CAS PubMed.
- N. Poth, V. Seiffart, G. Gross, H. Menzel and W. Dempwolf, Biomolecules, 2015, 5, 3–19 CrossRef CAS PubMed.
- Y. Huang, Y. Cai and Y. Lapitsky, J. Mater. Chem. B, 2015, 3, 5957–5970 RSC.
- C. P. Kiilll, H. da, S. Barud, S. H. Santagneli, S. J. L. Ribeiro, A. M. Silva, A. Tercjak, J. Gutierrez, A. M. Pironi and M. P. D. Gremião, Carbohydr. Polym., 2017, 157, 1695–1702 CrossRef CAS PubMed.
- M. J. Alonso, P. Calvo and C. Remun, J. Appl. Polym. Sci., 1997, 63, 125–132 CrossRef.
- W. Fan, W. Yan, Z. Xu and H. Ni, Colloids Surf., B, 2012, 90, 21–27 CrossRef CAS PubMed.
- P. Sacco, S. Paoletti, M. Cok, F. Asaro, M. Abrami, M. Grassi and I. Donati, Int. J. Biol. Macromol., 2016, 92, 476–483 CrossRef CAS PubMed.
- T. Rawal, R. Parmar, R. K. Tyagi and S. Butani, Colloids Surf., B, 2017, 154, 321–330 CrossRef CAS PubMed.
- H. Zhang, M. Oh, C. Allen and E. Kumacheva, Biomacromolecules, 2004, 5, 2461–2468 CrossRef CAS PubMed.
- S. Durkut, Y. M. Elçin and A. E. Elçin, Artif. Cells, Blood Substitutes, Biotechnol., 2006, 34, 263–276 CrossRef CAS PubMed.
- F. L. Mi, H. W. Sung, S. S. Shyu, C. C. Su and C. K. Peng, Polymer, 2003, 44, 6521–6530 CrossRef CAS.
- M. Diop, N. Auberval, A. Viciglio, A. Langlois, W. Bietiger, C. Mura, C. Peronet, A. Bekel, D. Julien David, M. Zhao, M. Pinget, N. Jeandidier, C. Vauthier, E. Marchioni, Y. Frere and S. Sigrist, Int. J. Pharm., 2015, 491, 402–408 CrossRef CAS PubMed.
- A. P. Bagre, K. Jain and N. K. Jain, Int. J. Pharm., 2013, 456, 31–40 CrossRef CAS PubMed.
- R. Bodmeier, K. Oh and Y. Pramar, Drug Dev. Ind. Pharm., 1989, 15, 1475–1494 CrossRef CAS.
- Z. Aydin and J. Akbuǧa, Int. J. Pharm., 1996, 131, 101–103 CrossRef CAS.
- A. D. Sezer and J. Akbuǧa, Int. J. Pharm., 1995, 121, 113–116 CrossRef CAS.
- S. Shiraishi, T. Imai and M. Otagiri, J. Controlled Release, 1993, 25, 217–225 CrossRef CAS.
- X. Z. Shu and K. J. Zhu, Int. J. Pharm., 2000, 201, 51–58 CrossRef CAS PubMed.
- X. Z. Shu and K. J. Zhu, Eur. J. Pharm. Biopharm., 2002, 54, 235–243 CrossRef CAS PubMed.
- F. L. Mi, S. S. Shyu, C. Y. Kuan, S. T. Lee, K. T. Lu and S. F. Jang, J. Appl. Polym. Sci., 1999, 74, 1868–1879 CrossRef CAS.
- F. L. Mi, S. S. Shyu, T. B. Wong, S. F. Jang, S. T. Lee and K. T. Lu, J. Appl. Polym. Sci., 1999, 74, 1093–1107 CrossRef CAS.
- J. Fu and J. B. Schlenoff, J. Am. Chem. Soc., 2016, 138, 980–990 CrossRef CAS PubMed.
- R. Chollakup, J. B. Beck, K. Dirnberger, M. Tirrell and C. D. Eisenbach, Macromolecules, 2013, 46, 2376–2390 CrossRef CAS.
- Q. Wang and J. B. Schlenoff, Macromolecules, 2014, 47, 3108–3116 CrossRef CAS.
- J. Fu, H. M. Fares and J. B. Schlenoff, Macromolecules, 2017, 50, 1066–1074 CrossRef CAS.
- C. Schatz, J. M. Lucas, C. Viton, A. Domard, C. Pichot and T. Delair, Langmuir, 2004, 20, 7766–7778 CrossRef CAS PubMed.
- Y. Huang and Y. Lapitsky, Biomacromolecules, 2012, 13, 3868–3876 CrossRef CAS PubMed.
- Z. Liu, Y. Jiao, F. Liu and Z. Zhang, J. Biomed. Mater. Res., Part A, 2007, 83A, 806–812 CrossRef CAS PubMed.
- B. Philipp, H. Dautzenberg, K. J. Linow, J. Kötz and W. Dawydoff, Prog. Polym. Sci., 1989, 14, 91–172 CrossRef CAS.
- S. Ali and V. M. Prabhu, Gels, 2018, 4, 11 CrossRef PubMed.
- R. Chollakup, J. B. Beck, K. Dirnberger, M. Tirrell and C. D. Eisenbach, Macromolecules, 2013, 46, 2376–2390 CrossRef CAS.
- D. Priftis and M. Tirrell, Soft Matter, 2012, 8, 9396–9405 RSC.
- J. van der Gucht, E. Spruijt, M. Lemmers and M. A. Cohen Stuart, J. Colloid Interface Sci., 2011, 361, 407–422 CrossRef CAS PubMed.
- S. Ali, M. Bleuel and V. M. Prabhu, ACS Macro Lett., 2019, 8, 289–293 CrossRef CAS.
- Q. Wang and J. B. Schlenoff, Macromolecules, 2014, 47, 3108–3116 CrossRef CAS.
- P. Schaaf and J. B. Schlenoff, Adv. Mater., 2015, 27, 2420–2432 CrossRef CAS PubMed.
- H. Dautzenberg, Macromolecules, 1997, 30, 7810–7815 CrossRef CAS.
- H. Wu, J. M. Ting, O. Werba, S. Meng and M. V. Tirrell, J. Chem. Phys., 2018, 149, 163330 CrossRef PubMed.
- R. C. Polexe and T. Delair, Molecules, 2013, 18, 8563–8578 CrossRef CAS PubMed.
- J. Zawadzki and H. Kaczmarek, Carbohydr. Polym., 2010, 80, 394–400 CrossRef CAS.
- I. Silvestro, I. Francolini, V. di Lisio, A. Martinelli, L. Pietrelli, A. S. d’Abusco, A. Scoppio and A. Piozzi, Materials, 2020, 13 DOI:10.3390/MA13163577.
- F. Pati, B. Adhikari and S. Dhara, Carbohydr. Res., 2011, 346, 2582–2588 CrossRef CAS PubMed.
- R. M. Saeed, I. Dmour and M. O. Taha, Front. Bioeng. Biotechnol., 2020, 8, 1–21 CrossRef PubMed.
- F. Pati, B. Adhikari and S. Dhara, Carbohydr. Res., 2011, 346, 2582–2588 CrossRef CAS PubMed.
- P. Sacco, M. Borgogna, A. Travan, E. Marsich, S. Paoletti, F. Asaro, M. Grassi and I. Donati, Polysaccharide-based networks from homogeneous chitosan-tripolyphosphate hydrogels: Synthesis and characterization, Biomacromolecules, 2014, 15, 3396–3405 CrossRef CAS PubMed.
- A. F. Tomaz, S. M. S. de Carvalho, R. C. Barbosa, S. M. L. Silva, M. A. S. Gutierrez, A. G. B. de Lima and M. V. L. Fook, Materials, 2018, 11, 1–18 Search PubMed.
- D. Cook, Can. J. Chem., 1964, 42, 2292–2299 CrossRef CAS.
- A. Khoshmanesh, P. L. M. Cook and B. R. Wood, Analyst, 2012, 137, 3704–3709 RSC.
- A. Michelmore, P. Jenkins and J. Ralston, Int. J. Miner. Process., 2003, 68, 1–16 CrossRef CAS.
Footnote |
| † Electronic supplementary information (ESI) available. See DOI: https://doi.org/10.1039/d2ma01091g |
| This journal is © The Royal Society of Chemistry 2023 |