DOI:
10.1039/D2MA01065H
(Paper)
Mater. Adv., 2023,
4, 1546-1554
Near ultraviolet light excitable highly efficient blue-green multicolour warwickite phosphor, ScCaO(BO3):Ce3+, Tb3+†
Received
1st December 2022
, Accepted 12th February 2023
First published on 13th February 2023
Abstract
Ce3+, Tb3+ co-doped multicolour emission phosphors show highly efficient green emission by energy transfer from Ce3+ to Tb3+. However, an emission peak of near ultraviolet (UV) LEDs, which is around 390 nm, does not match the absorption wavelengths in most Ce3+, Tb3+ co-activated phosphors. This spectral mismatch causes low emission efficiencies in phosphor-converted white LEDs (pc - wLEDs). In this study, Ce3+, Tb3+ co-activated ScCaO(BO3) (SCBO) multicolour phosphors with the orthorhombic warwickite structure were successfully obtained by the conventional solid-state reaction method for the first time. The phosphors exhibit bright blue or green emission under near UV excitation around 390 nm due to energy transfer from Ce3+ to Tb3+. In SCBO, Ce3+ and Tb3+ ions were substituted on two respective order sites, CaO6 and ScO6, leading to high emission efficiency. The internal quantum efficiency of SCBO![[thin space (1/6-em)]](https://www.rsc.org/images/entities/char_2009.gif) :
:![[thin space (1/6-em)]](https://www.rsc.org/images/entities/char_2009.gif) 0.01Ce3+, 0.15Tb3+ was reported to be 62% under the near UV excitation at 390 nm. In order to verify the potential of optical devices, particularly backlighting LEDs, the Rietveld refinement, photoluminescence properties, and decay curve analysis using the Inokuti–Hirayama model are described in this study.
0.01Ce3+, 0.15Tb3+ was reported to be 62% under the near UV excitation at 390 nm. In order to verify the potential of optical devices, particularly backlighting LEDs, the Rietveld refinement, photoluminescence properties, and decay curve analysis using the Inokuti–Hirayama model are described in this study.
Introduction
Phosphor-converted white light-emitting diodes (pc - wLEDs) have been utilized extensively in lighting and vehicle LED headlights.1–4 Particular attention has been given to the use of the pc - wLEDs as a backlight source for liquid crystal displays (LCDs) due to their lower energy consumption and higher brightness.5–10 Wide colour gamut and high luminous efficiency in pc - wLEDs provide the development of LCDs with improved properties. The wide colour gamut is obtained from an appropriate emission peak position with low full-width half maximum (FWHM) values in blue, green, and red components.11 Commercial backlights of pc - wLEDs were constructed with blue-LEDs, green β-SiAlON:Eu2+, and red K2SiF6:Mn4+.12 The emission peak position and FWHM value of the SiAlON:Eu2+ phosphor are at 540 nm and 54 nm, respectively. The FWHM value is somewhat greater than the target value (50 nm) of the Department of Energy (DOE), although the emission peak position is adequate for the target value (540 nm) of the DOE.13 Narrow-band green-emission phosphors such as RbLi(Li3SiO4)2:Eu2+, BaLi2Al2Si2N6:Eu2+, Ba2LiSi7AlN12:Eu2+, and γ -AlON:Eu2+, Mn2+![[thin space (1/6-em)]](https://www.rsc.org/images/entities/char_2009.gif) 14–17 have been developed to achieve the DOE's target value for green emission phosphors. However, since these phosphors have challenges for practical use, the development of novel narrow green phosphors for pc - LEDs for the next-generation backlight is required.
14–17 have been developed to achieve the DOE's target value for green emission phosphors. However, since these phosphors have challenges for practical use, the development of novel narrow green phosphors for pc - LEDs for the next-generation backlight is required.
Tb3+ is a promising green emission ion due to the 4f–4f electron forbidden transition because Tb3+-activated phosphors show narrow-band green emission with an FWHM value of about 15 nm.18 However, most Tb3+-activated phosphors have a weak absorption band in the range of near UV to blue light.19,20 An energy transfer phenomenon is one of the solutions to overcome the weak absorption in the near UV light region of Tb3+.21–23 The energy transfer occurs from donor ions to acceptor ions. As a result, the emission of both acceptors and donors is observed under the excitation of donors. Among the multicolour phosphors, Ce3+ is commonly used as the donor ion because its excitation band is more widely covered by the UV-light region, compared with other rare earth ions with sharp excitation bands. Furthermore, the emission efficiency of Ce3+ ions is higher than that of other rare earth ions owing to the 5d–4f electric allowed transition of Ce3+. Some Ce3+, Tb3+ co-doped multicolour emitting phosphors have been developed: LaOBr3:Ce3+, Tb3+, LaPO4:Ce3+, Tb3+ and Ca2Al3O6F:Ce3+, Tb3+.24–26 These multicolour phosphors show higher emission efficiency compared with only Tb3+-activated luminescent materials due to Tb3+ accepting energy from Ce3+. Nevertheless, Ce3+, Tb3+ co-activated phosphors with high emission efficiency under near UV light excitation around 390 nm have not been developed because their photoluminescent properties are strongly dependent on the donor ion. Because the optical properties of Ce3+ ions vary depending on the host material, it is critical that for Ce3+, Tb3+ co-activated multicolor emission phosphors for pc - wLEDs appropriate host materials are chosen.
Borate has been widely used in the phosphor host due to its low synthesis temperature, physical and chemical stabilities.27,28 In particular, borates containing alkali earth and rare earth elements such as Ba3Y2(B2O5)3, Sr3Gd2(BO3)4, NaBaY(BO3)2, and Sr2LiScB4O10 are adopted as Ce3+, Tb3+ co-doped multicolour phosphor hosts because their crystal structures consist of some substitutional sites for Ce3+ and Tb3+.29–32
We focused on ScCaO(BO3) (SCBO) crystal structure that was first reported by Ma et al. from the single crystal X-ray diffraction, which is in agreement with warwickite such as MgScO(BO3), YCaO(BO3), and Mg0.76Mn1.24O(BO3), respectively.33–36 The warwickite structure is composed of two disordered octahedral sites containing divalent (M2+) and trivalent (M3+) metal ions. The SCBO crystal structure contains CaO6 and ScO6 octahedra that are present, whereas, the other warwickite structures contain two disordered octahedra, (M3+/M2+)O6. Although YCaO(BO3):Ce3+, Tb3+ with warwickite crystal structure has also been reported by Yang et al., its emission efficiency was low.37 Ce3+ and Tb3+ ions should be occupied on the two disordered (Y/Ca)O6 sites in YCaO(BO3). Such an inhomogeneous distribution of emission ions leads to closer distances between donors or acceptors. As a result, the emission efficiency is low due to the excitation energy migration between donors or acceptors. On the other hand, two such distinct order sites in SCBO are expected to prevent the excitation energy migration between donors or acceptors because donor and acceptor ions may be replaced at each individual site. The luminescence properties of phosphors with the SCBO structure, on the other hand, have recently been reported; Ding et al. have reported on the energy transfer phenomenon from Ce3+ to Mn2+ of Ce3+-activated SCBO and Wang et al. have reported the luminescent properties and internal quantum efficiency of Ce3+-activated SCBO.38,39 Although the luminescence properties of the SCBO-related phosphor were actively reported, the energy transfer phenomenon of Ce3+, Tb3+ co-activated SCBO is unclarified.
In this study, we synthesized Ce3+, Tb3+ co-activated SCBO and investigated their luminescence properties. The Rietveld analysis, photoluminescence, quantum efficiencies, and emission decay curve measurements were systematically conducted. These experimental consequences indicate that Ce3+, Tb3+ co-doped SCBO phosphors show highly efficient narrow-band green emission excited by 390 nm, which is nearly close to near UV LEDs.
Preparation of materials
Non-doped and Ce3+, Tb3+ co-doped SCBO were synthesized by the conventional solid-state reaction. Raw materials, Sc2O3 (Iwatani Sangyo, Co., Ltd., 99.999%), CaCO3 (Kanto Chemical, Co., Inc., 99.5%), H3BO3 (Kanto Chemical, Co., Inc., 99.5%), CeO2 (Kanto Chemical, Co., Inc., 99.99%) and Tb4O7 (Kanto Chemical, Co., Inc., 99.95%) were weighed in a ratio of Sc![[thin space (1/6-em)]](https://www.rsc.org/images/entities/char_2009.gif) :
:![[thin space (1/6-em)]](https://www.rsc.org/images/entities/char_2009.gif) Ca
Ca![[thin space (1/6-em)]](https://www.rsc.org/images/entities/char_2009.gif) :
:![[thin space (1/6-em)]](https://www.rsc.org/images/entities/char_2009.gif) B
B![[thin space (1/6-em)]](https://www.rsc.org/images/entities/char_2009.gif) :
:![[thin space (1/6-em)]](https://www.rsc.org/images/entities/char_2009.gif) Ce
Ce![[thin space (1/6-em)]](https://www.rsc.org/images/entities/char_2009.gif) :
:![[thin space (1/6-em)]](https://www.rsc.org/images/entities/char_2009.gif) Tb = 0.99 − y: 1
Tb = 0.99 − y: 1![[thin space (1/6-em)]](https://www.rsc.org/images/entities/char_2009.gif) :
:![[thin space (1/6-em)]](https://www.rsc.org/images/entities/char_2009.gif) 1.1
1.1![[thin space (1/6-em)]](https://www.rsc.org/images/entities/char_2009.gif) :
:![[thin space (1/6-em)]](https://www.rsc.org/images/entities/char_2009.gif) 0.01: y (y = 0, 0.01, 0.05, 0.10, 0.15 and 0.20), respectively; excess H3BO3 by 10 mol% over the stoichiometric ratio was added to suppress volatilization of B leading to impurities. The sorted raw materials were mixed in an agate mortar using acetone. After that, the mixtures were pressed into 1 mm diameter disk pellets under a 20 MPa pressure. The pelletized samples were placed within a BN crucible and heated at 1200 °C for 4 h in an N2 atmosphere of 0.9 MPa by means of a vacuum and press sintering furnace (VESTA, Shimadzu Mectem. Inc.).
0.01: y (y = 0, 0.01, 0.05, 0.10, 0.15 and 0.20), respectively; excess H3BO3 by 10 mol% over the stoichiometric ratio was added to suppress volatilization of B leading to impurities. The sorted raw materials were mixed in an agate mortar using acetone. After that, the mixtures were pressed into 1 mm diameter disk pellets under a 20 MPa pressure. The pelletized samples were placed within a BN crucible and heated at 1200 °C for 4 h in an N2 atmosphere of 0.9 MPa by means of a vacuum and press sintering furnace (VESTA, Shimadzu Mectem. Inc.).
Characterization
Powder X-ray Diffraction (XRD) data on the obtained SCBO were collected using an X-ray diffractometer (D2 PHASER, Bruker; Co., Ltd.) with a monochromatic CuKα radiation (λ = 1.54056 Å) at 10 mA and 30 kV. The Rietveld refinement for the samples was carried out using the RIETAN-FP program software.40 Photoluminescence (PL) and photoluminescence excitation (PLE) spectra of the samples were measured using a spectrofluorometer (FP-6500/FP-6600; Jasco Corp.) with a 150 W Xenon lamp. Absolute quantum efficiency (QE) of the samples was measured in an integrating sphere (ISF-834; Jasco Corp.) using a photoluminescence spectrometer (FP-8500; Jasco Corp.), where a standard halogen lamp (ESC-842; Jasco Corp.) was used for the calibration of this measurement system. Decay curves of the Ce3+ ion in the SCBO:0.01Ce3+, yTb3+ phosphors were monitored using a Quantaurus-Tau (Hamamatsu Photonics Inc.). Chromaticity coordinate data for phosphors were measured at room temperature using a CCD camera (Hamamatsu C7473-36 PMA-11).
Results and discussion
Phase determination and crystal structure
Fig. 1 shows the XRD patterns of SCBO with and without emission ions. The simulation pattern of SCBO was calculated from the previously reported crystal information data.33 The SCBO samples were in good agreement with the simulation pattern without any distinct impurity phases.
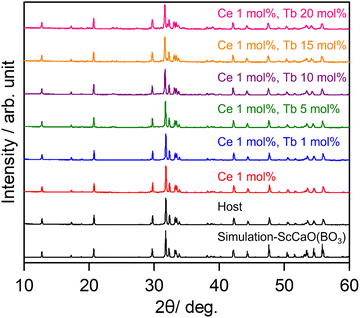 |
| | Fig. 1 XRD patterns of SCBO with and without emission ions. | |
All the samples were obtained in a single phase with the orthorhombic SCBO structure. The Rietveld refinement was conducted for all the samples. Fig. 2 shows the fitting patterns obtained from the Rietveld refinement for the SCBO host, where a black cross symbol represents the observed data, a red solid line represents a calculated pattern, a blue line represents the difference between observed and calculated data and a green vertical line represents the Bragg position. The crystal information data of ScCaO(BO3) with an orthorhombic structure in a space group of Pnma (No. 62), reported by Ma et al.,33 was used as the model crystal structure. Table 1 demonstrates the crystallographic and R-values through the Rietveld refinement for SCBO. The R-values finally converged to Rwp = 9.418%, Rp = 6.803%, Re = 5.717%, and S = 1.600, respectively, indicating that the high-purity SCBO was successfully obtained. Rwp values for all the samples were lower than 10% (See ESI,† Fig. S1 and Table S1). Table 2 shows the atomic coordination and isotropic atomic displacement of the SCBO host refined by the Rietveld analysis. The isotopic atomic displacement values, Beq (Å2), were estimated to be positive for all sites.
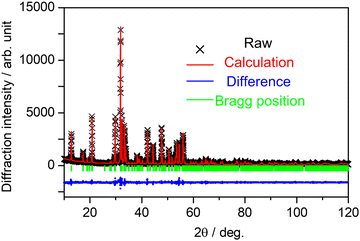 |
| | Fig. 2 Observed (black cross symbol), calculated (red) and difference (blue) obtained from Rietveld refinement on X-ray powder diffraction for SCBO. | |
Table 1 Parameters refined through Rietveld analysis for SCBO host
| Name |
ScCaO(BO3) |
|
S. G. means space group.
|
| System |
Orthorhombic |
| S. G.a |
Pnma (#62) |
|
a [Å] |
10.2544(4) |
|
b [Å] |
3.3654(1) |
|
c [Å] |
9.4159(3) |
|
V [Å3] |
324.94(2) |
|
Z [−] |
4 |
|
R
wp [%] |
9.148 |
|
R
p [%] |
6.803 |
|
R
e [%] |
5.717 |
|
S [−] |
1.600 |
Table 2 Atomic coordination and isotropic atomic displacement obtained through Rietveld refinement in SCBO host
| Atom |
Site |
Occ.a |
x
|
y
|
z
|
B
eq [Å2] |
|
Occ. is Occupancy.
|
| Sc |
4c |
1 |
0.3905(1) |
1.25 |
0.5728(1) |
0.70(4) |
| Ca |
4c |
1 |
0.5890(1) |
0.75 |
0.8401(1) |
0.79(5) |
| B |
4c |
1 |
0.3086(9) |
1.25 |
0.859(1) |
1.4(2) |
| O1 |
4c |
1 |
0.5005(4) |
0.75 |
0.6121(5) |
0.5(1) |
| O2 |
4c |
1 |
0.2436(5) |
1.25 |
0.7322(5) |
1.4(1) |
| O3 |
4c |
1 |
0.2652(4) |
0.75 |
0.4920(5) |
1.4(1) |
| O4 |
4c |
1 |
0.4387(4) |
0.25 |
0.8750(5) |
1.8(1) |
Fig. 3 shows the refined crystal structure of the SCBO along the b axis, as illustrated by the VESTA program.41 As shown in Table 1, the lattice parameters are found to be a = 10.2544(4) Å, b = 3.3654(1) Å, c = 9.4159(3) Å and V = 324.94(2) Å3. This crystal structure possesses one Sc site, one Ca site, one B site, and four O sites. Both Ca2+ and Sc3+ ions are coordinated by six O2− ions and form independent octahedrons without disordering.
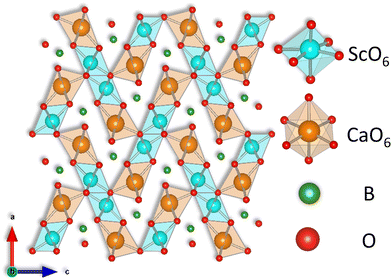 |
| | Fig. 3 Refined crystal structure of SCBO along b axis. | |
In addition, to understand the behavior of the substitution of Tb3+ for Sc3+, the variations in the cell volume and lattice parameters are systematically summarized in Fig. 4(a)–(d). The lattice parameters of SCBO:0.01Ce3+, yTb3+ (y = 0, 0.01, 0.05, 0.10, 0.15, and 0.20) are also listed in Table S1 (ESI†). According to Vegard's rule, the lattice volume of SCBO:0.01Ce3+, yTb3+ expands linearly as the Tb3+ concentration increases. The b and c values, as well as the cell volume, are also elongated. The a value dramatically increased from 10.2601(3) Å to 10.2690(3) Å when SCBO:0.01Ce3+ incorporated 1 mol% of Tb3+. As the Tb3+ concentration exceeds 1 mol%, the a value increased slightly more than the b and c values. According to the relationship of the ionic radius, It is because the larger Tb3+ (0.923 Å; 6-fold coordination)42 prefer to occupy smaller Sc3+ (0.745 Å; 6-fold coordination)42 sites rather than the large Ca2+ (1.000 Å; 6-fold coordination).42
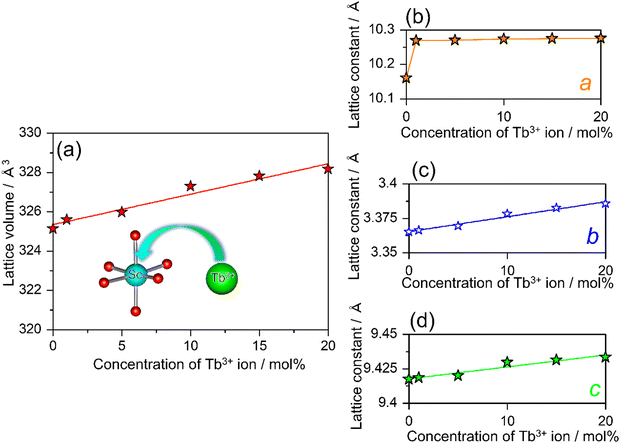 |
| | Fig. 4 Dependence of (a) the cell volume, lattice parameters, (b) a, (c) b, and (d) c on the concentration of Tb3+ ion in SCBO:0.01Ce3+, yTb3+ (y = 0, 0.01, 0.05, 0.10, 0.15, 0.20). | |
Photoluminescence properties of SCBO:Ce3+, Tb3+
The photoluminescence excitation (dashed line) and emission (solid) spectra of SCBO:0.01Ce3+ (above), SCBO:0.10Tb3+ (middle), and SCBO:0.01Ce3+, 0.10Tb3+ (bottom) are shown in Fig. 5(a). Ce3+-doped SCBO exhibits a broad blue emission with the peak top around 440 nm under near UV excitation at 390 nm, the emission spectrum was successfully deconvoluted into two components, as shown in Fig. S2 and Table S2 (ESI†). The energy difference between the peaks of the two deconvoluted spectra, corresponding to the electron transition from 5d to two ground states of the Ce3+ ion, 2F5/2 and 2F7/2,43 was calculated to be 2169 cm−1. This result indicates that the Ce3+ ion was replaced at one site in the SCBO structure. The excitation spectrum was also deconvoluted into three components with peaks around 300 nm, 350 nm, and 390 nm. The band with the peak around 300 nm was attributed to the host absorption because the band was observed in the absorption spectrum of the SCBO host; Ma et al. have reported that the band gap energy of the SCBO host was estimated to be 4.30 eV (= 288 nm).34 The bands with peaks around 350 nm and 390 nm are attributed to the two excitation bands of the Ce3+ ion, the excitation bands are caused by the presence of the two ground states in the 4f–5d transition of the Ce3+ ion, as seen in other Ce3+-doped phosphors such as YAG:Ce3+.44
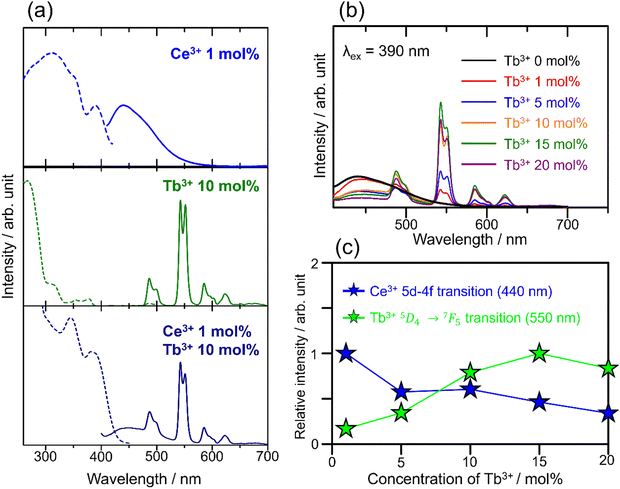 |
| | Fig. 5 (a) Photoluminescence excitation (dashed line) and emission (solid line) spectra of SCBO:0.01Ce3+ (above), SCBO:0.10Tb3+ (middle) and SCBO:0.01Ce3+, 0.10Tb3+ (bottom). (b) Emission spectra of SCBO:0.01Ce3+, yTb3+ (y = 0, 0.01, 0.05, 0.10, 0.15, 0.20) under 390 nm excitation and (c) relative emission peak intensities in 5d-4f (Ce3+; 440 nm) and 5D4 → 7F5 transitions (Tb3+; 550 nm). | |
Site occupation of the Ce3+ ion in the SCBO structure was not revealed by the XRD analysis because the XRD patterns did not reflect the small amounts of Ce3+ added. To elucidate the emission mechanism of the Ce3+ ion in the SCBO structure, equations, suggested by Dorenbos, were adopted. Firstly, the centroid shift value εc was calculated using the following eqn (1);45
| |  | (1) |
where
Ri means the bond distance [pm] between Ce
3+ and O
2− atoms in a host lattice, Δ
R represents the difference between ionic radii of Ce
3+ and substitutional cations.
N is the coordination number of Ce
3+ with anions.
αisp shows the spectroscopic polarizability, estimated as the
eqn (2);
46| |  | (2) |
where
χ2av is the weighted average of electronegativity of cations in the crystal structure.
χ2av can be calculated from
eqn (3);
47| |  | (3) |
Na is the number of anions in the compound formula.
Nc is the summation of cations in the crystal structure, −
γ and
zi are the charges of anion and cation
i, respectively.
χi is the electronegativity of the cation
i, which is given by Allred.
48 From the
eqn (2)–(3),
χ2av,
αisp and
εc are found to be 1.525, 2.394. Consequently, the centroid shift values of CaO
6 and ScO
6 sites were estimated to be 12
![[thin space (1/6-em)]](https://www.rsc.org/images/entities/char_2009.gif)
273 cm
−1 and 36
![[thin space (1/6-em)]](https://www.rsc.org/images/entities/char_2009.gif)
034 cm
−1, respectively. Moreover, the crystal field splitting
εcfs was estimated using the following
eqn (4);
49where
βQpoly shows a constant depending on the shape and coordination number. In the case of SCBO, the octahedral
βocta = 1.35 × 10
−9 pm
2 cm
−1 was adopted.
50Rav is the average bond length of the polyhedrons calculated by
eqn (5);
51| |  | (5) |
where
Ri represents the bond distance between Ce
3+ and O
2−, Δ
R means the difference between ionic radii between the substitutional cation and Ce
3+. As a result, the crystal field splitting of Ce
3+ in the CaO
6 site was found to be 24
![[thin space (1/6-em)]](https://www.rsc.org/images/entities/char_2009.gif)
350 cm
−1, while that in the ScO
6 site was 34
![[thin space (1/6-em)]](https://www.rsc.org/images/entities/char_2009.gif)
555 cm
−1. The Stokes shift value Δ
S is simply explained using the following
eqn (6);
52where
λex and
λem exhibit excitation and emission energies, respectively. Δ
S value was found to be 2984 cm
−1. As a result, the ideal emission energy of Ce
3+ in the CaO
6 and ScO
6 sites were found to be 24
![[thin space (1/6-em)]](https://www.rsc.org/images/entities/char_2009.gif)
342.9 cm
−1 (411 nm) and −3500.0 cm
−1 (−2857 nm), respectively, indicating that the observed emission band peaked around 440 nm of SCBO:0.01Ce
3+ is close to the predicted emission energy in the CaO
6 site. Hence, Ce
3+ is preferentially occupied on the CaO
6 site rather than the ScO
6 site; the optical energy diagram of Ce
3+ in the CaO
6 polyhedron in the SCBO structure is shown in Fig. S3 (ESI
†).
Fig. 5(a) middle shows the excitation and emission bands of 10 mol% Tb3+-doped SCBO. The emission spectrum under excitation at 270 nm contains four notable emission peaks approximately at 488 nm (5D4 → 7F6), 550 nm (5D4 → 7F5), 585 nm (5D4 → 7F4), and 622 nm (5D4 → 7F3), corresponding to the 4f–4f electron-forbidden transition of Tb3+. The excitation spectrum contains three components around 270 nm, 300 nm, and 320–370 nm. The highest energy band (270 nm) is owing to the charge transfer band between Tb3+ and O2−. The second highest energy band (300 nm) belongs to the 4f8 → 4f75d1 transition with the low spin state of Tb3+.53 The excitation band ranging from 320 nm to 370 nm shows the direct 4f–4f transition of Tb3+. Tb3+-doped SCBO shows strong luminescence under UV light excitation, but not under near UV light.
Ce3+, Tb3+ co-doped SCBO exhibits a broad blue emission due to the 4f–5d transition of Ce3+ and narrow green emission due to the 4f–4f transition of Tb3+ under near UV light excitation. Fig. 5(b) shows the emission spectra of SCBO:0.01Ce3+, yTb3+ (y = 0, 0.01, 0.10, 0.15, and 0.20) under near UV excitation at 390 nm. Fig. 5(c) also exhibits the relative peal emission intensities on the 5d–4f transition (440 nm) of Ce3+ and the 5D4 → 7F5 (550 nm) transition of Tb3+. Until y = 0.15, the emission intensity of the 5D4 → 7F5 (550 nm) transition of Tb3+ gradually increases, while that of the 5d–4f transition of Ce3+ remarkably decreases. This result suggests that the emission energy of Ce3+ as a donor ion transfers to Tb3+ as an acceptor ion, and that the energy transfer efficiency rises as Tb3+ concentration in SCBO increases. However, the emission intensity of SCBO:0.01Ce3+, 0.20Tb3+ (y = 0.20) decreases compared to that in y = 0.15. This phenomenon implies that the energy migration among Tb3+ ions actively occurs.
The quantum efficiencies of SCBO:0.01Ce3+ and SCBO:0.01Ce3+, 0.15Tb3+ are summarized in Table S3 (ESI†). Interestingly, the internal quantum efficiencies of SCBO:0.01Ce3+ and SCBO:0.01Ce3+, 0.15Tb3+ were found to be 85% and 62%, respectively. Since Ce3+ and Tb3+ tend to be substituted on two different crystallographic sites, CaO6 and ScO6, respectively, the inhomogeneous distribution of Ce3+ and Tb3+ in the host lattice, leading to the excitation energy migration between Ce3+ and Tb3+, would be suppressed. As a result, the emission efficiencies of SCBO:Ce3+, Tb3+ became higher than those of YCaO(BO3):Ce3+, Tb3+ with two disorder sites. Moreover, These values are higher than those of reported Ce3+, Tb3+ co-doped multicolour emission phosphors such as Sr2LiScB4O10:Ce3+, Tb3+ (46%), La0.59Al2.03B4O10.54:Ce3+, Tb3+ (41%), Sr5B3O9F:Ce3+, Tb3+, Na+ (57%) and NaBaScSi2O7:Ce3+, Tb3+ (36%), indicating that SCBO:Ce3+, Tb3+ has good potential for a near ultraviolet LED phosphor.32,54–56
Photoluminescence decay curve measurements and analysis
Fig. 6(a) shows the decay curves of SCBO:0.01Ce3+, yTb3+ (y = 0, 0.01, 0.05, 0.10, 0.15, and 0.20) monitored at 443 nm under 405 nm excitation. The emission intensities of all samples decayed in a nanosecond (ns) order due to the 5d–4f electron-allowed transitions of Ce3+. The enlarged view of the decay curves for the phosphors from 60 ns to 200 ns is also shown in Fig. 6(b). As the Tb3+ concentration increases, the emission attributed to the 4f–4f transition of Tb3+ decays rapidly because the probability of energy migration from Ce3+ to Tb3+ increases. Since it indicates that Ce3+ and Tb3+ are individually located on the CaO6 site and ScO6 site in SCBO, respectively, the lifetime τ was calculated using the eqn (7);57–59| |  | (7) |
where I(t) shows a photoluminescence emission intensity in a phosphor at the time t and I0 means the initial emission intensity at t = 0. As a result, τ of SCBO:0.01Ce3+, yTb3+ (y = 0, 0.01, 0.05, 0.10, 0.15, and 20) are found to be 36.2 ns, 34.7 ns, 33.7 ns, 30.1 ns, 29.7 ns, and 27.9 ns, respectively. The energy transfer efficiency ηT was calculated using the following eqn (8);60–62| |  | (8) |
where η0 represents the emission efficiency of the donor ion without an acceptor ion, while η shows that with an acceptor ion. The concentration dependence of the energy transfer efficiency on Tb3+ in SCBO:0.01Ce3+, yTb3+ is shown in Fig. S4 (ESI†), indicating that the ηT value steadily rises to around 49% in SCBO:0.01Ce3+, 0.20Tb3+. From these results, the energy transfer between Ce3+ and Tb3+ actively occurs upon increasing Tb3+ as an acceptor ion.
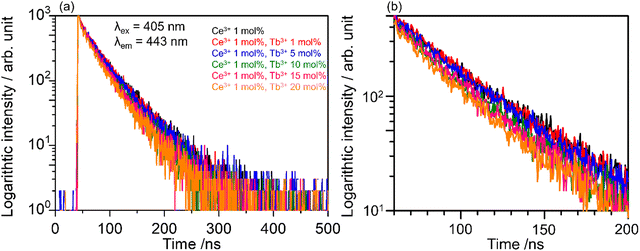 |
| | Fig. 6 (a) Photoluminescence decay curves of SCBO:0.01Ce3+, yTb3+ (y = 0, 0.01, 0.05, 0.10, 0.15, 0.20) monitored 443 nm excited at 405 nm and (b) enlarged view of the decay curves between 60–200 ns. | |
Energy transfer mechanisms are categorized into two theories: Dexter and Förster. Energy transfer in Dexter's theory is called the exchange interaction, while Förster's energy transfer phenomenon is electric multipole interaction. Identification of the energy transfer mechanism is to calculate the critical distance Rc between donor and acceptor ions, which is estimated by the eqn (9);63,64
| |  | (9) |
where
C is the total concentration of donor and acceptor ions.
N means the number of substitutional cations for Ce
3+ and Tb
3+ ions in the SCBO structure.
V is the cell volume. Consequently, the
Rc values in SCBO:0.01Ce
3+,
yTb
3+ (
y = 0.01, 0.05, 0.10, 0.15, and 0.20) are estimated to be 68.2 Å, 47.2 Å, 38.2 Å, 34.2 Å, and 31.2 Å, respectively. Exchange interaction dominantly occurs when the
Rc values are below 5 Å, while electric multipole interaction predominately results beyond 5 Å. Because all the estimated critical distances in SCBO:0.01Ce
3+,
yTb
3+ are higher than 5 Å, Förster's energy transfer mechanism is dominated in SCBO:Ce
3+, Tb
3+.
In Förster's energy transfer mechanism, the electric multipole interaction is categorized into three types: dipole–dipole, dipole–quadrupole, and quadrupole–quadrupole interactions. To understand, in-depth, the multipole interaction in SCBO:Ce3+,Tb3+, the Inokuti–Hirayama (I–H) model using the following eqn (10)65 was adopted in this study.
| |  | (10) |
where
I(
t) shows the emission intensity at a time
t,
I0 means the initial intensity at
t = 0,
τ0 is the lifetime of a donor ion without an acceptor ion,
τ represents the donor lifetime including an acceptor ion,
C0 is the concentration ratio of an acceptor ion and critical transfer concentration ratio,
s is the energy transfer type (
s = 6; dipole–dipole,
s = 8; dipole–quadrupole,
s = 10; quadrupole–quadrupole), and

is the gamma function (
s = 6; 1.77,
s = 8; 1.43 and
s = 10; 1.30), respectively. Based on this principle, we conducted the curve fitting for SCBO:0.01Ce
3+, 0.15Tb
3+, which are shown in
Fig. 7. The indicator of the goodness-fit of decay curve fitting by means of the I–H model is determined by the figure of merit (FOM). Consequently, the FOM value is found to be the lowest value at 0.0898 in
s = 8 (dipole–quadrupole). Many kinds of Ce
3+, Tb
3+ co-doped phosphors exhibit the dipole–quadrupole interaction due to the energy transfer between Ce
3+ with spin-allowed transition and Tb
3+ with spin-forbidden transition.
66–70 Therefore, dipole–quadrupole interaction in SCBO:Ce
3+, Tb
3+ is reasonable.
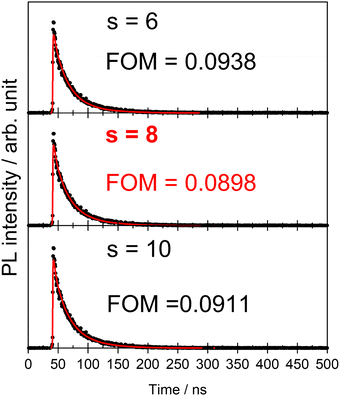 |
| | Fig. 7 Energy transfer analysis for SCBO:0.01Ce3+, 0.15Tb3+ by Inokuti–Hirayama model in s = 6 (above), s = 8 (middle) and s = 10 (bottom). | |
Chromaticity diagram
Fig. 8 shows the chromaticity diagram of SCBO:0.01Ce3+, yTb3+ (y = 0, 0.01, 0.05, 0.10, 0.15, and 0.20). The coordinate number (X, Y) of SCBO:0.01Ce3+, yTb3+ are listed in Table 3. Ce3+-doped SCBO exhibits a blue emission colour. On the other hand, as the Tb3+ concentration increases in SCBO:0.01Ce3+, the location of (X, Y) coordination moves to the green region, indicating that the emission colour of SCBO:0.01Ce3+, yTb3+ shifts dramatically from blue to green. This result indicates that the colour gamut of pc-LEDs can be tuned by adjusting the Tb3+ concentration in SCBO:Ce3+.
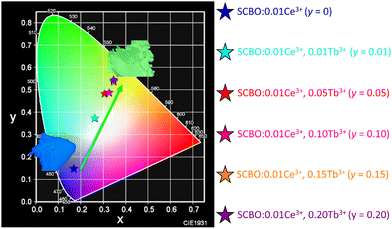 |
| | Fig. 8 Chromaticity diagram of SCBO:0.01Ce3+, yTb3+ (y = 0, 0.01, 0.05, 0.10, 0.15, 0.20). Insert photographs show the blue-emitting SCBO:0.01Ce3+ and green-emitting SCBO:0.01Ce3+, 0.15Tb3+. | |
Table 3 Coordinate number (X, Y) of SCBO:0.01Ce3+, yTb3+ (y = 0, 0.01, 0.05, 0.10, 0.15 and 0.20)
| Sample |
X
|
Y
|
|
y = 0 |
0.168 |
0.147 |
|
y = 0.01 |
0.261 |
0.374 |
|
y = 0.05 |
0.305 |
0.484 |
|
y = 0.10 |
0.325 |
0.488 |
|
y = 0.15 |
0.346 |
0.537 |
|
y = 0.30 |
0.345 |
0.544 |
Conclusion
Ce3+, Tb3+ co-doped SCBO phosphors that are excited by near UV light were synthesized by the conventional solid-state reaction. Tb3+ preferentially occupies the ScO6 sites because the Rietveld refinement for all samples revealed that the cell volumes and lattice constants, especially b and c, expanded with increasing Tb3+ concentration. Luminescence properties for the Ce3+-doped SCBO phosphor revealed that Ce3+ ions are probably located on the CaO6 octahedral. The blue-green multicolour emission band was observed in Ce3+, Tb3+ co-doped SCBO under near UV excitation at 390 nm, indicating that energy transfer from Ce3+ to Tb3+ allows achieving phosphors that are excited by near UV light, while Tb3+-doped SCBO did not show a strong green emission under near UV light. In particular, the internal quantum efficiencies of SCBO:0.01Ce3+ (85%) and SCBO:0.01Ce3+, 0.15Tb3+ (62%) were higher than those of reported Ce3+, Tb3+ co-doped phosphors. Since Ce3+ and Tb3+ are replaced in each individual octahedral site without the disorder in the SCBO structure, leading to a homogeneous distribution of Ce3+ and Tb3+ in the SCBO lattice. The high quantum efficiencies of SCBO:Ce3+ and SCBO:Ce3+, Tb3+ should be obtained due to the suppression of the excitation energy migration between the donors or the acceptors. Based on the results of the lifetime measurement and analysis, the probability of energy migration between Ce3+ and Tb3+ was enhanced with increasing Tb3+ concentration. Moreover, the lifetime analysis using the Inokuti–Hirayama model revealed that the dipole–quadrupole interaction dominantly occurs. Based on these measurements, Ce3+, Tb3+-doped SCBO has a good potential for near-ultraviolet LED phosphors. Moreover, the substitution of donors and acceptors for each individual site in the crystal structure is a useful design concept for highly efficient multicolour phosphors.
Conflicts of interest
There are no conflicts to declare.
Acknowledgements
Our research group thanks Prof. Dr Katsuyoshi Oh-ishi (Chuo University) for his assistance with the quantum yield measurements.
References
- X.-J. Zhao, Y.-X. Cai, J. Wang, X.-H. Li and C. Zhang, Appl. Therm. Eng., 2015, 75, 248 CrossRef.
- X. Long, J. He, J. He, J. Zhou, L. Fang, X. Zhou, F. Ren and T. Xu, Renewable Sustainable Energy Rev., 2015, 41, 29 CrossRef.
- H. Lin, T. Hu, Y. Cheng, M. Chen and Y. Wang, Laser Photonics Rev., 2018, 12, 1700344 CrossRef.
- Z. Xia and Q. Liu, Prog. Mater. Sci., 2016, 84, 59 CrossRef CAS.
- S. Li, R.-J. Xie, T. Takeda and N. Hirosaki, ECS J. Solid State Sci. Technol., 2018, 1, R3064 CrossRef.
- R. Ma and P. Dai, J. Lumin., 2022, 245, 118772 CrossRef CAS.
- Y. Zhang, L. Luo, G. Chen, Y. Liu, R. Liu and X. Chen, J. Rare Earths, 2020, 38, 1 CrossRef CAS.
- M. Zhao, Q. Zhang and Z. Xia, Mater. Today, 2020, 40, 246 CrossRef CAS.
- L. Wang, X. Wang, T. Kohsei, K. Yoshimura, M. Izumi, N. Hirosaki and R.-J. Xie, Opt. Express, 2015, 23, 28707 CrossRef CAS PubMed.
- L. Wang, R.-J. Xie, T. Suehiro, T. Takeda and N. Hirosaki, Chem. Rev., 2018, 118, 1951 CrossRef CAS PubMed.
- X. Zhang, H.-C. Wang, A.-C. Tang, S.-Y. Lin, H.-C. Tong, C.-Y. Chen, Y.-C. Lee, T.-L. Tsai and R.-S. Liu, Chem. Mater., 2016, 28, 8493 CrossRef CAS.
-
M. Pattison, N. Bardsley, M. Hansen, L. Pattison, S. Schober, K. Stober, J. Tsao and M. Yamada, Solid-State Lighting 2017 suggested Research Topics Supplement: Technology and Context, DOE EERE, 2017.
- S. Li, L. Wang, D. Tang, Y. Cho, X. Liu, X. Zhou, L. Lu, L. Zhang, T. Takeda, N. Hirosaki and R.-J. Xie, Chem. Mater., 2018, 30, 494 CrossRef CAS.
- M. Zhao, H. Liao, L. Ning, Q. Zhang, Q. Liu and Z. Xia, Adv. Mater., 2018, 30, 1802489 CrossRef PubMed.
- Y. Wang, T. Seto, K. Ishigaki, Y. Uwatoko, G. Xiao, B. Zou, G. Li, Z. Tang, Z. Li and Y. Wang, Adv. Funct. Mater., 2020, 30, 2001384 CrossRef CAS.
- T. Takeda, N. Hirosaki, S. Funahashi and R.-J. Xie, Chem. Mater., 2015, 27, 5892 CrossRef CAS.
- L. Liu, L. Wang, C. Zhang, Y. Cho, B. Dierre, N. Hirosaki, T. Sekiguchi and R.-J. Xie, Inorg. Chem., 2015, 54, 5556 CrossRef CAS PubMed.
- Z. Hao, J. Zhang, X. Zhang, S. Lu and X. Wang, J. Electrochem. Soc., 2009, 156, H193 CrossRef CAS.
- R. Yantake, M. Kaiheriman, T. Yusufu and A. Sidike, Sci. Rep., 2021, 11, 5123 CrossRef CAS PubMed.
- G. A. Sotiriou, D. Franco, D. Poulikakos and A. Ferrari, Nano Lett., 2012, 6, 3888 CAS.
- X. Zhang, L. Zhou, Q. Pang, J. Shi and M. Gong, J. Phys. Chem. C, 2014, 118, 7591 CrossRef CAS.
- W. Lu, N. Guo, Y. Jia, Q. Zhao, W. Lv, M. Jiao, B. Shao and H. You, Inorg. Chem., 2013, 52, 3007 CrossRef CAS PubMed.
- K. Li, M. Shang, H. Lian and J. Lin, J. Mater. Chem. C, 2016, 4, 5507 RSC.
- X. Zhang, Y. Huang and M. Gong, Chem. Eng. J., 2017, 307, 291 CrossRef CAS.
- H. Meyssamy, K. Riwotzki, A. Kornowski, S. Naused and M. Haase, Adv. Mater., 1999, 11, 840 CrossRef CAS.
- Z. Xia and R.-S. Liu, J. Phys. Chem. C, 2012, 116, 15604 CrossRef CAS.
- Y. Zhuo, S. Hariyani, J. Zhong and J. Brgoch, Chem. Mater., 2021, 33, 3304 CrossRef CAS.
- W. Xiao, X. Zhang, Z. Hao, G.-H. Pan, Y. Luo, L. Zhang and J. Zhang, Inorg. Chem., 2015, 54, 3189 CrossRef CAS PubMed.
- P. Wu, X. Tong, Y. Xu, J. Han, H. J. Seo and X. Zhang, Opt. Mater., 2019, 91, 246 CrossRef CAS.
- X. Fan, X. Sun, C. Liu, W. Tian, M. Li, Y. Luo and C. Wu, J. Lumin., 2022, 242, 118594 CrossRef CAS.
- W. Geng, X. Zhou, J. Ding and Y. Wang, J. Am. Ceram. Soc., 2018, 101, 4560 CrossRef CAS.
- H. Chen and Y. Wang, Inorg. Chem., 2019, 58, 7440 CrossRef CAS PubMed.
- R. Ma, D. Xu, Y. Yang, X. Su, B. Lei, Z. Yang and S. Pan, Dalton Trans., 2017, 46, 14839 RSC.
- R. Norrestam, Z. Kristallogr. - Cryst. Mater., 1989, 189, 1 CrossRef CAS.
- Y. Zhang, X. L. Chen, J. K. Liang, T. Xu and Y. P. Xu, J. Alloys Compd., 2001, 327, 132 CrossRef CAS.
- N. V. Kazak, N. A. Belskaya, E. M. Moshkina, L. N. Bezmaternykh, A. D. Vasiliev, S. N. Sofronova, R. M. Eremina, E. V. Eremin, A. R. Muftakhutdinov, M. A. Cherosov and S. G. Ovchinnikonv, J. Magn. Magn. Mater., 2020, 507, 166820 CrossRef CAS.
- H. Yang, C. Li, Y. Tao, J. Xu, G. Zhang and Q. Su, J. Lumin., 2007, 126, 196 CrossRef CAS.
- J. Ding, M. Kuang, S. Liu, Z. Zhang, K. Huang, J. Huo, H. Ni, Q. Zhang and J. Li, Dalton Trans., 2022, 51, 9501 RSC.
- W. Wang, T. Tan, S. Wang, S. Zhang, R. Pang, D. Li, L. Jiang, H. Li, C. Li and H. Zhang, Mater. Today Chem., 2022, 26, 101030 CrossRef CAS.
-
F. Izumi, The Rietveld Method, ed. R. A. Young, Oxford University Press, Oxford, Ch. 13, 1993 Search PubMed.
- K. Monma and F. Izumi, J. Appl. Crystallogr., 2011, 44, 1272 CrossRef.
- R. D. Shannon, Acta Crystallogr., Sect. A: Cryst. Phys., Diffr., Theor. Gen. Crystallogr., 1976, 32, 751 CrossRef.
- Z. Xia and A. Meijerink, Chem. Soc. Rev., 2017, 46, 275 RSC.
- G. Blasse and A. Bril, J. Chem. Phys., 1967, 47, 5139 CrossRef CAS.
- P. Dorenbos, J. Lumin., 2003, 105, 117 CrossRef CAS.
- P. Dorenbos, L. Pierron, L. Dinca, C. W. E. van Eijk, A. Kahn-Harari and B. Viana, J. Phys.: Condens. Matter., 2003, 15, 511 CrossRef CAS.
- P. Dorenbos, Phys. Rev. B: Condens. Matter Mater. Phys., 2002, 65, 235110 CrossRef.
- A. L. Allred, J. Inorg. Nucl. Chem., 1961, 17, 215 CrossRef CAS.
- P. Dorenbos, J. Phys.: Condens. Matter, 2003, 15, 4797 CrossRef CAS.
- P. Dorenbos, Phys. Rev. B: Condens. Matter Mater. Phys., 2001, 64, 125117 CrossRef.
- P. Dorenbos, ECS J. Solid State Sci. Technol., 2013, 2, R301 Search PubMed.
- Y. Jia, A. Miglio, S. Ponce, X. Gonze and M. Mikami, Phys. Rev. B, 2016, 93, 155111 CrossRef.
- J. Ueda, S. Matsuishi, T. Tokunaga and S. Tanabe, J. Mater. Chem. C, 2018, 6, 7541 RSC.
- F. Junqin, J. Cao, Z. Li, Z. Li, J. Li, J. Lin, W. Li, Z. Mu and F. Wu, Ceram. Int., 2019, 45, 20316 CrossRef.
- G. Li, Y. Wang, W. Zeng, W. Chen, S. Han, H. GuO and Y. Li, J. Mater. Chem. C, 2016, 4, 3304 RSC.
- S. Yang and S. Park, J. Alloys Compd., 2020, 834, 155094 CrossRef CAS.
- S. Liu, P. Sun, Y. Liu, T. Zhou, S. Li, R.-J. Xie, X. Xu, R. Dong, J. Jiang and H. Jiang, ACS Appl. Mater. Interfaces, 2019, 11, 2130 CrossRef CAS PubMed.
- K. Li, M. Shang, D. Geng, H. Lian, Y. Zhang, J. Fan and J. Lin, Inorg. Chem., 2014, 53, 6743 CrossRef CAS PubMed.
- X. Zhang, L. Huang, F. Pan, M. Wu, J. Wang, Y. Chen and Q. Su, ACS Appl. Mater. Interfaces, 2014, 6, 2709 CrossRef CAS PubMed.
- Z. Mazurak, M. Czaja, R. Lisiecki and J. Gabrys-Posarska, Opt. Mater., 2011, 33, 506 CrossRef CAS.
- X.-Y. Sun, S.-M. Huang, M. Gu, Q.-C. Gao, X.-S. Gong and Z.-P. Ye, Phys. B, 2010, 405, 569 CrossRef CAS.
- X.-Y. Sun, M. Gu, S.-M. Huang, X.-L. Liu, B. Liu and C. Ni, Phys. B, 2009, 404, 111 CrossRef CAS.
- G. Blasse, Philips Res. Rep., 1969, 24, 131 CAS.
-
R. Reisfeld, Rare Earths, Springer, Berlin, Heidelberg, 1991, p. 65 Search PubMed.
- M. Inokuti and F. Hirayama, J. Chem. Phys., 1965, 43, 1978 CrossRef CAS.
- Z. Xia and W. Wu, Dalton Trans., 2013, 42, 12989 RSC.
- X. Kang, S. Lu, H. Wang, D. Ling and W. Lu, ACS Omega, 2018, 3, 16714 CrossRef CAS PubMed.
- H.-Y. Chung, C.-H. Lu and C.-H. Hsu, J. Am. Ceram. Soc., 2010, 93, 1838 CAS.
- Q. Guo, L. Liao and Z. Zia, J. Lumin., 2014, 145, 65 CrossRef CAS.
- G. Li, S. Lan, L. Li, M. Li, W. Bao, H. Zou, X. Xu and S. Gan, J. Alloys Compd., 2012, 513, 145 CrossRef CAS.
Footnote |
| † Electronic supplementary information (ESI) available: Rietveld refinement, results of the Rietveld refinement, emission peak deconvolution, lists of the peak deconvolution, optical energy diagram, quantum efficiencies, and energy transfer efficiency. See DOI: https://doi.org/10.1039/d2ma01065h |
|
| This journal is © The Royal Society of Chemistry 2023 |
Click here to see how this site uses Cookies. View our privacy policy here.  Open Access Article
 *a,
Haruto
Sato
a,
Mizuki
Watanabe
 *a,
Kazuyoshi
Uematsu
b,
Mineo
Sato
b and
Kenji
Toda
a
![[thin space (1/6-em)]](https://www.rsc.org/images/entities/char_2009.gif) :
:![[thin space (1/6-em)]](https://www.rsc.org/images/entities/char_2009.gif) 0.01Ce3+, 0.15Tb3+ was reported to be 62% under the near UV excitation at 390 nm. In order to verify the potential of optical devices, particularly backlighting LEDs, the Rietveld refinement, photoluminescence properties, and decay curve analysis using the Inokuti–Hirayama model are described in this study.
0.01Ce3+, 0.15Tb3+ was reported to be 62% under the near UV excitation at 390 nm. In order to verify the potential of optical devices, particularly backlighting LEDs, the Rietveld refinement, photoluminescence properties, and decay curve analysis using the Inokuti–Hirayama model are described in this study.![[thin space (1/6-em)]](https://www.rsc.org/images/entities/char_2009.gif) 14–17 have been developed to achieve the DOE's target value for green emission phosphors. However, since these phosphors have challenges for practical use, the development of novel narrow green phosphors for pc - LEDs for the next-generation backlight is required.
14–17 have been developed to achieve the DOE's target value for green emission phosphors. However, since these phosphors have challenges for practical use, the development of novel narrow green phosphors for pc - LEDs for the next-generation backlight is required.
![[thin space (1/6-em)]](https://www.rsc.org/images/entities/char_2009.gif) :
:![[thin space (1/6-em)]](https://www.rsc.org/images/entities/char_2009.gif) Ca
Ca![[thin space (1/6-em)]](https://www.rsc.org/images/entities/char_2009.gif) :
:![[thin space (1/6-em)]](https://www.rsc.org/images/entities/char_2009.gif) B
B![[thin space (1/6-em)]](https://www.rsc.org/images/entities/char_2009.gif) :
:![[thin space (1/6-em)]](https://www.rsc.org/images/entities/char_2009.gif) Ce
Ce![[thin space (1/6-em)]](https://www.rsc.org/images/entities/char_2009.gif) :
:![[thin space (1/6-em)]](https://www.rsc.org/images/entities/char_2009.gif) Tb = 0.99 − y: 1
Tb = 0.99 − y: 1![[thin space (1/6-em)]](https://www.rsc.org/images/entities/char_2009.gif) :
:![[thin space (1/6-em)]](https://www.rsc.org/images/entities/char_2009.gif) 1.1
1.1![[thin space (1/6-em)]](https://www.rsc.org/images/entities/char_2009.gif) :
:![[thin space (1/6-em)]](https://www.rsc.org/images/entities/char_2009.gif) 0.01: y (y = 0, 0.01, 0.05, 0.10, 0.15 and 0.20), respectively; excess H3BO3 by 10 mol% over the stoichiometric ratio was added to suppress volatilization of B leading to impurities. The sorted raw materials were mixed in an agate mortar using acetone. After that, the mixtures were pressed into 1 mm diameter disk pellets under a 20 MPa pressure. The pelletized samples were placed within a BN crucible and heated at 1200 °C for 4 h in an N2 atmosphere of 0.9 MPa by means of a vacuum and press sintering furnace (VESTA, Shimadzu Mectem. Inc.).
0.01: y (y = 0, 0.01, 0.05, 0.10, 0.15 and 0.20), respectively; excess H3BO3 by 10 mol% over the stoichiometric ratio was added to suppress volatilization of B leading to impurities. The sorted raw materials were mixed in an agate mortar using acetone. After that, the mixtures were pressed into 1 mm diameter disk pellets under a 20 MPa pressure. The pelletized samples were placed within a BN crucible and heated at 1200 °C for 4 h in an N2 atmosphere of 0.9 MPa by means of a vacuum and press sintering furnace (VESTA, Shimadzu Mectem. Inc.).


![[thin space (1/6-em)]](https://www.rsc.org/images/entities/char_2009.gif) 273 cm−1 and 36
273 cm−1 and 36![[thin space (1/6-em)]](https://www.rsc.org/images/entities/char_2009.gif) 034 cm−1, respectively. Moreover, the crystal field splitting εcfs was estimated using the following eqn (4);49
034 cm−1, respectively. Moreover, the crystal field splitting εcfs was estimated using the following eqn (4);49
![[thin space (1/6-em)]](https://www.rsc.org/images/entities/char_2009.gif) 350 cm−1, while that in the ScO6 site was 34
350 cm−1, while that in the ScO6 site was 34![[thin space (1/6-em)]](https://www.rsc.org/images/entities/char_2009.gif) 555 cm−1. The Stokes shift value ΔS is simply explained using the following eqn (6);52
555 cm−1. The Stokes shift value ΔS is simply explained using the following eqn (6);52![[thin space (1/6-em)]](https://www.rsc.org/images/entities/char_2009.gif) 342.9 cm−1 (411 nm) and −3500.0 cm−1 (−2857 nm), respectively, indicating that the observed emission band peaked around 440 nm of SCBO:0.01Ce3+ is close to the predicted emission energy in the CaO6 site. Hence, Ce3+ is preferentially occupied on the CaO6 site rather than the ScO6 site; the optical energy diagram of Ce3+ in the CaO6 polyhedron in the SCBO structure is shown in Fig. S3 (ESI†).
342.9 cm−1 (411 nm) and −3500.0 cm−1 (−2857 nm), respectively, indicating that the observed emission band peaked around 440 nm of SCBO:0.01Ce3+ is close to the predicted emission energy in the CaO6 site. Hence, Ce3+ is preferentially occupied on the CaO6 site rather than the ScO6 site; the optical energy diagram of Ce3+ in the CaO6 polyhedron in the SCBO structure is shown in Fig. S3 (ESI†).


 is the gamma function (s = 6; 1.77, s = 8; 1.43 and s = 10; 1.30), respectively. Based on this principle, we conducted the curve fitting for SCBO:0.01Ce3+, 0.15Tb3+, which are shown in Fig. 7. The indicator of the goodness-fit of decay curve fitting by means of the I–H model is determined by the figure of merit (FOM). Consequently, the FOM value is found to be the lowest value at 0.0898 in s = 8 (dipole–quadrupole). Many kinds of Ce3+, Tb3+ co-doped phosphors exhibit the dipole–quadrupole interaction due to the energy transfer between Ce3+ with spin-allowed transition and Tb3+ with spin-forbidden transition.66–70 Therefore, dipole–quadrupole interaction in SCBO:Ce3+, Tb3+ is reasonable.


