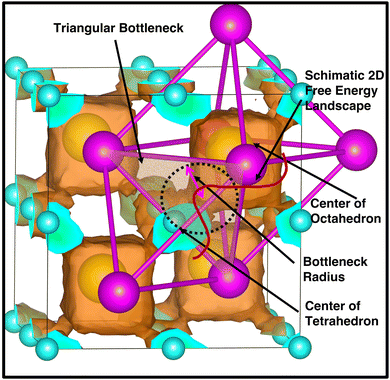
 Open Access Article
The role of cation size in the ordered–disordered phase transition temperature and cation hopping mechanism based on LiCB11H12†
Kartik
Sau
 *ab,
Shigeyuki
Takagi
 c,
Tamio
Ikeshoji
 b,
Kazuaki
Kisu
 c,
Ryuhei
Sato
 a and
Shin-ichi
Orimo
 *ac
*ac
aAdvanced Institute for Materials Research (WPI-AIMR), Tohoku University, Aoba-ku, Sendai 980-8577, Japan. E-mail: kartik.sau@gmail.com; shin-ichi.orimo.a6@tohoku.ac.jp
bMathematics for Advanced Materials Open Innovation Laboratory (MathAM-OIL), National Institute of Advanced Industrial Science and Technology (AIST), c/o Advanced Institute for Materials Research (WPI-AIMR), Tohoku University, Sendai 980-8577, Japan
cInstitute for Materials Research (IMR), Tohoku University, Sendai 980-8577, Japan
First published on 3rd April 2023
Abstract
Complex hydrides are of great interest for being potential candidates for the solid electrolyte of all-solid-state batteries owing to their exceptionally high ionic conductivity at high temperatures. Hereafter, we study a model system (LiCB11H12) using molecular dynamics (MD) simulations based on a reported force field to investigate the role of cation size in the ordered–disordered phase-transition temperature (Ttran) and cationic diffusion. The MD results indicate that the lowering of Ttran is due to the high cell volume (by introducing a large-size cation) that eases the anionic rotation. The results are further confirmed by performing a few additional MD simulations by keeping a fixed cation size while varying cell volumes. In addition, the study provides insights into the cationic density distribution, the bottlenecks of the cationic path, and its hopping mechanism with increasing cationic sizes. These findings are of fundamental importance for achieving a lower transition temperature and higher cationic diffusion for practical applications.
I. Introduction
Batteries have been playing a significant role in meeting the skyrocketing demand for electronic devices and fully electric vehicles. However, the current battery technology based on conventional Li-ion batteries does not satisfy the consumers’ needs.1–6 All-solid-state batteries (ASSBs), being safer than liquid- or polymer electrolyte-based batteries and having a higher energy density and longer life cycles, are a possible alternative. In the last couple of decades, significant progress has been made in the development of ASSBs7 largely based on Li+ ion conduction,8–14 where high ionic conductivity is one of the inevitable prerequisites for electrodes and electrolytes. The most popular electrolytes in ASSBs are Li10GeP2S12 (LISICON-like),15 Li6PS5Br (argyrodite),16,17 complex metal-hydrides ( , where M can be replaced with alkali or alkaline-earth atoms, and
  can be replaced with anions: BH4−,18,19 B6H62−, B10H102−, CB9H10−, B12H122−, and CB11H12−),20 Li6.55La3Zr2Ga0.15O12 (garnet),21,22 Li1.2Al0.2Ti1.8(PO4)3 (Na superionic conductor or NASICON-type),23 and Li0.34La0.51TiO2.4 (perovskites),24,25 in which the ionic conductivity is comparable with current liquid electrolytes.
Among the mentioned classes of materials, complex metal hydrides have recently attracted attention26 owing to their exceptional high cationic conductivity, low density, low toxicity, and soft mechanical properties.27 The anions in this type of materials are identified at body-centered, face-centered (Fig. 1) or hexagonal-close-packed positions, whereas Li+ ions are found at the interstitial positions of anions. The shapes of the anions are large-quasispherical (CB11H12 or CB11H12) or ellipsoidal cage-like (B10H10 or CB9H10). At a low temperature, the structure, often called an ordered structure, is well defined and symmetric (Fig. 1(a)), whereas at a high temperature, the anions are in the disordered state exhibiting high rotation, and atomic coordinates (C, B, and H) of an anion are not well defined (Fig. 1(b)). Despite high rotation of the anions in the disordered state, their average center of mass is remained fixed at their individual equilibrium sites. The system exhibits a sharp cation-conductive transition above the ordered–disordered phase-transition temperature (Ttran), associated with high anionic rotation.28–35 The anionic rotational disorder typically generates several cationic sub-lattices for facile cationic diffusion,36 as anionic rotation flattens the potential energy landscape for cation translational motions.37–40 However, these sublattice structures are usually accessible for smaller cations (Li+, Na+, and Ag+), as reported in the recent studies.4,29–34,41–43 In addition, the ordered–disordered transition occurs at elevated temperatures, which makes this material unfavorable for practical use.
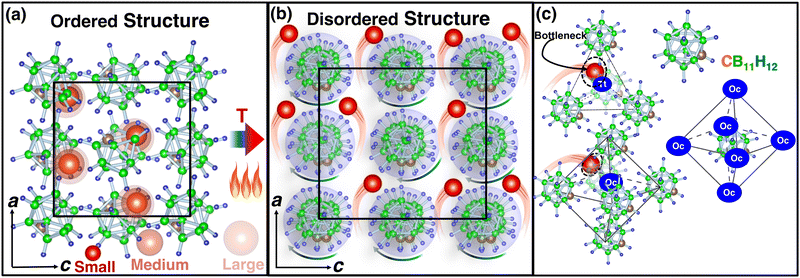 | ||
| Fig. 1 (a) Ball-and-stick model of low-temperature ordered LiCB11H12 (the occupancy of Li, C, B, and H at each site is 1.0 with a smaller unit cell size),57 whereas (b) shows the high-temperature disordered structure (anion center remains ordered) with site occupancy less than unity and high anionic rotation is indicated by an arrow. In this case, the bigger unit cell size indicated the volume expansion because of the high-temperature. The a- and c-axes are also shown, and black lines indicate the unit cell. (c) A tetrahedral (Tt) void formed by four anions and an octahedral (Oc) void formed by six anions are shown. The anions are also surrounded by six such Oc sites or voids. Several cation sizes are indicated using different opacities. The corner-shared triangular faces of Oc or Tt are the geometrical bottleneck along the cationic path. The geometrical bottleneck radius is also marked by dotted circles. The red, brown, green, and blue balls represent Li, C, B, and H, respectively, for all cases. | ||
To overcome the mentioned issue, several strategies have been implemented to achieve a lower Ttran, such as
1. Using monovalent ions (CB11H12−40,44 or CB9H10−) instead of a divalent anion (B12H122−) that also enhances the cationic vacancies in the system enabling higher cationic diffusion;
2. Alloying two different types of closo-borane45,46 improves the space inside the structure for easing anionic rotation.
Furthermore, substituting larger alkali-metal cations, such as K+, can result in similar favorable ordered–disordered structural transitions at reasonably low temperatures, although K+ ion conductivity is reasonably low.47 A similar phenomenon was identified in the case of molten salts (CsCl shows a lower melting point than NaCl or KCl).48 Despite several experimental studies, the fundamental understanding of hydrides is still vastly speculative; thus, a thorough theoretical simulation study is required to guide the synthesis of a suitable material with a lower Ttran and higher cationic conductivity. Inspired by recently reported work on KCB11H12 by Dimitrievska et al.,47 we conducted molecular dynamics (MD) simulations by systematically varying the cation sizes (essentially by tuning the reported force-field), which was impossible in the first principles-based MD simulation or through experiments. MD simulation has emerged as one of the first growth techniques for understanding the atomistic mechanisms at the atomic level49 while avoiding the gap between theory and experiment. Silver iodide,50,51 β-alumina,52 and Na1+xZr2SixP3−xO12 (NASICON) (0 ≤ x ≤ 3)53 and a variety of oxides54,55 are examples of this successful technique. However, the results of MD simulation strongly depend on how good the inter-atomic potential is. Recently, we developed an interatomic potential parameters model for complex metal hydrides44,56 to perform MD studies that represented ordered–disordered phase transition behavior for Li2B12H12 and LiCB11H12 as reported in the experiments, and provided several structural insights and information on the hopping mechanism of cationic diffusion for LiCB11H12 which are experimentally challenging to report due to high anionic rotation above Ttran.57
In this study, we gained further insights into the relationships between cation size and Ttran, and cationic hopping mechanisms using predefined force-field-based MD simulations while using the low-temperature structure of LiCB11H1257 (Fig. 1(a)). The existing bottleneck radius along the cationic conduction path (Fig. 1(c)) also plays a major role in cationic conduction, which was vastly studied in the other materials (NASICONs58,59 and Li10GeP2S1260), and remains an untouched area in complex hydrides, which shall be thoroughly studied in this paper. Herein, we used the same structure as LiCB11H12 and systematically varied the cation sizes to avoid the complex role of anionic arrangements (different types of structures are identified for the Na and K counterparts,47 where a different anion arrangement also plays a specific role).
II. Methodology
A. Inter-atomic potential
To conduct MD simulations, we used, as previously reported, a combination of Buckingham, harmonic bond, and angle-type potentials:44| U(r,θ) = UCoulomb+Buckingham(r) + Ubond(r) + Uangle(θ) | (1a) |
 | (1b) |
 | (1c) |
 | (1d) |
B. Computational details
Using the previously reported parameters listed in Table 1, we conducted a series of isothermal–isobaric (NPT) MD simulations in the temperature range of 325–525 K with 12 K (some cases 25 K) intervals, and zero atmospheric pressure. The NPT-MD method,61 which allows changing the simulation box sizes while keeping the angles fixed, was employed. The temperatures and pressure within the system were controlled using thermostatting and barostatting techniques, where some dynamic variables are coupled with particle velocity and simulation box dimensions. We chose the default parameters for the Nose–Hoover thermostatting (100 times of time step) and barostatting (1000 times of time step), as mentioned in the LAMMPS software package.62 In the thermostatting case, essentially, a fictitious particle transfers heat from a heat bath to the system, and the parameters indicated in the NPT-MD is equivalent to its mass, although the unit of measurement is not mass. By adjusting this parameter, we can control the particle's inertia. If the value is too small or too large, it may lead to higher temperature fluctuations. This is similar to the barostatting case. It should be noted that the simulations commenced from the reported low-temperature ordered-phase X-ray diffraction structures57 for the LiCB11H12-system.| Species (M) | q M (e) | A M–Li (eV) | A M–B (eV) | A M–H (eV) | ρ M–Li (Å) | ρ M–B (Å) | ρ M–H (Å) |
|---|---|---|---|---|---|---|---|
| k BB = 5.375 Å2 eV, rBB0 = 1.76 Å (equilibrium bond length), kCB = 5.375 Å2 eV, rCB0 = 1.76 Å (equilibrium bond length), kBH = 9.89 Å2 eV, rBH0 = 1.2 Å (equilibrium bond length), kCH = 150.5 Å2 eV, rCH0 = 1.09 Å (equilibrium bond length), kBB–H = kB–C–H = kCB–H = 0.86 rad2 eV, θ0 = 2.077 rad (equilibrium angle), and CH–H = 4.3086 Å6 eV.a The value used from the reported literature.44b Different values 46.08, 119.8, and 163.17 are used here for mimicking small, medium, and large cations, respectively. | |||||||
| Li | 0.75 | 0.0 | 46.08 | 76.4b | 0.4000 | 0.2853 | 0.3023 |
| C | 0.75 | 46.08 | 0.0 | 0.0 | 0.2853 | 0.0 | 0.2853 |
| B | 0.0 | 80.78 | 0.0 | 0.0 | 0.2853 | 0.0 | 0.2853 |
| H | −0.125 | 76.4 | 0.0 | 2175.5 | 0.3023 | 0.2853 | 0.20855 |
Herein, we tuned the Li–H repulsive parameters to mimic different sizes of the cation, where three different sets of parameters were used for the three different sizes of cations (small, medium, and large), as presented in Table S1 (in the ESI†). The interaction of the M–H (M = small, medium, and large) pair as a function of distances for different interaction parameters are presented in Fig. 2. For the larger cations, the minima were shifted at larger distances mimicking larger cation sizes. The Li–B interaction was not modified, as the cations are usually far from the B atom. Throughout the paper, the three different Li–H interactions are indicated as small-, medium-, and large-sized cations, respectively.
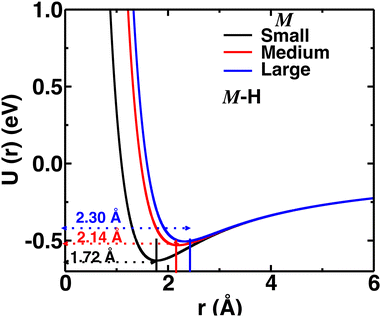 | ||
| Fig. 2 Pair–wise interaction (U(r) vs. r) for different M–H short-rang parameters mimicking small-, medium-, and large-sized cations. The distances of potential minima are also indicated. | ||
We performed three sets of runs using three different M–H interactions for the previously mentioned temperature range, even though the starting structure for all the simulations was the same as the low-temperature ordered structure reported by Tang et al.57 for LiCB11H12. We adopted the above conditions to avoid the complex chemical nature of the different cations. The simulated supercell consisted of 4 × 4 × 4 unit cells comprising 6400 atoms in an orthorhombic symmetry following Pca21 (no. 29). A time step of 0.5 fs was applied for integration of force using the velocity Verlet algorithm. A typical runtime of 2 ns or longer was used with trajectory samples stored at intervals of 500 fs for detailed analyses, and statistical time averages typically were calculated over the last 1 ns interval. Numerically, to guarantee the thermodynamic convergence properties, a few longer runtime simulations of 10 ns were separately performed. The properties remained the same for a longer time simulation. Periodic boundary conditions in all three directions and the Ewald summation technique for converging long-range Coulomb interactions were applied. A cutoff distance of 13 Å was used for both the short-range interactions and the short-range part of the Ewald summation. A few micro-canonical MD (NVE-MD) simulations were further conducted at 475 K using the final structure obtained from the NPT-MD simulations.
Moreover, we conducted three additional NVE-MD runs at 475 K while keeping Li–H interaction unchanged, same as reported,44 for the three different cell volumes, which were respectively selected similar to the cell sizes of the cations (small (VSmall), medium (VMedium), and large (VLarge)). In short, we fixed the cation size and varied the cell volume. Maintaining a constant cation size while varying the cell volume is necessary to comprehend the impact of cell volume on cationic diffusion.
C. Estimation of key quantities
Cation transport and anionic stability were examined by calculating the mean square displacement (MSD) of both cations and anions following Einstein's relation. The self-diffusion coefficient was calculated from the slope of the MSD for the three-dimensional transport as follows: | (2a) |
 | (2b) |
![[r with combining right harpoon above (vector)]](https://www.rsc.org/images/entities/i_char_0072_20d1.gif) j(t) is the position vector of the jth ion at time t; t′ is the time difference; and the angular bracket is the average over several points in time. The diffusion coefficient, D, depends on the temperature (T) according to the Arrhenius equation:
j(t) is the position vector of the jth ion at time t; t′ is the time difference; and the angular bracket is the average over several points in time. The diffusion coefficient, D, depends on the temperature (T) according to the Arrhenius equation: | (3) |
The anionic reorientational motion is directly identified by calculating the angular autocorrelation function (ζ) of anions:
ζ(t′) = 〈![[r with combining right harpoon above (vector)]](https://www.rsc.org/images/entities/i_char_0072_20d1.gif) (t + t′)· (t + t′)·![[r with combining right harpoon above (vector)]](https://www.rsc.org/images/entities/i_char_0072_20d1.gif) (t)〉 (t)〉 | (4) |
![[r with combining right harpoon above (vector)]](https://www.rsc.org/images/entities/i_char_0072_20d1.gif) (t), and
(t), and ![[r with combining right harpoon above (vector)]](https://www.rsc.org/images/entities/i_char_0072_20d1.gif) (t + t′) denote the vector connecting from the center of mass of anions to B, C, or H in the same anion at time t and t + t′, respectively. This function typically shows an exponential decay (
(t + t′) denote the vector connecting from the center of mass of anions to B, C, or H in the same anion at time t and t + t′, respectively. This function typically shows an exponential decay ( ) within a short time with a decay rate λ. The anion reorientational activation energy (Era) is calculated using the Arrhenius equation:
 | (5) |
We calculated the “self” part of the van Hove correlation function, GS(r,t′), to understand the cationic hopping mechanism following the formula63
 | (6) |
The potential energy of individual cations is calculated as
 | (7) |
 | (8) |
III. Results and discussion
A. Structure and phase transition
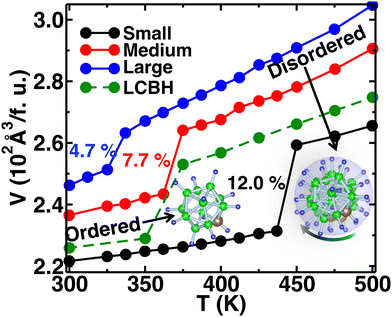
We increased the temperature systematically; after a certain level, the anions started rotating around the center of mass, which remained translationally immobile at the crystallographic position (Fig. 1(b)), as reported in our previous study,56 where a higher temperature, octahedral (Oc) sites and tetrahedral (Tt) sites were identified, and the surroundings of Oc and Tt-sites are shown in detail in Fig. 1(c). The Oc Li-sites are the center of an octahedron formed by connecting anions, whereas the Tt Li-sites are the center of a tetrahedron formed by connecting anions. Interestingly, all the anion centers are also a center of six octahedral Li-sites. At a high temperature, anionic rotation leads to a high volume change,44 as shown in Fig. 3. It exhibits a general trend; the cell volume increases with increasing temperature and shows an abrupt volume change at a particular temperature because of anion rotation, indicating an ordered–disordered phase transition. Another obvious trend is that the cell volume increases with increasing cationic sizes due to the higher cation–anion repulsion. The most interesting result here is the systematic reduction of Ttran with increasing cationic sizes, consistent with the previously reported literature, where a systematic lower Ttran was identified from Li to K in ACB11H12 (A = Li, Na, and K).47 The percentage of volume expansion (δ) at the disordered phase relative to the ordered phase near the transition point also reduces systematically with increasing cation sizes, as listed in Table 2. The difference in transition temperature from experimental and MD simulations could be possibly because of the different M–H interaction potential parameters compared to real Li, Na, and K-systems, i.e., the small system does not correspond to the Li-system. Our primary focus is to capture the transition temperature qualitative trend by varying cation sizes. Since the larger size cation introduces extra inter-anion space,47 it offers higher freedom to the anion. In other words, smaller δ generates higher disorder in the system, which lifts the system to the disordered phase. It is also worth noting that a too-large simulation cell (a too-small δ) leads to an unstable system, which was observed in the MD simulation, while we accommodated an even larger sized cation.| Cation Size | MD | Expt.47 | MD |
|---|---|---|---|
| T tran (K) | T tran (K) | V change (δ) | |
 V
t = cell volume just before the transition point. Ve = extrapolated cell volume just after the transition point.
 |
|||
| Small | 425 | 385 (Li) | 12.0 |
| Medium | 375 | 380 (Na) | 7.7 |
| Large | 350 | 365 (K) | 4.7 |
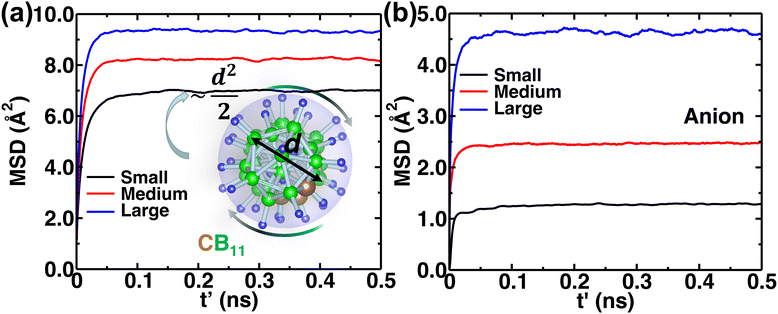
The MSD of both cations and anions plays an important role in understanding the transport properties of cations and the structural stability of anions with varying cation sizes, respectively. The MSD of the anion (not distinguishing B or C atoms), and its center of mass were calculated at the upper-temperature end (475 K) (Fig. 4), which saturates quickly because of high anionic rotation; the saturation value is close to the half square diameter of the anion (distance of B or H to the center of mass of closo-borane), indicating indirectly a full rotational mobility and translational immobility of anions. The evidence of direct rotational mobility will be discussed in the next paragraph by calculating the angular auto-correlation function using eqn (4), whereas the immobility of anions is further confirmed by showing a low MSD value of the center of mass of anions and its saturation (Fig. 4(b)). Despite the high rotational mobility, the anions are stable at their crystallographically reported face-centered position for the different cation sizes. It is important to note that the MSD values of the center of mass (CM-MSD) of anions systematically increase with the increasing cationic size (Fig. 4(b)). Essentially, the larger CM-MSD value implies a larger fluctuation in CM-anions that could increase the effective anionic radius. The influence of an effective increase in anionic radius will be discussed in the next section.
B. Anionic rotation and cationic diffusion
To quantify the rate of anionic rotation after the Ttran, we calculated the anionic angular autocorrelation function, ζ, using eqn (4). Theoretically, after the ordered–disordered transition, the function ζ decays exponentially within a short period, and the decay rate, λ, presented in Fig. 5, as a function of 1000/T follows an Arrhenius behavior. The activation energies of anionic reorientation, Era, for different cation sizes were calculated from the fitted straight line using eqn (5), where the Era remains almost the same (0.12, 0.15, and 0.13 eV for small-, medium-, and large-sized cations, respectively) in agreement with the previous reports.40,47 Although, the Era does not show any systematic trend, the decay rates, λ, do. In contrast, a systematically lower λ of anions is identified from small to large-sized cation cases. The possible reason could be because of the λ0.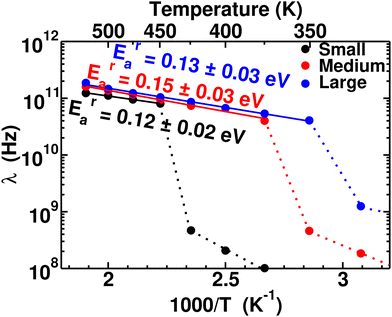 | ||
| Fig. 5 Anionic reorientational decay rate λ as a function of 1000/T for the MCB11H12 (M = small, medium, and large) system (325–550 K with an interval of 25 K). The continuous line lines are fitted from the data points after the transition, and activation energies of anion reorientation are calculated from the slope of the fitted line following eqn (3). The dotted lines indicate just connecting the data points below the ordered–disordered temperatures. | ||
Typically the systems (closo-boro hydrides or other classes of superionic conductors67,68), where there is no direct connectivity among the anions, cationic diffusion was found to be strongly associated with the anionic reorientational motion after the ordered–disordered transition, as reported in previous studies.37,42,44,56,57,65,69 The activation energy of the cationic diffusion, Eda, was calculated from the diffusion coefficient, D (the slope of the MSD in the diffusive region after the transition), for several temperatures according to eqn (3). The plot of the logarithm of D versus the inverse temperature (1000/T) is presented in Fig. 6, from where Eda can be calculated using the slope of the straight line from the high-temperature phase. It is worth noting that the differences in diffusion coefficient between the low and high conducting phases are significant, spanning two to three orders of magnitude. We also observed that this difference tends to decrease as cationic sizes increase. This is expected, as larger cationic sizes result in a larger cell volume, facilitating higher cationic diffusion. The activation energies (Eda) after the phase transition are found to be 0.17 ± 0.02, 0.23 ± 0.05, and 0.29 ± 0.08 eV for small-, medium-, and large-sized cations, respectively, which follows a systematic trend unlike the case for Era. A larger statistical error in the Eda value for larger cation cases originates from the diffusion coefficient calculated in a lower temperature range compared to the small-sized cation, as depicted in Fig. 6. Until now, it is quite clear that two factors worked together for the cationic diffusion:
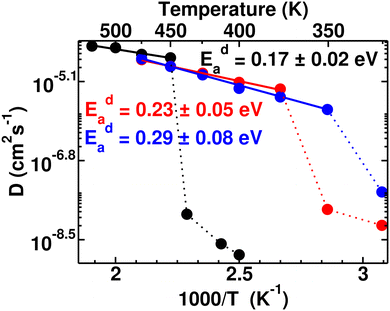 | ||
| Fig. 6 Arrhenius plot of the cationic diffusion coefficient for several temperature ranges (ln(D) vs. 1000/T) of the MCB11H12 (M = small, medium, and large) system (325–550 K with an interval of 25 K). The data points below Ttran are shown in dotted lines, where diffusivity is significantly low including large statistical errors. The straight lines (continuous) are fitted from the data points and activation energies are calculated from the slope of the straight line following eqn (3). | ||
1. The higher anionic reorientational rate, λ, favored a facile cationic diffusion.
2. In contrast, the larger cationic size hindered facile cationic diffusion.
Herein, the larger cation size dominates over the higher anionic reorientational rate, resulting in a relatively higher Eda or lower cationic diffusion, as presented in Fig. 6, following the reported trend for ACB11H12-systems (where A = Li, Na, and K).47 Furthermore, a larger fluctuation of CM of anions for larger-sized cations (Fig. 4(b)) could effectively increase the anionic radius, offering a narrower corridor for the lower cationic diffusion. Therefore, we conclude that the lower cationic diffusion for the systematically increasing cationic sizes is reasonable. Consequently, the present MD simulation successfully represents several trends such as Ttran, anionic rotational, and cationic diffusion for different cation sizes in accordance with the reported experimental results.
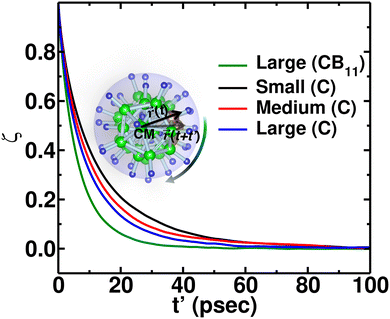
Additionally, anionic rotation and its valuable insights are investigated in this paragraph, as this information is not yet studied in detail. We calculated the anionic angular autocorrelation functions separately for C (ζC) in an anion and compared them with the angular auto-correlation of anion, ζCB11, (not distinguishing C or B), as displayed in Fig. 7. Interestingly, the ζC shows a slower decay than ζCB11. This behavior is identified for all the cation size cases (Fig. 7, in which we only compare for the large-sized cations), whereas the ζC systematically follows the same trend as the gross anionic reorientational rate. The slower decay of ζC compared with ζCB11 is mainly due to the higher Coulombic charge of C compared with B (Table S1 in the ESI†). The high charge on C leads to a stronger interaction with the surroundings (mostly the cations), which is against the faster C rotational motion.
C. Atomistic mechanisms and cationic path
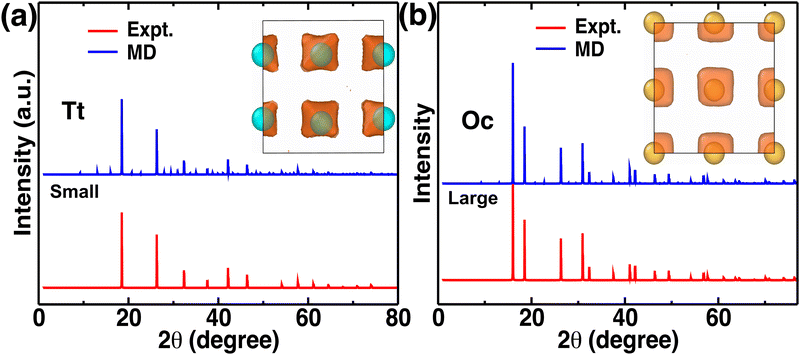
Atomistic insights are the origins of different macroscopic behaviors with increasing cationic sizes and the factors that are responsible for fast cationic motion. A three-dimensional isosurface population density was calculated for cations along with H, as presented in Fig. 8(a), (b), and (b) for the small-, medium-, and large-sized cations, respectively. The cationic density pattern demonstrates a significant difference with increasing cation sizes. There are two high-density sites; one is surrounded by four anions, which is favorable for the small-size cation, whereas the other less-preferred high-density sites are surrounded by six anions. The site preference changes from small to large-sized cation cases. To understand the high-density site location with high precision, we performed X-ray diffraction (XRD) pattern calculation by placing the atoms at the highest population density locations for small-, and large-sized cation cases (Fig. 9). For comparison, we also included XRD for the Tt- and Oc-sites, and both the peaks (MD sites and crystallographic Oc- and Tt-sites) are consistent, which reconfirms that the high-density sites’ areas are Oc-, and Tt-sites. Most importantly, there is a transition from the Tt-site occupancy to the Oc-site occupancy with increasing cation sizes, which was also speculated in the previous report.47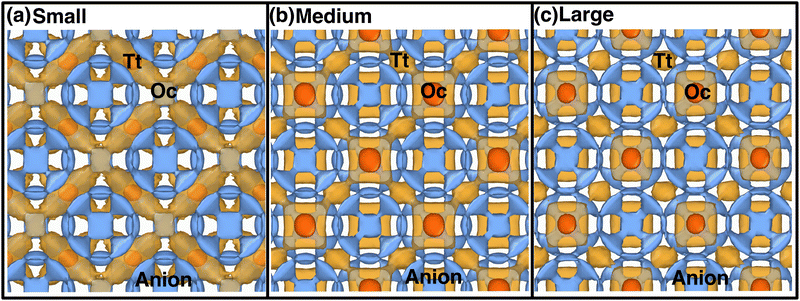 | ||
| Fig. 8 Isosurface density plots of the cation (isovalues of 2 × 10⁴ Å−3 (orange) and 6 × 10⁵ Å−3 (red)) and H-atom for MCB11H12 (M = small, medium, and large) in a 2 × 2 × 2 supercell obtained using OVITO70 software at 475 K from NVE-MD simulations. (a) Isovalue 7.5 × 10⁻⁵ Å−3 (blue) for small-sized cation. (b) Isovalue 7.5 × 10⁻⁵ Å−3 (blue) for medium-sized cation. (c) Isovalue 7.5 × 10⁻⁵ Å−3 (blue) for large-sized cation. Tt- and Oc-sites formed by anions are marked. We choose different H isovalues for different sizes of cation cases for better visualization. | ||
To understand the reason behind the switching of the transition in occupancy, the energy of individual cations was calculated using eqn (7) and merged them in a single unit cell, then we counted the potential energy and number of particle in a three-dimensional grid. Finally, we calculated the average energy by diving the total count in each grid (averaging was also done over the number of frames) and represented it in a three-dimensional isosurface plot (Fig. 10). For small-sized cations, the Tt-sites are energetically favorable because of the stronger Coulombic attraction of cations at the Tt-site and monovalent anions (Fig. 10(a)). While cation size increased the short-range repulsion between cations occupying the Tt-sites and anions is stronger, as the anion to Tt-site distance is shorter (≈ 4.15 Å) than the anion to Oc-site distance (≈ 4.79 Å). Thus, the stronger short-range repulsion for the large-sized cations dominates over the Coulombic attraction, as displayed in the potential energy landscape (potential energy isovalue for small-, medium-, and large-sized cation cases were −1.70, −1.79, −1.85 eV, respectively). It modifies the potential energy landscape significantly for the cation movement and the Tt-site becomes energetically less favorable. However, the Oc-sites, which are slightly far from the anion center facing lower repulsion, are found to be energetically favorable, as identified in the energy profile in Fig. 10(b) and (c). The above scenario is demonstrated graphically using a schematic diagram of free energy variation (following eqn (8)) along with the potential energy while increasing cation sizes (represented in the bottom row in Fig. 10).
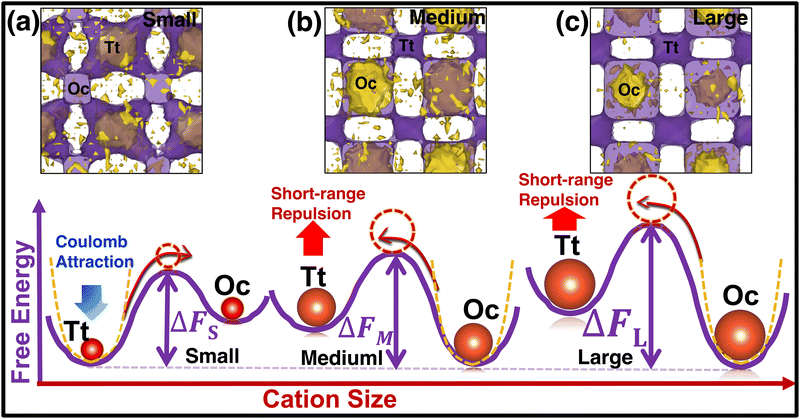 | ||
| Fig. 10 (Top row) Free-energy Isosurface plots in purple (calculated using eqn (8)) combined with the potential energy of the cations (yellow) using eqn (7) in a single unit cell. The small-, medium-, and large-sized cation cases are marked by (a), (b), and (c), respectively. The isovalue of 0.07 eV value is used for all three cases, whereas −1.89, −1.75, and −1.70 eV are used for potential energy isosurface (yellow) for the small-, medium-, and large-sized cations, respectively. (Bottom row) Schematic representation of two-dimensional free energy distribution from Tt to Oc-sites. The favorable potential energy schematic diagrams are also added using yellow dotted lines. | ||
Therefore, the density pattern and energy landscape clearly indicate different cation hopping mechanisms while increasing cationic sizes. In this context, we calculated the self-part of the van Hove correlation function, Gs(r,t′), for two different cation sizes (small, and large) to understand the hopping mechanism (Fig. 11). Fig. 11(a) and (b) demonstrate two distinct behaviors: the first peak and second peak for small-sized cations are not well separated, as Oc–Tt distance and Tt–Tt distances are closer (≈ 5 Å) and the number of Tt-sites two times more enabling faster cationic diffusion. Thus, the hopping mechanism for the small-sized cation case is Tt to Tt via meta-stable Oc sites, as is already reflected in Fig. 8, whereas there is a distinct second peak in the case of a large-sized cation, which is at a distance near 7 Å (the Oc to Oc site distance is 6.77 Å), and thus the hopping mechanism is Oc to Oc via meta-stable Tt-sites. Therefore, the different type of cation hopping behavior is reconfirmed by analyzing Gs(r,t′).
The bottleneck radius along the cationic path plays an important role in determining the cationic path at the high conducting phase, which is one of the untouched areas in this material. As there are many H-atoms in this system, it is complicated to define the bottleneck with respect to the H. Therefore, the bottlenecks are defined with respect to the anion centers, as shown in Fig. 12 along with the isosurface density plot for the large-sized cation. Interestingly, the cationic path follows through the center of the triangular bottlenecks, which are the triangular faces of octahedron and tetrahedron formed by the connecting center of anions. The bottleneck radius, the inner circle of the triangle, was calculated for all the cases (small-, medium-, and large-sized cations). The bottleneck radii are 3.9, 4.2, and 4.4 Å for the small-, medium-, and large-sized cations, respectively. The calculated bottleneck radius, in this case, is larger than the reported bottleneck for the other systems (NASICONs71), which is because of the calculation method; we choose the anion center instead of the H. Interestingly, the bottleneck radius systematically increases with increasing the cationic sizes, as expected, and it is in favor of the high cationic diffusion.71 However, the incremental effective bottleneck radius may not be big enough for the larger-sized cations, hindering cationic diffusion.
To reconfirm our findings, we further conducted a few MD simulations, keeping the cation size fixed as Li+, while varying the cell volumes (detailed in the Section 2). The anionic rotational motion systematically increases with increasing cell volume (Fig. S1 in the ESI†), whereas the anionic motion is faster than the rotational motion of individual C (Fig. 13(a)), following a similar rotational trend as reflected for several cation size cases (Fig. 7). The anion CM-MSD also followed a similar trend, i.e., the CM-MSD saturation value systematically increases with increasing cell volume. However, the cationic MSD followed a trend opposite to that of different cationic size cases. The MSD of cations systematically increased with the increasing cell volume, which was expected; a bigger cell size offered a wider corridor (bottleneck) for fast cationic diffusion. We also focussed on how the cation occupancy varies while systematically increasing the cell volumes by displaying isosurface density plots for cations and H (Fig. S2, ESI†). Interestingly, the cation density systematically switches from the Oc-site to the Tt-site on increasing the cell sizes. In the case of the smaller cell size, the cations at the Tt-sites and anion are in closer proximity; thus, the stronger short-range repulsion makes the Tt-site less favorable for the cations, while the Oc-sites are more favorable, as they are at a far distance. On the other hand by using a large-sized simulation cell, the short-range repulsion between cations at the Tt-site and anions can be reduced, allowing the Tt-site to become accessible. Moreover, Tt-sites are more in number which favors facile cationic diffusion, which is also identified for the smaller-sized cation case (Fig. 8(a)).
A summary of findings is listed in Table 3 and also displayed in a three-dimensional chart plot in Fig. 14, where we found two different directions: (1) smaller sized cation improved the cationic diffusion, whereas Ttran was not favorable (high). (2) On the other hand, larger-size cations produced lower Ttran, however, cationic diffusion was low. Furthermore, the previous paragraph concluded that the larger cell size was in favor of high cationic diffusion and higher anionic reorientational motion, which could also reduce the Ttran because of the larger interstitial space, facilitating the anionic rotation. Thus, a guideline would be keeping smaller size cations or same size cation in a larger cell, which could be achieved by adding a neutral molecule (H2O or NH4). A similar behavior was reported by Kisu et al.72 recently in MgB12H12·12H2O. It exhibits a higher ionic conductivity for the 12H2O case than for a less water case (6H2O), which provides a smaller cell volume. Even though the water molecule may have a complex role in this case, which are beyond the scope of this study.
| Cation size | M–H | T tran | Expt. | V change (δ) | Expt. | E ra (eV) | Expt. | E da (eV) | Expt. | Site occupancy |
|---|---|---|---|---|---|---|---|---|---|---|
| (Å) | MDa | MDa | MDa | MDa | MDa (high-low) | |||||
| a This work. | ||||||||||
| Small | 1.72 | 425 | 385 (Li)47 | 12.0 | 9.9 (Li)57 | 0.12 | 0.12 (Li)40 | 0.17 | 0.09 (Li)73 | Tt–Oc |
| Medium | 2.14 | 375 | 380 (Na)47 | 7.7 | 7.3 (Na)57 | 0.15 | 0.11 (Na)40 | 0.23 | 0.15 (Na)73 | Oc–Tt |
| Large | 2.30 | 350 | 365 (K)47 | 4.7 | 6.8 (K)47 | 0.12 | 0.19 (K)47 | 0.29 | 0.58 (K)47 | Oc–Tt |
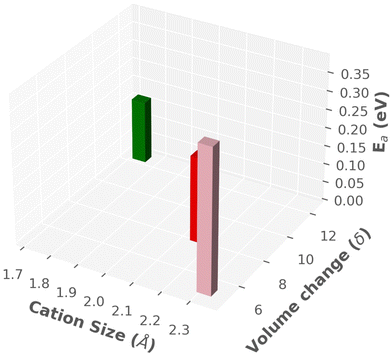 | ||
| Fig. 14 Three-dimensional chart plot of the results from MD simulation, as listed in Table 3. | ||
IV. Conclusions
A predefined potential model represented the influence of cationic size on Ttran and cationic diffusion, which was in agreement with the experimentally reported trends. A higher anionic rotational rate and a bigger cell volume (wider bottleneck radius) were in favor of higher cationic diffusion and lower ordered–disordered transition temperature, whereas a bigger-size cation is against the faster cationic diffusion (effectively narrower bottleneck radius). We also found that there was a significant change in cationic occupancy from Tt to Oc-sites due to the dominating short-range repulsion over the Coulombic attraction while increasing the cation size. However, the Tt-sites (two-fold larger than Oc-sites) were in favor of faster cationic diffusion, which was further confirmed by using fixed-size cation with varying cell sizes. Additionally, the smaller percentage of cell volume change resulted in a higher anionic freedom that lifted up the system from an ordered state to a disordered state. Thus, a guideline for superior materials could be keeping a smaller-sized or same-sized cation in a bigger simulation cell, as observed in MgB12H12·12H2O.72 However, in real materials, the cation sizes and the anionic arrangement play combined roles. Therefore, understanding the role of cation size in ionic conduction and Ttran separately is fundamental to optimize these properties.Data availability
The data that support the findings of this study are available from the corresponding author (K. S.) upon reasonable request.Author contributions
K. S. and T. I. conceived the study and planned the research. K. S. performed the molecular dynamics simulations and the results were discussed among all the authors. S. T. helped to improve the figures. K. S. wrote the manuscript and all the authors contributed to revisions.Conflicts of interest
The authors declare no competing financial or non-financial interests.Acknowledgements
K. S. is thankful for the JSPS International Fellowship. This work was supported by JSPS KAKENHI Grant-in-Aid for Scientific Research on Innovative Areas “Hydrogenomics”, No. JP18H05513 and JSPS Fellowship grant (21F21345). We gratefully acknowledge the Center for Computational Materials Science of Institute for Materials Research, Tohoku University, for permitting the use of MASAMUNE- IMR (MAterial science Supercomputing system for Advanced MUltiscale simulations toward NExt-generation Institute of Material Research) (project no. 202203-SCKXX-0408).References
- J. Goodenough, H.-P. Hong and J. Kafalas, Mater. Res. Bull., 1976, 11, 203 CrossRef CAS.
- U. Von Alpen, M. Bell and H. Höfer, Solid State Ionics, 1981, 3–4, 215 CrossRef CAS.
- A. Hooper, J. Phys. D: Appl. Phys., 1977, 10, 1487 CrossRef CAS.
- T. Udovic, M. Matsuo, A. Unemoto, N. Verdal, V. Stavila, A. Skripov, J. Rush, H. Takamura and S. Orimo, Chem. Commun., 2014, 50, 3750 RSC.
- J. Fergus, Solid State Ionics, 2012, 227, 102 CrossRef CAS.
- A. Lubimtsev, P. Kent, B. Sumpter and P. Ganesh, J. Mater. Chem. A, 2013, 1, 14951 RSC.
- T. Famprikis, P. Canepa, J. Dawson, M. Islam and C. Masquelier, Nat. Mater., 2019, 18, 1278 CrossRef CAS PubMed.
- P. Bron, S. Johansson, K. Zick, J. Der Günne, S. Dehnen and B. Roling, J. Am. Chem. Soc., 2013, 135, 15694 CrossRef CAS PubMed.
- N. Kamaya, K. Homma, Y. Yamakawa, M. Hirayama, R. Kanno, M. Yonemura, T. Kamiyama, Y. Kato, S. Hama, K. Kawamoto and A. Mitsui, Nat. Mater., 2011, 10, 682 CrossRef CAS PubMed.
- S. Lee, X.-G. Sun, A. Lubimtsev, X. Gao, P. Ganesh, T. Ward, G. Eres, M. Chisholm, S. Dai and H. Lee, Nano Lett., 2017, 17, 2229 CrossRef CAS PubMed.
- K. Takada, Acta Mater., 2013, 61, 759 CrossRef CAS.
- G. Sahu, Z. Lin, J. Li, Z. Liu, N. Dudney and C. Liang, Energy Environ. Sci., 2014, 7, 1053 RSC.
- V. Thangadurai, S. Narayanan and D. Pinzaru, Chem. Soc. Rev., 2014, 43, 4714 RSC.
- K. Sau, T. Ikeshoji and S. Roy, Phys. Chem. Chem. Phys., 2020, 22, 14471 RSC.
- N. Kamaya, K. Homma, Y. YamaNawa, M. Hirayama, R. Kanno and M. Yonemura, Nat. Mater., 2011, 10, 682 CrossRef CAS PubMed.
- S. Boulineau, M. Courty, J.-M. Tarascon and V. Viallet, Solid State Ionics, 2012, 221, 1 CrossRef CAS.
- R. Rao and S. Adams, Phys. Status Solidi A, 2011, 208, 1804 CrossRef CAS.
- Z. Lodziana and T. Vegge, Phys. Rev. Lett., 2004, 93, 145501 CrossRef PubMed.
- D. Blanchard, A. Nale, D. Sveinbjörnsson, T. Eggenhuisen, M. Verkuijlen, Suwarno, T. Vegge, A. Kentgens and P. De Jongh, Adv. Funct. Mater., 2015, 25, 184 CrossRef CAS.
- A. Unemoto, K. Yoshida, T. Ikeshoji and S. Orimo, Mater. Trans., 2016, 57, 1639 CrossRef CAS.
- C. Bernuy-Lopez, W. Manalastas, J. Lopez Del Amo, A. Aguadero, F. Aguesse and J. Kilner, Chem. Mater., 2014, 26, 3610 CrossRef CAS.
- V. Thangadurai and W. Weppner, Adv. Funct. Mater., 2005, 15, 107 CrossRef CAS.
- K. Arbi, M. Hoelzel, A. Kuhn, F. García-Alvarado and J. Sanz, Inorg. Chem., 2013, 52, 9290 CrossRef CAS PubMed.
- Y. Inaguma, C. Liquan, M. Itoh, T. Nakamura, T. Uchida, H. Ikuta and M. Wakihara, Solid State Commun., 1993, 86, 689 CrossRef CAS.
- V. Thangadurai, A. Shukla and J. Gopalakrishnan, Chem. Mater., 1999, 11, 835 CrossRef CAS.
- R. Mohtadi and S. Orimo, Nat. Rev. Mater., 2016, 2(3), 16091 CrossRef.
- A. Unemoto, M. Matsuo and S. Orimo, Adv. Funct. Mater., 2014, 24, 2267 CrossRef CAS.
- T. J. Udovic, M. Matsuo, A. Unemoto, N. Verdal, V. Stavila, A. V. Skripov, J. J. Rush, H. Takamura and S. Orimo, Chem. Commun., 2014, 50, 3750 RSC.
- T. Udovic, M. Matsuo, W. Tang, H. Wu, V. Stavila, A. Soloninin, R. Skoryunov, O. Babanova, A. Skripov, J. Rush, A. Unemoto, H. Takamura and S. Orimo, Adv. Mater., 2014, 26, 7622 CrossRef CAS PubMed.
- W. Tang, T. Udovic and V. Stavila, J. Alloys Compd., 2015, 645, S200 CrossRef CAS.
- W. Tang, M. Matsuo, H. Wu, V. Stavila, A. Unemoto, S. Orimo and T. Udovic, Energy Storage Mater., 2016, 4, 79 CrossRef.
- B. Hansen, M. Paskevicius, M. Jørgensen and T. Jensen, Chem. Mater., 2017, 29, 3423 CrossRef CAS.
- W. Tang, M. Dimitrievska, V. Stavila, W. Zhou, H. Wu, A. Talin and T. Udovic, Chem. Mater., 2017, 29, 10496 CrossRef CAS.
- M. Jørgensen, P. Shea, A. Tomich, J. Varley, M. Bercx, S. Lovera, R. Černý, W. Zhou, T. Udovic, V. Lavallo, T. Jensen, B. Wood and V. Stavila, Chem. Mater., 2020, 32, 1475 CrossRef.
- A. V. Soloninin, M. Dimitrievska, R. V. Skoryunov, O. A. Babanova, A. V. Skripov, W. S. Tang, V. Stavila, S. Orimo and T. J. Udovic, J. Phys. Chem. C, 2017, 121, 1000, DOI:10.1021/acs.jpcc.6b09113.
- A. V. Skripov, O. A. Babanova, A. V. Soloninin, V. Stavila, N. Verdal, T. J. Udovic and J. J. Rush, J. Phys. Chem. C, 2013, 117, 25961 CrossRef CAS.
- Z. Lu and F. Ciucci, J. Mater. Chem. A, 2016, 4, 17740 RSC.
- J. Varley, K. Kweon, P. Mehta, P. Shea, T. Heo, T. Udovic, V. Stavila and B. Wood, ACS Energy Lett., 2017, 2, 250 CrossRef CAS.
- K. Kweon, J. Varley, P. Shea, N. Adelstein, P. Mehta, T. Heo, T. Udovic, V. Stavila and B. Wood, Chem. Mater., 2017, 29, 9142 CrossRef CAS.
- M. Dimitrievska, P. Shea, K. Kweon, M. Bercx, J. Varley, W. Tang, A. Skripov, V. Stavila, T. Udovic and B. Wood, Adv. Energy Mater., 2018, 8, 1703422 CrossRef.
- M. Paskevicius, M. Pitt, D. Brown, D. Sheppard, S. Chumphongphan and C. Buckley, Phys. Chem. Chem. Phys., 2013, 15, 15825 RSC.
- N. Verdal, J.-H. Her, V. Stavila, A. Soloninin, O. Babanova, A. Skripov, T. Udovic and J. Rush, J. Solid State Chem., 2014, 212, 81 CrossRef CAS.
- M. Paskevicius, B. Hansen, M. Jørgensen, B. Richter and T. Jensen, Nat. Commun., 2017, 8, 15136 CrossRef PubMed.
- K. Sau, T. Ikeshoji, S. Kim, S. Takagi and S. I. Orimo, Chem. Mater., 2021, 33, 2357 CrossRef CAS.
- S. Kim, H. Oguchi, N. Toyama, T. Sato, S. Takagi, T. Otomo, D. Arunkumar, N. Kuwata, J. Kawamura and S. Orimo, Nat. Commun., 2019, 10, 1081 CrossRef PubMed.
- S. Kim, K. Kisu, S. Takagi, H. Oguchi and S. Orimo, ACS Appl. Energy Mater., 2020, 3, 4831 CrossRef CAS.
- M. Dimitrievska, H. Wu, V. Stavila, O. Babanova, R. Skoryunov, A. Soloninin, W. Zhou, B. Trump, M. Andersson, A. Skripov and T. Udovic, J. Phys. Chem. C, 2020, 124, 17992 CrossRef CAS.
- M. Broström, S. Enestam, R. Backman and K. Mäkelä, Fuel Process. Technol., 2013, 105, 142 CrossRef.
- M. S. Islam and C. A. Fisher, Chem. Soc. Rev., 2014, 43, 185 RSC.
- P. Vashishta and A. Rahman, Phys. Rev. Lett., 1978, 40, 1337 CrossRef CAS.
- P. Vashishta, R. K. Kalia, J. P. Rino and I. Ebbsjö, Phys. Rev. B: Condens. Matter Mater. Phys., 1990, 41, 12197 CrossRef CAS PubMed.
- J. Walker and C. Catlow, J. Phys. C: Solid State Phys., 1982, 15, 6151 CrossRef CAS.
- P. P. Kumar and S. Yashonath, J. Phys. Chem. B, 2002, 106, 7081 CrossRef CAS.
- L. Malavasi, C. A. Fisher and M. S. Islam, Chem. Soc. Rev., 2010, 39, 4370 RSC.
- E. Kendrick, J. Kendrick, K. S. Knight, M. S. Islam and P. R. Slater, Nat. Mater., 2007, 6, 871 CrossRef CAS PubMed.
- K. Sau, T. Ikeshoji, S. Kim, S. Takagi, K. Akagi and S. Orimo, Phys. Rev. Mater., 2019, 3, 075402 CrossRef CAS.
- W. Tang, A. Unemoto, W. Zhou, V. Stavila, M. Matsuo, H. Wu, S. Orimo and T. Udovic, Energy Environ. Sci., 2015, 8, 3637 RSC.
- D. T. Qui, J. Capponi, J. Joubert and R. Shannon, J. Solid State Chem., 1981, 39, 219 CrossRef CAS.
- H. Kohler and H. Schulz, Mater. Res. Bull., 1985, 20, 1461 CrossRef CAS.
- T. Krauskopf, S. P. Culver and W. G. Zeier, Chem. Mater., 2018, 30, 1791 CrossRef CAS.
- M. Parrinello and A. Rahman, J. Appl. Phys., 1981, 52, 7182 CrossRef CAS.
- S. Plimpton, J. Comput. Phys., 1995, 117, 1 CrossRef CAS.
- P. Hopkins, A. Fortini, A. J. Archer and M. Schmidt, J. Chem. Phys., 2010, 133, 224505 CrossRef PubMed.
- Y. Wang, W. D. Richards, S. P. Ong, L. J. Miara, J. C. Kim, Y. Mo and G. Ceder, Nat. Mater., 2015, 1, 1026 CrossRef PubMed.
- K. Sau and T. Ikeshoji, J. Phys. Chem. C, 2020, 124, 20671 CrossRef CAS.
- P. Padma Kumar and S. Yashonath, J. Phys. Chem. B, 2002, 106, 7081 CrossRef.
- K. Sau, T. Ikeshoji, S. Takagi, S. Orimo, D. Errandonea, D. Chu and C. Cazorla, Colossal Barocaloric Effects in the Complex Hydride Li2B12H12, Sci. Rep., 2021, 11, 11915 CrossRef CAS.
- T. Famprikis, J. Dawson, F. Fauth, O. Clemens, E. Suard, B. Fleutot, M. Courty, J.-N. Chotard, M. Islam and C. Masquelier, ACS Mater. Lett., 2019, 1, 641 CrossRef CAS.
- W. Tang, M. Matsuo, H. Wu, V. Stavila, W. Zhou, A. Talin, A. Soloninin, R. Skoryunov, O. Babanova, A. Skripov, A. Unemoto, S. Orimo and T. Udovic, Adv. Energy Mater., 2016, 6, 1502237 CrossRef.
- A. Stukowski, Modell. Simul. Mater. Sci. Eng., 2009, 18, 015012 CrossRef.
- K. Pramanik, K. Sau and P. P. Kumar, J. Phys. Chem. C, 2020, 124, 4001 CrossRef CAS.
- K. Kisu, A. Dorai, S. Kim, R. Hamada, A. Kumatani, Y. Horiguchi, R. Sato, K. Sau, S. Takagi and S. Orimo, J. Mater. Chem. A, 2022, 10, 24877 RSC.
- A. Skripov, R. Skoryunov, A. Soloninin, O. Babanova, W. Tang, V. Stavila and T. Udovic, J. Phys. Chem. C, 2015, 119, 26912 CrossRef CAS.
Footnote |
| † Electronic supplementary information (ESI) available. See DOI: https://doi.org/10.1039/d2ma00936f |
| This journal is © The Royal Society of Chemistry 2023 |

