 Open Access Article
Creative Commons Attribution 3.0 Unported Licence
A polyeugenol/graphene composite with excellent anti-corrosion coating properties
Nor Basid Adiwibawa
Prasetya
 *,
Aniq Ibnu
Ajizan
,
Didik Setiyo
Widodo
,
Ngadiwiyana
Ngadiwiyana
and
Gunawan
Gunawan
Department of Chemistry, Diponegoro University, Jl. Prof. Soedarto SH, Tembalang, Semarang, Indonesia. E-mail: nor.basid.prasetya@live.undip.ac.id
First published on 8th November 2022
Abstract
In recent years, metal corrosion has caused serious threats to the world economy and the environment. This study presents the first successful application of a polyeugenol/graphene composite as a coating for corrosion protection. The barrier properties of graphene can significantly increase the corrosion resistance of metals joined to polymers. Polyeugenol (PE) was obtained through the cationic addition polymerization process, and graphene (G) was obtained by reducing graphene oxide using the Hummers’ method. Polyeugenol/graphene (PE/G) was synthesized through a solution mixing method and its application to metals through the drop-casting process. The potentiodynamic polarization technique was used to measure the performance of the anti-corrosion coating. It was found that the PE/G composite showed superior anti-corrosion properties compared to pure PE, where the corrosion protection efficiency increased from 37% to 78% by incorporating 1.25% by weight of graphene in the PE polymer matrix. The PE/G composite coated metal showed higher hydrophobicity than the uncoated metal or the PE coated metal. Morphological analysis of the coatings and corrosion products formed was performed using SEM and XRD. In general, it can be concluded that the anti-corrosion performance of PE/G coatings is much higher than that of pure PE coatings.
1. Introduction
The phenomenon of metal corrosion is considered a serious threat to the economy and industrial structures. Corrosion can trigger considerable economic loss and damage in many fields of industry and daily life.1 Copper (Cu) is a metal substrate widely used in various applications such as tubes, faucets, heat exchangers, and liquid and gas containers because of its excellent mechanical workability and outstanding electrical and thermal conductivity.2 However, Cu metal is very susceptible to oxidation or corrosion, especially under an aggressive marine environment, thereby reducing its performance.3 Protecting metals from corrosion has attracted significant attention.4 With the advances in anti-corrosion technology, many corrosion prevention techniques have been developed to increase the service life of metals. Several methods protect metals from corrosive environments by applying corrosion inhibitors or coatings.5 Polymers as coatings have been widely used to protect metal substrates because they have good chemical resistance and strong adhesion to metal substrates.6–9 The polymer layer acts as a physical barrier between the metal substrate and the corrosive medium, thereby reducing the corrosion rate of the metal.Eugenol (4-allyl-2-methoxy phenol) was found as the main component in environmentally friendly sources of clove leaves (75 wt%), buds (50 wt%), and cinnamon leaves (87.3 wt%). The source of these compounds supports the formation of green corrosion inhibitors.10 The antioxidant, antibiotic, and anti-inflammatory properties make this compound superior and has been successfully used as a corrosion inhibitor for steel in acidic media.11 In addition, cationic polymerization of eugenol has been studied due to the presence of allyl groups in the structure.12 However, research that discusses polyeugenol in the field of corrosion is still very limited. It was reported that polyeugenol coating has a corrosion protection efficiency of 63% by applying a barrier effect to titanium dental implants.13 However, the use of these polymer coatings in corrosion prevention is often limited by the intrinsically porous microstructure generated during the evaporation process so that these pores provide a pathway for the diffusion of corrosive species such as water molecules and Cl− ions.14
The application of graphene as fillers in coatings for corrosion protection has attracted considerable interest in the last decade. Graphene incorporated in the polymer matrix provides extra corrosion protection to the metal by making it difficult for corrosive species to penetrate the metal surface. Polymer/graphene composites which can be effectively used as anti-corrosion coatings provide a superior physical barrier by minimizing the corrosion medium's porosity and zigzagging diffusion pathways, including water, O2 molecules, and chloride ions.15 Therefore, further research on graphene-based polymer composites has developed rapidly. It has become a very active research area and has excellent potential in anti-corrosion applications that deserve to be developed.16
It was reported that graphene as a filler in a polyaniline polymer matrix (PANI/G) could act as a gas barrier and provide corrosion protection.17 Other studies have reported the success of making polystyrene/graphene (PS/G) composites, which are highly beneficial for corrosion protection but requires complex steps for their preparation.18 Similarly, it has been reported that graphene acts as an excellent filler in addition to the polystyrene polymer matrix. Based on several studies mentioned above, it is seen that there is increasing interest and attention in protecting metals from corrosion through the development of polymer-based composites with graphene as a filler. This research is a development of previous studies by carrying out the latest modifications and actions on polymer materials that have not been previously reported, namely, polyeugenol combined with graphene as a filler which is applied to the copper (Cu) metal specimens to obtain a coating composite with good anti-corrosion ability.
2. Experimental section
2.1 Materials and instruments
The materials used in this research were graphite (Merck, for synthesis), sodium nitrate (NaNO3, Merck, for synthesis), potassium permanganate (KMnO4, Merck, for synthesis), hydrogen peroxide (H2O2, Merck), 98% sulfuric acid (H2SO4 98%), hydrochloric acid 37% (HCl, for analysis), eugenol (Merck, for synthesis), chloroform (CH3Cl, Merck, for analysis), boron trifluoride etherate (BF3O(C2H5)2, Merck), methanol (CH3OH, Merck, for analysis), anhydrous sodium sulphate (anhydrous Na2SO4, Merck), tetrahydrofuran (THF, Merck), sodium chloride (NaCl, Merck), platinum electrode, Ag/AgCl electrode, and copper metal plate.The equipment used in this study included a set of laboratory glassware, a set of reflux equipment, an analytical balance, a hot plate stirrer, statives and clamps, a neck flask 2, filter paper, mortar and pestle, a T3 pot, a centrifuge system, an ultrasonicator, CorrTest CS150, a FTIR spectrophotometer (PerkinElmer Spectrum IR 10.6.1), an X-Ray diffraction system (Shimadzu 7000), and a scanning electron microscope (JSM-6510LA).
2.2 Synthesis of polyeugenol
A total of 5.8 grams of eugenol (0.035 mol) was put in a three-neck flask, and then 1 mL of BF3-diethyl ether (0.008 mol) was added. The mixture was stirred using a stirrer for 4 hours at room temperature, and once every 1 hour, 0.25 mL (0.002 mol) of BF3-diethyl ether was added. After 12–16 hours of reaction, the polymerization was stopped by adding 1 mL of methanol. The gel formed was then dissolved in chloroform and washed with distilled water until the pH was neutral. The solution was then dried by adding anhydrous Na2SO4. When free from water, the solution was evaporated at room temperature. The precipitate formed is then dried and weighed. The results were then analyzed by measuring the molecular weight, solubility, and FTIR.2.3 Synthesis of graphene
Graphene was obtained by reducing graphene oxide. Graphene oxide is produced by the Hummers’ method by oxidizing graphite to graphite oxide so that graphene oxide is obtained through the exfoliation process. A total of 1 gram of graphite was dissolved in 46 mL of 98% H2SO4. The dissolution process was carried out by stirring for 2 hours under ice bath conditions and adding 0.5 grams of NaNO3. After stirring for 2 hours, 6 grams of KMnO4 were added slowly. The ice bath process was completed, and the container was heated at a temperature of 35 °C and stirred for 24 hours. The results of stirring produced a brown solution. A total of 46 mL of distilled water was added slowly and stirred for 1 hour. Then, 60 mL of distilled water was added directly, to remove the remaining KMnO4, and 5 mL of 30% H2O2 was added to the solution and produced a yellow solution. The solution was separated by centrifugation and washed with 5% HCl and distilled water until the pH was neutral. Graphite oxide was dried at 80 °C for 12 hours.40 mg of graphite oxide was dispersed in 40 mL of distilled water and ultrasonicated for 90 minutes to transform graphite oxide into graphene oxide (GO). Graphene oxide solution was added with 10 mL of 37% HCl, and 0.8 grams of Zn powder. Then, ultrasonication was performed for 1 minute, followed by stirring for 30 minutes, and adding 10 mL of 37% HCl to overcome the excess Zn powder. The graphene oxide reduction solution was neutralized by washing with distilled water repeatedly and dried at 200 °C for 12 hours. FTIR and XRD were then used to characterize the results obtained.
2.4 Synthesis of polyeugenol/graphene (PE/G) composites
The composite was made by varying the weight of graphene based on the weight of the polyeugenol. As calculated in accordance with the amount of polyeuegneol (4 g), the graphene dispersion was balanced (0.01 g, 0.02 g, 0.03 g, 0.04 g, and 0.05 g for 0.25 wt%, 0.5 wt%, 0.75 wt%, 1 wt%, and 1.25 wt%, respectively). Then it was dispersed in 10 mL of THF (Sigma Aldrich). Next, the suspension was stirred for 90 minutes, followed by ultrasonication for 30 minutes at 20![[thin space (1/6-em)]](https://www.rsc.org/images/entities/char_2009.gif) 000 Hz, and stirring for 60 minutes to obtain a well-dispersed composite suspension.
000 Hz, and stirring for 60 minutes to obtain a well-dispersed composite suspension.
2.5 Preparation of PE/G coating on copper metal
The copper plate specimen with an area of 1 cm2 was polished using sandpaper, cleaned with distilled water and acetone, and then dried at room temperature. The coating was prepared by the drop-casting method. The copper plate was coated twice in which every layer uses PE/G composite material of 5 drops. Coating with PE: PE/G 0.25%; PE/G 0.5%; PE/G 0.75%; PE/G 1% and PE/G 1.25%. After coating, the specimens were dried at room temperature. The prepared specimen was used as the working electrode to measure by potentiodynamic polarization. In addition, the contact angle of the specimen was characterized. Contact angle was measured by direct measurement of the tangent angle on the sessile drop profile of pure water drops. The contact angle measurements were carried out 5 times for each sample. The volume of water droplet was 0.005 mL, and the distance of dropping was 30 mm. The contact angle data were reported as the average measurements.2.6 Preparation of the test specimen for electrochemical corrosion studies
Corrosion rate measurements were carried out using the potentiodynamic polarisation method using the CorrTest CS150 instrument and CS Studio5 software. The measurements were carried out in 3.5% NaCl solution at room temperature. The measurements were taken in a three-electrode system, with Pt wire as the counter electrode, Ag/AgCl as the reference electrode, and the sample tested as the working electrode. The open circuit potential (OCP) was monitored for 1 hour to confirm stability. When a stable OCP was obtained, the linear sweep voltammetry was set to +100 and −100 mV relative to the OCP. The corrosion current (Icorr) and the corrosion rate (CR) were determined by Tafel extrapolation. The coating efficiency protection against corrosion is calculated using the equation:193. Results and discussion
3.1 Synthesis of polyeugenol
The polymerisation of eugenol with a BF3 catalyst occurs through a cationic addition process with the stages of initiation, propagation, and termination reactions. In the initiation stage, an addition reaction occurs, which causes breaking of the double bond in the allyl group in eugenol in Lewis acid catalyst BF3 and produces a carbocation. In the propagation stage, long polymer chains are formed. Meanwhile, the termination stage occurs when the polymer chain growth is terminated by adding methanol (Fig. 1).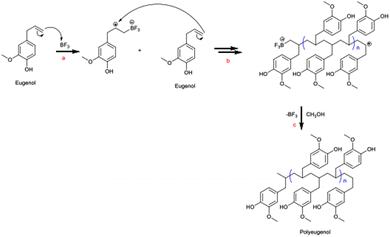 | ||
| Fig. 1 Mechanism of eugenol polymerisation involving (a) initiation, (b) propagation and (c) termination stages.12 | ||
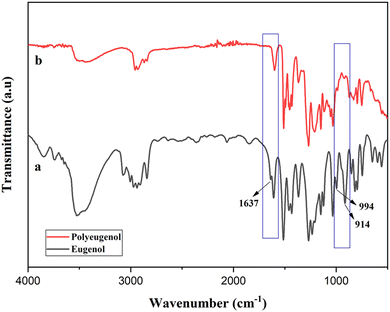
The resulting polyeugenol is a pink powder soluble in chloroform, ethanol, methanol, and THF but insoluble in distilled water. The molecular weight of polyeugenol was measured using a Ubbelohde viscometer with an average molecular weight of 10![[thin space (1/6-em)]](https://www.rsc.org/images/entities/char_2009.gif) 820.6 g mol−1 with a polymerization degree of 65. The FTIR spectra of eugenol and polyeugenol are shown in Fig. 2. Polyeugenol was successfully synthesized, characterized by loss of absorption of allyl groups (C
820.6 g mol−1 with a polymerization degree of 65. The FTIR spectra of eugenol and polyeugenol are shown in Fig. 2. Polyeugenol was successfully synthesized, characterized by loss of absorption of allyl groups (C![[double bond, length as m-dash]](https://www.rsc.org/images/entities/char_e001.gif) C) at a wave number of 1637.48 cm−1 and a decrease in the intensity of the vinyl group (–CH2
C) at a wave number of 1637.48 cm−1 and a decrease in the intensity of the vinyl group (–CH2![[double bond, length as m-dash]](https://www.rsc.org/images/entities/char_e001.gif) CH2) at wave numbers of 914 cm−1 and 994 cm−1.
CH2) at wave numbers of 914 cm−1 and 994 cm−1.
3.2 Synthesis of graphene
Graphene is obtained through a series of steps: oxidation of graphite to graphite oxide using the Hummers’ method, exfoliation of graphite oxide to graphene oxide (GO), and chemical reduction to the reduction of graphene oxide (rGO). The graphite oxidation process uses a strong oxidising agent such as KMnO4 under acidic conditions given by H2SO4, so the reactions that occur during the oxidation process are:20| KMnO4 + 3H2SO4 → K+ + MnO3+ + H3O+ + 3HSO4− |
| MnO3+ + MnO4− → Mn2O7 |
The process of reducing graphene oxide using Zn powder under acidic conditions is by adding HCl through an ultrasonication process for 1 minute and a stirrer. The reduction process occurs due to the initiation of H+ ions produced from Zn powder which reacts with H2O. The reactions that occur are as follows:22
| Zn(s) + 2H2O(l) → Zn(OH)2(aq) + 2H+(aq) + 2e− |
| Zn(OH)2(aq) → ZnO(aq) + H2O(l) |
| GO(aq) + 2H+(aq) + 2e− → rGO(s) |
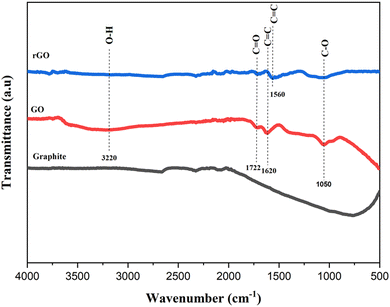
The FTIR analysis in Fig. 3 shows the reduced intensity of the –OH functional group in the reduced graphene oxide sample. In the graphite sample, there is no special wave number found. Significantly different from the graphene oxide sample, which has a peak at a wavelength of 3220 cm−1, which indicates the C–OH functional group stretching vibrations of the hydroxyl group, 1722 cm−1 (C![[double bond, length as m-dash]](https://www.rsc.org/images/entities/char_e001.gif) O stretching of the carbonyl or carboxyl group), 1620 cm−1 is associated with skeletal C
O stretching of the carbonyl or carboxyl group), 1620 cm−1 is associated with skeletal C![[double bond, length as m-dash]](https://www.rsc.org/images/entities/char_e001.gif) C vibrations of unoxidized graphite, and 1050 cm−1 was related to C–O alloy stretching vibrations. In reduced graphene oxide (rGO) samples, a weak peak appeared at the wave number of 1560 cm−1 and was associated with skeletal C
C vibrations of unoxidized graphite, and 1050 cm−1 was related to C–O alloy stretching vibrations. In reduced graphene oxide (rGO) samples, a weak peak appeared at the wave number of 1560 cm−1 and was associated with skeletal C![[double bond, length as m-dash]](https://www.rsc.org/images/entities/char_e001.gif) C vibrations from the graphene plane.23 In addition, the intensity of the peaks related to oxygen functional groups in rGO decreased significantly compared to GO, indicating the success of the reduction process. The results of this analysis are in line with previous studies.23,24
C vibrations from the graphene plane.23 In addition, the intensity of the peaks related to oxygen functional groups in rGO decreased significantly compared to GO, indicating the success of the reduction process. The results of this analysis are in line with previous studies.23,24
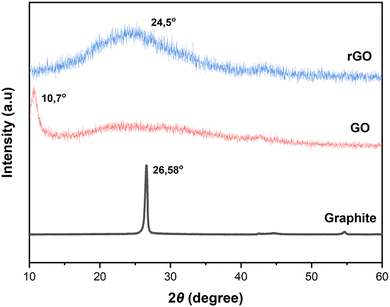
XRD analysis was used to determine the interlayer distance (d-spacing) (Fig. 4). In graphite, a strong peak appears at 26.58° according to the Bragg's equation calculated distance between layers of 0.33 nm. In contrast, the XRD pattern of GO shows a characteristic peak at 10.7°, corresponding to the interlayer distance of 0.825 nm, indicating the presence of oxygen-containing functional groups in the interlayer space after oxidation.25 The oxygen group increased the distance between the layers between GO sheets to 0.825 nm from 0.33 nm previously. Then, the distance between GO layers decreased drastically to 0.362 nm after going through a chemical reduction (rGO) process. The XRD pattern of rGO shows a weak and wide diffraction peak at 24.5°, indicating a reduced interlayer distance of 0.362 nm, which is predicted due to the removal of some oxygen-containing functional groups. These results indicate that the conjugated rGO network (sp2 carbon) is reshaped during chemical reduction. The interlayer space of rGO is similar to that of the initial sample (graphite), which indicates that the chemical reduction process successfully removed the intercalated H2O molecules and oxide groups on the GO surface. The results of this study are in line with research that has been previously carried out (Table 1).24–26
3.3 Synthesis of polyeugenol/graphene composites
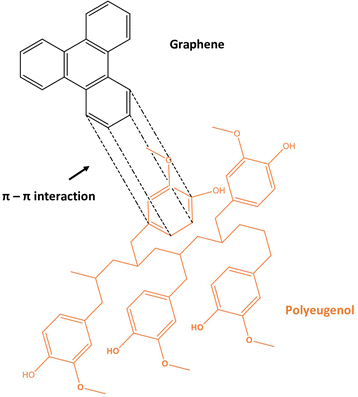
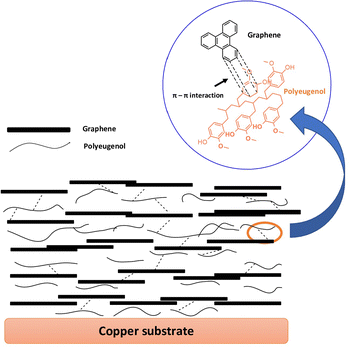
Polyeugenol/graphene composites are produced using a solution mixing method, namely by a physical dispersion method through sonication or stirring. This method applies physical force to separate agglomerated graphene through shear stress. Polyeugenol and graphene are mixed in tetrahydrofuran (THF) solvent as a suitable solvent according to the graphene dispersion method which is connected to the polymer matrix without any chemical reaction, and THF is a solvent with high solubility in graphene at a low level of toxicity. Graphene is added to polyeugenol according to a predetermined amount of % by weight of polyeugenol. The interaction between polyeugenol and graphene is through π–π stacking interaction. The larger conjugated graphene system makes it easier for the aromatic structures in the polymer to interact through π–π interactions. The resulting composite solution was used as a coating on copper (Cu) sheet metal which was then tested for its potential as an anti-corrosion coating. The proposed interaction between polyeugenol and graphene can be illustrated as follows (Fig. 5).The resulting composite for polyeugenol is dark orange, then after the addition of graphene composition at 0.25%, 0.5%, 0.75%, 1%, and 1.25% by weight of polyeugenol, it turned black after sonication. However, a little agglomerated graphene material is still visible. The poor dispersion of graphene in this study was probably caused by the lack of solution in the matrix or solvent, van der Waals forces, π–π and accumulation between graphene lamellae. Graphene is susceptible to aggregation and irreversibly precipitates in various matrices,27 and the weak bonding strength between graphene sheets makes it difficult to bind to the matrix interface.28
3.4 Polyeugenol/graphene composite material coating
Coating of a polyeugenol/graphene composite material on copper (Cu) sheet is achieved using a drop casting technique. The layer formation mechanism on metals is physical deposition by layer-by-layer deposition, producing a strong interfacial interaction between graphene and polymer. A schematic of the construction of the polyeugenol/graphene composite coating process on a copper metal surface is shown in Fig. 6.SEM was used to analyze the surface morphology of metals and coatings on metal before and after immersion for 100 hours in 3.5% NaCl media. The results of the characterization with SEM are shown in Fig. 7.
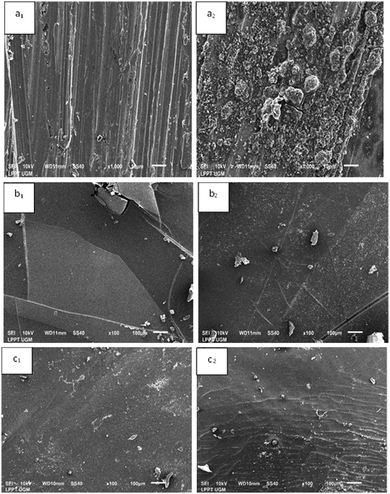 | ||
| Fig. 7 SEM images of bare Cu (a1) before and (a2) after immersion, PE coated Cu (b1) before and (b2) after immersion, and PE/G 1.25% coated Cu (c1) before and (c2) after immersion. | ||
A SEM micrograph image of uncoated copper specimens is highly corroded with porous corrosion products formed after the immersion process (a2). Meanwhile, no superior corrosion products were seen on the surface after immersion on the surface of Cu metal coated with polyeugenol and polyeugenol/graphene. However, it can be observed that there are some differences and defects in the coating, which indicates that the protection possibility may be weakened to some extent. Cu coated with polyeugenol looks like a smooth surface with a small number of cavities or cracks, and some bubbles may be caused by an incomplete evaporation process (b1). This can allow a decrease in the quality of the coating in a corrosive environment so that it becomes an active site for corrosion initiation. After the immersion process (b2), it is seen that the Cu specimen coated with polyeugenol has fractured, which indicates weakening of the barrier layer protection, allowing corrosive species to enter the metal surface. Fig. 7 shows SEM micrographs of Cu specimens coated with polyeugenol/graphene after immersion (c2) but does not show superior corrosion products, and the coating shrinks at several points. The initial shape of this layer (c1) shows a more homogeneous surface and offers a better coating surface than polyeugenol coatings. This result is supported by previous research, with the addition of graphene able to increase the toughness of the layer from fracture or wrinkling because graphene has a large surface area, thus forming a neater network so that it can prevent the penetration of chloride ions.29 This is supported by the results of corrosion measurements indicating that the polyeugenol/graphene coating showed better protection efficiency than polyeugenol.
The resulting coating is subjected to a contact angle test to determine the level of hydrophilicity of the coating on the metal surface. The concept of coatings and their design approach is primarily aimed at slowing or completely inhibiting the electrochemical processes that contribute to the formation of corrosion. So it can be seen that the contact angle of >90° can increase the function of coatings as a barrier against corrosive species.
In this study, the contact angle results presented in Fig. 8 show that the metal experienced an increase in the contact angle measurement after coating the polyeugenol and polyeugenol/graphene composites. This proves that either polyeugenol or polyeugenol/graphene coatings can increase hydrophobicity and act as a barrier to corrosive species to slow down the rate of corrosion that occurs in metals.
3.5 Electrochemical study
The corrosion measurement test was carried out using the potentiodynamic polarisation method. This test uses three electrodes connected to a potentiostat, and the computer outputs data in the form of Tafel graphite in a 3.5% NaCl solution. The electrodes used are the working electrode which is the sample under study; the reference electrode, namely AgCl, which serves as a reference for the base point of measurement on the electrode, and the counter electrode, namely platinum, which is used to lift the current in the circuit. The test results obtained the potentiodynamic polarisation curve shown in Fig. 9. and Tafel extrapolation was carried out to obtain the Icorr value, which can then be used to calculate the corrosion rate (CR) value. The value of corrosion rate and protection efficiency of each sample based on this test are present in Table 2.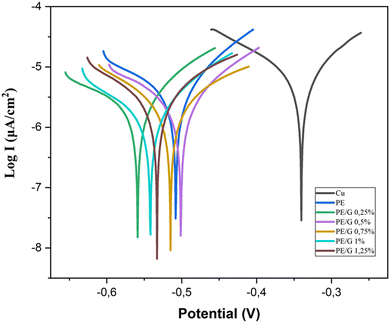 | ||
| Fig. 9 Tafel plots of Cu, PE, PE/G 0.25%, PE/G 0.5%, PE/G 0.75%, and PE/G 1% measured in 3.5% wt% NaCl aqueous solutions. | ||
| Sample | E corr (V) | I corr (μA cm−2) | CR (mm per year) | PE (%) |
|---|---|---|---|---|
| Cu | −0.3402 | 6.4205 | 0.0744 | — |
| PE | −0.5078 | 4.0239 | 0.0466 | 37 |
| PE/G 0.25% | −0.5585 | 3.4195 | 0.0396 | 47 |
| PE/G 0.5% | −0.5012 | 2.7351 | 0.0317 | 57 |
| PE/G 0.75% | −0.5154 | 1.774 | 0.0205 | 72 |
| PE/G 1% | −0.5418 | 1.5205 | 0.0176 | 76 |
| PE/G 1.25% | −0.5329 | 1.3854 | 0.016 | 78 |
Based on Table 2, it can be seen that the polymer-coated copper (Cu) specimens or polyeugenol/graphene composites experienced a decrease in the corrosion rate, which showed better corrosion resistance than uncoated copper specimens. In the variation of the addition of graphene, it is seen that the corrosion rate decreases along with the addition of graphene material to the polymer. The greater the percentage (%) of graphene by weight in polyeugenol, the smaller the corrosion current value (Icorr). The value of the current density Icorr (current density) is the main parameter used to measure the kinetic efficiency of the coating.30Icorr is obtained by the Tafel extrapolation analysis method, namely the intersection of the open circuit potential (Eoc) and the extrapolation of the linear part of the logarithmic current plot.31 It can be said that the higher the current density value, the easier it is for the metal to corrode.
Copper metal coated with the polyeugenol/graphene composite material showed the best protection effectiveness at the PE/G composition of 1.25% by 78%, which indicates that graphene as a filler in the polyeugenol polymer matrix has succeeded in improving the quality as an anti-corrosion coating, which means it reduces electrons or moving ions. In addition, it can be seen that the addition of graphene to the polyeugenol matrix polymer succeeded in increasing its performance as an anti-corrosion coating. This proves that adding graphene to the polymer causes corrosive, reactive agents such as oxygen or Cl− ions to be challenging to reach the metal surface so that it can slow down the corrosion rate. Graphene can form a barrier and cause physical isolation between the metal and the corrosion medium.32,33
XRD was used to identify the composition of corrosion products from copper metal samples which were treated by immersion in 3.5 wt% NaCl media for 100 hours. The XRD diffraction pattern in this study can be seen in Fig. 10.
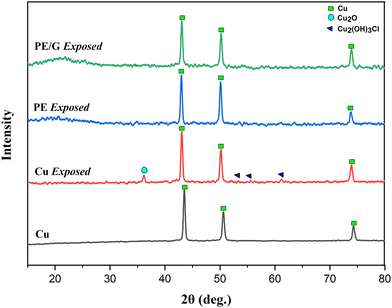 | ||
| Fig. 10 X-ray diffraction spectra of corrosion product Cu, Cu exposed, PE coated Cu exposed, and PE/G 1.25% coated Cu exposed. | ||
Based on Fig. 10, it can be seen that the corrosion products formed on the copper metal samples that did not undergo the coating treatment were Cu2O and Cu2(OH)3Cl. Meanwhile, the copper metal samples coated with polyeugenol or polyeugenol/graphene did not show any corrosion products that appeared in the XRD diffraction pattern. This indicates that either the polyeugenol or polyeugenol/graphene coatings applied to copper metal successfully act as a barrier from corrosive species and prevent corrosion of copper metal. The reaction mechanism for forming corrosion products due to chloride ions is:34
| 2CuCl2− + 2OH− → Cu2O + H2O + 4Cl− |
| Cu2O + 4Cl− + 2H+ → 2CuCl2− + H2O |
| 2CuCl2− + O2 + 2H2O → 2Cu2(OH)3Cl(s) + OH− |
| O2 + 2H2O → 4e− → 4OH− |
The composition of corrosion products on copper metal with exposure to NaCl shows the formation of Cu2O and coexists with residual NaCl. However, CuCl or CuCl2 is not always reported as corrosion products of Cu and even Cu exposed in the marine environment. Likewise, with research conducted in the laboratory, CuCl or CuCl2 often do not appear as corrosion products during exposure to NaCl. This is supported by a previous study that found paratacamite [Cu2(OH)3Cl] in copper metal immersed in NaCl media. Paratacamite is a corrosion product with a greenish colour that forms during direct exposure to the marine environment.34
4. Conclusion
Graphene can be produced by chemical reduction of graphene oxide using graphite as a starting sample. Using a strong oxidizing agent, graphite was oxidized by the Hummers’ method under acidic conditions and then reduced by Zn powder under acidic conditions to produce graphene oxide reduction. Polyeugenol can be made by the cationic addition polymerization process using the BF3O(C2H5)2 catalyst. Polyeugenol/graphene composites can be synthesised using a solution mixing method and a coating process using the drop-casting method. The XRD characterization showed that coatings using polyeugenol/graphene composites on copper metal succeeded in preventing corrosive species and inhibiting the formation of corrosion products and the composites showed higher hydrophobicity properties than metals without layers. The polyeugenol/graphene coated copper metal showed a corrosion protection efficiency with the highest percentage of inhibition at 78% with a graphene content of 1.25% by weight of polyeugenol. The addition of graphene to the polymer matrix also increased the anti-corrosion properties by increasing the protection efficiency from 37% to 78%, with a total composition of 1.25% graphene in the PE polymer matrix.Author contributions
Nor Basid Adiwibawa Prasetya contributed to the conceptualization and writing the original draft. Aniq Ibnu Ajizan contributed to the investigation. Didik Setiyo Widodo contributed to the methodology. Ngadiwiyana Ngadiwiyana contributed to the investigation. Gunawan Gunawan contributed to the conceptualization and writing – review and editing.Conflicts of interest
There are no conflicts to declare.Acknowledgements
The authors thank Diponegoro University for the International Publication Research Scheme fiscal year 2022 with contract number: 569-103/UN7.D2/PP/VII/2022.References
- K. Cai, S. Zuo, S. Luo, C. Yao, W. Liu, J. Ma, H. Mao and Z. Li, RSC Adv., 2016, 6, 95965–95972 RSC.
- S. Kumari, A. Panigrahi, S. K. Singh and S. K. Pradhan, J. Coat. Technol. Res., 2018, 15, 583–592 CrossRef CAS.
- R. K. Singh Raman, P. Chakraborty Banerjee, D. E. Lobo, H. Gullapalli, M. Sumandasa, A. Kumar, L. Choudhary, R. Tkacz, P. M. Ajayan and M. Majumder, Carbon N Y, 2012, 50, 4040–4045 CrossRef CAS.
- A. Ehsani, A. A. Heidari and M. Sajedi, Chem. Rec., 2020, 20, 467–493 CrossRef CAS PubMed.
- J. Kruger and S. Begum, Reference Module in Materials Science and Materials Engineering, Elsevier, 2016 Search PubMed.
- S. Ananda Kumar, K. Shree Meenakshi, T. S. N. Sankaranarayanan and S. Srikanth, Prog. Org. Coat., 2008, 62, 285–292 CrossRef.
- D. v Mashtalyar, K. v Nadaraia, E. A. Belov, I. M. Imshinetskiy, D. P. Kiryukhin, S. L. Sinebryukhov, V. M. Buznik and S. v Gnedenkov, J. Mol. Liq., 2022, 350, 118225 CrossRef CAS.
- W. K. Yaseen, S. B. Marpu, T. D. Golden and M. A. Omary, Surf. Coat. Technol., 2020, 404, 126444 CrossRef CAS.
- V. S. Egorkin, D. v Mashtalyar, A. S. Gnedenkov, V. S. Filonina, I. E. Vyaliy, K. v Nadaraia, I. M. Imshinetskiy, E. A. Belov, N. v Izotov, S. L. Sinebryukhov and S. v Gnedenkov, Polymers, 2021, 13, 3827 CrossRef CAS PubMed.
- L. B. Furtado, R. C. Nascimento, M. José, O. C. Guimarães, S. L. D. C. Brasil and S. H. R. Barra, Mat. Res., 2022, 25 DOI:10.1590/1980-5373-MR-2022-0012.
- E. Chaieb, A. Bouyanzer, B. Hammouti and M. Benkaddour, Appl. Surf. Sci., 2005, 246, 199–206 CrossRef CAS.
- N. B. A. Prasetya, N. Ngadiwiyana, I. Ismiyarto, P. R. Sarjono, in IOP Conference Series: Materials Science and Engineering, IOP Publishing, 2019, vol. 509, 012101, DOI: 10.1088/1757-899X/509/1/012101 Search PubMed.
- H. A. AlMashhadani and K. A. Saleh, Egypt. J. Chem., 2020, 63, 2803–2811 Search PubMed.
- K. Rajitha and K. N. Mohana, Mater. Chem. Phys., 2020, 241 DOI:10.1016/J.MATCHEMPHYS.2019.122050.
- B. Kulyk, M. A. Freitas, N. F. Santos, F. Mohseni, A. F. Carvalho, K. Yasakau, A. J. S. Fernandes, A. Bernardes, B. Figueiredo, R. Silva, J. Tedim and F. M. Costa, Crit. Rev. Solid State Mater. Sci., 2022, 47(3), 309–355 CrossRef CAS.
- Y. H. Yu, Y. Y. Lin, C. H. Lin, C. C. Chan and Y. C. Huang, Polym. Chem., 2013, 5, 535–550 RSC.
- C. H. Chang, T. C. Huang, C. W. Peng, T. C. Yeh, H. I. Lu, W. I. Hung, C. J. Weng, T. I. Yang and J. M. Yeh, Carbon N Y, 2012, 50, 5044–5051 CrossRef CAS.
- A. N. F. Ganda and C. Y. Su, in IOP Conference Series: Materials Science and Engineering, Institute of Physics Publishing, 2019, vol. 494.
- C. X. Wang, Y. Y. Han, W. Wang, J. Liu, N. Wang and B. R. Hou, Prog. Org. Coat., 2021, 158, 106335 CrossRef CAS.
- M. Kashif, E. Jaafar, P. Bhadja, F. W. Low, S. K. Sahari, S. Hussain, F. K. Loong, A. Ahmad, T. S. AlGarni, M. Shafa, H. Asghar and S. A. Al-Tamrah, Arabian J. Chem., 2021, 14, 102953 CrossRef CAS.
- D. C. Marcano, D. v Kosynkin, J. M. Berlin, A. Sinitskii, Z. Sun, A. Slesarev, L. B. Alemany, W. Lu and J. M. Tour, ACS Nano, 2010, 4, 4806–4814 CrossRef CAS PubMed.
- Z. G. Geng, G. H. Zhang, Y. Lin, X. X. Yu, W. Z. Ren, Y. K. Wu, N. Pan and X. P. Wang, Chin. J. Chem. Phys., 2013, 25, 494 CrossRef.
- S. Drewniak, R. Muzyka, A. Stolarczyk, T. Pustelny, M. Kotyczka-Morańska and M. Setkiewicz, Sensors, 2016, 16(1) DOI:10.3390/S16010103.
- Y. U. Shang, D. Zhang, Y. Liu and C. Guo, Bull. Mater. Sci., 2015, 38, 7–12 CrossRef CAS.
- N. Wu, X. She, D. Yang, X. Wu, F. Su and Y. Chen, J. Mater. Chem., 2012, 22, 17254–17261 RSC.
- P. Liu, Y. Huang and L. Wang, Mater. Lett., 2013, 91, 125–128 CrossRef CAS.
- J. Li, Y. Cheng, S. Zhang, Y. Li, J. Sun, C. Qin, J. Wang and L. Dai, Composites, Part A, 2017, 101, 115–122 CrossRef CAS.
- A. Liang, X. Jiang, X. Hong, Y. Jiang, Z. Shao and D. Zhu, Coatings, 2018, 8(1) DOI:10.3390/COATINGS8010033.
- G. S. Hikku, K. Jeyasubramanian, A. Venugopal and R. Ghosh, J. Alloys Compd., 2017, 716, 259–269 CrossRef CAS.
- S. O. Pehkonen and S. Yuan, Interface Sci. Technol., 2018, 23, 13–21 Search PubMed.
- M. Daniyal and S. Akhtar, J. Build. Pathol. Rehabil., 2019, 5, 1–20 Search PubMed.
- N. H. Othman, M. Che Ismail, M. Mustapha, N. Sallih, K. E. Kee and R. Ahmad Jaal, Prog. Org. Coat., 2019, 135, 82–99 CrossRef CAS.
- A. Kausar, J. Thermoplast. Compos. Mater., 2022, 35(10) DOI:10.1177/0892705720907653.
- A. L. Ma, S. L. Jiang, Y. G. Zheng and W. Ke, Corros. Sci., 2015, 91, 245–261 CrossRef CAS.
| This journal is © The Royal Society of Chemistry 2023 |


