
 Open Access Article
 This Open Access Article is licensed under a Creative Commons Attribution-Non Commercial 3.0 Unported Licence
Large-scale oxygen order phase transitions and fast ordering kinetics at moderate temperatures in Nd2NiO4+δ electrodes†
Sumit Ranjan
Maity
*ab,
Monica
Ceretti
 c,
Ruben
De Barros
c,
Lukas
Keller
a,
Jürg
Schefer
a,
Antonio
Cervellino
d,
J. Alberto
Rodríguez Velamazan
e and
Werner
Paulus
*c
c,
Ruben
De Barros
c,
Lukas
Keller
a,
Jürg
Schefer
a,
Antonio
Cervellino
d,
J. Alberto
Rodríguez Velamazan
e and
Werner
Paulus
*c
aLaboratory for Neutron Scattering and Imaging, Paul Scherrer Institut, Villigen, CH-5232, Switzerland. E-mail: sumit050491@gmail.com
bUniversity of Geneva, Department of Quantum Matter Physics (DQMP) 24, Quai Ernest Ansermet, CH-1211, Genève 4, Switzerland
cICGM, Univ. Montpellier, CNRS, ENSCM, Montpellier, France. E-mail: werner.paulus@umontpellier.fr
dSwiss Light Source, Paul Scherrer Institut, Villigen, CH-5232, Switzerland
eInstitut Laue-Langevin, 71 Avenue des Martyrs, F-38042, Grenoble, France
First published on 13th December 2022
Abstract
Non-stoichiometric 214-nickelates with Ruddlesden–Popper (RP) type frameworks emerged as potential candidates for mixed electronic/ionic conductors in the intermediate temperature range. In this work we investigated structural aspects of the oxygen ion mobility diffusion mechanisms in non-stoichiometric Nd2NiO4+δ nickelates by X-ray (laboratory and synchrotron) as well by neutron diffraction. Temperature dependent synchrotron powder diffraction revealed a phase diagram of unprecedented complexity, involving a series of highly organized, 3D modulated phases related to oxygen ordering below 800 K. All phase transitionsimply translational periodicities exceeding 100 Å, and are found to be of 1st order, together with fast ordering kinetics. These surprising structural correlations, induced by the presence of interstitial oxygen atoms, suggest a collective phason-like oxygen diffusion mechanism together with dynamical contributions from the aperiodical lattice creating shallow diffusion pathways down to room temperature.
Introduction
Tailoring new materials with improved oxygen mobility especially at moderate temperatures is of great scientific interest owing to their potential applications in electrochemical energy conversion and energy storage devices, including intermediate temperature solid oxide fuel cells (IT-SOFCs), oxygen membranes, and solid oxide electrolysis cell devices.1–5 In this regard, non-stoichiometric 214-nickelates (Ln2NiO4+δ; Ln = La, Pr or Nd) of the Ruddlesden–Popper (RP) series with layered K2NiF4 structure appear as one of the most promising candidates due to their electronic complexity and enhanced oxygen mobility down to ambient temperature.5–15 The crystal structure of these compounds, as shown in Fig. 1(a), can be described as a layered structure with alternate stacking of NiO2 layers and rock salt type Ln2O2 bilayers along the stacking-axis (c-axis) of the tetragonal unit cell.16 Oxygen diffusion in these materials has been shown to be highly anisotropic, following a push–pull diffusion mechanism between apical (Oap) and vacant interstitial oxygen sites (Oint) inside the rock salt layer, promoted by large displacements of the Oap atoms.17–21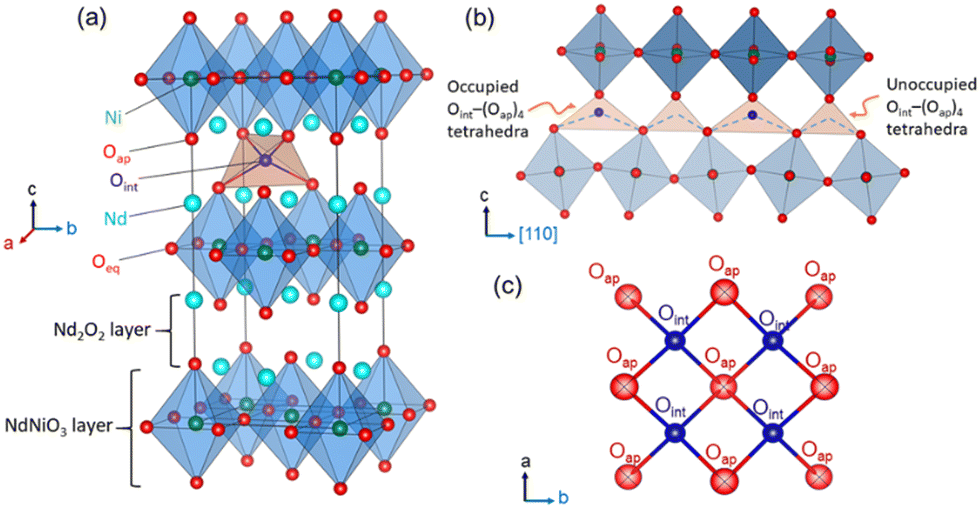 | ||
| Fig. 1 (a) K2NiF4 type layered crystal structure of Nd2NiO4+δ, consisting of alternating perovskite and rock-salt layers along the stacking axis. Only one out of possible eight tetrahedral interstitial sites are occupied for a δ value of ≃0.23. (b) The tilting scheme of NiO6 octahedra induced by oxygen ordering in the interstitial sites, resulting in alternative occupied (expanded) and unoccupied (contracted) Oint–(Oap)4 tetrahedra along the diffusion pathway, promoting anisotropic oxygen diffusion along [110], involving Oint–Oap–Oint tetrahedral chains as shown with blue dashed lines. (c) Sketch of the Oap and Oint atoms within the rock salt layer projected along [001]. | ||
Our present work focuses on the Nd2NiO4+δ (NNO) system that shows a complex structural and electronic phase diagram as a function of temperature and the excess oxygen content δ.22–24 As for other Ruddlesden–Popper type oxides, structural strain is present due to a large lattice mismatch between the NiO2 and Nd2O2 rock salt layers. While the high-temperature tetragonal (HTT) structure with space group F4/mmm yields a sufficiently good matching between these layers,25 the strain is released by the cooperative tilt around [100] of NiO6 octahedra, lowering the symmetry from tetragonal to orthorhombic. It consequently creates a lattice instability for the apical oxygen atoms which are significantly shifted from their equilibrium positions, left on a shallow potential.19,26
The incorporation of excess oxygen (Oint) atoms into the vacant tetrahedral interstitial sites inside the Nd2O2 bilayers leads to oxygen hyper-stoichiometric NNO with 0 ≤ δ ≤ 0.2527 (see Fig. 1(a)). This partially relieves the structural strain as the oxidation of Ni2+ towards Ni3+ results in shorter Ni–O distances.16 The strain is also reduced due to the presence of interstitial oxygen atoms (Oint) causing important shifts of all adjacent oxygen apical atoms (Oap) towards [110], forming symmetrically increased Oint(Oap)4 tetrahedra. The as shifted Oap atoms thereby directly point towards adjacent vacant Oint lattice sites, thus promoting the push–pull diffusion mechanism between Oap and Oint atoms. The excess oxygen atoms can be reversibly inserted into the tetrahedral lattice sites at room temperature by electrochemical red/ox reactions in an aqueous alkaline solution, clearly demonstrating high oxygen mobility to proceed down to room temperature.24,27 The related RT phase diagram of Nd2NiO4+δ shows in addition to two orthorhombic line phases with an extra oxygen stoichiometry of δ = 0.23 and 0.00, a non-stoichiometric phase with 0.08 ≤ δ ≤ 0.12. It thus involves two miscibility gaps outside this stoichiometry range, i.e., for 0 ≤ δ ≤ 0.08 and 0.12 ≤ δ ≤ 0.23 corresponding to the fully reduced and oxidized phases.
With increasing oxygen uptake the local distortions of the Oint(Oap)4 tetrahedra get organized on a larger length scale, as evidenced by neutron and synchrotron diffraction experiments.7,19,28–31 Ordering schemes of unprecedent structural complexity have been reported for the homologous Pr2NiO4+δ, where sub-mesoscopic ordering is observed for δ = 0.25 attaining translational periodicities of ca. 100 Å.31 Thereby puzzling correlations are established between oxygen, charge, and spin ordering. In this context, we could recently also unveil a complex 3D modulated structure related to oxygen ordering at RT for Nd2NiO4.1, the related modulation vectors being Qn = ±2/13a* ± 3/13b* and Qn = ±1/5a* ± 1/2c*. Below TN ≅ 50 K, antiferromagnetic ordering is observed, with magnetic modulation vectors identical to those observed for the oxygen ordering.7 This clearly suggests that the magnetic ordering is directly influenced by the oxygen ordering. It underlines that strong correlations exist between structural and electronic ordering schemes, which condition in the case of Nd2NiO4.10 the degree of freedom for electronic, i.e., spin ordering, as oxygen ordering sets in at much higher temperatures compared to magnetic ordering. The simple presence of Oint becomes then decisive to create strong structural correlations, which have also been demonstrated for Pr2NiO4.25 to persist upon heating, attaining temperatures of almost 700 K. Even above this temperature, the correlations between Oint and Oap atoms partially continue to exist, as indicated by strong diffuse scattering contributions, and involved correlation lengths of about 25 Å.31 While the real structure of modulated, oxygen doped Ruddlesden–Popper type oxides remains hitherto unexplored in terms of atomic positions and octahedra tilting etc., no further coupling mechanism between lattice and electronic ordering has been reported so far in detail. Our understanding for such lattice-electronic coupling schemes is thus limited to a more phenomenological description, which is already interesting by itself.
While for oxygen-doped Ruddlesden–Popper type oxides, structural ordering goes along with electronic ordering schemes towards lower T, only little information is known on the evolution of these complex ordering schemes and respective stabilities with increasing T. Thus, our intention is to further explore the stability range of oxygen ordering but also the emergence of possible new ordering schemes as a function of temperature, together with their dependence on the oxygen stoichiometry. Such studies are highly relevant for a better understanding of oxygen diffusion mechanisms as they allow to discriminate up to which extent such mechanisms may be described as single particle events or based on the long-range oxygen ordering, need to be understood as a correlated process similar to phonons.
To further deepen structure and dynamics of oxygen doped Ruddlesden Popper phases, we report here on order/order phase transitions evidenced in Nd2NiO4+δ, for which a complex 3D incommensurate oxygen ordering has already been reported to be present at ambient temperature.32
Using synchrotron X-ray powder diffraction (SXRPD), we were able to evidence a series of 1st order phase transitions related to oxygen ordering below the phase transition into the tetragonal high-T parent phase at 800 K.
In order to facilitate the complex structural behaviour presented in more detail below, we briefly anticipate our findings, evidencing a series of several order/order phase transitions of Nd2NiO4+δ in the moderate T-range below 800 K, which are of extreme complexity and well-defined phase definition, all showing 3D modulated structures. Surprisingly, ordering kinetics are found to proceed instantly, despite the translational periodicities observed exceeding 100 Å for all involved phases. It thus implies that oxygen is not only exceptionally mobile, but also shows the ability for large-scale correlations, indicative to promote collective, phonon-assisted diffusion behaviour as a result of lattice instabilities following phonon softening.33
Experimental methods
Sample synthesis
Nd2NiO4+δ single crystal growth was done at the Institut Charles Gerhardt Montpellier (ICGM) using a two-mirror optical floating zone furnace at high temperature in an oxygen atmosphere as described elsewhere.32 The crystal was further annealed in air at 670 K for 7 days to obtain a uniform oxygen non-stoichiometry δ. A representative powder sample was prepared by crushing a small section of the single crystal. The single crystal and powder samples were kept at ambient for more than six months prior to all the measurements.Thermogravimetric measurements
The average oxygen content δ in the powder sample was determined by thermogravimetric (TG) measurements in 5%-H2/95%-He gas atmosphere in the temperature range of 300–1273 K. The measurement was carried out at the Laboratory for Multiscale Materials Experiments (LDM) of the Paul Scherrer Institute (PSI) using a Netzsch STA 449 C analyzer. The powder sample was fully decomposed into Nd2O3 and metallic Ni at high temperatures. The δ content in the powder sample was determined to be 0.23(2) from the TG weight loss curve as displayed in Fig. 2(a), in agreement with the previously reported result.32 Further TG measurements on the powder sample of Nd2NiO4.23 were carried out in 33%O2/67%Ar atmosphere in the temperature range of 300–1273 K with a heating/cooling rate of 5 K min−1 using PerkinElmer TG8000 at ICGM (weight accuracy of 0.1 μg). A baseline correction with an empty sample holder was applied to all the measurements.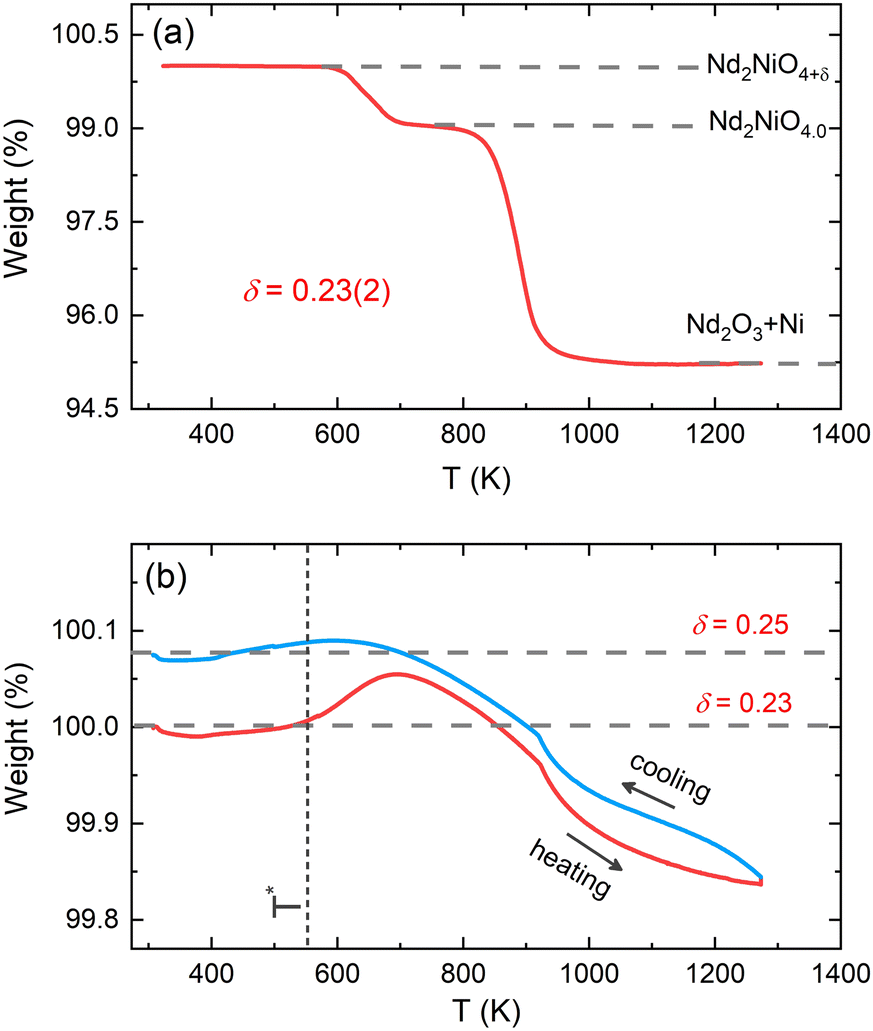 | ||
| Fig. 2 (a) TG weight loss curve of the crushed powder sample of Nd2NiO4+δ measured in 5%-H2/95%-He gas atmosphere with a heating rate of 5 K min−1. The average excess oxygen content δ has been determined to be ≃0.23(2). (b) The temperature evolution of sample weight in 33%O2/67%Ar atmosphere. Vertical dashed lines denote the temperature T* ≈ 550 K where the modulation vector of the excess oxygen ordering changes during cooling. | ||
X-ray diffraction measurements
Temperature-dependent laboratory X-ray powder diffraction (XRPD) measurements were carried out at the Bioenergy and Catalysis Laboratory (LBK) of PSI using a Bruker D8 advanced diffractometer using CuKα1,2 radiation in the temperature range of 300–1273 K in air atmosphere. The XRPD patterns were collected every 50 K during heating while a temperature step of 100 K was used for cooling to check for reversibility. Synchrotron X-ray powder diffraction (SXRPD) measurements were performed at different temperatures between RT-873 K at the Material Sciences (MS) beamline X04SA at the Swiss Light Source (SLS) of the Paul Scherrer Institute, Switzerland.34 The wavelength and instrumental resolution parameters were determined from a standard LaB6 powder (NIST), measured under identical experimental conditions. Samples were filled into thin quartz capillaries of 0.3 mm diameter and continuously rotated to reduce the effect of preferred orientation during data collection. The pattern at each temperature was collected roughly for two minutes. A hot air blower was used for the high-temperature SXRPD measurements. SXRPD patterns in the temperature range of 853 K < T < 723 K during cooling could not be measured due to a detector problem. All powder diffraction patterns were analyzed using the FullProf suite program.35 The crystal structure is visualized using the VESTA freeware.36 Single crystal X-ray diffraction studies at room temperature (298 K) were carried out at the ICGM using an STOE-StadiVari (MoKα Xenocs Microfocus tube) diffractometer system with a Dectris 200K Pilatus pixel-detector.Neutron diffraction measurements
Single crystal neutron diffraction measurements at 20 K and 300 K were performed using ZEBRA/TriCS single crystal diffractometer (equipped with a point detector) at SINQ, PSI.37 An incident wavelength of λ = 1.178(1) Å was used to access a reciprocal space up to Q = 4π![[thin space (1/6-em)]](https://www.rsc.org/images/entities/char_2009.gif) sinθ/λ ≃ 9.5 Å−1. The high-temperature measurements at 673 K and 1073 K were carried out on D9 (equipped with a 2D detector) at ILL (France) using a hot air blower.38 A monochromatic beam of wavelength λ = 0.837(1) Å was produced using the (220) plane of a Cu crystal an Er absorption filter in the transmission geometry to access a large reciprocal space up to Q ≃ 11.3 Å−1. Integrated intensities of structural Bragg peaks were collected with standard transverse scans (ω-scans) with the c-axis of the crystal aligned vertically to the scattering plane of the diffractometer. Least-square refinements of the Lorentz corrected structure factors were carried out using the JANA2006 program.39
sinθ/λ ≃ 9.5 Å−1. The high-temperature measurements at 673 K and 1073 K were carried out on D9 (equipped with a 2D detector) at ILL (France) using a hot air blower.38 A monochromatic beam of wavelength λ = 0.837(1) Å was produced using the (220) plane of a Cu crystal an Er absorption filter in the transmission geometry to access a large reciprocal space up to Q ≃ 11.3 Å−1. Integrated intensities of structural Bragg peaks were collected with standard transverse scans (ω-scans) with the c-axis of the crystal aligned vertically to the scattering plane of the diffractometer. Least-square refinements of the Lorentz corrected structure factors were carried out using the JANA2006 program.39
Nuclear densities were reconstructed in real space through the Maximum Entropy Method (MEM) via Dysnomia40 and nuclear density distributions were visualized by using the VESTA program.
Results
The room temperature phase and oxygen stoichiometry
Before discussing the structural changes in detail, we anticipate a brief discussion on the O-stoichiometry of as-synthesized Nd2NiO4+δ samples (NNO), as this plays an important role for its modulation, and it is also important for the choice of material for the T-dependent SXRPD studies. The situation of NNO is pretty much similar to its homologue Pr2NiO4+δ (PNO), for which a topotactic oxygen release of as-grown single crystals has been discussed, changing its oxygen stoichiometry from δ = 0.25 to δ = 0.225 within several months, when stored under ambient atmosphere.31 The reason for such an unusual behaviour is that the extra oxygen uptake is stabilized at high temperatures as a consequence of the strain release discussed above, while at room temperature the structure slowly relaxes towards another oxygen ordering scheme, involving a small but significant change in the stoichiometry as well as the modulation vector. The change in the O-stoichiometry also goes along with minor but significant changes in the lattice parameters.31 It is therefore essential to associate to any crystallographic characterization of NNO samples their thermal history. While the relaxation time for oxygen release may require more than a year on large single crystals, 50 μm size crystals need approximately 2–3 months to relax towards their ground state in terms of oxygen stoichiometry and related modulation vectors. For this reason, the powder samples used for the SXRPD experiment were obtained from a single crystal that has been exposed at 673 K in air for 7 days, before grinding it into powder with a typical grain size of a few μm. This powder was then stored for 6 months at ambient conditions prior to the diffraction studies. The O-stoichiometry of the as-treated samples has been thoroughly analysed by TG measurements in hydrogen atmosphere, revealing an overall stoichiometry of Nd2NiO4.23 as shown in Fig. 2a. Further on, we studied the thermal evolution of the O-stoichiometry of Nd2NiO4.23 as outlined in Fig. 2b. Upon heating, an O-uptake starts to set in slightly before 600 K, while beyond 700 K O-release is observed, reaching a value of δ = 0.19 at 1273 K. Upon cooling a reversible O-uptake sets in, showing a maximum at 600 K, and maintaining a final stoichiometry corresponding to Nd2NiO4.25 at room temperature. We thus note that the interstitial oxygen atoms remain confined inside the structure at δ = 0.25, while getting released towards Nd2NiO4.23 on a timescale of several weeks.From laboratory XRPD measurements on a polycrystalline sample that was kept in ambient conditions for more than 6 months, NNO appears to adopt the standard K2NiF4 structure for Ruddlesden–Popper type oxides, resembling the high temperature orthorhombic (HTO) phase reported previously for Nd2NiO4+δ with δ ≈ 0.21–0.224.23 A closer inspection, however, evidences a subtle splitting of all (hhl)-type reflections, related to a small monoclinic distortion (see Fig. S1, ESI†). The monoclinic splitting is also illustrated in the inset of Fig. 3(a) at room temperature for (448) and (![[4 with combining macron]](https://www.rsc.org/images/entities/char_0034_0304.gif) 48) structural Bragg peaks, while its T-dependence is plotted in Fig. 3(b). The monoclinic space group F112/m (a non-standard setting of space group C112/m), corresponding to the low temperature monoclinic (LTM) phase, satisfactorily describes the positions of the main structural reflections as well as the monoclinic splitting of (hhl)-type Bragg reflections. Rietveld refinements are illustrated in Fig. 3(a) and Fig. S1 (ESI†) for the 300 K SXRPD data and laboratory XRPD data, respectively, showing a good agreement between the experimental and calculated patterns. The cell parameters at RT are refined to be a = 5.3908(1) Å, b = 5.4510(1) Å, c = 12.3695(2) Å, α = β = 90° with γ = 90.076(4).19,41
48) structural Bragg peaks, while its T-dependence is plotted in Fig. 3(b). The monoclinic space group F112/m (a non-standard setting of space group C112/m), corresponding to the low temperature monoclinic (LTM) phase, satisfactorily describes the positions of the main structural reflections as well as the monoclinic splitting of (hhl)-type Bragg reflections. Rietveld refinements are illustrated in Fig. 3(a) and Fig. S1 (ESI†) for the 300 K SXRPD data and laboratory XRPD data, respectively, showing a good agreement between the experimental and calculated patterns. The cell parameters at RT are refined to be a = 5.3908(1) Å, b = 5.4510(1) Å, c = 12.3695(2) Å, α = β = 90° with γ = 90.076(4).19,41
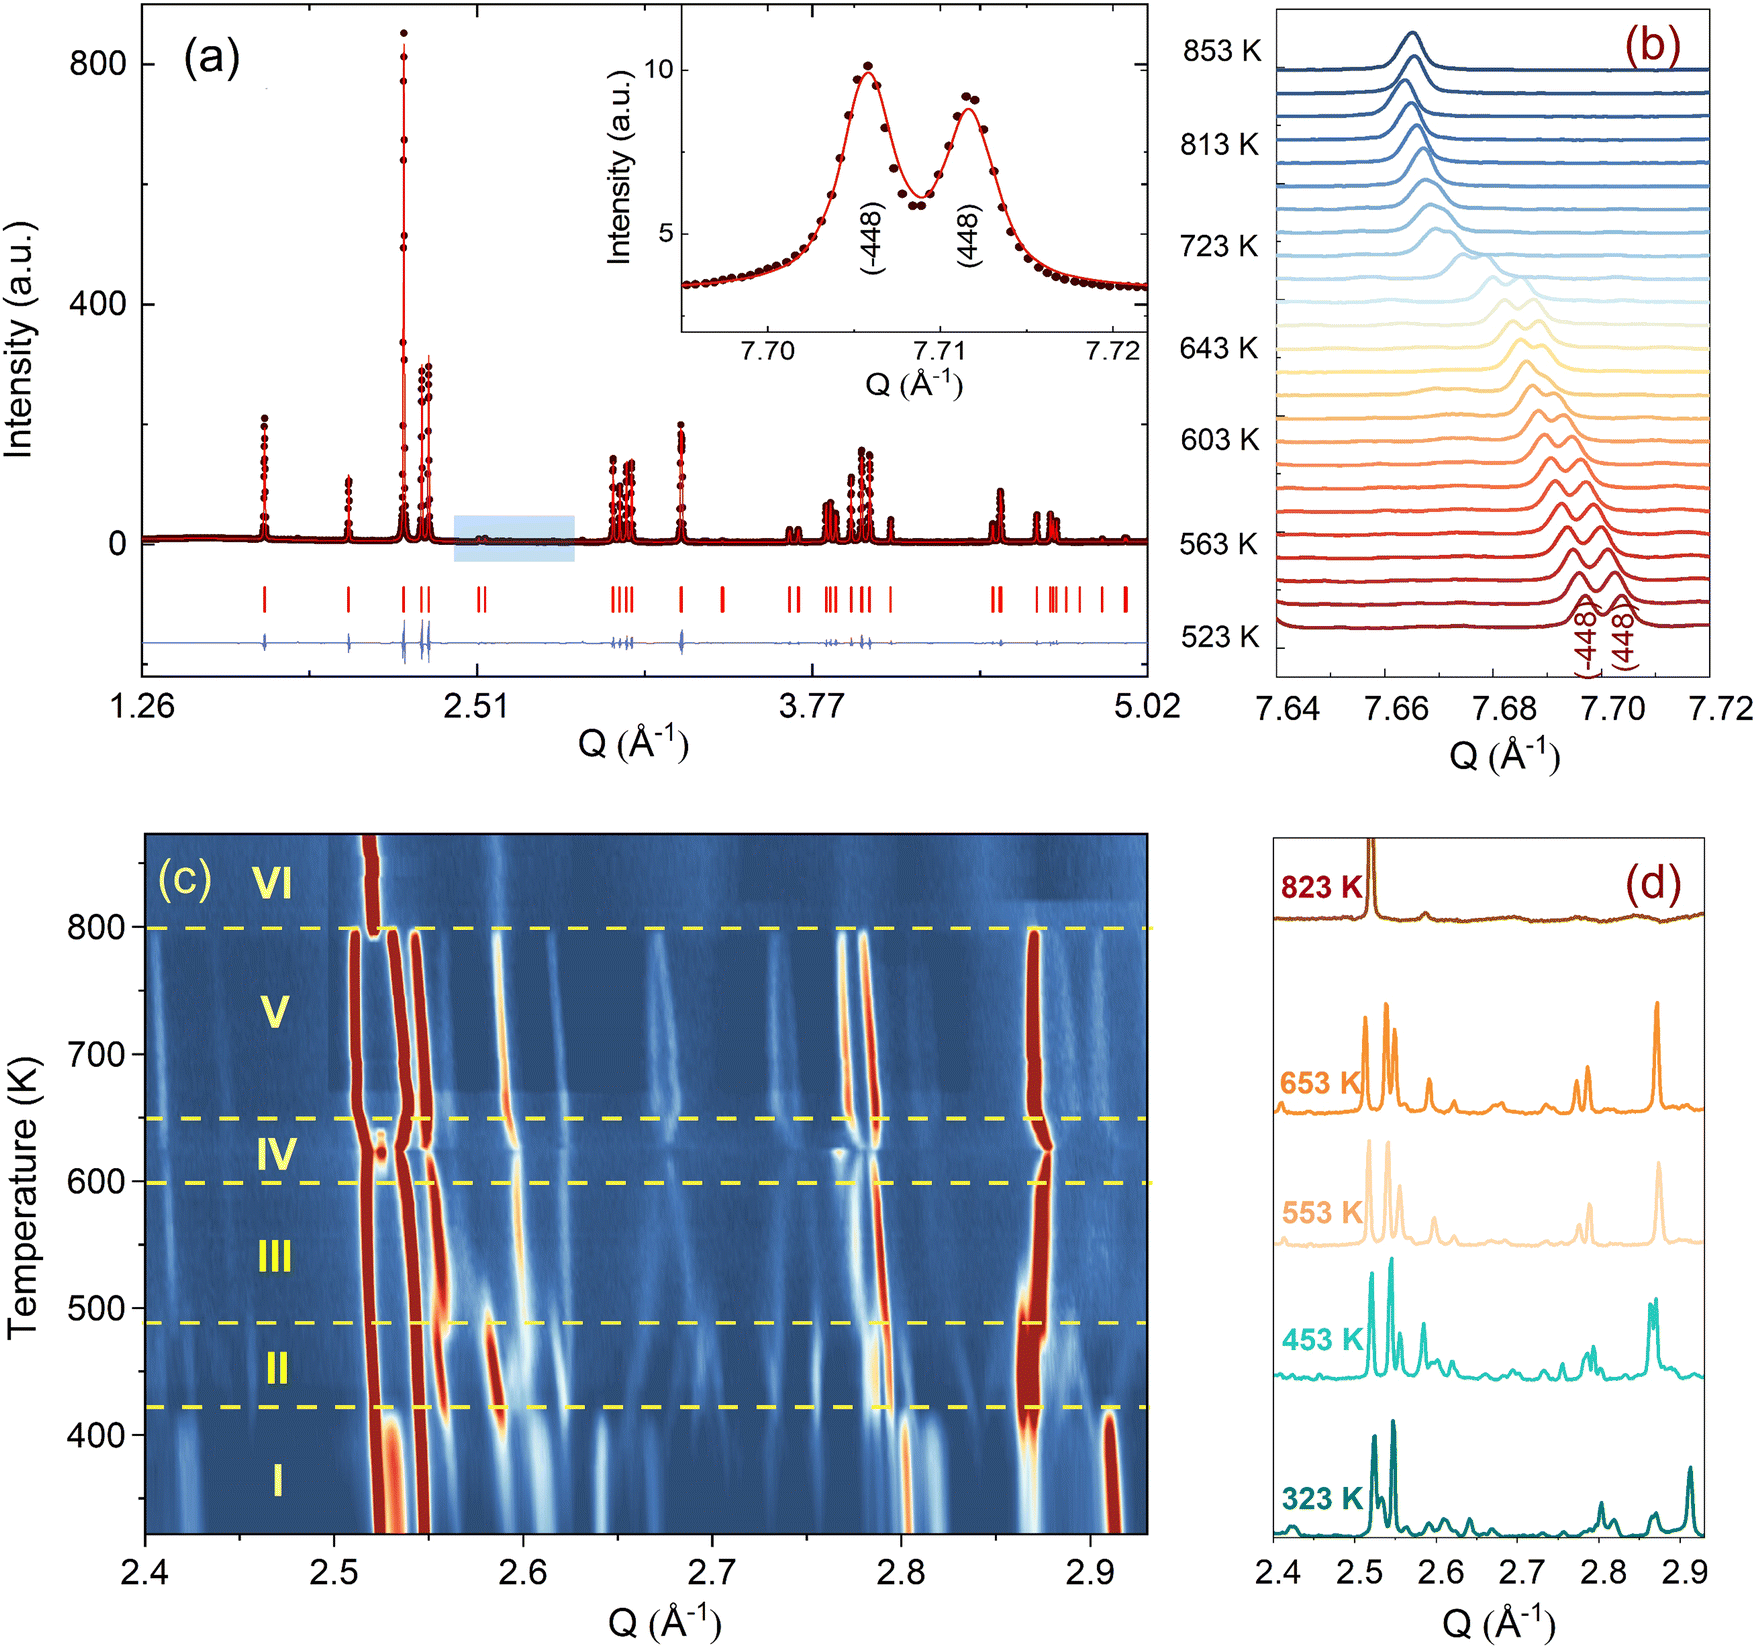 | ||
| Fig. 3 (a) A representative Rietveld fit refinement of the room temperature SXRPD pattern of Nd2NiO4.23 in space group F112/m. The experimental data are shown with filled circles while the calculated pattern is represented by a continuous line. The blue continuous line represents the difference curve. Red ticks show the positions of the structural Bragg peaks. The inset shows the splitting of (448) and (48) structural Bragg peaks resulting from the monoclinic distortion at room temperature. (b) The temperature evolution of the splitting between (448) and (48) structural Bragg peaks. Higher temperature data are shifted by along the y-axis for clarity. (c) The 2D contour plot representing the thermal evolution of oxygen superstructure reflections in the Q range of 2.4–2.95 Å−1, as shown with a blue box in (a). (d) Illustration of oxygen superstructure reflections at different temperatures in the powder data. The measurement was performed at MS-X04SA in SLS, PSI with λ = 0.5646(3) Å. | ||
From the SXRPD data the presence of extra reflections become evident (cf.Fig. 3(c and d)), which are 3 orders of magnitude lower compared to the strongest Bragg peaks. These reflections are not due to a simple increase of the unit cell but indicative for a 3D modulated oxygen ordering. For the diffraction data at RT, they could be indexed using reconstructed diffraction planes obtained from single crystal X-ray diffraction as further outlined below.
A correct indexation of the satellite reflections is, however, mandatory for the interpretation of the complex T-dependent structural changes obtained for NNO (see Fig. 3c). Fig. 4(a) shows the reconstructed (hk1)-plane of a single crystal, which has been stored at ambient conditions for more than 4 years. It reveals a 3D modulated structure, similar to what has been recently reported for the homologous Pr2NiO4+δ system.31 The reconstructed (hk1)-plane shows the typical splitting of the main reflections, related to the twining as a consequence of the tetragonal/orthorhombic symmetry reduction, involving two out of four possible orthorhombic twin domains sharing a common (![[1 with combining macron]](https://www.rsc.org/images/entities/char_0031_0304.gif) 10)-plane. Thereby each orthorhombic twin domain can further on split up into four monoclinic twin domains, following the twin relations described in Fig. S2 (ESI†). The possible maximum number of monoclinic twin domains which may be expected here is consequently eight. The important number of satellite reflections as illustrated in Fig. 4a can then be understood as the overlay of all eight monoclinic twin domains with a modulation vector of Qn = ±0.813a* ± 0.519b* at RT. The simulation of the peak positions, indicated by white circles, considers the generation of satellite reflections up to 2nd order harmonics in space group F112/m. It also involves the separation due to the orthorhombic twin domains, finally demonstrating an excellent agreement with the experimental data. While the positions of the satellite reflections can be precisely simulated, their intensities cannot. A decrease in the intensity is expected to go along with the order of the satellites, so the simulations consider a relative intensity description with the diameter of the circles being largest for the basic reflection, while decreasing from the 1st order, becoming smallest for the 2nd order satellites.
10)-plane. Thereby each orthorhombic twin domain can further on split up into four monoclinic twin domains, following the twin relations described in Fig. S2 (ESI†). The possible maximum number of monoclinic twin domains which may be expected here is consequently eight. The important number of satellite reflections as illustrated in Fig. 4a can then be understood as the overlay of all eight monoclinic twin domains with a modulation vector of Qn = ±0.813a* ± 0.519b* at RT. The simulation of the peak positions, indicated by white circles, considers the generation of satellite reflections up to 2nd order harmonics in space group F112/m. It also involves the separation due to the orthorhombic twin domains, finally demonstrating an excellent agreement with the experimental data. While the positions of the satellite reflections can be precisely simulated, their intensities cannot. A decrease in the intensity is expected to go along with the order of the satellites, so the simulations consider a relative intensity description with the diameter of the circles being largest for the basic reflection, while decreasing from the 1st order, becoming smallest for the 2nd order satellites.
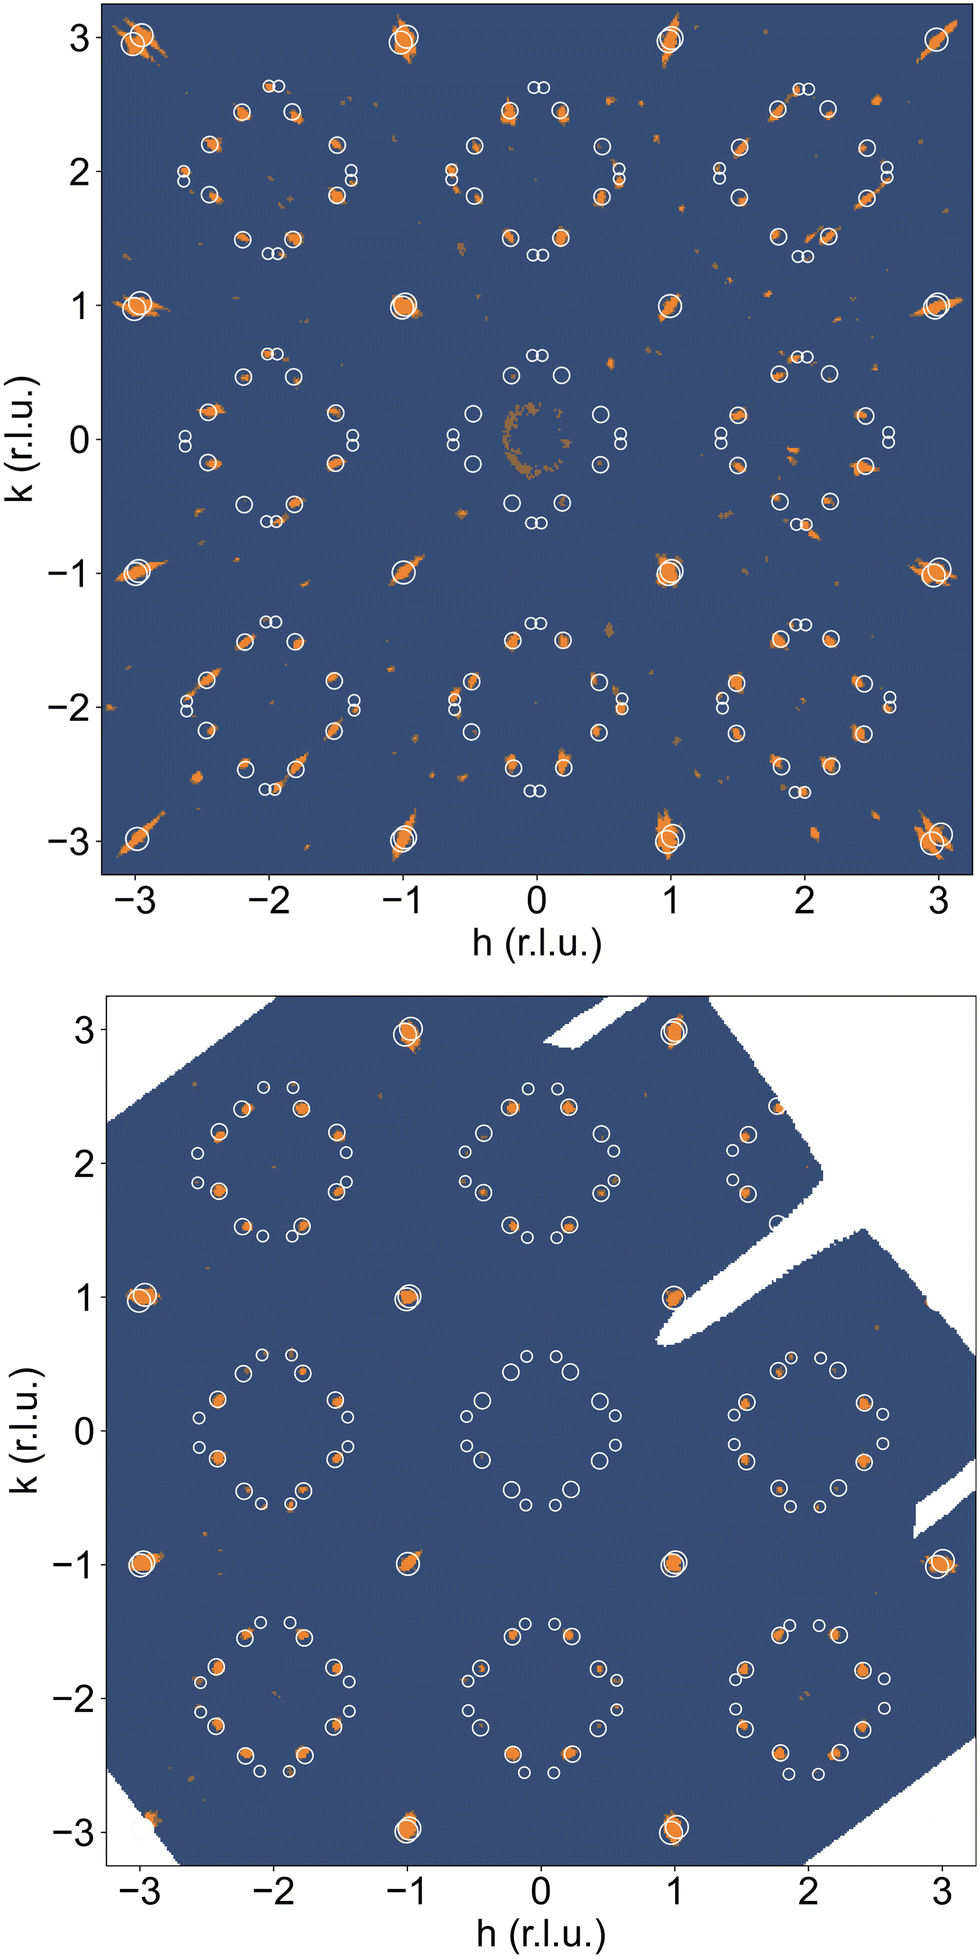 | ||
| Fig. 4 Section of reconstructed (hk1) planes obtained with single X-ray diffraction (STOE StadiVari, MoKα) measurements at 300 K on a NNO single crystal (a) which has been stored at ambient conditions (starting phase) for more than 4 years and (b) after the heating to 723 K in O2, and subsequent cooling to room temperature within 24 h. Simulated positions of the superstructure reflections are overlaid onto the experimental data with white circles. Both phases correspond to (a) δ ≈ 0.23 and (b) 0.25, respectively, as revealed by precise TG measurements. The superstructure reflections in the staring phase correspond to a modulation vector Qn = 0.813(2)a* + 0.519(2)b* up to 3rd order, while those in the end phase correspond to a modulation vector Qn = 7/9a* + 5/9b* up to 2nd order. The simulations consider a relative intensity modification with the diameter of the circles being largest for the basic reflection while decreasing with the order of satellites. | ||
We note that the observed modulation vector for NNO at RT up to ≈400 K is close to a lock-in transition at Qn = ±0.833a* ± 0.5b*, and thus equivalent to Qn = ±5/6a* ± 0.5b* as found for Pr2NiO4.225.31 The latter involves in fine a commensurate description with a corresponding unit cell of 10a × 6b. The incommensurate modulation vector Qn = ±0.813a* ± 0.519b*, obtained from the single crystal at RT, could have been applied successfully as starting values, to index the SXRPD data of phase (I) of NNO, as shown in Fig. S3 (ESI†). Due to the significant intensity reduction between the 1st and the 2nd order satellite reflections, the pattern could already be fitted considering only the 1st order satellite reflections, yielding a refined modulation vector for phase (I) at 373 K being Qn = ±0.8245(1)a* ± 0.5230(1)b*.
Temperature dependent SXRPD studies
We could anyhow characterize the modulation vector for the high-T phase Nd2NiO4.25, related to its structural kinetic stability upon cooling to ambient conditions. We therefore heated a pristine Nd2NiO4.23 single crystal from RT to 723 K, which, after oxygen uptake to Nd2NiO4.25 was cooled down to RT within 24 h, and subsequently investigated by single crystal X-ray diffraction measurements. Fig. 4b shows the (hk1) plane for the as-obtained Nd2NiO4.25, which significantly differs from Nd2NiO4.23 (Fig. 4a) for both, the orthorhombic splitting of the twin domains, as well as for the modulation vector. Satellite reflections up to the 2nd order are present, yielding a modulation vector of Qn = ±0.7778a* ± 0.5556b*. Using this vector as starting value for the indexation of the SXRPD data obtained for phase (V), Rietveld refinements yielded Qn = ±0.7835(1)a* ± 0.5524(1)b* at 703 K (see Fig. S4, ESI†). These values nearly coincide with the formation of a commensurate periodicity and thus Qn = ± 7/9a* ± 5/9b* with a corresponding unit cell of 14a × 10b. Beside the important thermal stability of this modification up to 800 K, this monoclinic phase (V) shows consequently translational periodicities of 94 Å. This is deduced from the length of the diagonal in the (a,b)-plane of the commensurate unit cell with 14a × 10b, the corresponding lattice parameters being a = 5.40653(2) Å, b = 5.47047(2) Å and c = 12.45542 Å. Above 800 K, the symmetry changes from monoclinic to tetragonal, while no sharp satellite reflections are observed anymore. Some broad reflections, however, continue to exist even beyond the phase transition, indicating that structural correlations still exist, however, on a shorter length scale. The T-dependence of the monoclinic distortion is outlined in Fig. 3b as well as in Fig. 5c, together with all other lattice parameters, indicating this discontinuous transition to be of 1st order. The characteristics for all other phase transitions are different as they all preserve a monoclinic symmetry. Thereby the positions of all basic reflections, e.g. (202/022) in Fig. 3c, remain at the same angular position in the T-range from RT to 600 K (phases I–III), while satellite reflections change positions and intensities. The (448) and (48) reflections are clearly splitted up to 800 K, indicating the monoclinic symmetry. It shows that the integrity of the Nd2NiO4+δ framework remains predominantly untouched, while several defined phases with different modulation vectors emerge. On a qualitative basis it becomes thus clear that distinct oxygen ordering scenarios get established, each showing a well-defined periodicity, following a topotactical rearrangement, essentially concerning the oxygen atoms. It also suggests that all phases are close energetically and can easily switch in between these different ordering arrangements.
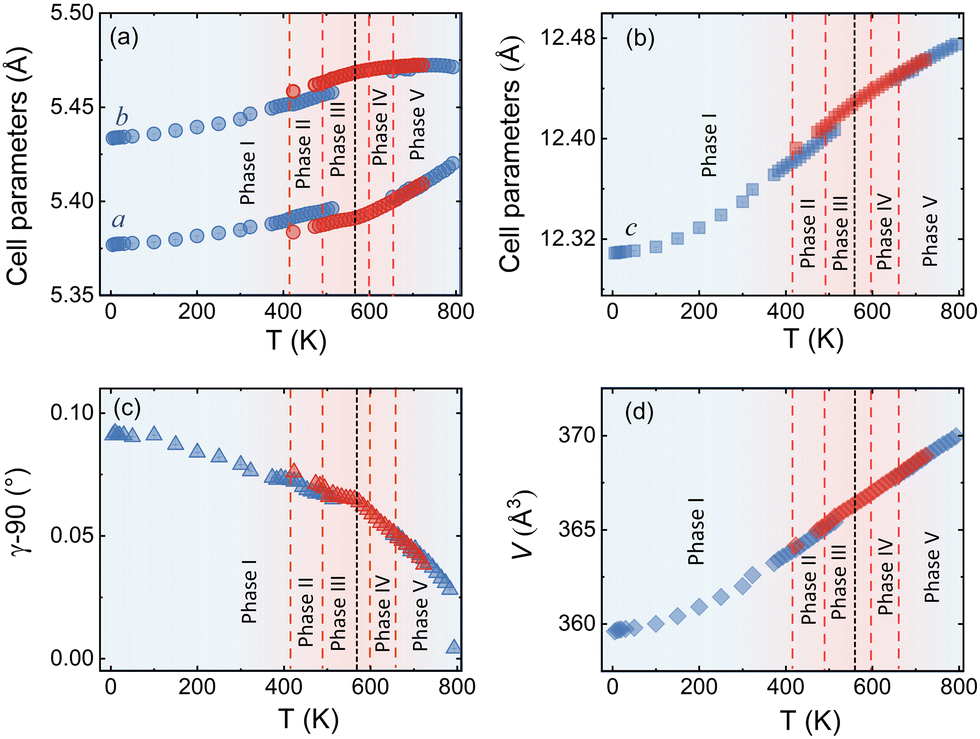 | ||
| Fig. 5 Variation of lattice parameters of the average monoclinic unit cell extracted from SXRPD data of Nd2NiO4.23 as a function of temperature. Data obtained during heating and cooling are given in blue and red symbols, respectively. Six different modulated phases which are distinguished during heating are also marked while the red dashed lines roughly indicate the transition temperatures. The black dotted line at ca. 550 K denotes the temperature at which the modulation vector of the excess oxygen ordering changes upon cooling. The missing data points in the temperature range of 723–853 K during cooling are due to a technical problem during data collection. Lattice parameters around the formation of phase IV are not given due to the presence of oxygen uptake in this region, accompanied by the formation of additional broadened reflections, rendering a uniform refinement difficult. | ||
The comparison of the reflection positions and their respective intensities suggest that phases (V) and (III) are pretty much identical, which becomes also clear from the refinement of the modulation vector being Qn = ±0.7778(1)a* ± 0.5556(1)b* at 583 K as displayed in Fig. S5 (ESI†). Both phases are separated by region (IV), where additional diffraction peaks can be identified between 600 K and 650 K. Comparison with the TG results shows that in this region an oxygen uptake into the lattice occurs, which is also indicative for the slight changes in the scattering angles of the basic reflections. Phases (III) and (V) consequently have a different oxygen stoichiometry: while phase (III) still shows the initial stoichiometry corresponding to Nd2NiO4.23, phase (V) is supposed to have a stoichiometry with δ close to 0.25. We note that upon heating, diffuse type additional reflections (see Fig. 3c) appear at T ≥ 523 K, indicating the development of a secondary phase, coexisting with phases (III) and (IV). Attempts to determine the corresponding lattice parameters of this secondary phase at T ≈ 625 K were so far unsuccessful, as it is probably composed as an intergrowth phase, showing a kind of layer stacking disorder, similar to the interstratified arrangements of graphite or silicate frameworks.
Phase (II) appearing at around 400 K is an interesting case, showing a discontinuous modification of the modulation vector, together with small but significant changes in the lattice parameters as shown in Fig. 3c and 5(a–d). Compared to the starting phase (I), the modulation vector for phase (II) considerably changes towards the values found for phases (III) and (V) which can be refined to Qn = ±0.7762(1)a* ± 0.5623(1)b* at 433 K, as demonstrated in Fig. S6 (ESI†). In the absence of single crystal data, this phase does not permit an unambiguous assignment so far. The slight splitting of the reflection at Q = 2.87 Å−1 could, however, only be achieved with a slight deviation of the b* component from the commensurate indexation (±0.5556b*) as observed for phases (III), (V) and (VI) as discussed outlined above.
A 2D colormap representing the temperature evolution of oxygen superstructure reflections during cooling in the Q range of 2.1–2.95 Å−1 is shown in Fig. S8 (ESI†). Two phases, corresponding to phase (V) and (VII) could clearly be distinguished during cooling, showing again a sharp transition situated at around 550 K.
The modulation vector above 550 K, describing the superstructure peaks of phase (V), was refined to be Qn = ±0.7835(1)a* ± 0.5524(1)b* at 623 K (see Fig. S9, ESI†) i.e. pretty identical with the modulation vector determined for phase (V) during heating. Noticeable changes are found below this temperature in the evolution of lattice parameters as represented in Fig. 5. Below 550 K, the modulation vector remains almost the same down to 300 K, and it was refined to Qn = ±0.7734(1)a* ± 0.5569(1)b* at 423 K (see Fig. S10, ESI†).
Thus, the modulation vector at room temperature after cooling is found to be slightly different from the one before heating, which is justified by the difference of the oxygen content δ (Δδ ≈ 0.02) between starting and end phase.
Single crystal neutron diffraction and maximum entropy analysis
In view of the different phase transitions described above, we were also interested in the respective evolution of thermal displacement parameters, at least on an average scale, especially for the apical and equatorial oxygen atoms, and their correlation with the ordering of excess oxygen atoms. For this purpose, high-resolution single crystal neutron diffraction measurements were carried out, taking advantage of the increased sensitivity of neutrons for low-Z atoms, i.e., oxygen. Due to the lack of suitable 2D neutron area detectors, this study only considers the basis reflections, i.e., reflections fulfilling the conditions for F-centring in the whole T-range. The second reason making a data collection of satellite reflections problematic is related to the superposition of the satellite intensities as resulting from the formation of pseudo-merohedral twin domains, causing an important overlay of different twin domains not allowing to obtain unique structure factors for the superstructure reflections.The superposition of intensities from the pseudo-merohedral twin domains also causes a systematic overlay of all main Bragg reflections (see Fig. S2, ESI†). We consequently averaged all overlaid integrated intensities of (hkl) and (khl) type Bragg reflections, resulting into a refinement by least squares methods in the tetragonal F4/mmm space group using JANA2006, despite the real symmetry being monoclinic. The results of all refinements are summarized Table 1.
| Atoms | 20 K | 300 K | 673 K | 1073 K |
|---|---|---|---|---|
| Ni (0 0 0) | ||||
| Occ. | 1 | 1 | 1 | 1 |
| U 11 = U22 | 0.0025(6) | 0.0041(5) | 0.0086(4) | 0.0118(3) |
| U 33 | 0.0064(7) | 0.0141(7) | 0.0238(5) | 0.0327(6) |
| Nd (00z) | ||||
| Occ. | 2 | 2 | 2 | 2 |
| z | 0.3598(12) | 0.3596(11) | 0.35933(8) | 0.36016(9) |
| U 11 = U22 | 0.0080(5) | 0.0121(5) | 0.0209(5) | 0.0269(4) |
| U 33 | ||||
| Oap (00z) | ||||
| Occ. | 1.70(2) | 1.74(2) | 1.66(3) | 1.82(2) |
| z | 0.1728(2) | 0.1735(3) | 0.1735(2) | 0.1759(2) |
| U 11 = U22 | 0.058(2) | 0.060(2) | 0.077(3) | 0.085(3) |
| U 33 | 0.0016(16) | 0.0076(15) | 0.0120(10) | 0.0190(10) |
| Oeq (0.25,0.25,0) | ||||
| Occ. | 2.007(15) | 1.985(14) | 2.027(19) | 2.026(15) |
| U 11 = U22 | 0.0044(8) | 0.0065(7) | 0.0165(7) | 0.0216(5) |
| U 33 | 0.0490(18) | 0.0520(16) | 0.0635(16) | 0.0648(16) |
| U 12 | 0.0004(7) | −0.0014(6) | −0.0061(5) | −0.0087(5) |
| Oint (1/4 1/4 1/4) | ||||
| Occ. | 0.238(17) | 0.252(16) | 0.128(14) | 0.112(17) |
| U iso | 0.033(9) | 0.036(8) | 0.040(6) | 0.046(16) |
| R p (%) | 5.65 | 5.81 | 5.63 | 4.35 |
| R wp (%) | 8.15 | 7.6 | 8.29 | 6.30 |
At 300 K, the oxygen over-stoichiometry δ in the crystal structure is refined to be 0.238(17), in agreement with the value obtained from TGA analysis of the polycrystalline sample. The reason for the lower occupancies for the Oap site with respect to a full site occupancy, is related to strong and anharmonic displacements of all Oap atoms, as discussed in ref. 19 and which do not allow to cover all O-scattering density within a harmonic description. Fig. 6 illustrates the 2D nuclear density distributions for different sections, obtained with the MEM algorithm at various temperatures. The nuclear density data were obtained taking into consideration the phased structure factors obtained for the refinements given in Table 1. We note that only 1/8 of all available interstitial sites are effectively occupied.
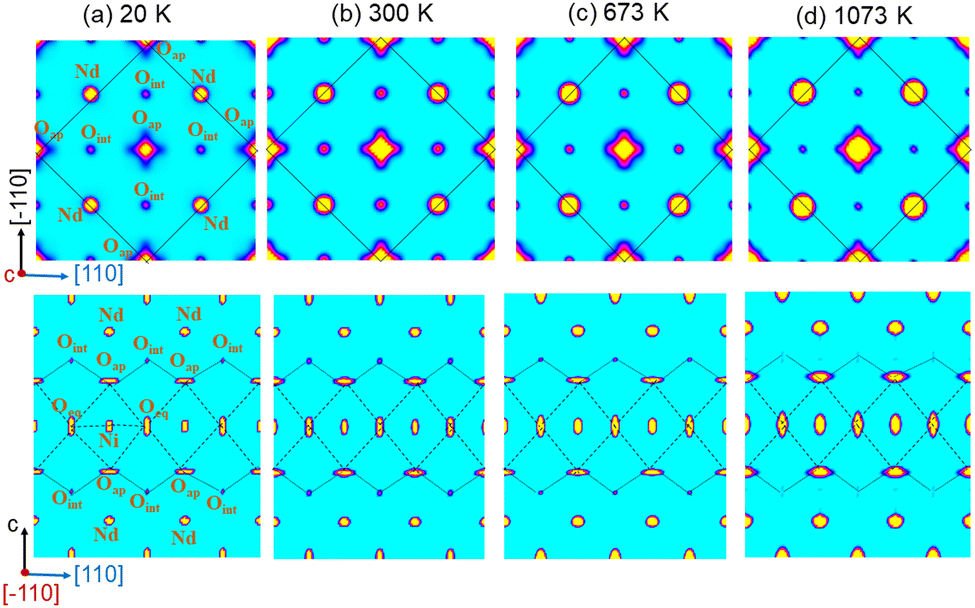 | ||
| Fig. 6 Maximum entropy analysis of single crystal neutron diffraction data of Nd2NiO4.23 obtained at (a) 20 K, (b) 300 K, (c) 673 K, and (d) 1073 K. (Upper row) (110)–(10) projection of 2D nuclear density maps particularly showing Oap displacements toward the nearest Oint site. The black continuous line outlines the F-centred average chemical unit cell. (Lower row) (110)/(001) projection of 2D nuclear density maps displaying the Oap–Oint–Oap oxygen diffusion pathway along the [110] direction. Single crystal data at 20 K and 300 K were recorded on ZEBRA/TriCS (λ = 1.178(1) Å) at SINQ, PSI while 673 K and 1073 K data were measured on D9 (λ = 0.837(1) Å) at ILL. | ||
The Oap shows a U12 contribution in F4/mmm, contrary to the standard setting in I4/mmm. This is related to the change of the point group symmetry, being (m.2m) and (mmm) for the respective positions in (xx0) in F4/mmm, and (½, 0, 0) in I4/mmm. For the (xx0)-position in F4/mmm the x value is then constrained to exactly ¼. A strong anharmonic contribution of the Oap displacement is observed specifically along [110] with respect to the F-symmetry cell, i.e. towards the nearest interstitial lattice site as evidenced Fig. 6a–d. As indicated in the ab-projection of the rock salt layer in the range of 0.14 ≤ z ≤ 0.28, strong and defined Oap displacements are also observed at 20 K, indicating a significant static contribution to the Oap shifts. This static component can most probably be attributed to the incommensurate structural modulations, representing all displacements of the Oap atoms from their average positions. The scattering densities of Oap atoms are strongly enhanced at 300 K along [110] indicating a shift of about 2 Å from the average position, corresponding to a tilt of ca. 25° for the NiO6 octahedra. It presents the average deviation from the equilibrium position of Oap in (00z), taking into account a dynamical tilting along [110], as discussed in ref. 19. They are essentially related to the presence of interstitial oxygen atoms in (¼, ¼, ¼), pushing away the adjacent apical oxygen atoms, related to steric constrains. This is the main reason also why dynamically activated diffusion takes place for Ruddlesden Popper type oxides only for δ > 0. The strongly enhanced displacements of the Oap atoms in the (a,b)-plane are already reflected in the anisotropic displacement factors in Table 1, where U11 (eq. to U22) presents at least four times to the value of U33. The anharmonic description which implicitly results from the MaxEnt analysis then clearly indicates the large components to be along [110], which cannot be analyzed from a harmonic refinement in F4/mmm, as the main displacement components are defined with respect to the principal axes.
The strong enhancement of scattering density at already 300 K shows an increasing dynamical origin with temperature, in parallel to contributions from incommensurate structural modulations. The displacements of the Oap atoms thus allow a symmetric increase of the Oint–(Oap)4 tetrahedra with an Oint–Oap distance of about 2.8 Å, compared to 2.15 Å for the radius of an empty tetrahedron. These findings are fully equivalent to what is reported for the homologous Pr2NiO4+δ, indicating an oxygen diffusion pathway between apical and vacant interstitial sites in the [110]-direction inside the rock salt layer. Such a dynamical activation is also in agreement with a phonon-assisted diffusion mechanism, which becomes of importance in view of the diffusion pathway along [110],7,13,15,19,42 showing a sequence of filled and empty (Oap)4 tetrahedra, of strongly different size (see Fig. 1c). The oxygen diffusion mechanism close to room temperature therefore involves important local structural distortions that are far from a rigid body description but resembling along the diffusion pathway to a successively in- and exhaling mechanism of the involved tetrahedra. At higher T (673 K), the incommensurate structural modulations vary, becoming different to those at room temperature, showing a significantly broader delocalization of the Oap atoms within the ab-plane and likely due to enhanced thermal contributions. However, no double-well potential, as reported for the homologous Pr2NiO4+δ,19 is observed for Nd2NiO4+δ, related to the shift of the tetragonal phase transition towards higher temperatures.
A significantly different scenario is, however, observed for Oap atoms at 1073 K, i.e. above the monoclinic/tetragonal phase transition, clearly indicating a more isotropic nuclear scattering density distribution in the ab-plane. At this temperature all satellite reflections related to oxygen ordering are vanished, indicating a disordered and thus uncorrelated Oint scenario.
Discussion
While oxygen can be reversibly intercalated into Nd2NiO4+δ at room temperature, our findings evidence for the first time an easy switching of long-range oxygen ordering at the sub-mesoscopic length scale with fast ordering kinetics. This directly implies the presence of extremely mobile interstitial oxygen atoms, resulting into the formation of long-range oxygen ordering, organized as 3D modulated structures, manifested by the observation of a series of discontinuous, i.e. 1st order phase transitions, in a T-range from RT to 800 K. The incommensurate modulation vector for Nd2NiO4.23 evolves from Qn = ±0.8126a* ± 0.5185b* at RT to Qn = ±0.7762a* ± 0.5623b* at 433 K, towards Qn = ±0.7778a* ± 0.5556b* at 583 K, the latter corresponding into a commensurate indexation with Qn = ±7/9a* ± 5/9b*. However, this lock-in transition towards a commensurate indexation is not the final state and further evolves, along with an oxygen uptake, towards Nd2NiO4.25 with Qn = ±0.7835a* ± 0.5524b* at 703 K.Thus, the Oap oxygen atoms not only show a much more isotropic delocalization and consequently a loss of correlations with the excess oxygen atoms. Therefore, they are supposed to be highly mobile in this temperature range as observed for Pr2NiO4+δ in the disordered tetragonal phase.
Such a series of complex reorganisation of the oxygen ordering is completely unexpected and suggests all phases to stay on a quite similar energetical landscape. This also shows that oxygen is sufficiently mobile to build up new but structurally well-defined ordering scenarios, all on a large-scale. More importantly, they all involve a rapid reorganization of the ordering schemes, thus implying fast ordering kinetics. On the other hand, long-range correlations are indicative for cooperative diffusion mechanisms, suggesting that lattice instabilities, i.e., the apical oxygen atoms following octahedra tilting, may result into a 1D shallow diffusion pathway along [110], directly involving alternating vacant and filled interstitial lattice sites as shown in Fig. 1c. In this way incommensurate periodicities either created by structural distortions or modulated distribution of the Oint atoms, may then contribute into a soliton-like diffusion mechanism, following non-linear structural as well as anharmonic contributions of dynamic origin.
The unusually high displacement factors found for the apical oxygen atoms by single crystal neutron diffraction, thereby suggest a strong deviation of all Oap from their equilibrium positions due to the structural modulation.
In analogy to Pr2NiO4+δ, the changes of the modulation vector of as grown single crystals observed with time while exposing the sample at ambient conditions, clearly indicate structural changes, which, together with the thermogravimetric studies (Fig. 2b) demonstrate that oxygen diffusion proceeds at RT, linked to long-range oxygen ordering.
Apart from the high Oint mobility at already moderate temperatures, the thermal stability of oxygen ordering up to 800 K appears to be surprising. It confirms the idea of a dynamically decoupled Nd2O2 rock salt layer, separated by infinite Ni2O2 layers as discussed for the homologous Pr2NiO4+δ phase.19 While at the same time Oint atoms are easily mobile inside the rock salt layer, they strongly distort locally the Oint(Oap)4 tetrahedra, which consequently becomes the origin of establishing a long-range organisation of all occupied and empty tetrahedra. It thus induces naturally a lattice dynamical component to trigger the oxygen diffusion along the [110] direction of the 1D tetrahedral chains.
One may suppose that the 1D character of the diffusion pathway together with the oxygen ordering is stabilising the monoclinic symmetry in oxygen rich Nd2NiO4+δ phases, which transform directly into a tetragonal high-T parent phase showing Oint disorder. It is remarkable that no orthorhombic intermediate phase is identified during this phase sequence. The presence of Oint atoms thus induces strong structural correlations which, however, still allow a fine tuning with temperature as encountered here, indicated by different ordering schemes. Similar correlations have already been shown to induce electronic correlations for Nd2NiO4.1 resulting into identical 3D modulation vectors for oxygen as well as spin ordering.
The strong anisotropic displacements as determined from the scattering density maps shown in Fig. 6 are strongest at lower temperatures, becoming more isotropic with increasing T. It becomes clear that at high T practically all lattice modes are sufficiently activated to obtain an isotropic diffusion behaviour, that can be described by the Arrhenius Ansatz. Given the anisotropic displacements at lower T to be at least partially of dynamic origin, this lattice dynamics could consequently promote an oxygen diffusion mechanism in the direction of these displacements. Similarly, anisotropic displacements have been found for bcc metals close to their bcc/hcp phase transition above 1000 °C, e.g. Ti or Hf, together with a significant increase of their self-diffusion coefficient by several orders of magnitude.43–45 The same type of phase transition and respective increase of the self-diffusion coefficient is also observed below 2 K for solid He, excluding that the increase for self-diffusion, is not limited by the temperature.46,47 For all these bcc/hcp phase transitions the increase of self-diffusion is essentially coupled to phonon softening. The dynamically activated anharmonic lattice dynamics of the RE2O2 rock salt layers of oxygen-doped Ruddlesden–Popper type oxides, is supposed to have a very similar impact on the self-diffusion coefficients, here given as the oxygen mobility. Then, phonon softening can be easily promoted due to long-range oxygen ordering, which may result in lattice instabilities leaving the apical oxygen atoms on a shallow potential.
Conclusions
We have evidenced a series of complex order/order phase transitions generation for Nd2NiO4+δ, resulting into well-defined oxygen ordering scenarios up to the sub-mesoscale, together with fast ordering kinetics. The fast rearrangement for different oxygen ordering schemes thereby directly involves a rapid oxygen mobility in a very moderate temperature range. These findings are new and suggest interpreting related oxygen diffusion mechanisms to be strongly correlated and/or cooperative. Such a mechanism is supposed to get amplified by phonon softening, e.g. engendered as a consequence of lattice instabilities, based on long-range oxygen ordering. Thereby, the oxygen-doped Ruddlesden–Popper phases present a special scenario, as the tetrahedral Oint(Oap)4 chains inside the RE2O2 rock salt layer appear as an interface, dynamically decoupled from the rest of the structure. Such type of directional diffusion mechanism can in principle be understood as an anisotropic Arrhenius behaviour, in which an essential part of the lattice energy is projected along one direction, yielding a shallow, 1D diffusion pathway with low activation energies along the [110]-direction. Oxygen diffusion might then be understood as the result of a constructive lattice dynamics which is in phase with the diffusing species similar to a phason, taking profit of the aperiodicity of the underlying lattice and associated lattice dynamics.We could also show that ordering kinetics play an important role to stabilize ordering schemes, e.g. during the cooling of Nd2NiO4.25 from 723 K to ambient, while conserving the high-T modulation vector. It offers an interesting concept to obtain phases with identical O-stoichiometry but different modulation vectors. If such a behaviour could be enlarged for other oxygen-doped oxides, it would offer the possibility to probe the influence of structural vs. electronic ordering phenomena at the same valence state configuration of a given transition metal atom, enabling to correlate charge- and spin ordering and related dynamics for different modulation vectors at invariant hole concentration. This is a unique opportunity for oxygen-doped phases, and which is not possible in case of Sr-doping, which leads to a statistical distribution of all A-cations. The fact that oxygen is mobile down to ambient conditions allowing to achieve different ordering schemes is therefore a challenging and so far mainly unexplored opportunity to probe correlations between structural and electronic ordering.
Conflicts of interest
There are no conflicts to declare.Acknowledgements
The authors acknowledge the beam times used on TriCS/ZEBRA at PSI/SINQ and D9 at ILL as well as laboratory equipment and support from LDM/PSI, LBK/PSI, and the “Plateforme d’Analyse et de Caractérisation” of the ICG Montpellier. The authors gratefully acknowledge the financial support from the Swiss National Science Foundation (SNF) through grant 200021L_157131 and the French National Research Agency (ANR) through grant 14-CE36-0006-01 of the SECTOR project as well as the grant ANR-19-CE05-0041-01 of the ExODiff project. The beamtime allocation on D9 (DIR-152) is accessible under DOI: http://10.5291/ILL-DATA.DIR-152.References
- Y.-H. Huang, R. I. Dass, Z.-L. Xing and J. B. Goodenough, Science, 2006, 312, 254 CrossRef CAS PubMed.
- A. M. Saranya, A. Morata, D. Pla, M. Burriel, F. Chiabrera, I. Garbayo, A. Hornés, J. A. Kilner and A. Tarancón, Chem. Mater., 2018, 30, 5621–5629 CrossRef CAS PubMed.
- F. Chiabrera, I. Garbayo, L. López-Conesa, G. Martín, A. Ruiz-Caridad, M. Walls, L. Ruiz-González, A. Kordatos, M. Núñez, A. Morata, S. Estradé, A. Chroneos, F. Peiró and A. Tarancón, Adv. Mater., 2019, 31, 1805360 CrossRef PubMed.
- I. Garbayo, F. Chiabrera, N. Alayo, J. Santiso, A. Morata and A. Tarancón, J. Mater. Chem. A, 2019, 7, 25772–25778 RSC.
- A. Chroneos, B. Yildiz, A. Tarancón, D. Parfitt and J. A. Kilner, Energy Environ. Sci., 2011, 4, 2774–2789 RSC.
- R. Dutta, A. Maity, A. Marsicano, J. R. Stewart, M. Opel and W. Paulus, Phys. Rev. B, 2020, 102, 165130 CrossRef CAS.
- S. R. Maity, M. Ceretti, L. Keller, J. Schefer, M. Meven, E. Pomjakushina and W. Paulus, Phys. Rev. Mater., 2021, 5, 014401 CrossRef CAS.
- S. R. Maity, M. Ceretti, L. Keller, J. Schefer, T. Shang, E. Pomjakushina, M. Meven, D. Sheptyakov, A. Cervellino and W. Paulus, Phys. Rev. Mater., 2019, 3, 083604 CrossRef CAS.
- E. Boehm, J. M. Bassat, P. Dordor, F. Mauvy, J. C. Grenier and P. Stevens, Solid State Ionics, 2005, 176, 2717–2725 CrossRef CAS.
- C. Ferchaud, J.-C. Grenier, Y. Zhang-Steenwinkel, M. M. A. van Tuel, F. P. F. van Berkel and J.-M. Bassat, J. Power Sources, 2011, 196, 1872–1879 CrossRef CAS.
- J. A. Kilner, Solid State Ionics, 2000, 129, 13–23 CrossRef CAS.
- J. A. Kilner and M. Burriel, Annu. Rev. Mater. Res., 2014, 44, 365–393 CrossRef CAS.
- A. Chroneos, D. Parfitt, J. A. Kilner and R. W. Grimes, J. Mater. Chem., 2010, 20, 266–270 RSC.
- A. Maity, R. Dutta and W. Paulus, Phys. Rev. Lett., 2020, 124, 147202 CrossRef CAS PubMed.
- A. Maity, R. Dutta, O. Sendtskyi, M. Ceretti, A. Lebranchu, D. Chernyshov, A. Bosak and W. Paulus, Chem. Mater., 2022, 34, 414–421 CrossRef CAS.
- J. D. Jorgensen, B. Dabrowski, S. Pei, D. R. Richards and D. G. Hinks, Phys. Rev. B: Condens. Matter Mater. Phys., 1989, 40, 2187–2199 CrossRef CAS PubMed.
- J.-M. Bassat, M. Burriel, O. Wahyudi, R. Castaing, M. Ceretti, P. Veber, I. Weill, A. Villesuzanne, J.-C. Grenier, W. Paulus and J. A. Kilner, J. Phys. Chem. C, 2013, 117, 26466–26472 CrossRef CAS.
- A. Villesuzanne, W. Paulus, A. Cousson, S. Hosoya, L. Le Dreau, O. Hernandez, C. Prestipino, M. I. Houchati and J. Schefer, J. Solid State Electrochem., 2011, 15, 357–366 CrossRef CAS.
- M. Ceretti, O. Wahyudi, A. Cousson, A. Villesuzanne, M. Meven, B. Pedersen, J. M. Bassat and W. Paulus, J. Mater. Chem. A, 2015, 3, 21140–21148 RSC.
- A. Perrichon, A. Piovano, M. Boehm, M. Zbiri, M. Johnson, H. Schober, M. Ceretti and W. Paulus, J. Phys. Chem. C, 2015, 119, 1557–1564 CrossRef CAS.
- A. Piovano, A. Perrichon, M. Boehm, M. R. Johnson and W. Paulus, Phys. Chem. Chem. Phys., 2016, 18, 17398–17403 RSC.
- H. Ishikawa, Y. Toyosumi and K. Ishikawa, J. Alloys Compd., 2006, 408–412, 1196–1199 CrossRef CAS.
- K. Ishikawa, K. Metoki and H. Miyamoto, J. Solid State Chem., 2009, 182, 2096–2103 CrossRef CAS.
- M. Ceretti, O. Wahyudi, G. André, M. Meven, A. Villesuzanne and W. Paulus, Inorg. Chem., 2018, 57, 4657–4666 CrossRef CAS PubMed.
- A. Flura, S. Dru, C. Nicollet, V. Vibhu, S. Fourcade, E. Lebraud, A. Rougier, J.-M. Bassat and J.-C. Grenier, J. Solid State Chem., 2015, 228, 189–198 CrossRef CAS.
- F. Magro, M. Ceretti, M. Meven and W. Paulus, J. Appl. Crystallogr., 2021, 54, 822–829 CrossRef CAS.
- S. Bhavaraju, J. F. DiCarlo, D. P. Scarfe, I. Yazdi and A. J. Jacobson, Chem. Mater., 1994, 6, 2172–2176 CrossRef CAS.
- J. M. Tranquada, J. E. Lorenzo, D. J. Buttrey and V. Sachan, Phys. Rev. B: Condens. Matter Mater. Phys., 1995, 52, 3581–3595 CrossRef CAS PubMed.
- Z. Hiroi, T. Obata, M. Takano, Y. Bando, Y. Takeda and O. Yamamoto, Phys. Rev. B: Condens. Matter Mater. Phys., 1990, 41, 11665–11668 CrossRef CAS PubMed.
- L. Le Dréau, C. Prestipino, O. Hernandez, J. Schefer, G. Vaughan, S. Paofai, J. M. Perez-Mato, S. Hosoya and W. Paulus, Inorg. Chem., 2012, 51, 9789–9798 CrossRef PubMed.
- R. Dutta, A. Maity, A. Marsicano, M. Ceretti, D. Chernyshov, A. Bosak, A. Villesuzanne, G. Roth, G. Perversi and W. Paulus, J. Mater. Chem. A, 2020, 8, 13987–13995 RSC.
- O. Wahyudi, M. Ceretti, I. Weill, A. Cousson, F. Weill, M. Meven, M. Guerre, A. Villesuzanne, J. M. Bassat and W. Paulus, CrystEngComm, 2015, 17, 6278–6285 RSC.
- W. Paulus, H. Schober, S. Eibl, M. Johnson, T. Berthier, O. Hernandez, M. Ceretti, M. Plazanet, K. Conder and C. Lamberti, J. Am. Chem. Soc., 2008, 130, 16080–16085 CrossRef CAS PubMed.
- P. R. Willmott, D. Meister, S. J. Leake, M. Lange, A. Bergamaschi, M. Boge, M. Calvi, C. Cancellieri, N. Casati, A. Cervellino, Q. Chen, C. David, U. Flechsig, F. Gozzo, B. Henrich, S. Jaggi-Spielmann, B. Jakob, I. Kalichava, P. Karvinen, J. Krempasky, A. Ludeke, R. Luscher, S. Maag, C. Quitmann, M. L. Reinle-Schmitt, T. Schmidt, B. Schmitt, A. Streun, I. Vartiainen, M. Vitins, X. Wang and R. Wullschleger, J. Synchrotron Radiat., 2013, 20, 667–682 CrossRef CAS PubMed.
- J. Rodríguez-Carvajal, Int. Union Crystallogr. Newsl., 2001, 26, 12–19 Search PubMed The complete FULLPROF suite can be obtained from: http://www.ill.eu/sites/fullprof/index.html.
- K. Momma and F. Izumi, J. Appl. Crystallogr., 2011, 44, 1272–1276 CrossRef CAS.
- ZEBRA: Thermal Single Crystal Diffractometer, http://www.psi.ch/sinq/zebra).
- D9: Hot neutron four circle diffractometer, https://www.ill.eu/users/instruments/instruments-list/d9/description/instrument-layout).
- V. Petříček, M. Dušek and L. Palatinus, Z. Kristallogr. - Cryst. Mater., 2014, 229, 345–352 CrossRef.
- K. Momma, T. Ikeda, A. A. Belik and F. Izumi, Powder Diffr., 2013, 28, 184–193 CrossRef CAS.
- T. Broux, C. Prestipino, M. Bahout, S. Paofai, E. Elkaïm, V. Vibhu, J.-C. Grenier, A. Rougier, J.-M. Bassat and O. Hernandez, Dalton Trans., 2016, 45, 3024–3033 RSC.
- M. Yashima, H. Yamada, S. Nuansaeng and T. Ishihara, Chem. Mater., 2012, 24, 4100–4113 CrossRef CAS.
- W. Petry, A. Heiming, J. Trampenau, M. Alba, C. Herzig, H. R. Schober and G. Vogl, Phys. Rev. B: Condens. Matter Mater. Phys., 1991, 43, 10933–10947 CrossRef PubMed.
- A. Heiming, W. Petry, J. Trampenau, M. Alba, C. Herzig, H. R. Schober and G. Vogl, Phys. Rev. B: Condens. Matter Mater. Phys., 1991, 43, 10948–10962 CrossRef CAS PubMed.
- J. Trampenau, A. Heiming, W. Petry, M. Alba, C. Herzig, W. Miekeley and H. R. Schober, Phys. Rev. B: Condens. Matter Mater. Phys., 1991, 43, 10963–10969 CrossRef CAS PubMed.
- I. Berent and E. Polturak, J. Low Temp. Phys., 1998, 112, 337–354 CrossRef CAS.
- T. Markovich, E. Polturak, S. G. Lipson, J. Bossy, E. Farhi, M. J. Harris and M. J. Bull, J. Low Temp. Phys., 2002, 129, 65–77 CrossRef CAS.
Footnote |
| † Electronic supplementary information (ESI) available: Laboratory X-ray and synchrotron powder diffraction patterns (Fig. S1–S10); twin domains scheme (Fig. S2). See DOI: https://doi.org/10.1039/d2ma00833e |
| This journal is © The Royal Society of Chemistry 2023 |