 Open Access Article
Creative Commons Attribution 3.0 Unported Licence
Heterogeneous catalytic conversion of solid anaerobic digestate waste to biofuels and value-added chemicals†
Collins I.
Akor
ab,
Ahmed I.
Osman
a,
Christopher S.
McCallum
 cd,
Neha
Mehta
e,
Kevin
Morgan
 *a,
Pamela
Walsh
 e,
Beatrice
Smyth
 e,
David W.
Rooney
ab and
Gary N.
Sheldrake
*a
aSchool of Chemistry and Chemical Engineering, Queen's University Belfast, Belfast BT9 5AG, Northern Ireland, UK. E-mail: k.morgan@qub.ac.uk; g.sheldrake@qub.ac.uk
bBryden Centre, Queen's University Belfast, Belfast, BT7 1NN, Northern Ireland, UK
cBryden Centre, Letterkenny Institute of Technology, Port Road, Letterkenny, Donegal, F92 FC93, Ireland
dTetra Tech, Locksley Business Park, 1 Montgomery Road, Belfast BT6 9UP, UK
eSchool of Mechanical and Aerospace Engineering, Queen's University Belfast, Belfast BT9 5AH, Northern Ireland, UK
First published on 23rd January 2023
Abstract
Increasing use of anaerobic digestion (AD) in agri-food waste management for the production of renewable methane has presented issues surrounding AD. One of the challenges of AD is handling the solid fraction of the digestate. Whilst the digestate, especially the liquid fraction, can currently be used as bio-fertiliser, there are still limitations to its use because of regulations on the nutrient loading in soil and possible run off resulting in eutrophication of water. Hence, there is a need for alternative forms of valorisation of both the liquid and solid digestate (SD). This work will focus on the potential of SD being a feedstock for biofuel and fine chemicals. The valorisation of the lignin constituent of SD would be a significant contribution to the success of the lignocellulosic biorefinery economy. This paper investigates the hydrogenolysis (HDO) of SD using Ni/ZnO2, Cu/Al2O3 and platinum group metal (PGM) catalysts such as Rh/C, Pd/C and Ru/C to extract the biofuel. The major products from the depolymerisation of the phenolic lignin monomer constituent of the SD are the known octane booster ethylguaiacol and the structurally related antioxidant butylated hydroxytoluene. Furthermore, using 2-methyltetrahydrofuran as a green solvent increased substrate conversion (by ∼13%) and bio-oil yield (by ∼17 wt%) compared to dioxane solvent used in previous studies. The life cycle assessment of the catalytic extraction of anaerobic digestate showed a total energy consumption of 849 MJ per tonne of digestate utilised and a net energy ratio of 1.7, which is considerably better than fossil petrol and diesel and comparable to conventional temperate biofuels.
Introduction
The global energy demand is still largely met with fossil-derived fuels.1–3 Furthermore, many everyday use chemicals are obtained from petroleum which is a non-renewable natural resource.4,5 Biomass offers a potential sustainable route for meeting future energy and chemical demands6,7 as a renewable alternative. Unlike other renewable synthesis routes, biomass has the potential to provide both aromatic and aliphatic compounds to produce biofuels, chemicals and polymers without numerous processing steps.8,9 Biomass feedstock known as lignocellulosic biomass comprises three main components: cellulose, hemicellulose and lignin at 40![[thin space (1/6-em)]](https://www.rsc.org/images/entities/char_2009.gif) :
:![[thin space (1/6-em)]](https://www.rsc.org/images/entities/char_2009.gif) 30
30![[thin space (1/6-em)]](https://www.rsc.org/images/entities/char_2009.gif) :
:![[thin space (1/6-em)]](https://www.rsc.org/images/entities/char_2009.gif) 30 wt%, respectively (on average).10 While cellulosic materials are broken down in AD, lignin-based materials tend not to be, due to their physical structure, which has a highly disorganised and chemically varied structure bonded by aryl ether, β-O-4 and α-O-4 linkages. As such, residual digestate can have high lignin content.11 The targeting of lignin as a sustainable source of aromatic intermediates has been a major goal of biomass valorisation for several decades, and recent rational approaches have shown some success.12 Furthermore, there has been progress in integrating fuels and chemicals into a wider biorefinery model,13,14 which opens options for all levels of added value as part of a biorefinery mix.
30 wt%, respectively (on average).10 While cellulosic materials are broken down in AD, lignin-based materials tend not to be, due to their physical structure, which has a highly disorganised and chemically varied structure bonded by aryl ether, β-O-4 and α-O-4 linkages. As such, residual digestate can have high lignin content.11 The targeting of lignin as a sustainable source of aromatic intermediates has been a major goal of biomass valorisation for several decades, and recent rational approaches have shown some success.12 Furthermore, there has been progress in integrating fuels and chemicals into a wider biorefinery model,13,14 which opens options for all levels of added value as part of a biorefinery mix.
Digestate is currently used in the agricultural sector to condition and improve the soil; however, with supplies typically exceeding local demands, the surplus digestate needs to be transported to areas lacking in nutrients or disposed of using additional downstream processing. Studies have shown that the transportation costs to the location of usage exceeds its value of being used as fertiliser15,16 and adds to its carbon footprint. Also, high nitrogen content, pathogens and chemical oxygen demand (COD) generated by digestate could be troublesome when leached into groundwater. Hence, the control of digestate needs to be mandated due to the pollution and disposal challenges it can cause.17–19
Residual digestate contains significant quantities of water, which means that the digestate is most often divided into two distinct fractions (liquid and wet solid) before further usage.20,21 Multiple studies have shown improved techniques for digestate application. Mangwandi et al. and Rehl et al.22,23 reported the use of digestate to produce granular organic fertiliser and compost, while Cathcart et al. investigated the use of the digestate solid fraction as a fuel pellet.24 Waste streams from AD could also be valorised as a nutrient for microalgae to produce a protein alternative to soybeans.25
Akor et al. investigated the potential of a circular economy at a 500 kW standalone on-farm AD plant that produces 102,429 MJ per day of biogas from a combination of three feedstocks (grass silage, chicken litter and cattle slurry at 20.5, 8.5 and 13.7 tonnes per day, respectively).26 This biogas production was found to generate ∼60 kg of solid digestate per tonne of feedstock.27 As such, based on the lower heating value, this would indicate the potential of pyrolysis of SD to produce an additional 653.4 kJ per tonne of feedstock, meaning a potential increase of at least 27.9 MJ energy production per day.26 Post pyrolytic char is expected to have become even more concentrated in inorganic metals, such as potassium, indicating that this char can become a viable feedstock for the fertiliser industry, as has been previously reported.28 This understanding aids the concept of a circular economy for anaerobic digestion and the energy potential of SD, thereby making AD plants more profitable.
During the last decade, the conversion of polysaccharides into renewable chemicals has received much attention,29,30 but the technologies for lignin valorisation are still less well-developed despite the progress already made. This is attributed to the intrinsic difficulty and heterogeneity of the aromatic biopolymer.31 Lignin is a highly branched polymer interlinked with di-phenyl ether units consisting of the building blocks p-coumaryl, coniferyl and sinapyl alcohol.32,33 The predominant bond connecting the building blocks is the β-O-4 linkage, next to C–C bonds.30 As the biggest renewable origin of phenolic biopolymer with distinctive chemical structure, lignin is a promising feedstock for bulk and fine chemicals as well as fuels.31,32,34 Its uses are as dispersants, emulsifiers, and ingredients in resins and plastic products31,35 as well as the production of fine chemicals, such as vanillin.36,37
The production of platform chemicals from the depolymerisation of biomass, especially lignin, is still a big challenge.31,34,35 One promising route in depolymerising lignin to produce low-molecular-weight compounds is via selective catalytic processes.31 Despite the complexity involved in catalytic depolymerisation of lignin, initial results are encouraging.38–40 Methods considered as significant depolymerisation processes are hydrolysis, hydrogenolysis, gasification, pyrolysis, liquid-phase reforming, and chemical oxidation.26,32,41,42 These methods normally yield modest amounts of various monomer compounds. Cho et al.43 reported the use of catalytic or noncatalytic fast pyrolysis and base-catalysed lignin depolymerisation (BCD) complex bio-oils with good quantity of 4-alkylated and methoxylated phenols, as well as a small yield of syringols, guaiacols, and catechols.44 Reductive depolymerisation such as hydrogenolysis and liquid phase reforming is another promising route for lignin valorisation.45 Different authors have reported high yields of phenolic monomers, up to 55%.46–49 Garrett et al.50 used hydrogenolysis to depolymerise suberin from bark which is the biopolymer source that is hydrophobic in nature. Garrett et al.50 also reported the depolymerisation of softwood using a heterogeneous metal catalyst such as Rh/C and Pd/C to produce 4-propylguaiacol and dihydroconiferyl alcohol bio-aromatic monomers. McCallum et al.51 studied the effect of base and a different green solvent such as methyl tetrahydrofuran (MeTHF) to Rh/C catalysed depolymerisation of suberin and the resultant product yield. Zakzeski et al.32 investigated and reported the catalytic production of monomeric and dimeric molecules from softwood. Schutyser et al.52 reported the use of selective nickel-catalysed (Ni/ZrO2, Ni/CeO2, Ni/Al2O3), Ru/C and Cu/ZrO2 hydrogenolysis to convert lignin-derived phenolic compounds to cyclohexanone-based polymer building blocks. It also said that nickel-based catalysts are cheaper compared to noble metals (e.g. Rh, Pd, Ru, Au, etc.).52 Also, Ni, Cu and Fe are more green and sustainable alternatives compared to the heavy metals; however, the so-called benign metals (Ni, Cu etc.) could be toxic as well, depending on their chemical reactivity.53–55 Mortensen et al.56 investigated and reported the use of Cu/Al2O3, Ni/ZrO2, Pd/C, Pt/C, and Ni–V2O5/SiO2 for HDO of phenol as a model compound for bio-oil. Roberts et al.40 examined and reported modest yields of bio-phenolics such as syringols, guaiacols and catechols in base-catalysed depolymerisation (BCD) of lignin.
Herein, the potential of biofuel production from the catalytic depolymerisation of SD from an AD plant which contains 29% lignin (as determined by the Klason analysis of insoluble acid lignin; see Experimental section below) in the lignocellulosic material was investigated using a range of heterogenous precious and active metal catalysts in an autoclave batch reactor. Additionally, this paper also uses life cycle assessment (LCA) to understand energy balance of the conversion of 1 tonne of anaerobic digestate to biofuels.
Experimental
Solid digestate preparation and characterisation
Digestate samples were collected from AgriAD and Agri-Food and Biosciences Institute (AFBI) AD plants located in Northern Ireland. Each digestate sample (1 L) was separated into liquid and solid using a centrifuge B 4i model operated at 6000 rpm for 9 minutes. The liquid and solid fractions were both then stored in the fridge at 0 °C overnight before being freeze-dried (Lyotrap freeze dryer operated at −50 °C and 0.1 mbar vacuum pressure) to completely evaporate the moisture. The freeze-dried samples were ground to a 1 mm particle size using a Kinematica Polymix grinder (PX-MFC 90D) for the hydrogenolysis reaction.Prior to reaction, Klason Insoluble Acid (KIL)55 analysis was carried out with the sample to confirm the percentage of lignin and was calculated to be ∼29%. KIL analysis was run in duplicate (calculation shown in ESI†).
2-Methyltetrahydrofuran (2-MeTHF) and aluminium chloride (AlCl3, 99%) were supplied by Alfa Aesar, while ammonia solution (35%) and copper oxalate hemihydrate (CuC2O4·1/2H2O, 98%) were supplied by Sigma Aldrich UK. All reactions were done using doubly distilled water. Commercial rhodium, palladium and ruthenium on carbon catalysts (5 wt% Rh 64%wet, 5 wt% Pd, Ru 60%wet) were supplied by Johnson Matthey. All other reagents and analytical standards used for GC–MS derivatisation were purchased from Sigma Aldrich.
Catalyst preparation
Catalyst characterisation
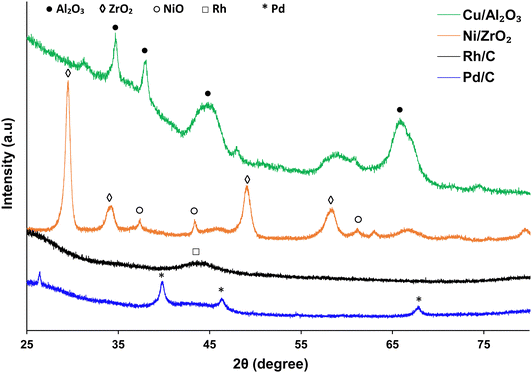
Powdered X-ray diffraction (XRD) was performed on used catalysts using a PANalytical X’pert Pro X-ray diffractometer. The diffractometer was fitted with CuKα X-ray source with a wavelength of 1.5405 Å. Diffractograms were collected from 20° to 80° with a step size of 0.01°. The X-ray tube was operated at 40 kV and 40 mA. Selected peaks were characterised by comparing with diffraction patterns using the automatic search function reference database in the X’pert software library.55Brunauer–Emmett–Teller (BET) analysis (using Micromeritics ASAP 2020 system) was carried out to measure the surface area and pore volume of the used catalysts. Measurement was done by N2 adsorption. The was cleaned using nitrogen flow, heated initially to 90 °C at a rate of 15 °C min−1 and held at this temperature for 1 h; before being heated to 125 °C at the same ramp rate and held at this temperature for 28 h.
Hydrolysis reaction
Hydrogenolysis of SD was conducted under the same batch conditions reported in the previous study.48 To summarise, the catalysts (Rh/C Pd/C Ru/C, Cu/Al2O3, Ni/ZrO2; 0.5 g), SD powder (0.1 mm, 3.0 g) and 44 mL of the solvent (2-MeTHF and distilled water, in a ratio of 1![[thin space (1/6-em)]](https://www.rsc.org/images/entities/char_2009.gif) :
:![[thin space (1/6-em)]](https://www.rsc.org/images/entities/char_2009.gif) 1), were added together in a reactor (Hastelloy® 100 mL volume, Autoclave Engineers). The reactor chamber was purged with hydrogen prior to the reaction. In the reaction, the pressure was set to 40 bar H2 with the stirring rate set to 1000 rpm. The initial temperature was set at 100 °C and thereafter increased at a rate of 10 °C min−1 to 200 °C and then dwelled for 1 h.
1), were added together in a reactor (Hastelloy® 100 mL volume, Autoclave Engineers). The reactor chamber was purged with hydrogen prior to the reaction. In the reaction, the pressure was set to 40 bar H2 with the stirring rate set to 1000 rpm. The initial temperature was set at 100 °C and thereafter increased at a rate of 10 °C min−1 to 200 °C and then dwelled for 1 h.
Product extraction and characterisation
![[thin space (1/6-em)]](https://www.rsc.org/images/entities/char_2009.gif) :
:![[thin space (1/6-em)]](https://www.rsc.org/images/entities/char_2009.gif) 1 2-MeTHF
1 2-MeTHF![[thin space (1/6-em)]](https://www.rsc.org/images/entities/char_2009.gif) :
:![[thin space (1/6-em)]](https://www.rsc.org/images/entities/char_2009.gif) water (3 × 20 mL). The combined filtrates were extracted with 2-MeTHF (3 × 100 mL), dried over anhydrous magnesium sulphate, and concentrated under vacuum resulting in the isolation of the bio-oil. This bio-oil was dissolved in 1
water (3 × 20 mL). The combined filtrates were extracted with 2-MeTHF (3 × 100 mL), dried over anhydrous magnesium sulphate, and concentrated under vacuum resulting in the isolation of the bio-oil. This bio-oil was dissolved in 1![[thin space (1/6-em)]](https://www.rsc.org/images/entities/char_2009.gif) :
:![[thin space (1/6-em)]](https://www.rsc.org/images/entities/char_2009.gif) 1 2-MeTHF
1 2-MeTHF![[thin space (1/6-em)]](https://www.rsc.org/images/entities/char_2009.gif) :
:![[thin space (1/6-em)]](https://www.rsc.org/images/entities/char_2009.gif) water (30 mL) to which sodium hydroxide (0.5 g) was added to neutralise free acids. After refluxing for 4 h, the biphasic mixture was extracted with 2-MeTHF (2 × 100 mL).
water (30 mL) to which sodium hydroxide (0.5 g) was added to neutralise free acids. After refluxing for 4 h, the biphasic mixture was extracted with 2-MeTHF (2 × 100 mL).
![[thin space (1/6-em)]](https://www.rsc.org/images/entities/char_2009.gif) :
:![[thin space (1/6-em)]](https://www.rsc.org/images/entities/char_2009.gif) 1 with internal standard (total 2 mL) and measured into a sample vial for NMR analysis. Quantification of the extracted bio-oil was done by comparing the bio-oil peaks with the aldehydic internal standard.
1 with internal standard (total 2 mL) and measured into a sample vial for NMR analysis. Quantification of the extracted bio-oil was done by comparing the bio-oil peaks with the aldehydic internal standard.
Life cycle assessment: anaerobic digestate conversion to biofuels
LCA is a tool used to quantify system-wide environmental burdens of products, processes and technologies.58 The LCA framework and methodology applied in the present study is in accordance with ISO 14040 guidelines (ISO, 2006) and recommendations presented by Reference Life Cycle Data System (ILCD) Handbook.59 In this study, the goal of using LCA was to quantify the energy balance of the conversion of anaerobic digestate to biofuels. The functional unit was considered as 1 tonne of anaerobic digestate. The digestate treatment options were tracked from digestate origin at the biogas plant via the treatment process. LCA was conducted using a cradle-to-gate attributional approach and excluded environmental impacts due to infrastructure processes. The following life-cycle stages were considered: (1) transportation of anaerobic digestate to treatment plant; (2) digestate dewatering and drying; (3) conversion of solid digestate (from Stage 2) to biofuels via catalytic hydrogenolysis (Fig. 1). Production of anaerobic digestate was not included in this system, as it is a waste-based resource and present in abundance with anaerobic digestion plants.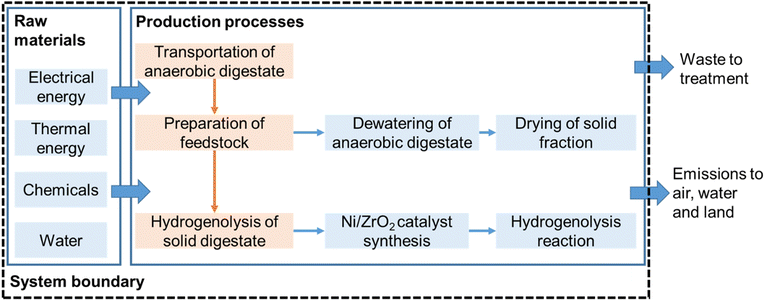 | ||
| Fig. 1 System boundary considered for computing life cycle environmental impacts of the conversion of 1 tonne of digestate. | ||
Results and discussion
Catalyst characterisation
| Catalysts | Surface area (m2 g−1) | Pore volume (cm3 g−1) | Particle size (nm) |
|---|---|---|---|
| Rh/C | 809 | 0.66 | 19.9 |
| Pd/C | 1179 | 1.04 | 14.3 |
| Ni/ZrO2 | 345 | 0.08 | 4.8 |
| Cu/Al2O3 | 257 | 0.33 | 4.6 |
FTIR analysis of the bio-oil
The FTIR spectra of the SD and Biochar (Johnson Matthey) are shown in Fig. 3. While lignin structures and potential depolymerisation products can vary considerably, there are a number of similarities and also some differences between the bio-oil produced in this study compared with previously reported results. The absorption bands at 1250 and 3300 cm−1 are ascribed to the C–C and C–H stretching of cellulose and lignin, and carboxylic and phenolic functional group, respectively.65 The presence of O–H vibrations between 3050 and 3600 cm−1, and C![[double bond, length as m-dash]](https://www.rsc.org/images/entities/char_e001.gif) O stretching vibration shown between 1650 and 1850 cm−1, confirms that carboxylic acids and their derivatives are present in the spectrum as would be expected from the literature. Pakdal and Roy65,66 reported a number of carboxylic acids (formic and acetic acids) detected in oils from the pyrolysis of wood. The absorbance between 1650–1850 cm−1 with C
O stretching vibration shown between 1650 and 1850 cm−1, confirms that carboxylic acids and their derivatives are present in the spectrum as would be expected from the literature. Pakdal and Roy65,66 reported a number of carboxylic acids (formic and acetic acids) detected in oils from the pyrolysis of wood. The absorbance between 1650–1850 cm−1 with C![[double bond, length as m-dash]](https://www.rsc.org/images/entities/char_e001.gif) O stretching vibrations also reveals that ketones and aldehydes are present.67 The band between 2800 and 3000 cm−1 shows the presence of C–H stretching vibrations. Absorption bands between 675–900 cm−168 and 1575–1625 cm−1 indicate the presence of monocyclic, polycyclic and substituted aromatic groups.69 C
O stretching vibrations also reveals that ketones and aldehydes are present.67 The band between 2800 and 3000 cm−1 shows the presence of C–H stretching vibrations. Absorption bands between 675–900 cm−168 and 1575–1625 cm−1 indicate the presence of monocyclic, polycyclic and substituted aromatic groups.69 C![[double bond, length as m-dash]](https://www.rsc.org/images/entities/char_e001.gif) C stretching vibrations, which indicate the presence of alkenes, are confirmed by the absorbance band between 1625 and 1675 cm−1.65 The band between 850–950 cm−1 for SD shows the presence of ethers. In comparison to the biochar, the band between 950 and 1325 cm−1 most probably represents the presence of primary, secondary and tertiary alcohols and phenols as a result of the C–O stretching and O–H in plane distortion of these functional groups.66 The alcohol/phenol OH functional group was no longer visible at 3300 cm−1, indicating that phenolic biopolymer, which is characteristic of lignin in the digestate, has been removed. This means that the bio-aromatic composition with the potential to be valorised to biofuels has been burned off.
C stretching vibrations, which indicate the presence of alkenes, are confirmed by the absorbance band between 1625 and 1675 cm−1.65 The band between 850–950 cm−1 for SD shows the presence of ethers. In comparison to the biochar, the band between 950 and 1325 cm−1 most probably represents the presence of primary, secondary and tertiary alcohols and phenols as a result of the C–O stretching and O–H in plane distortion of these functional groups.66 The alcohol/phenol OH functional group was no longer visible at 3300 cm−1, indicating that phenolic biopolymer, which is characteristic of lignin in the digestate, has been removed. This means that the bio-aromatic composition with the potential to be valorised to biofuels has been burned off.
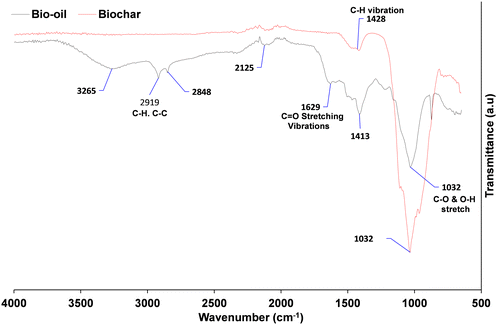 | ||
| Fig. 3 Fourier transform infrared (FTIR) spectrum of bio-oil and Biochar in the range of 500–4000 cm−1. | ||
However, the C–C was modified to an inflection at ∼1600 cm−1, which is characteristic of an alkene C![[double bond, length as m-dash]](https://www.rsc.org/images/entities/char_e001.gif) C.64
C.64
Activity of catalysts effect on bio-oil yield, conversion and selectivity from SD
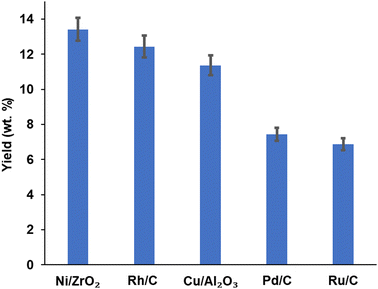
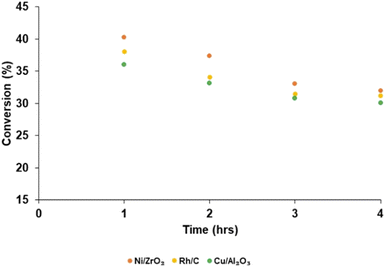
Product yield (aromatic and aliphatic) from hydrogenolysis depolymerisation was based on substrate type. Product yield based on substrate conversion seems to be higher with nickel on zirconium and rhodium on carbon than copper on alumina, palladium and ruthenium on a carbon support. Fig. 4 reports the bio-oil yields for Ni/ZrO2 (13.43 wt%), Rh/C (12.40 wt%), Cu/Al2O3 (10.92 wt%), Pd/C (7.45 wt%) and Ru/C (6.92 wt%), which indicates that the order of performance (based on bio-oil yield) was Ni/ZrO2 >Rh/C > Cu/Al2O3 > Pd/C > Ru/C. Experiments for bio-oil yield were repeated twice; the results were reproducible with a small standard deviation (Table S1, ESI†), and so data is reported with the experimental error bars of ±4.97% (calculation shown in ESI†).Fig. 5 reports the substrate conversion based on the three most active catalysts (Ni/ZrO2, Rh/C and Cu/Al2O3) as a function of time. When the reaction time was maintained for 1 h, the substrate conversion over Ni/ZrO2, Rh/C, and Cu/Al2O3 was 40.30, 38.08 and 36.04%, respectively. For 2 h reaction time, conversion over Ni/ZrO2, Rh/C, and Cu/Al2O3 was (37.40, 34.11, and 33.12%, respectively); 3 h reaction time, conversion was (33.05, 31.50 and 30.80%, respectively); 4 h reaction time, conversion was (32.01, 31.20 and 30.10%, respectively). The substrate conversion trend for all the catalysts showed that catalytic activity seems to be highest in the 1 h reaction; in the order, 1 h > 2 h > 3 h > 4 h. Given the decrease in the yields of bio-oil with time as reported, it might be expected that the biochar yield should have increased and be highest after 4 h.
In the absence of head space analysis a possible explanation is that this is due to further production of volatiles as the reaction progressed. It is proposed that the drop in yield at longer run times is due to some of the liquid products are being converted slowly by the catalyst to volatile, gaseous products that are not being isolated at the end of the reaction. Such losses could be minimised by stopping the reaction sooner. Even if there are more moles of biochar produced it may well weigh less than the substrate due to dehydration/elimination of volatile components. As such, conversion of the substrate may well have continued in this time. However, since the bio-oil yield also decreased over this period, although further conversion of the substrate to biochar cannot be discounted entirely, the only way to achieve a mass balance is to consider that more and more volatile products are produced (see Fig. S2–S6 in ESI† for biochar yield).
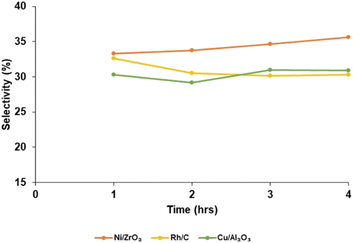
Fig. 6 shows the catalyst selectivity (S) toward bio-oil at different reaction times (1 h, 2 h, 3 h and 4 h). Selectivity increases as the reaction time increases with the Ni/ZrO2 catalysts; for a reaction run time of 1 h, product selectivity was 33.0%. When the reaction was run for 4 h, selectivity increased to 35.6%. This trend was different for Rh/C when the reaction run time was 1 h; selectivity was 32.64% but reduces to 30.3% for a 4 h run time reaction. Also, for Cu/Al2O3, selectivity was 30.3% when the reaction was run for 1 h; it decreases when the reaction time was for 2 h.
However, when the reaction was run for 3 h; product selectivity increased to 31.0%. The bio-oil yield depends not only on catalytic activity and selectivity but also on the biomass substrates and the extraction solvent. It is believed that the effectiveness of nickel–metal in cleaving both the C–O and β-O-4 bonds,39,70 as well as the amphoteric49,68 characteristic of ZrO2 support, plays a major role. The redox property of nickel is influenced by the acid/base properties of the support.51,71 Also, the affinity of rhodium to the β-O-4, which is the predominant (∼50%) linkage in lignin, is higher than the affinity of the precious metals on the other studied heterogeneous catalysts. Extracting solvent also plays a major role in bio-oil yield, for instance, in a previous study50 with Rh/C and Pd/C using cork biomass substrate and dioxane as extracting solvent, the bio-oil yield was 11.50 and 7.2 wt%, respectively. Using 2-MeTHF solvent in this current work indicates a 7.82 and 3.47% increase for Rh/C and Pd/C, respectively. Furthermore, higher bio-oil yield can be achieved by the addition of base (BCD) to the solvent as investigated and reported by McCallum et al.51
Ma et al.39 reported a 15.1 wt% yield from organosolv lignin depolymerisation through hydrogenolysis using Ni/ZrP. Schutyser et al.52 reported yields of above 80% using models (lignin-derived guaiacols). Van den Bosch et al.72 reported the delignification of birch sawdust using a Ru/C catalyst via the simultaneous solvolysis and hydrogenolysis with a lignin-oil yield of above 50% phenolic monomers and about 20% phenolic dimers. It was said that the higher selectivity to phenolic monomers with Ru/C was as a result of its affinity for the ether-bonds between phenolic units that prevents re-polymerisation reactions, hence, a stable C–C bonds within the lignin structural network.
GC–MS and NMR characterisation of bio-oil
Using the GC–MS to analyse the composition of the derivatised bio-oil produced from the SD hydrogenolysis catalysed reaction, the major product extracted was ethylguaiacol (which is a bio-aromatic oxygenate octane booster). This product was obtained from the cleavage of aryl glycerol ether (β-O-4) and diphenyl ether (5-O-41) linkages in the lignin structure, as shown in ESI† (Fig. S1). The mass spectrum of TMS-derivatised ethylguaiacol is shown in ESI† (Fig. S7). In previous studies, Yueyuan77 reported the extraction of ethylguaiacol from the hydrogenolysis of lignosulphonate. Garrett et al.50 and Graca et al.78 also reported aromatic species extracted from barks as propylguaiacol, dihydroconiferylalcohol and other aromatics such as catechol, ferulic acid and 3,4-dihydroxybenzoic acid in small amounts.
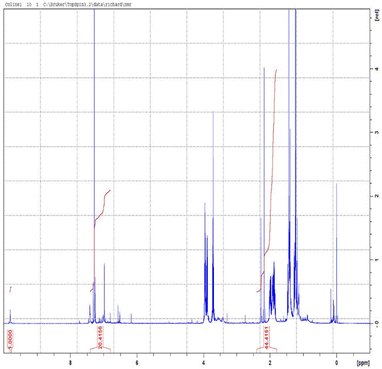
1H NMR spectroscopy was performed and used to determine the quantitative analysis of the isolated crude bio-oil. The side-chain methylene signals α to the aromatic rings of ethylguaiacol. This analysis showed the presence of both fatty acid and aromatic products. The multiple peaks could potentially be as a result of the partial depolymerisation of the lipids and esters. The side-chain methylene signals α to the aromatic rings of ethylguaiacol. In the region between 6.4 and 7.0 ppm, the aromatic hydrogens on the guaiacyl substituent are evident. Quantification of the total lipid and fatty acid content was determined using a vanillin internal standard and comparing the integration of aldehydic singlet in the 1H NMR spectrum at 9.73 ppm to the distinctive peak at 2.2–2.5 ppm from the CH2 group alpha to the ring as the fatty acid/ester carbonyl group. The NMR peak integration was used to calculate the percentage of the aromatic products in the bio-oil using the formula in the ESI† (determination of aromatic yields). The 1H NMR spectrum is reported in Fig. 8 and ESI† (S8); Table 2 shows the summary.
| Substrate/catalyst | Run 1 | Run 2 | Ref. | ||
|---|---|---|---|---|---|
| Yield (mg) | Aromatics (wt%) | Yield (mg) | Aromatics (wt%) | ||
a Hydrogenolysis with dioxane solvent and reaction time at 4 h.
b Hydrogenolysis with MeTHF solvent and reaction time at 1 h. Distilled water![[thin space (1/6-em)]](https://www.rsc.org/images/entities/char_2009.gif) : :![[thin space (1/6-em)]](https://www.rsc.org/images/entities/char_2009.gif) 2-MeTHF is 1 2-MeTHF is 1![[thin space (1/6-em)]](https://www.rsc.org/images/entities/char_2009.gif) : :![[thin space (1/6-em)]](https://www.rsc.org/images/entities/char_2009.gif) 1. 1.
|
|||||
| Rh/C | |||||
| Corka | 40.0 | 2.0 | 46.0 | 2.1 | 50 |
| Sprucea | 36.0 | 1.2 | 45.0 | 1.5 | 50 |
| Sycamorea | 114.0 | 3.8 | 81.0 | 2.7 | 50 |
| SDb | 250.8 | 8.4 | 210.5 | 7.0 | This work |
| Pd/C | |||||
| Corka | 26.0 | 1.3 | 38.0 | 1.9 | 50 |
| Sprucea | 45.0 | 1.5 | 63.0 | 2.1 | 50 |
| Sycamorea | 63.0 | 2.1 | 46.0 | 1.9 | 50 |
| SDb | 150.6 | 5.0 | 120.3 | 4.9 | This work |
Characterising the most active catalyst
To understand the surface morphology of the most active catalyst herein SEM-EDX mapping along with TEM analyses were performed. TEM images in Fig. 9(a) and (b) showed spherical particles with a particle size of ∼9 nm. The nickel-based catalyst, which is denoted as Ni/ZrO2, showed uniform particle size distribution, as shown in Fig. 9(c).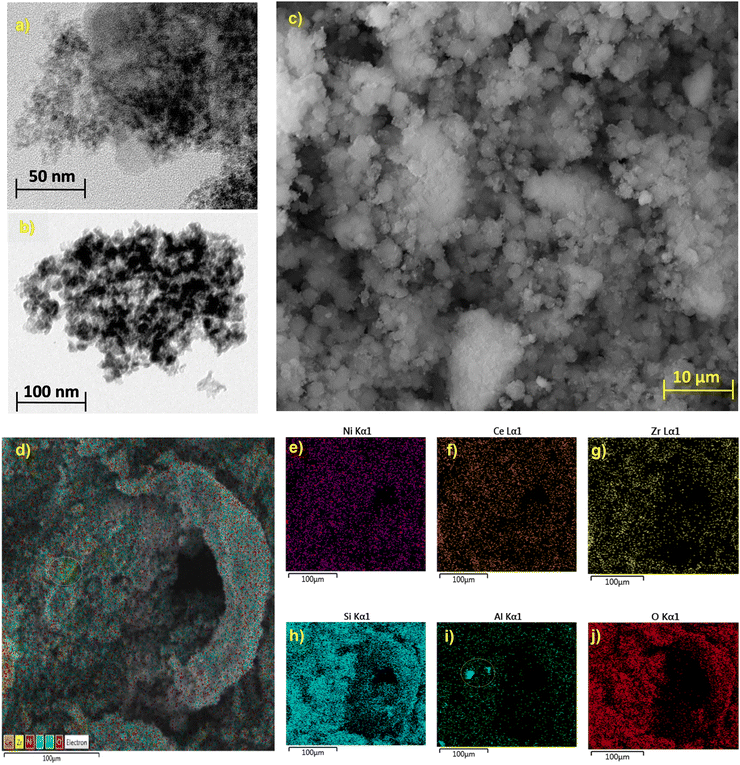 | ||
| Fig. 9 Surface morphology characterisations of Ni/ZrO2; TEM images (a), (b), SEM image (c) and elemental mapping (d)–(j). | ||
The elemental mappings of Ni, Ce, Zr, Si, Al and O elements show the uniform distribution of Ni active sites of the surface of the Ni-based catalyst as shown in Fig. 9(d)–(j) while Al mapping shows a small cluster formation as shown from the circle in Fig. 9(d) and (i). The presence of oxygen carrier in the catalyst composition in the form of CeO2, ZrO2 along with SiO2 and Al2O3 will aid in the oxidation of any carbon deposition over the surface of the Ni-based catalyst during the reaction.79,80
Comparison with other work
The weight percentages of the aromatic in the bio-oil reported in this work for the first and second experimental run using Rh/C catalysts were 8.4 and 7.0 wt% respectively. When Pd/C was used, the percentage aromatic for the first and second experimental run was 5.0 and 4.9 wt% respectively. These values compare favourably with other work as compared in Table 2, although in this work, the selectivity to aromatic is higher as compared to previous work using dioxane solvent.50 Also, McCallum et al.51 reported the weight percentage of the aromatic in bio-oil extracted from cork using different ratios of distilled water to 2Me-THF. Using distilled water to 2-MeTHF ratios of 1![[thin space (1/6-em)]](https://www.rsc.org/images/entities/char_2009.gif) :
:![[thin space (1/6-em)]](https://www.rsc.org/images/entities/char_2009.gif) 9, 4
9, 4![[thin space (1/6-em)]](https://www.rsc.org/images/entities/char_2009.gif) :
:![[thin space (1/6-em)]](https://www.rsc.org/images/entities/char_2009.gif) 6, 6
6, 6![[thin space (1/6-em)]](https://www.rsc.org/images/entities/char_2009.gif) :
:![[thin space (1/6-em)]](https://www.rsc.org/images/entities/char_2009.gif) 4 and 9
4 and 9![[thin space (1/6-em)]](https://www.rsc.org/images/entities/char_2009.gif) :
:![[thin space (1/6-em)]](https://www.rsc.org/images/entities/char_2009.gif) 1, the reported weight percentage of aromatic in the bio-oil was 3.5, 7.1, 4.7 and 5.1 wt%, respectively.
1, the reported weight percentage of aromatic in the bio-oil was 3.5, 7.1, 4.7 and 5.1 wt%, respectively.
Life cycle assessment
Inventory analysis: Previous studies (e.g. Girio et al.,81) have focused on the relative CO2 equivalent production between different processes and the transport of biomass to the processing site. In this study, the focus is on the net energy balance between the inputs of the process and the outputs in the form of the bio-oil distillate. The transportation distance between the anaerobic digestion plant and the treatment unit was conservatively assumed as 20 km. The energy requirements for transportation were assumed to be 5.7 MJ tkm−1.82,83After the transportation of anaerobic digestate, impacts were considered for the preparation of feedstock for the hydrogenolysis reaction. Although lab-scale preparation used oven drying in this experiment, it was assumed that for large-scale commercial operations, a decanting centrifuge and belt dryer would be employed for producing solid digestate.
A decanting centrifuge can dewater anaerobic digestate to produce a solid fraction using electrical energy as input (3.5 kW h per tonne of anaerobic digestate dewatered).84 It was assumed that the total solids of the anaerobic digestate was 6.3%. The separation efficiency of a decanting centrifuge is shown in Table S2 of the ESI.† For one tonne of anaerobic digestate treated, 126 kg of solid fraction production was assumed. This solid fraction, when treated via belt dryer, can produce 36 kg of solid digestate (at 10% moisture) with thermal energy as input for raising the temperature and evaporating moisture (total energy input of 2.63 MJ kg−1 of solid fraction).
Finally, for the hydrogenolysis reaction procedure (mentioned in the Methods Section), it was calculated that 6 kg of Ni/ZrO2 catalyst, 225 kg of 2 Me-THF and 264 kg of deionised water would be required for the conversion of 36 kg of solid digestate. Calculations were performed for the Ni/ZrO2 catalytic system as it showed the highest bio-oil yield. The electrical energy required for hydrogenolysis was taken from Yano et al.85 as 0.16 kW h kg−1 of feedstock treated (Table 3). The amount of bio-oil produced at 17% yield was 90.34 kg, which is equivalent to 1445 MJ of energy based on a calorific value of 16 MJ kg−1.86
| Input/process | Unit | Input | Output |
|---|---|---|---|
| a Freight transport by lorry, 3.5–7.5 metric tonnes, euro 6.82 b Due to a lack of data on production of Ni/ZrO2 catalysts, it was considered that a reaction between Ni and ZrO2 would lead to production of Ni/ZrO2 (100% yield assumed). For production of 1 kg of Ni and ZrO2, energy requirements were adapted from Nuss et al.83 c Due to a lack of data on the production of 2Me-THF, it was considered that a reaction of furfural (1.11 kg) and hydrogen gas (82.3 g) would be needed for 1 kg of 2Me-THF (100% yield assumed). The energy requirement for furfural production was sourced from Raman and Gnansounou.87 d De-ionised water, reverse osmosis, production mix, at plant, from groundwater.82 | |||
| Transportation | |||
| Feedstock transportation | tkm | 20 | |
| Anaerobic digestate | t | 1 | |
| Energy (fossil fuels)a | MJ | 114 | |
| Solid–liquid separation (decanter centrifuge) | |||
| Digestate | t | 1 | |
| Electrical energy | MJ | 12.6 | |
| Liquid fraction (disposed) | kg | 874 | |
| Solid fraction | kg | 126 | |
| Drying of solid fraction (belt dryer) | |||
| Solid fraction | kg | 126 | |
| Thermal energy | MJ | 331.2 | |
| Produced solids (10% moisture) | kg | 36 | |
| Hydrogenolysis | |||
| Produced solids (10% moisture) | kg | 36 | |
| Ni/ZrO2 catalystb | kg | 6 | |
| 2 Me-THFc | kg | 225.4 | |
| Deionised waterd | kg | 264 | |
| Electrical energy | MJ | 20.8 | |
| Bio-oil | kg | 90.3 | |
Energy balance: The total energy required for the process was calculated as 849 MJ. The energy consumed for the hydrogenolysis reaction stage was highest at 391 MJ (46%), closely followed by the digestate dewatering and drying stage (344 MJ) (41%). The total output energy in the form of bio-oil was 1445 MJ. The net energy is defined as the ratio of output energy to input energy and was thus calculated as 1.7 (a net energy ratio >1 shows that there was net production of energy during the process). This is over double the net energy of petroleum-based petrol and diesel88 and is comparable to conventional temperate crop-based biofuels.89
Conclusion
In this study, we report the valorisation of SD from AD via hydrogenolysis reaction using both heterogeneous platinum group and active metal catalysts to produce phenolic aromatic monomers from the lignin constituent of the SD. The major product extracted was ethylguaiacol. The bio-oil yield ranged between 6.92–13.43 wt%, with Ni/ZrO2 giving the highest yield (13.43 wt%) and Ru/C giving the lowest yield (6.92 wt%). The effect of using a green environmental benign solvent (2-methyltetrahydrofuran) was evident as the yield increased by ∼17 wt% as compared to the use of dioxane (11.5 wt%) as a reaction solvent with Ni/ZrO2 catalysts. The life cycle assessment was performed considering one tonne of anaerobic digestate converted to biofuels as feedstock. System boundary included transportation of digestate, dewatering and drying of digestate, hydrogenolysis reaction of solid digestate in presence of Ni/ZrO2 catalyst. The results showed that a total of 849 MJ of input energy would be required for the conversion for one tonne of digestate to bio-oil, resulting in an energy ratio that is similar to conventional biofuels and over double that of fossil transport fuels.Disclaimer
The views and opinions expressed in this paper do not necessarily reflect those of the European Commission or the Special EU Programmes Body (SEUPB).Conflicts of interest
There are no conflicts to declare.Acknowledgements
The authors would like to acknowledge The Bryden Centre for funding. The Bryden Centre (Project ID VA5048) project is supported by the European Union's INTERREG VA Programme, managed by the Special EU Programmes Body (SEUPB) with match funding provided by the Department for the Economy in Northern Ireland and the Department of Business, Enterprise and Innovation in the Republic of Ireland.The authors would like to thank Darren Baskerville of Analytical Services and Environmental Projects (ASEP) Division of the School of Chemistry and Chemical Engineering at Queen's University Belfast for the BET experiments. The continued support of and supply of digestate material from Thomas Cromie (AgriAD) as well as Chris Johnston and Dr Gary Lyons (Agri-food and Biosciences Institute) are also greatly appreciated.
Notes and references
- BP Statistical Review of World Energy Report, British Petroleum, London, UK, 2019.
- C. N. Hamelinck and A. P. Faaij, Energy Policy, 2006, 34, 3268 CrossRef.
- C. N. Hamelinck, R. A. Suurs and A. P. Faaij, Biomass Bioenergy, 2005, 29, 114 CrossRef.
- A. K. Chandel, V. K. Garlapati, S. Jeevan Kumar, M. Hans, A. K. Singh and S. Kumar, Biofuels, Bioprod. Biorefin., 2020, 14, 830 CrossRef CAS.
- J. H. Clark and D. J. Macquarrie, Handbook of Green Chemistry and Technology, Blackwell Science, Wiley, Oxford, UK, 2008 Search PubMed.
- A. Franco and N. Giannini, Int. J. Therm. Sci., 2005, 44, 163 CrossRef CAS.
- X. Ge, F. Xu and Y. Li, Bioresour. Technol., 2017, 205, 239 CrossRef PubMed.
- A. L. Marshall and P. J. Alaimo, Chem. – Eur. J., 2010, 16, 4970 CrossRef CAS PubMed.
- G. W. Huber, S. Iborra and A. Corma, Chem. Rev., 2006, 106, 4044 CrossRef CAS PubMed.
- A. Hendriks and G. Zeeman, Bioresour. Technol., 2009, 100, 10 CrossRef CAS PubMed.
- M. Y. Balakshin, E. A. Capanema and H. M. Chang, Recent advances in the isolation and analysis of lignins and lignin–carbohydrate complexes in Characterisation of lignocellulosic materials Part II, 2008, Blackwell Publishing, Oxford, UK, pp. 48–170 Search PubMed.
- S. Gillet, M. Aguedo, L. Petitjean, A. R. C. Morais, A. M. Da Costa Lopes, R. M. Łukasik and P. T. Anastas, Green Chem., 2017, 19, 4200 RSC.
- P. Manzanares, Acta Innov., 2020, 37, 47 Search PubMed.
- R. M. Lukasik, Acta Innov., 2021, 39, 32 Search PubMed.
- K. Möller and T. Müller, Eng. Life Sci., 2012, 12, 242 CrossRef.
- M. Kratzeisen, N. Starcevic, M. Martinov, C. Maurer and J. Müller, Fuel, 2010, 89, 2544 CrossRef CAS.
- J. Desloover, A. Abate Woldeyohannis, W. Verstraete, N. Boon and K. Rabaey, Environ. Sci. Technol., 2012, 46, 12209 CrossRef CAS PubMed.
- M. Tella, M. N. Bravin, L. Thuriès, P. Cazevieille, C. Chevassus-Rosset, B. Collin, P. Chaurand, S. Legros and E. Doelsch, Environ. Pollut., 2016, 212, 299 CrossRef CAS PubMed.
- A. van Wezel, I. Caris and S. A. Kools, Environ. Toxicol. Chem., 2016, 35, 1627 CrossRef CAS PubMed.
- D. Styles, P. Adams, G. Thelin, Cl Vaneeckhaute, D. Chadwick and P. J. Withers, Environ. Sci. Technol., 2018, 52, 7468 CrossRef CAS PubMed.
- G. A. Lyons, A. Cathcart, J. P. Frost, M. Wills, C. Johnston, R. Ramsey and B. Smyth, Agronomy, 2021, 11, 836 CrossRef CAS.
- C. Mangwandi, L. JiangTao, A. B. Albadarin, S. J. Allen and G. M. Walker, Powder Technol., 2013, 233, 245 CrossRef CAS.
- T. Rehl and J. Müller, Resour., Conserv. Recycl., 2011, 56, 92 CrossRef.
- A. Cathcart, B. M. Smyth, G. Lyons, S. T. Murray, D. Rooney and C. R. Johnston, Cleaner Eng. Technol., 2021, 3, 100098 CrossRef.
- D. McDowell, J. T. Dick, L. Eagling, M. Julius, G. N. Sheldrake, K. Theodoridou and P. J. Walsh, Algal Res., 2020, 48, 101893 CrossRef.
- C. I. Akor, A. I. Osman, C. Farrell, C. S. McCallum, W. J. Doran, K. Morgan, J. Harrison, P. J. Walsh and G. N. Sheldrake, Chem. Eng. J., 2021, 406, 127039 CrossRef CAS.
- M. N. Pérez-Camacho and R. Curry, Proc. Inst. Civ. Eng.: Waste Resour. Manage., 2018, 171, 104 CrossRef.
- A. I. Osman, A. Abdelkader, C. R. Johnston, K. Morgan and D. W. Rooney, Ind. Eng. Chem. Res., 2017, 56, 12119 CrossRef CAS.
- P. A. Jacobs, M. Dusselier and B. F. Sels, Angew. Chem., Int. Ed., 2014, 53, 8621 CrossRef CAS PubMed.
- P. Gallezot, Catal. Today, 2011, 167, 31 CrossRef CAS.
- J. E. Holladay, J. F. White, J. J. Bozell and D. Johnson, Top value-added chemicals from biomass, Results of screening for potential candidates from biorefinery lignin, Pacific Northwest National Laboratory, USA, 2007, vol. II Search PubMed.
- J. Zakzeski, P. C. A. Bruijnincx, A. L. Jongerius and B. M. Weckhuysen, Chem. Rev., 2010, 110, 3552 CrossRef CAS PubMed.
- A. Gandini and M. N. Belgacem, Monomers, Polymers and Composites from Renewable Resources, Elsevier, Oxford, UK, 2008 Search PubMed.
- A. J. Ragauskas, G. T. Beckham, M. J. Biddy, R. Chandra, F. Chen, M. F. Davis, B. H. Davison, R. A. Dixon, P. Gilna, M. Keller, P. Langan, A. K. Naskar, J. N. Saddler, T. J. Tschaplinski, G. A. Tuskan and C. E. Wyman, Science, 2014, 344, 1246843 CrossRef PubMed.
- F. G. Calvo-Flores and J. A. Dobado, ChemSusChem, 2010, 3, 1227 CrossRef CAS PubMed.
- E. A. B. da Silva, M. Zabkova, J. D. Araújo, C. A. Cateto, M. F. Barreiro, M. N. Belgacem and A. E. Rodrigues, Chem. Eng. Res. Des., 2009, 87, 1276 CrossRef.
- S. Bertella and J. S. Luterbacher, Lignin Functionalization for the Production of Novel Materials, Trends Chem., 2020, 2, 440 CrossRef CAS.
- J. Ma, S. Shi, X. Jia, F. Xia, H. Ma, J. Gao and J. Xu, J. Energy Chem., 2019, 36, 74 CrossRef.
- H. Ma, H. Li, W. Zhao, L. Li, S. Liu, J. Long and X. Li, Green Chem., 2019, 21, 658 RSC.
- X. Liu, F. P. Bouxin, J. Fan, V. L. Budarin, C. Hu and J. H. Clark, ChemSusChem, 2020, 13, 4296 CrossRef CAS PubMed.
- M. P. Pandey and C. S. Kim, Chem. Eng. Technol., 2011, 34, 29 CrossRef CAS.
- G. Joshi, J. K. Pandey, S. Rana and D. S. Rawat, Renewable Sustainable Energy Rev., 2017, 79, 850 CrossRef.
- J. Cho, S. Chu, P. J. Dauenhauer and G. W. Huber, Green Chem., 2012, 14, 428 RSC.
- V. M. Roberts, V. Stein, T. Reiner, A. Lemonidou, X. Li and J. A. Lercher, Chem. – Eur. J., 2011, 17, 5939 CrossRef CAS PubMed.
- C. Zhang, H. Li, J. Lu, X. Zhang, K. E. MacArthur, M. Heggen and F. Wang, ACS Catal., 2017, 7, 3419 CrossRef CAS.
- C. Li, X. Zhao, A. Wang, G. W. Huber and T. Zhang, Chem. Rev., 2015, 115, 11559 CrossRef CAS PubMed.
- Q. Song, F. Wang, J. Cai, Y. Wang, J. Zhang, W. Yu and J. Xu, Energy Environ. Sci., 2013, 6, 994 RSC.
- M. V. Galkin and J. S. Samec, ChemSusChem, 2016, 9, 1544 CrossRef CAS PubMed.
- K. Barta, G. R. Warner, E. S. Beach and P. T. Anastas, Green Chem., 2014, 16, 191 RSC.
- M. D. Garrett, C. Hardacre, R. Patrick, G. N. Sheldrake and S. C. Bennett, RSC Adv., 2013, 3, 21552 RSC.
- C. S. McCallum, N. Strachan, S. C. Bennett, W. G. Forsythe, M. D. Garrett, C. Hardacre, K. Morgan and G. N. Sheldrake, Green Chem., 2018, 20, 2702 RSC.
- W. Schutyser, S. Van den Bosch, J. Dijkmans, S. Turner, M. Meledina, G. Van Tendeloo, D. P. Debecker and B. F. Sels, ChemSusChem, 2015, 8, 1805 CrossRef CAS PubMed.
- D. G. Barceloux and D. Barceloux, J. Toxicol. Clin. Toxicol., 1999, 37, 217 CrossRef CAS PubMed.
- R. Eisler, Inflamm. Res. J., 2003, 52, 487 CrossRef CAS PubMed.
- K. S. Egorova and V. P. Ananikov, Angew. Chem., Int. Ed., 2016, 55, 12150 CrossRef CAS PubMed.
- P. M. Mortensen, J.-D. Grunwaldt, P. A. Jensen and A. D. Jensen, ACS Catal., 2013, 3, 1774 CrossRef CAS.
- O. Adeeyo, O. M. Oresegun and T. E. Oladimeji, Am. J. Eng. Res., 2015, 4, 14 Search PubMed.
- K. S. Al-Mawali, A. I. Osman, A. H. Al-Muhtaseb, N. Mehta, F. Jamil, F. Mjalli, G. R. Vakili-Nezhaad and D. W. Rooney, Renewable Energy, 2021, 170, 832 CrossRef CAS.
- K. Chomkhamsri, M.-A. Wolf and R. Pant, International Reference Life Cycle Data System (ILCD) Handbook: Review Schemes for Life Cycle Assessment, in Towards Life Cycle Sustainability Management, ed. M. Finkbeiner, Springer, Dordrecht, Netherlands, 2011, pp.107–117 Search PubMed.
- A. I. Osman, J. K. Abu-Dahrieh, D. W. Rooney, S. A. Halawy, M. A. Mohamed and A. Abdelkader, Appl. Catal., B, 2012, 127, 307 CrossRef CAS.
- B. Zhao, C. Huang, R. Ran, X. Wu and D. Weng, J. Mater. Sci., 2016, 51, 2299 CrossRef CAS.
- T. Mondal, K. K. Pant and A. K. Dalai, Int. J. Hydrogen Energy, 2015, 40, 2529 CrossRef CAS.
- M. Martin-Martinez, A. Álvarez-Montero, L. Gómez-Sainero, R. Baker, J. Palomar, S. Omar, S. Eser and J. Rodriguez, Appl. Catal., B, 2015, 162, 532 CrossRef CAS.
- J. Chen, M. Hu, M. Ming, C. Xu, Y. Wang, Y. Zhang, J. Wu, D. Gao, J. Bi and G. Fan, Int. J. Hydrogen Energy, 2018, 43, 2718 CrossRef CAS.
- H. Pakdel and C. Roy, Energy Fuels, 1991, 5, 427 CrossRef CAS.
- H. Pakdel and C. Roy, Chemical characterisation of wood pyrolysis oils obtained in a vacuum-pyrolysis multiple-hearth reactor in Pyrolysis Oils from Biomass, ACS Symp. Ser., 1988, 376, 203–219 CrossRef CAS.
- T. Rampling and T. Hickey, The laboratory characterisation of refuse derived fuel, Report to United Kingdom Atomic Energy Authority acting on behalf of the Secretary of State for Energy. Report No. ETSU-B-1161, Warren Spring Laboratory Stevenage, UK, 1988 Search PubMed.
- P. T. Williams and P. A. Horne, J. Anal. Appl. Pyrolysis, 1995, 31, 15 CrossRef CAS.
- D. C. Elliott, Relation of reaction time and temperature to chemical composition of pyrolysis oils in Pyrolysis Oils from Biomass, ACS Symp. Ser., 1988, 376, 55–65 CrossRef CAS.
- M. R. Sturgeon, M. H. O’Brien, P. N. Ciesielski, R. Katahira, J. S. Kruger, S. C. Chmely, J. Hamlin, K. Lawrence, G. B. Hunsinger and T. D. Foust, Green Chem., 2014, 16, 824 RSC.
- C. Zhu, X. Dou, W. Li, X. Liu, Q. Li, J. Ma, Q. Liu and L. Ma, Bioresour. Technol., 2019, 284, 293 CrossRef CAS PubMed.
- S. Van den Bosch, W. Schutyser, R. Vanholme, T. Driessen, S. F. Koelewijn, T. Renders, B. De Meester, W. J. J. Huijgen, W. Dehaen and C. M. Courtin, Energy Environ. Sci., 2015, 8, 1748 RSC.
- O. Y. Abdelaziz, D. P. Brink, J. Prothmann, K. Ravi, M. Sun, J. García-Hidalgo, M. Sandahl, C. P. Hulteberg, C. Turner, G. Lidén and M. F. Gorwa-Grauslund, Biotechnol. Adv., 2016, 34, 1318 CrossRef CAS PubMed.
- F. S. Chakar and A. J. Ragauskas, Ind. Crops Prod., 2004, 20, 131 CrossRef CAS.
- M. V. Galkin, S. Sawadjoon, V. Rohde, M. Dawange and J. S. M. Samec, ChemCatChem, 2014, 6, 179 CrossRef CAS.
- T. H. Parsell, B. C. Owen, I. Klein, T. M. Jarrell, C. L. Marcum, L. J. Haupert, L. M. Amundson, H. I. Kenttämaa, F. Ribeiro, J. T. Miller and M. M. Abu-Omar, Chem. Sci., 2013, 4, 806 RSC.
- Y. Ye, Y. Zhang, J. Fan and J. Chang, Bioresour. Technol., 2012, 118, 648 CrossRef CAS PubMed.
- J. Graça and H. Pereira, Phytochem. Anal., 2000, 11, 45 CrossRef.
- A. I. Osman, Chem. Eng. Technol., 2020, 43, 641 CrossRef CAS.
- A. I. Osman, J. Meudal, F. Laffir, J. Thompson and D. W. Rooney, Appl. Catal., B, 2017, 212, 68 CrossRef CAS.
- T. F. Lopes, F. Carvalheiro, L. C. Duarte, F. Gírio, J. A. Quintero and G. Aroca, Biofuels, Bioprod. Biorefin., 2019, 13, 1321 CrossRef CAS.
- Ecoinvent Database, https://ecoinvent.org/the-ecoinvent-database/accessed on 27/6/22.
- P. Nuss and M. J. Eckleman, PLoS One, 2014, 9, e101298 CrossRef PubMed.
- S. Gilkinson and P. Frost, Evaluation of mechanical separation of pig and cattle slurries by a decanting centrifuge and a brushed screen separator, 2007, https://www.afbini.gov.uk/sites/afbini.gov.uk/files/publications/%5Bcurrent-domain%3Amachine-name%5D/Slurry%20Separator%20Full%20Report.pdf (accessed 11 February 2022).
- J. Yano, T. Aoki, K. Nakamura, K. Yamada and S. Sakai, Waste Manage., 2015, 38, 409 CrossRef CAS PubMed.
- H. Chen, Lignocellulose Biorefinery Engineering Principles and Applications, 2015, pp. 125–165 Search PubMed.
- J. K. Raman and E. Gnansounou, Bioresour. Technol., 2015, 185, 202 CrossRef CAS PubMed.
- Center for Sustainable Systems, University of Michigan, 2021, “Biofuels Factsheet.” Pub. No. CSS08-09. https://css.umich.edu/sites/default/files/biofuels_css08-09_e2021_0.pdf accessed on 01/07/22.
- B. M. Smyth, J. D. Murphy and C. M. O’Brien, Renewable Sustainable Energy Rev., 2009, 13, 2349 CrossRef CAS.
Footnote |
| † Electronic supplementary information (ESI) available: Chemical structures, additional yield data, GC-MS data, 1H NMR data and additional information on calculations. See DOI: https://doi.org/10.1039/d2ma00811d |
| This journal is © The Royal Society of Chemistry 2023 |

