 Open Access Article
Creative Commons Attribution 3.0 Unported Licence
In situ investigation of detoxification and metabolic effects of polyfluoroalkyl substances on metal–organic frameworks combined with cell-cultured microfluidics†
Ning
Xu
a,
Haifeng
Lin
b,
Qiuling
Du
a,
Shujun
Dong
a,
Jie
Cheng
a,
Peilong
Wang
*a and
Jin-Ming
Lin
 *b
*b
aInstitute of Quality Standard and Testing Technology for Agro-Products, Chinese Academy of Agricultural Sciences, Beijing 100081, China. E-mail: wangpeilong@caas.cn
bDepartment of Chemistry, Beijing Key Laboratory of Microanalytical Methods and Instrumentation, MOE Key Laboratory of Bioorganic Phosphorus Chemistry &Chemical Biology, Tsinghua University, Beijing 100084, China. E-mail: jmlin@mail.tsinghua.edu.cn
First published on 24th May 2023
Abstract
Over 9000 types of per- and polyfluoroalkyl substances (PFASs) have been produced that exhibit environmental persistence, bioaccumulation and biotoxicity, and pose a potential hazard to human health. Although metal–organic frameworks (MOFs) are promising structure-based materials for adsorbing PFASs, the enormous structural diversity and variability of the pharmacologic action of PFASs present challenges to the development of structure-based adsorbents. To address this issue, we propose an in situ platform for the high-throughput identification of efficient MOF sorbents that can adsorb PFASs and their metabolism using a filter-chip-solid phase extraction-mass spectrometry (SPE-MS) system. As a proof of concept, we screened BUT-16 as an attractive material for in situ fluorotelomer alcohol (FTOH) adsorption. The results demonstrated that FTOH molecules were adsorbed around the surface of the large hexagonal pores of BUT-16 by forming multiple hydrogen bonding interactions with its Zr6 clusters. The FTOH removal efficiency of the BUT16 filter was 100% over a period of 1 min. To determine the FTOH metabolism effects in different organs, HepG2 human hepatoma, HCT116 colon cancer, renal tubular HKC, and vascular endothelial HUVEC cells were cultured on a microfluidic chip, and SPE-MS was used to track a variety of cell metabolites in real time. Overall, the filter-Chip-SPE-MS system is a versatile and robust platform for the real-time monitoring of noxious pollutant detoxification, biotransformation, and metabolism, which facilitates pollutant antidote development and toxicology assay.
Introduction
To date, over 9000 types of per- and polyfluoroalkyl substances (PFASs, composed of a C-F chain and a hydrophilic headgroup) have been developed for industrial and commercial application (e.g., fast-food packaging1)2 on account of their favourable thermal and chemical stability and surface activity. In particular, they were used as active ingredients in protective equipment for medical personnel during the COVID-19 pandemic.3 Due to PFASs exhibiting environmental persistent, bioaccumulation and biotoxicity, PFAS pollutants are an emerging problem because of the disposal of PFAS-containing products.4 PFASs are frequently detected in environmental samples and human serum5 due to their absorption by people and biodegradation through a variety of metabolic and transformation pathways, predisposing sufferers to metabolic disorders and endocrine disorders.6 Adsorption-based technologies have been developed for PFAS removal from contaminated water. Unfortunately, there is no specific pharmacological antidotes for most PFAS. As thus, there is an urgent need to screen and identify novel sorbents capable of efficient PFAS removal.To address the above-mentioned needs, metal–organic frameworks (MOFs) have been identified as promising state-of-the-art sorbents for the removal of PFASs from water.7 Featuring tuneable structure and a high internal surface area endows MOFs with higher adsorption capacities and faster adsorption kinetics than activated carbons and ion-exchange resins.8 Although thousands of MOFs have been synthesised, only some of them are capable of PFAS removal, such as ZIF-8, UiO-66, MOF-801, MIL-100(M), and DUT-5.6 Moreover, the performances for PFAS adsorption on MOFs are diverse due to the differences in their structures. For example, the perfluorooctanoic acid (PFOA) adsorption capacities for ZIF-7 and ZIF-8 are 22 mg g−1 and 177 mg g−1, respectively.9 MOF antidotes rely on the molecular structure of pollutants as a design clue and need to be developed specifically for each type of pollutant. Given the enormous diversity of PFASs (>9000 types), high throughput screening and identification platforms are required via the design and development of MOF sorbents. As a consequence, platforms for the in situ evaluation of MOF sorbent detoxification efficiency are a timely issue.
The adverse effects of residual PFASs still exist after their adsorption on MOFs because of imperfect detoxification, and are diverse;10 however, this topic has been neglected and most research studies have focused on MOF adsorption efficiency.11 The toxicity of PFASs varies widely based on their perfluoroalkyl chain, functional groups, and the species, sex and animal models that are exposed to the pollutants.12 For example, humans may be less susceptible to the hepatic effects of PFASs than rats at the same serum concentration.13 Although PFASs are inherently metabolically inert, they can interface with endogenous metabolic processes and therefore have an impact on metabolism.14 However, the diversity of PFASs and the differences of their pharmacologic action in a range of organisms or organs presents challenges regarding the determination of PFAS metabolism effects. In consequence, an in situ cell metabolism monitoring platform is required for the investigation of PFAS metabolism effects.
Cell-cultured microfluidics is a versatile tool for the assessment of the degree of human exposure to potential chemical hazards in the environment and food.15–17 Benefiting from microfluidic chips that enable precise regulation of the cellular microenvironment and mass spectrometry facilitating flexible high-precision molecular assay,18,19 fluidic chip-solid-phase extraction-mass spectrometry (Chip-SPE-MS) was established for online biomolecule detection and cell research in our previous work.20 Therefore, we believe that MOF-based adsorption combined with the Chip-SPE-MS system is capable of the high throughput in situ screening and identification of PFAS efficient sorbents and is convenient for the investigation of PFAS metabolism effects in a range of organisms or organs.
Herein, we propose an in situ platform for high-throughput identification of PFASs by efficient MOF sorbents and investigation of their metabolism effects using a filter-Chip-SPE-MS system. As a proof of concept, we screened BUT-16 (BUT, Beijing University of Technology) as an attractive antidote for in situ fluorotelomer alcohols (FTOHs, a type of PFASs) adsorption, which is reported for the first time in this study. BUT-16 has structural similarity to the established UiO-66(Zr) family (i.e., single crystal structure and 12 connected Zr6 nodes). This iso-reticular Zr-MOF has one-dimensional hexagonal channels and N atom-decorated pore surfaces. Moreover, it has excellent pH flexibility, chemical resistance, and stability. Furthermore, the sustainable synthesis, solution processability, and facile process of BUT-16 enable its highly scalable and low-cost production. The results revealed that pollutant FTOH molecules could be well recognized in BUT-16, adsorbed around the surface of its large hexagonal pores via hydrogen bonding with the Zr–O of the host. In the flow state, the collision and contact rates of each of the materials are enhanced, showing fast adsorption capacity even in very complex matrices. Moreover, to determine the FTOH metabolism effects in different organs, HepG2human hepatoma cells, HCT116colon cancer cells, HKC renal tubular cells, and HUVEC vascular endothelial cells were cultured on a microfluidic chip, and mass spectrometry was used to track in real time the differential changes in FTOH metabolism between exposure and detoxification. The results demonstrate that the filter-Chip-SPE-MS is a versatile, robust, and low-cost platform for the real-time monitoring of noxious pollutants, as well as their detoxification and biotransformation.
Experimental
Synthesis of BUT-16
Zr(IV)-MOF has a large pore size, high stability and exhibits the cooperation of multiple functionalities, making it the best adsorbent for FTOH molecules. First, we synthesized the ligand 5-[2,6-bis(4-carboxyphenyl) pyridin-4-yl]isophthalic acid (H4BCPIA) with reference to previous methods.21 Subsequently, 60 mg of ZrCl4, 50 mg of H4BCPIA and 10 mL of N,N-dimethylformamide (DMF) were added into glass vials, vortexed for 2 min, and sonicated for 20 min. When the powder was uniformly dispersed, 3 mL of formic acid was added and sonicated for 20 min. The vial was placed in a 120 °C oven for 48 h. After the reaction, the temperature was slowly lowered at a rate of 5 °C per minute. The reacted emulsion was transferred to a new tube and centrifuged for 3 min (10![[thin space (1/6-em)]](https://www.rsc.org/images/entities/char_2009.gif) 000 rpm), after which the supernatant was discarded. Next, DMF was added, and the mixture was vortexed for 2 min, sonicated for 5 min and centrifuged for 3 min (12
000 rpm), after which the supernatant was discarded. Next, DMF was added, and the mixture was vortexed for 2 min, sonicated for 5 min and centrifuged for 3 min (12![[thin space (1/6-em)]](https://www.rsc.org/images/entities/char_2009.gif) 000 rpm). This step was repeated three times. Finally, the reaction products were washed with acetone. Crystalline BUT-16 was harvested after air drying, the molecular formula of which is [Zr6O4(OH)8(BCPIA)2]n.
000 rpm). This step was repeated three times. Finally, the reaction products were washed with acetone. Crystalline BUT-16 was harvested after air drying, the molecular formula of which is [Zr6O4(OH)8(BCPIA)2]n.
Cell culture on microchip
HepG2 hepatoma, HCT116 colon, HUVEC vascular endothelial, and HKC renal tubular epithelial cells were purchased from the Institute of Basic Medical Sciences, Chinese Academy of Medical Sciences (Beijing, China). The basal culture medium for the HepG2, HUVEC, and HCT116 cells was Dulbecco's modified Eagle's medium (DMEM, Gibco, USA), supplemented with 10% v/v fetal bovine serum (FBS, Corning, USA) and 1% v/v antibiotics solution (10![[thin space (1/6-em)]](https://www.rsc.org/images/entities/char_2009.gif) 000 IU mL−1 penicillin and 10 mg mL−1 streptomycin (Gibco, USA)). The HKC cells were cultivated in DMEM/F12 (Corning, USA) with 5% v/v FBS and 1% v/v antibiotic solution. The cells were seeded in T25-cell culture flasks and were used after reaching confluency. After this, the cells were harvested with trypsin, counted using a haemocytometer and ∼5 × 10³ cells were injected into a microchannel. The seeded microchip was placed in an incubator for 2 h. After the cells adhered, the chip was placed on the homemade device at 37 °C, and the syringes were filled with a solution mixture containing the FTOH or vehicle in the culture medium. The syringes were connected to the microchannels using Tygon tubes.
000 IU mL−1 penicillin and 10 mg mL−1 streptomycin (Gibco, USA)). The HKC cells were cultivated in DMEM/F12 (Corning, USA) with 5% v/v FBS and 1% v/v antibiotic solution. The cells were seeded in T25-cell culture flasks and were used after reaching confluency. After this, the cells were harvested with trypsin, counted using a haemocytometer and ∼5 × 10³ cells were injected into a microchannel. The seeded microchip was placed in an incubator for 2 h. After the cells adhered, the chip was placed on the homemade device at 37 °C, and the syringes were filled with a solution mixture containing the FTOH or vehicle in the culture medium. The syringes were connected to the microchannels using Tygon tubes.
Setup of the filter-Chip-SPE-MS platform
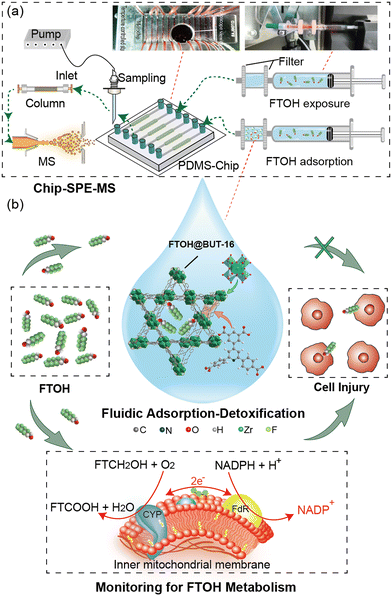
BUT-16 serving as the FTOH sorbent was sandwiched between polyethersulfone (PES) membranes (pore size, 0.22 μm) and filled in the filter. The filters were mounted on the outlet of syringes and connected to the microchannels using Tygon tube (Fig. S1†). Microchannels were loaded with cells cultured with the MOF filtered mixture of FTOH and medium at a flow rate of 50 μL h−1. The outlet of the microchannel of the liquid was collected into micro glass tubes for metabolite detection. The automatic probe provided by the modified UPLC injector was used for accurate sampling, and the specific position and height were programmed using software. An automated probe was employed to accomplish cell-metabolite sample loading and dispensing from the microtubes to the integrated SPE column, where the samples were loaded, washed, and then eluted to the analytical column (Fig. S2†). The filter-Chip-SPE-MS platform achieved online FTOH MOF-based detoxification and automatic pre-treatment of the sample (Fig. 1a). The targeted analytes were detected by the multi-reaction monitoring mode of a triple quadrupole mass spectrometer (Shimadzu 8050, Japan). It was worth noting that the addition of a trapping column to the mobile phase effectively reduced the background interference of fluoride in the solvent. This system was applied to the dynamic monitoring of cellular metabolism during exposure and clearance of FTOH (Fig. 1b).Cellular viability on microchip
To investigate the viabilities of the cells incubated with FTOHs, a calcein-AM/PI double staining kit (Dojindo Laboratories, Japan) was used to stain the cells. Under a UV light beam (wavelength 488–561 nm) emitted from an inverted fluorescence microscope (Olympus IX73, Japan), live and dead cells appeared fluorescent green and red, respectively. After incubation with FTOH solution, calcein-AM (2 μM)/PI (4.5 μM) in phosphate buffer saline (PBS, Gibco, USA) was injected into the microchannels and then cultured at 37 °C for 15 min.Online analysis of metabolites
The molecule metabolites and proteins should be separated prior to mass spectrometry detection to facilitate the calibration of the quantitative results. To simplify pre-treatment, we used a six-port valve to switch the SPE column online. Large molecules (e.g., proteins) were primarily eluted due to steric hindrance and size exclusion of the SPE packing phase. Metabolites were retained due to group interactions in the filler. The MOF-based filter-Chip-SPE-MS system substantially simplified the pre-processing and achieved integrated and high-throughput metabolite analysis. The details are given in the ESI.†Results and discussion
MOF sorbent screening
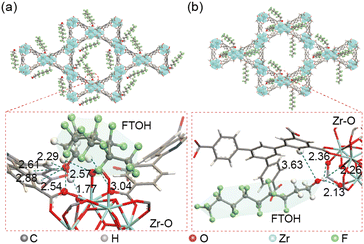
As a proof-of-principle study, we screened multiple MOFs for PFAS removal by the filter-Chip-SPE-MS system, including BUT-17, UIO-66, UIO-66-NH2, and MIL-101(Fe), with the results revealing that BUT-16 was an attractive antidote of PFASs (Fig. S3†). BUT-16 was locked in the filter, which was used for FTOH detoxification. The BUT-16 framework consists of classical Zr6O4(OH)8(CO2)8 secondary building units (SBUs). Carboxyl functional groups on the H4BCPIA ligand form coordination bonds with these SBUs to construct a three-dimensional framework. The synthesis, structural elucidation and adsorption characterization of BUT-16 were carried out using scanning electron microscopy (SEM) (Fig. S4†), powder X-ray diffractometry (PXRD) (Fig. S5†), Fourier-transform infrared (FT-IR) spectroscopy (Fig. S6†) and X-ray photoelectron spectroscopy (XPS) (Fig. S7†), the results of which are presented in the ESI.†To gain insight into the adsorption mechanism of BUT-16 toward FTOH, the binding sites of 6:2 FTOH molecules in the channel of BUT-16 were simulated and calculated using the Dmol3 and Adsorption Locator module in the Materials Studio software. For comparison, the adsorption mechanism of Zr6O4(OH)8(HCOO)2(CPTTA)2 (BUT-17) toward FTOH was also checked. The pore sizes of BUT-16 are 11 and 25 Å, while those of BUT-17 are 9 and 24 Å.21,22 The binding energy (BE) between FTOH molecules and the framework of BUT-16 in FTOH@BUT-16 was estimated to be 68.34 kJ mol−1, higher than that of BUT-17 (43.04 kJ mol−1), indicating that 6:2 FOH molecules have higher affinities with the BUT-16 framework. As shown in Fig. 2a, there are hydrogen bonding interactions between the O atoms of the coordinated formic acid on the Zr6 clusters and H atoms of 6:2 FTOH molecules, the distance of which are 1.77 Å, 2.54 Å, and 2.57 Å, respectively. In addition, the O atoms of 6:2 FTOH molecules also form hydrogen bonds with the H atoms of the coordinated formic acid on the Zr6 clusters, the distances of which are 2.29 Å, 2.61 Å, 2.88 Å, and 3.04 Å. However, in FTOH@BUT-17, the O atoms of the adsorbed 6:2 FTOH molecules form only weak hydrogen bonds with the H atoms on the ligands of 3.63 Å (Fig. 2b). As mentioned above, BUT-16 and BUT-17 had slightly different conformations due to minor differences in the ligands. The central ring in the ligand H4BCPIA of BUT-16 is pyridine. As there is no H atom on the N atom of pyridine, the steric hindrance between the central ring and the side benzene ring in the H4BCPIA ligand should be less than that in the ligand H4CPTTA of BUT-17, meaning that FTOH molecules can enter the Zr6 clusters of BUT-16 more easily, leading to differences in the adsorption sites.
The simulated results were confirmed by deconvolution of the high-resolution XPS spectra of BUT-16 before and after FTOH adsorption (Fig. S8†). The peak in the Zr 3d3/2 spectrum of BUT-16 shifted from 185.54 to 185.40 eV, and that in the spectrum of Zr 3d5/2 shifted from 183.17 to 183.02 eV. This suggested that there may be some weak interactions between FTOH molecules and Zr6 clusters.23,24 The C 1s spectrum of BUT-16 was deconvolved into three peaks at 284.81 eV, 285.99 eV, and 288.81 eV, representing the bond energies of the O atoms of C![[double bond, length as m-dash]](https://www.rsc.org/images/entities/char_e001.gif) C or C–C, O–C
C or C–C, O–C![[double bond, length as m-dash]](https://www.rsc.org/images/entities/char_e001.gif) O and C–N(O) groups, respectively. After adsorption of FTOHs, the ratios of the C
O and C–N(O) groups, respectively. After adsorption of FTOHs, the ratios of the C![[double bond, length as m-dash]](https://www.rsc.org/images/entities/char_e001.gif) C/C–C and O–C
C/C–C and O–C![[double bond, length as m-dash]](https://www.rsc.org/images/entities/char_e001.gif) O peaks increased from 37% to 38.72% and 10.57% to 10.83%, respectively. The O 1s spectrum was deconvolved into three peaks at 530.07 eV, 531.76 eV and 533.22 eV, attributed to C
O peaks increased from 37% to 38.72% and 10.57% to 10.83%, respectively. The O 1s spectrum was deconvolved into three peaks at 530.07 eV, 531.76 eV and 533.22 eV, attributed to C![[double bond, length as m-dash]](https://www.rsc.org/images/entities/char_e001.gif) O, O⋯H and C–O groups, respectively. Notably, the ratio of O⋯H peaks increased from 21.03% to 21.89%, confirming the existence of hydrogen bonds between FTOH and BUT-16. Furthermore, the appearance of N⋯H at 400.83 eV in the N 1s XPS spectrum confirmed the existence of hydrogen bonds between FTOH and BUT-16, which promoted the adsorption process of FTOH.
O, O⋯H and C–O groups, respectively. Notably, the ratio of O⋯H peaks increased from 21.03% to 21.89%, confirming the existence of hydrogen bonds between FTOH and BUT-16. Furthermore, the appearance of N⋯H at 400.83 eV in the N 1s XPS spectrum confirmed the existence of hydrogen bonds between FTOH and BUT-16, which promoted the adsorption process of FTOH.
BUT-16 fluidic adsorption enhances the adsorption efficiency
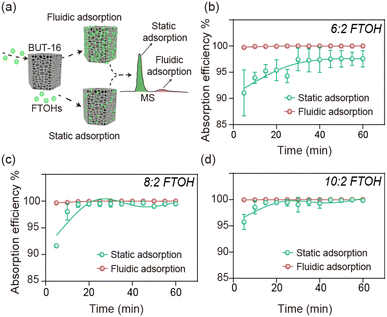
Although BUT-16 provided excellent adsorption capacity for FTOH, it should be noted that there was a huge difference between the fluidic and static adsorption, which was confirmed from the adsorption kinetic curves (Fig. 3). First, 3 mg mL−1 of BUT-16 was used to adsorb the 500 mg L−1 FTOH solution, the detailed procedures of which are shown in the ESI. The adsorption of BUT-16 for each FTOH in the fluidic adsorption was a fast process, reaching adsorption equilibrium within 1 min (the data for 1 min of adsorption equilibrium overlapped with the initial data). Under the same conditions, the static equilibrium adsorption time was around 60 min. BUT-16 has abundant interaction sites for synergy with FTOH. However, in the non-flowing state, the collision and rates of contact that the materials make with each other were reduced, resulting in an inhomogeneous adsorption process. To better understand the adsorption process, the adsorption data were fitted using pseudo-first-order and pseudo-second-order models to study the adsorption kinetics. The fitting parameters in Table S1† show that the correlation coefficients simulated by the pseudo-second-order equation of fluidic adsorption were 1, and the theoretical equivalent adsorption capacity calculated by the second-order kinetic equation was similar to the experimental equivalent adsorption capacity. Compared with static adsorption, online fluidic adsorption has greater potential for practical application (Table S2†), but there have been few reports on this topic. In addition, it was found in our study that the high efficiency and safety in the removal process should not be neglected due to the low adsorption efficiency resulting in some toxicity to cells (Fig. S9†).To understand the binding parameters between FTOH and the sorbent, a sorption isotherm study was conducted on FTOH using BUT-16. The parameters for the two models are listed in Table S3.† The experimental data was found to fit the Langmuir model better than the Freundlich model, with coefficient of determination (R2) values of 0.9949, 0.9872 and 0.9937 for the Langmuir model, and R2 values of 0.9457, 0.9913 and 0.9804 for the Freundlich model. The maximum adsorption capacities (Qm) of BUT-16 for FTOH were calculated to be 321.85, 386.70 and 392.77 mg g−1, suggesting a strong binding affinity between FTOH and our sorbent BUT-16 with superior capacity.
Real-time evaluation of detoxification efficiency
Cells were cultured on a microfluidic chip to monitor the oxidation of FTOH metabolism in situ. When free-form FTOH entered the cells, it moves to the endoplasmic reticulum for biotransformation by binding to transporters. As identified by mass spectrometry (Fig. S10†), FTOHs were metabolized by CYP-mediated oxidation to produce fluorotelomer carboxylic acid (FTCA). FTCA easily eliminates HF to produce fluorotelomer unsaturated carboxylic acid (FTUCA). These two compounds are intermediates for the conversion of FTOH to perfluorooctanoic acid (PFCA). FTCA is 10![[thin space (1/6-em)]](https://www.rsc.org/images/entities/char_2009.gif) 000 times more toxic than their respective PFCAs in aquatic organisms.25 FTUCA can covalently bind to proteins and thus affect protein function, which may increase the toxicity of FTOH.26
000 times more toxic than their respective PFCAs in aquatic organisms.25 FTUCA can covalently bind to proteins and thus affect protein function, which may increase the toxicity of FTOH.26
The characteristic fragment peaks of 6:2, 8:2, 10:2 FTCA are presented in Fig. S11.† 6:2 FTCA exhibited a signal for a deprotonated molecule at m/z 377, 8:2 FTCA exhibited a signal for a deprotonated molecule at m/z 477 and 10:2 FTCA exhibited a signal for a deprotonated molecule at m/z 577. Multiple reaction monitoring (MRM) of the m/z 377 → 293, 477 → 393, 577 → 493 transitions was employed for quantitative analysis. Calibration curves were constructed by spiking different concentrations of FTCA into the culture medium, yielding concentrations of FTCA ranging from 156.25 to 10![[thin space (1/6-em)]](https://www.rsc.org/images/entities/char_2009.gif) 000 ng L−1. The molecular ion peak area (Y) increased linearly with 6:2 FTCA (X), and the fitting formula can be defined as Y = 6.353X + 589.5 (R2 = 0.9819); the relationship between the 8:2 FTCA peak area (Y) and concentration (X) can be defined as Y = 7.427X + 875.5 (R2 = 0.9914); and the correlation between 10:2 FTCA (Y) and concentration (X) can be defined as Y = 6.188X + 246.4 (R2 = 0.9814), as shown in (Table S4†).
000 ng L−1. The molecular ion peak area (Y) increased linearly with 6:2 FTCA (X), and the fitting formula can be defined as Y = 6.353X + 589.5 (R2 = 0.9819); the relationship between the 8:2 FTCA peak area (Y) and concentration (X) can be defined as Y = 7.427X + 875.5 (R2 = 0.9914); and the correlation between 10:2 FTCA (Y) and concentration (X) can be defined as Y = 6.188X + 246.4 (R2 = 0.9814), as shown in (Table S4†).
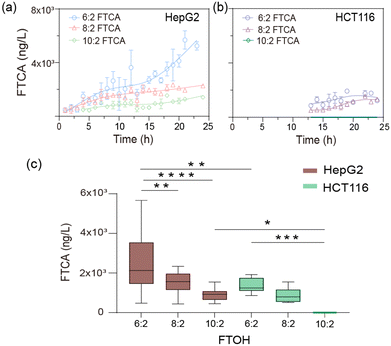
The FTCAs increased with the concentration of FTOHs (Fig. S12†). The short-chain 6:2 FTOH was more easily metabolized, consistent with published results.27 The trend in the time-dependent metabolite formation showed a characteristic profile of the appearance of inflection points upon long-term treatment with FTOHs. When incubated with 10 mg L−1 of FTOHs, the FTCA metabolite in the HepG2 cells continued to increase over time (Fig. 4a). However, HCT cells produced FTCA after about 12 h and quickly reached saturation, which may be due to the low expression of relative CYPs in HCT116 cells (Fig. 4b). By comparing the biotransformation of hepatocytes and enterocytes, we found obvious differences in their metabolic activities (Fig. 4c). It is worth mentioning that no release of FTOHs was detected when cells were incubated with flow adsorption-treated medium, and metabolite FTCAs were also not found in the target HepG2 and HCT116 cells (Fig. S11d and e†).
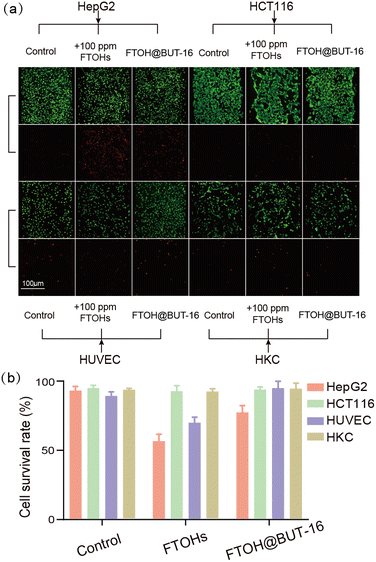
In the meantime, we investigated the activity of cells using calcein AM/PI. The stained images obtained using an inverted microscope (Fig. 5a) showed that all of the cells exhibited high viabilities when they were cultured on the microfluidic chip, indicating their capabilities for reconstructing the cell-growth micro-environment on the chip. Using the ImageJ software, the survival rate of the HepG2 cells dropped to 56% when incubated with 100 ppm of FTOHs (Fig. 5b). FTOH exposure produced toxic FTCAs in HepG2 cells with more mitochondria, and this reaction required the participation of oxygen. On the one hand, oxygen maintains metabolism, and on the other hand, it generates oxygen radicals and reactive oxygen species (ROS) through a series of reactions. Stimulated mitochondria can significantly increase ROS, leading to cell damage and apoptosis. Compared with HepG2 cells, the HCT116 and HKC cells produced fewer toxic FTCAs with exposure to FTOHs due to their low expression of relative CYPs, as shown in Fig. 4. Therefore, the HCT116 and HKC cells exhibit better toxicity resistance to FTOH, resulting in their higher cell viability when exposed to FTOHs. However, when the filter was filled with BUT-16, FTOHs were effectively removed, and the survival rate rose to 77%. While, regardless of FTOH exposure or removal, the survival rate of the HCT116 cells did not change significantly and remained above 90%. In addition, we also observed the viability of HUVEC and HKC cells, where the survival rate of HUVEC cells increased by 25% under the detoxification treatment, while the survival rate of HKC cells increased by only 3%.
Metabolic effects and pathway determination
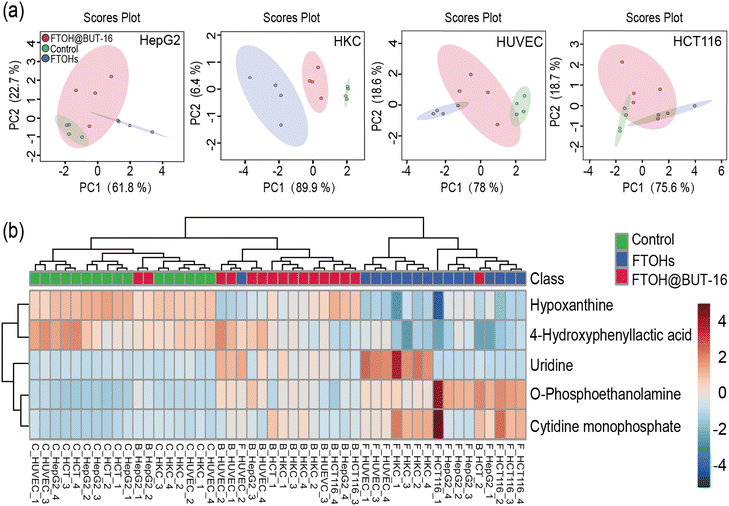
The above results indicated that the metabolic rate of the FTOHs is very slow, but they can interact with endogenous metabolic processes.14 However, using BUT-16 as an antidote to adsorb FTOHs, no metabolite FTCA was found. Therefore, the effect of the whole process on metabolism is worth exploring. We used this prepared platform to track the changes of 65 metabolites in FTOH exposure and detoxification, which can be seen in detail in Table S5.†Based on the enrichment data after 24 h, Fig. 6a shows that the control, 100 mg mL−1 FTOH exposure and FTOH@BUT-16 groups could be clearly separated in the PCA score plot. The total variances explained by PC1 and PC2 were 84.5%, 96.3%, 96.6% and 94.3% for HepG2, HKC, HUVEC and HCT116 cells, respectively. In addition, as shown in Fig. 6b, comparison of the four types of cells in three different groups revealed differential enrichment of five detected metabolites with a p value of <0.0001. These metabolites were o-phosphoethanolamine, cytidine monophosphate, hypoxanthine, 4-hydroxyphenyllactic acid, and uridine. Notably, significant metabolites (p value <0.0001 and fold change >5) that were upregulated in the FTOH group compared to the control group were o-phosphoethanolamine, cytidine monophosphate, and uridine. Previous studies have found that uridine promotes the course of tissue regeneration, probably by modulating the metabolic process and suppressing inflammation.28 In our study, incubation with FTOHs significantly increased the concentration of uridine in normal, HUVEC and HKC cells. To explain this phenomenon, we measured the secretion of inflammatory IL-6 cytokines (Fig. S13†). Compared with the control group, the release of IL-6 from HUVEC cells significantly increased in the FTOH exposure group (p < 0.0001) but was inhibited in the FTOH@BUT-16 group (p < 0.0001). When HKC cells were exposed to FTOHs, inflammatory factors were only slightly increased, which may be due to the secretion of inflammatory mediators by the cells.
The metabolic perturbation of different organ cells toward 6:2, 8:2, 10:2 FTOH exposure was confirmed by principal component analysis, which showed the secretion of o-phosphoethanolamine, cytidine monophosphate, hypoxanthine, 4-hydroxyphenyllactic acid, and uridine. The metabolisms of uridine and cytokine IL-6 were enhanced by FTOH exposure in normal HUVEC and HKC cells, illustrating that the inflammation of normal cells was promoted by FTOH stimulation. The diverse metabolic effects with different organ cells was reported for the first time in this study, with the results revealing that the inflammation may be the adverse effect of FTOH exposure, which could support its clinical diagnosis and therapy. This new phenomenon was similar to that of daphnia magna,29 which supported that the filter-Chip-SPE-MS system is a versatile robust platform for the real-time monitoring of noxious pollutant detoxification and biotransformation.
Conclusions
In this study, an in situ platform was developed for the high-throughput identification of PFASs by efficient MOF sorbents and investigation of their metabolism effects using a filter-Chip-SPE-MS system. BUT-16 was screened and selected as an attractive antidote for in situ FTOH adsorption. Multiple hydrogen bonds are formed between FTOHs and the Zr6 clusters around the large hexagonal pores of the BUT-16 surface. The high-performance BUT-16 framework was sandwiched between PES membranes and filled in a filter, and the relevant removal efficiency of the BUT16 filter was 100% in 1 min. To determinate the FTOH metabolism effects in different organs, HepG2human hepatoma, HCT116 colon cancer, HKC renal tubular, and HUVEC vascular endothelial cells were cultured on a microfluidic chip, and SPE-MS was used to track a variety of cell metabolites in real time. The results revealed that FTOHs could be biotransformed in HepG2 and HCT116 due to the presence of CYP enzymes, and the metabolic activities of the two were significantly different, further indicating that the liver may be the main target organ of FTOH metabolism. Moreover, the metabolic perturbation of different organ cells toward 6:2, 8:2, 10:2 FTOH exposure was confirmed by principal component analysis. The metabolisms of uridine and cytokine IL-6 were enhanced by FTOH exposure in normal, HUVEC, and HKC cells, illustrating that the inflammation of normal cells was promoted by FTOH stimulation. In consequence, the filter-Chip-SPE-MS enables a versatile and robust platform for the real-time monitoring of noxious pollutant detoxification, biotransformation, and metabolism, which facilitates pollutant antidote development and toxicology assay.Conflicts of interest
The authors declare no competing financial interests.Acknowledgements
This work was financially supported by the National Natural Science Foundation of China (No. 22204173, 22034005), the National Key R&D Program of China (No. 2021YFF0600700) and the Central Public-interest Scientific Institution Basal Research Fund of the Chinese Academy of Agricultural Sciences (No. Y2022PT20).References
- A. Leeson, T. Thompson, H. F. Stroo, R. H. Anderson, J. Speicher, M. A. Mills, J. Willey, C. Coyle, R. Ghosh and C. Lebrón, Environ. Toxicol. Chem., 2021, 40, 24–36 CrossRef CAS PubMed
.
- M. G. Evich, M. J. B. Davis, J. P. McCord, B. Acrey, J. A. Awkerman, D. R. U. Knappe, A. B. Lindstrom, T. F. Speth, C. Tebes-Stevens, M. J. Strynar, Z. Wang, E. J. Weber, W. M. Henderson and J. W. Washington, Science, 2022, 375, eabg9065 CrossRef CAS PubMed
.
- N. J. Herkert, C. D. Kassotis, S. Zhang, Y. Han, V. F. Pulikkal, M. Sun, P. L. Ferguson and H. M. Stapleton, Environ. Sci. Technol., 2022, 56, 1162–1173 CrossRef CAS PubMed
.
- B. I. Escher, H. M. Stapleton and E. L. Schymanski, Science, 2020, 367, 388–392 CrossRef CAS PubMed
.
- S. Beesoon, S. J. Genuis, J. P. Benskin and J. W. Martin, Environ. Sci. Technol., 2012, 46, 12960–12967 CrossRef CAS PubMed
.
- R. Li, N. N. Adarsh, H. Lu and M. Wriedt, Matter, 2022, 5, 3161–3193 CrossRef CAS
.
- E. Karbassiyazdi, M. Kasula, S. Modak, J. Pala, M. Kalantari, A. Altaee, M. R. Esfahani and A. Razmjou, Chemosphere, 2023, 311, 136933 CrossRef CAS PubMed
.
- D. Zhang, W. Zhang and Y. Liang, Sci. Total Environ., 2019, 694, 133606 CrossRef CAS PubMed
.
- M.-J. Chen, A.-C. Yang, N.-H. Wang, H.-C. Chiu, Y.-L. Li, D.-Y. Kang and S.-L. Lo, Microporous Mesoporous Mater., 2016, 236, 202–210 CrossRef CAS
.
- K. Y. Christensen, M. Raymond and J. Meiman, Int. J. Hyg. Environ. Health, 2019, 222, 147–153 CrossRef CAS PubMed
.
- L. I. FitzGerald, J. F. Olorunyomi, R. Singh and C. M. Doherty, ChemSusChem, 2022, 15, e202201136 CAS
.
- G. M. Sinclair, S. M. Long and O. A. H. Jones, Chemosphere, 2020, 258, 127340 CrossRef CAS PubMed
.
- D. M. Pizzurro, M. Seeley, L. E. Kerper and B. D. Beck, Regul. Toxicol. Pharmacol., 2019, 106, 239–250 CrossRef CAS PubMed
.
-
Q. Jiang, H. Gao and L. Zhang, in Toxicological Effects of Perfluoroalkyl and Polyfluoroalkyl Substances, ed. J. C. DeWitt, Springer International Publishing, Cham, 2015, pp. 177–201, DOI:10.1007/978-3-319-15518-0_7
.
- L. A. Low, C. Mummery, B. R. Berridge, C. P. Austin and D. A. Tagle, Nat. Rev. Drug Discovery, 2021, 20, 345–361 CrossRef CAS PubMed
.
- B. Yang, X. Jiang, X. Fang and J. Kong, Lab Chip, 2021, 21, 4285–4310 RSC
.
- Y. Hou, Y. Zheng, X. Zheng, Y. Sun, X. Yi, Z. Wu and J.-M. Lin, Lab Chip, 2023, 23, 2654–2663 RSC
.
- S. Mao, W. Li, Q. Zhang, W. Zhang, Q. Huang and J.-M. Lin, TrAC, Trends Anal. Chem., 2018, 107, 43–59 CrossRef CAS
.
- W. Shi, S. Bell, H. Iyer, C. K. Brenden, Y. Zhang, S. Kim, I. Park, R. Bashir, J. Sweedler and Y. Vlasov, Lab Chip, 2023, 23, 72–80 RSC
.
- N. Xu, H. Lin, S. Lin, W. Zhang, S. Han, H. Nakajima, S. Mao and J.-M. Lin, Anal. Chem., 2021, 93, 2273–2280 CrossRef CAS PubMed
.
- J. Cheng, B. Wang, J. Lv, R. Wang, Q. Du, J. Liu, L. Yu, S. Dong, J.-R. Li and P. Wang, ACS Appl. Mater. Interfaces, 2021, 13, 58019–58026 CrossRef CAS PubMed
.
- B. Wang, P. Wang, L.-H. Xie, R.-B. Lin, J. Lv, J.-R. Li and B. Chen, Nat. Commun., 2019, 10, 3861 CrossRef PubMed
.
- X. Dou, D. Mohan, C. U. Pittman Jr and S. Yang, Chem. Eng. J., 2012, 198, 236–245 CrossRef
.
- A. Robledo-Peralta, L. V. García-Quiñonez, R. I. Rodríguez-Beltrán and L. Reynoso-Cuevas, Polymers, 2022, 14, 1575 CrossRef CAS PubMed
.
- M. M. Phillips, M. J. A. Dinglasan-Panlilio, S. A. Mabury, K. R. Solomon and P. K. Sibley, Environ. Sci. Technol., 2007, 41, 7159–7163 CrossRef PubMed
.
- A. A. Rand and S. A. Mabury, Environ. Sci. Technol., 2013, 47, 1655–1663 CAS
.
- M. Lewis, M.-H. Kim, N. Wang and K.-H. Chu, Sci. Total Environ., 2016, 572, 935–942 CrossRef CAS PubMed
.
- Z. Liu, W. Li, L. Geng, L. Sun, Q. Wang, Y. Yu, P. Yan, C. Liang, J. Ren and M. Song, Cell Discovery, 2022, 8, 1–22 Search PubMed
.
- L. M. Labine, E. A. O. Pereira, S. Kleywegt, K. J. Jobst, A. J. Simpson and M. J. Simpson, Environ. Res., 2022, 212, 113582 CrossRef CAS PubMed
.
Footnote |
| † Electronic supplementary information (ESI) available. See DOI: https://doi.org/10.1039/d3lc00423f |
| This journal is © The Royal Society of Chemistry 2023 |

