 Open Access Article
Capacitive platform for real-time wireless monitoring of liquid wicking in a paper strip†
Isidoro
Ruiz-García
 abd,
Pablo
Escobedo
 abd,
Celia E.
Ramos-Lorente
bc,
Miguel M.
Erenas
 bc,
Luis F.
Capitán-Vallvey
 bc,
Miguel A.
Carvajal
abd,
Alberto J.
Palma
 *abd and
Nuria
López-Ruiz
abd
aElectronic and Chemical Sensing Solutions (ECsens), CITIC-UGR, Department of Electronics and Computer Technology, University of Granada (UGR), 18071 Granada, Spain. E-mail: ajpalma@ugr.es
bUnit of Excellence in Chemistry Applied to Biomedicine and the Environment of the University of Granada, Granada, Spain
cElectronic and Chemical Sensing Solutions (ECsens), Department of Analytical Chemistry, University of Granada (UGR), 18071 Granada, Spain
dSport and Health University Research Institute (iMUDS), University of Granada (UGR), 18071 Granada, Spain
First published on 21st August 2023
Abstract
Understanding the phenomenon of liquid wicking in porous media is crucial for various applications, including the transportation of fluids in soils, the absorption of liquids in textiles and paper, and the development of new and efficient microfluidic paper-based analytical devices (μPADs). Hence, accurate and real-time monitoring of the liquid wicking process is essential to enable precise flow transport and control in microfluidic devices, thus enhancing their performance and usefulness. However, most existing flow monitoring strategies require external instrumentation, are generally bulky and unsuitable for portable systems. In this work, we present a portable, compact, and cost-effective electronic platform for real-time and wireless flow monitoring of liquid wicking in paper strips. The developed microcontroller-based system enables flow and flow rate monitoring based on the capacitance measurement of a pair of electrodes patterned beneath the paper strip along the liquid path, with an accuracy of 4 fF and a full-scale range of 8 pF. Additionally to the wired transmission of the monitored data to a computer via USB, the liquid wicking process can be followed in real-time via Bluetooth using a custom-developed smartphone application. The performance of the capacitive monitoring platform was evaluated for different aqueous solutions (purified water and 1 M NaCl solution), various paper strip geometries, and several custom-made chemical valves for flow retention (chitosan-, wax-, and sucrose-based barriers). The experimental validation delivered a full-scale relative error of 0.25%, resulting in an absolute capacitance error of ±10 fF. In terms of reproducibility, the maximum uncertainty was below 10 nl s−1 for flow rate determination in this study. Furthermore, the experimental data was compared and validated with numerical analysis through electrical and flow dynamics simulations in porous media, providing crucial information on the wicking process, its physical parameters, and liquid flow dynamics.
Introduction
Liquid wicking in porous media refers to the process whereby capillary forces draw a liquid into a porous material, driven by its surface tension. The rate of liquid wicking in porous media is dependent on several factors, including the surface tension of the liquid, the pore size and shape of the porous material, the wetting properties of the material, and the geometry and orientation of the porous material.1–3 This phenomenon is significant in a wide range of applications, including the transport of fluids in soils, the design of microfluidic devices, and the absorption of liquids in textiles and paper.4–6Considerable effort has been invested in comprehending the dynamics of liquid imbibition through porous media, owing to the three-phase complex formation of solid–liquid and –gas interfaces. In 1856, Darcy conducted the first experimental investigation of liquid flow in porous media.7 His model assumes that flow within a porous medium is driven solely by capillary pressure gradient. In 1921, two researchers established a relationship between the capillary height and the rising time of a liquid in porous media, popularly known as the Lucas–Washburn (LW) equation.1,2 Various studies have utilized the LW model to understand the physics of liquid wicking in porous media. The LW model scales the liquid wicking distance (Llf) with time (t) as Llf ∼ t1/2. However, both Darcy's law and the LW equation make simplifying assumptions that restrict their applicability. The LW equation assumes a constant capillary diameter throughout the length of the paper, and it does not account for changes in channel geometry or the effects of evaporation. Hence, several modifications have been reported to make both models more accurate. These modifications include the incorporation of different effects such as gravity,8 liquid evaporation,9 and fibre swelling,10–12 among others. Another approach to address this phenomenon is based on Richards's equation.13 This equation can also be effectively solved with numerical simulators, which have been precisely employed in recent works to shed light on the wicking process in porous media, including several of the aforementioned effects.14–16 A recent review compiles most of the advances in this area.17
Liquid wicking in porous media plays a crucial role in microfluidic paper-based analytical devices (μPADs). The use of μPADs has several advantages over traditional diagnostic techniques, such as being low cost, ease of use, and portable.18–22 The wicking of the liquid through the porous matrix in μPADs promotes the transport of the sample and facilitates the mixing of the sample with reagents, enabling the detection of target analytes. μPADs have been utilized for a wide range of applications, including detection of infectious diseases, environmental monitoring, and food safety testing.22 Understanding liquid wicking in porous media is crucial in the development of new and efficient μPADs. By optimizing the properties of the porous material, such as pore size and shape, and the composition of the reagents, the performance of the device can be enhanced, leading to more sensitive and accurate detection of target analytes.16,23–25
Flow control is a crucial aspect of μPADs, which rely on capillary forces to manipulate and transport fluids within porous material. Effective flow control is essential to ensure that the liquid flows through the device at the desired rate and reaches the detection zone where the signal is generated. Several strategies have been reported for flow control, including paper strip geometry, mechanical manipulation, chemical modification, and electrical/magnetic/thermal actuators.5,17 Accurate and real-time flow and flow rate monitoring is essential for useful and practical implementation of these techniques26 as an alternative to offline flow monitoring methods based on video recording of the wicking process. This ensures precise flow control and therefore improves the performance of microfluidic devices.
External flow sensors are typically employed in systems with active liquid pumping, including close-loop feedbacks, or particle image velocimetry techniques to monitor the flow in microfluidic devices. Although effective, these external solutions are generally bulky and not suitable for portable systems.27 On the other hand, in the last decade, some integrated flow monitoring strategies, requiring specific fabrication procedures and materials, have been reported based on cantilevers,28 magnetic composites,29 piezoelectric nanofibers,30 optical nanofibers,31 resonant membranes,32 and nanoparticles strain sensors on sealed microfluidic channels.33 Alternatively, techniques based on electrical measurements with conducting electrodes or materials, such as electrical admittance measurements,34 electrical impedance spectroscopy,35 electrochemical sensors,36,37 and piezoresistive membranes,38 have been presented but require external instrumentation for the electrical magnitude acquisition. A study by the research group of Prof. Delamarche demonstrated a remarkable and inspiring approach for capillary-driven microfluidics in PDMS channels. The channel flow was monitored by measuring the change in a pair of longitudinally patterned metallic electrodes along the hydrophilic flow path while liquid wicking. It produced a dielectric constant change that could be easily detected by capacitive detection. This electronically-microcontrolled setup was provided with a graphical interface and a wireless link to a smartphone for real-time and in situ data display and transmission.26
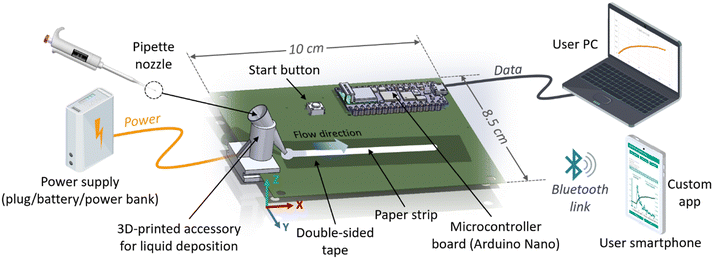
In the present work, we have developed a portable electronic platform for real-time and wireless flow monitoring of liquid wicking in paper strips. The performance of this system was evaluated using different water solutions, paper strip geometries, and various chemical valves. Fig. 1 presents a general scheme of our system, which is based on the capacitance measurement of a pair of parallel electrodes patterned beneath the paper strip along the liquid path. These electrodes were designed on a printed circuit board (PCB) along with a capacitance detector and a microcontroller board that includes a Bluetooth link. In addition, experimental capacitive transients were theoretically reproduced with a numerical simulator including both electrical and flow in porous media simulations. The full geometry of the experimental setup was included in the COMSOL Multiphysics software to perform the numerical analysis of the capacitance change of the imbibition process as a function of time. The comparison of experimental and numerical data provides fundamental information about the wicking process in terms of the physical parameters involved, such as dielectric constant, pore size, and permeability; and the flow relevant features, including the dynamics of the length of the liquid front, absorbed liquid mass/volume, and liquid mass/volume flow. To the best of our knowledge, this is the first compact system that enables monitoring of liquid wicking along an entire paper strip, providing physical information about the phenomenon through numerical simulation.
Experimental and numerical procedures
Materials and software
The electronic components were procured from RS Components supplier (Corby, UK). The printed circuit board and the capacitive electrode structure were fabricated using the computer-controlled circuit board plotter LPKF ProtoMat S100 (LPKF Laser & Electronics SE, Garsen, Germany). An accessory for a micropipette tip holder was 3D printed with a Creality CR-X 3D printer (Creality, Shenzhen, China) using polylactic acid (PLA) filament. The proposed capacitive sensing platform was validated using a precision LCR meter E4980AL (Keysight Tech., Santa Rosa, CA, USA). The dielectric constants of the paper, both dry and imbibed with purified water, were measured using a 40 Hz to 110 MHz precision impedance analyzer 4294A interfaced to the dielectric material test fixture with parallel plate electrodes, 16451B (Keysight Tech., Santa Rosa, CA, USA). The physical study of the experimental setup, including the surface morphology and texture changes of the paper strip during the wicking process, was carried out using the 3D optical profilometer SNeox (Sensofar, Barcelona, Spain). The confocal technique was configured with ×5, ×20, and ×50 optical objectives, achieving a spatial resolution ranging from 470 to 180 nm. The features of the surface texture standard ISO 25178 were calculated by the profilometer software SensoVIEW 1.9.2. A Xiaomi Redmi Note 11S smartphone (Xiaomi Corporation, Beijing, China) was used for video recording during the validation of the platform, configuration, and real-time results display.Filter paper Whatman grade 1 (Merck KGaA, Sant Louis, USA) was selected for all experiments of this work. Different paper strip shapes were obtained using a laser cutting machine (Rayjet 50 Laser Engraver, Austria). Hydrophobic double-sided adhesive tape Tesa 64621 (Tesa, Hamburg, Germany) was used to affix the paper strip to the capacitive electrodes. Purified water was produced by a TKA Microlab type II (TKA Wasseraufbereitungssysteme GmbH, Niederelbert, Germany) for the experiments to evaluate the sensing platform's performance. High molecular weight chitosan, NaCl, and sucrose were provided by Sigma-Aldrich Merck (Madrid, Spain) for the chemical experiments. COMSOL Multiphysics 6.1 (Comsol AB, Stockholm, Sweden) was employed for numerical calculations and modelling of the electrical capacitance transient and the flow dynamics of the paper strip in the wicking process. The AC/DC, microfluidics, and porous media flow modules were utilized for the programming of COMSOL applications, including the geometries and materials of the different experimental setups described below. The smartphone application was coded using Android Studio Dolphin (2021.3.1) as the integrated development environment (IDE). The application was designed and tested with Application Programming Interface (API) level 31 (Android 12), although it is compatible with older Android versions, API 22 (Android 5.1) being the minimum level required for functional compatibility. The open-source library MPAndroidChart was used for the visual representation of the data within the application.
Capacitive sensing platform
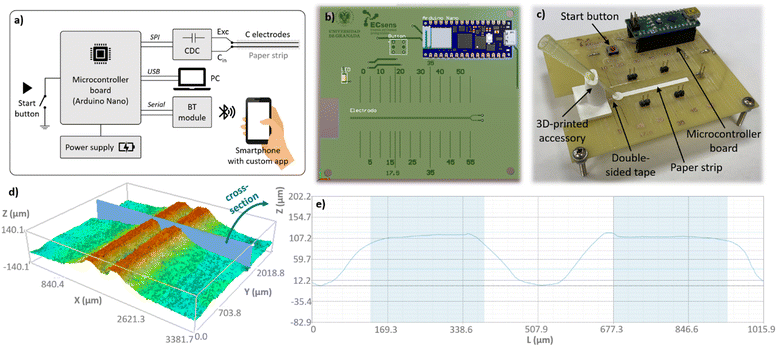
Our design of the electronic platform for monitoring the dynamics of liquid imbibition in a paper strip is based on tracking the capacitance change over time when wicking the liquid. As depicted in Fig. 2, we have patterned a pair of metal parallel electrodes positioned below the strip in the path of the advancing imbibition front. As the paper strip becomes wet, the capacitance between these electrodes changes, allowing for accurate and real-time measurement of the process without the need for video cameras or external flow sensors. Double-sided adhesive tape is attached between the electrodes and the paper strips to fix both elements, also providing a waterproof barrier to prevent the electrodes from getting wet and causing a short-circuit, since they need to be dry for an accurate and reliable capacitance measurement. Our electronic measurement system lies on the small breadboard Arduino Nano (Chiasso, Switzerland) as the controller unit. This controller was selected for its versatility, low power consumption of 19 mA, light weight of 7 g, wireless communication and battery-powering capabilities. This unit is responsible for the configuration and data analysis of the AD7746 capacitive sensor (Analog Devices Inc., Cambridge, MA, USA), which is a 24-bit, 2-channel capacitive to digital converter employed to measure the capacitance change due to the liquid wicking in the paper strip. This capacitive sensor can measure capacitance at 32 kHz achieving an accuracy of 4 fF with a full-scale range of 8 pF. Moreover, a ±4 pF capacitance offset can be added to adjust the measuring range. Sampling frequency can also be selected from 10 to 90 Hz, and its communication with the controller is via I2C serial interface. An on-chip temperature sensor is also included with a resolution of 0.1 °C and accuracy of ±2 °C. The acquired data can be sent wirelessly to the user via Bluetooth with a low power and reprogrammable BM78 Bluetooth module (Microchip Tech. Inc., Chandler, AZ, USA). Wired USB bus is also available to display the data on any serial monitor of a computer for debugging purposes.As shown in Fig. 2b, the pair of metal parallel electrodes were fabricated on a standard copper clad FR4 board, where the electronic components and systems (Arduino Nano, capacitive sensor, and Bluetooth module) were soldered. Considering the practical minimum spatial resolution of the circuit board plotter, the two metal electrodes were initially designed with a width and separation of 254 μm, and a total length of 45 mm. Because of the tolerance of the PCB plotter, the actual width and gap electrodes were measured using an optical profilometer as shown in Fig. 2d and e, whose details are given in Table 1. The copper layer thickness of the FR4 board determined the electrode thickness, which was 35 μm. With this configuration, the measured capacitance of the nude electrodes was 1.71 ± 0.01 pF. In addition, the designed printed circuit board includes a button for manual data acquisition initialization and a patterned ruler for quick localization of the imbibition liquid front on the paper strip.
| Structure (material) | Parameter | Value |
|---|---|---|
| a Measured with the profilometer. b Measured with the impedance analyser. | ||
| Substrate (FR4) | Thickness | 1.5 mm |
| Relative permittivity | 4.5 | |
| Electrodes (Cu) | Widtha | 200 μm |
| Gapa | 300 μm | |
| Thickness | 35 μm | |
| Double-sided adhesive tape (polypropylene) | Thicknessa | 75 μm |
| Relative permittivity | 2.4 | |
| Paper (Whatman G1) | Total length | 40/45 mm |
| Width | 3/5 mm | |
| Thicknessa (dry) | 180 ± 2 μm | |
| Relative permittivityb (dry) | 1.9 (ref. 40) | |
| Thicknessa (wet) | 230 ± 5 μm | |
| Relative permittivityb (wet) | 18 | |
The paper strip is attached to the sensing platform in horizontal position; therefore, the gravity effect is not considered in this work. Firstly, a strip of double-sided adhesive tape with dimensions of 10 mm width and 50 mm length is centred and aligned on the capacitive electrodes. This layer functions as a liquid barrier between the electrodes and the paper strip, ensuring that the paper strip remains fixed and flat. Subsequently, the paper strip is attached to the tape with the same centred and aligned position along the longitudinal axis (x-axis) of the electrodes pair (refer to Fig. 2c). In order to ensure high test reproducibility, it is essential to precisely control the liquid volume and the water intake disposition, since prior research has proved that the initial contact between the liquid and the paper is a critical determinant of flow rate.3,39 To achieve this objective and in line with the typical use of this kind of paper strip in analysis, a polymeric accessory has been designed and fabricated using 3D printing technology to secure the micropipette tip in a fixed position. Firstly, a controlled liquid volume is aspired by the micropipette and deposited in the tip. Then, the tip is detached from the micropipette body and brought into contact with the zone of the paper liquid intake. As we will show below, our tests demonstrate that the proposed setup ensures that the liquid flows reproducibly into the paper, driven by the capillary pressure.
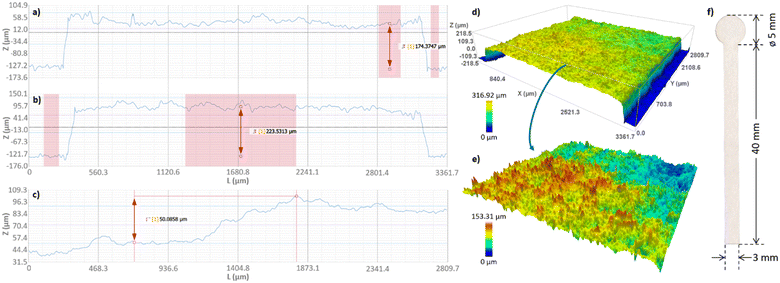
Numerical analysis
In this study, a finite element method (FEM) was used to solve the numerical problem using the COMSOL Multiphysics environment. A dual simulation was carried out, where the capacitance (C) of the electrodes under the paper strip was first calculated as a function of the length of the liquid front assuming a step function for the transition between dry paper and wet paper. To achieve this, the total paper length (L) was divided into ten equal segments, and the electrical capacitance of the entire paper strip was calculated sequentially with the complete paper dry, then with the initial segment wet, and so on until all ten segments were completely wet. This provided the simulated capacitance as a function of the length of the liquid front, ΔCsim(Llf). The AC/DC module was used for this numerical calculation, including the complete platform geometry and relevant electric parameters, which are listed in Table 1. The dimensions were measured with the profilometer (including thickness of the swelled paper, as shown in Fig. 3); the paper permittivity (dry and wet) was determined with the described setup; and the rest of the parameters were taken from the well-known material properties (copper, FR4 that is glass-reinforced epoxy laminate material, and polypropylene). Paper dimensions were analysed, and Fig. 3a–c shows a noticeable increase in paper thickness while wicking, measuring approximately 50 μm of swelling (an additional 27% from the initial dry paper thickness of 180 μm).Once the correlation between the capacitance and the length of the liquid front was established by electrical simulation, the next step involved incorporating the time variable and liquid flow dynamics into the calculation. Therefore, the second step involved simulating the liquid flow, where the length of the liquid front, Llf(t), intake volume, and flow rate, Q(t), were calculated as a function of time. In this simulation, the paper strip was initially considered filled with air with an initial water saturation of 0.01. The Brooks and Corey model for capillary pressure and relative permeabilities was used for the time-dependent simulation.41 No water flow was allowed at the side boundaries of the paper strip. The boundary conditions for the bottom and top boundaries for Darcy's law were the atmospheric pressure for water phase at the bottom, and the hydrostatic atmospheric pressure minus the capillary pressure at the top. For the phase transport, no flux was assumed for the air phase at the bottom boundary. At the top boundary, a mass flux for the air phase was defined, resulting from the pressure gradient given in the Darcy's model.
This numerical calculation employs the multiphase flow in porous media, which couples the Darcy's law and Phase Transport in Porous Media interfaces. The effect of evaporation was not considered, as explained below in the Experimental setup subsection. The Phase Transport in Porous Media interface follows separate equations for the volume fraction si of the wetting or nonwetting fluid i:
 | (1) |
 | (2) |
 | (3) |
 | (4) |
 | (5) |
| RC = Rc0(1 − α·t) | (6) |
| εp = εp0(1 − α·t)2 | (7) |
| κ ∝ εpR2c = κ0(1 − α·t)4 | (8) |
| Parameter | Value | |
|---|---|---|
| Purified water | 1 M NaCl aqueous solution | |
| a Measured at 21 °C. | ||
| Surface tension (γ) | 0.0723 N m−1 | 0.069 N m−1 (ref. 44) |
| Viscosity (μ) | 10−3 Pa s | 1.09 10−3 Pa s45 |
| Density (ρ) | 1000 kg m−3 | 927 kg m−3a |
| Pore size reduction coeff. (α) | 10−3 s−1 | |
| Pore distribution index (λp) | 2 | |
| Initial pore radius (RC0) | 5.5 μm | |
| Initial porosity (εp0) | 0.66 (ref. 46) | |
| Initial permeability (κ0) | 4.4 10−13 m2 | |
| Air density | 1 kg m−3 | |
| Air viscosity | 1.76 × 10⁻⁵ Pa s | |
To demonstrate the impact of including on the flow dynamics the pore size reduction resulting from paper swelling, Fig. S3† shows the absorbed water mass for a range of α values from 0 to 2 × 10⁻³ s−1. As expected, a significant variation can be observed in the wicking dynamics with this coefficient, even at low intervals such as 20 s. As we demonstrate later, our best fitting with experimental data is given for α = 10−3 s−1. This value is consistent with a similar coefficient of α = 0.954 × 10⁻³ s–1 reported in a previous study.11
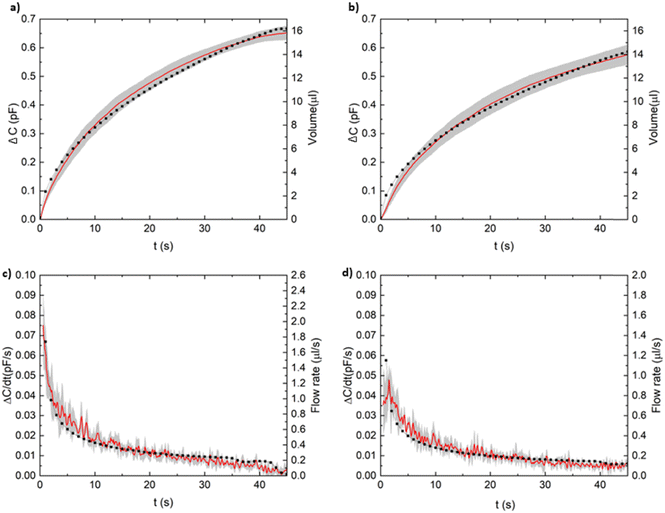
Following the numerical simulation, a conclusive relationship between the experimental capacitive transients and the flow dynamics was established. As a result, the numerically calculated volume/mass intake and flow rate will be derived as a function of time from the experimental capacitance transient during the wicking process, as detailed in the Results section. The only free parameter is the initial paper permeability, κ0, with the value presented in Table 2 being compatible and intermediate with those reported by the capillary-model (κ0 = 2.5 × 10⁻¹² m2)43 and the manufacturer (κ0 = 9.8 × 10⁻¹⁴ m2), and the value referred in recent studies.47 Numerous empirical and theoretical models have reported varying values for this parameter.11,48 However, a comprehensive discussion regarding this issue is outside the scope of this work.
Another crucial issue that needs to be considered is the impact of the inaccuracies in the values of the properties presented in Tables 1 and 2 on the calculation of the flow parameters (intake volume and flow rate). To examine the relative sensitivities of the flow monitoring parameters as a function of these properties, we conducted numerical calculations as described in the ESI† and outlined in Fig. S4. By introducing separate relative variations of approximately ±10% for the initial porosity (εp0), wet paper thickness (thw), and initial permeability (κ0), we determined the corresponding variations in volume and flow rate over time. Through a comparison of the three curves associated with each property, it can be concluded that these relative variations are also reflected in the flow parameters for initial porosity and paper thickness. Therefore, relative sensitivities of 1 were obtained for εp0 and thw. On the other hand, the flow parameters exhibited a relatively low sensitivity to variations in the initial permeability, with a sensitivity of 0.4 for volume variation and 0.11 for flow rate variation. This calculation demonstrates that our procedure exhibits greater robustness against inaccuracies in the only free parameter considered in our simulations (i.e., the initial permeability) compared to the other studied properties.
Experimental setups
The measurements were conducted in our laboratory under controlled environmental conditions of 21 ± 1 °C temperature and 30 ± 10% relative humidity. An estimation of the evaporation effect on the liquid wicking dynamics was calculated using these ambient conditions along with the flow parameters presented in Table 2 according to a previously reported model.24 We obtained a correction of the wicking duration below 1% and 2% for time intervals of 40 and 90 s, respectively. As a result, the influence of liquid evaporation on our experiments can be neglected for wicking times below 60 s, and this effect was not considered in the numerical simulations.Firstly, we measured the relative permittivity of dry, εr(dry), and wet samples, εr(wet), Whatman G1 paper samples. To perform this measurements, six circular-shaped paper samples with 6 cm diameter (three dry and three wet) were laser-cut and inserted between the type A electrodes of the 16451B test fixture, which was connected to the 4294A impedance analyzer. Our results showed εr(dry) = 1.75 ± 0.15, which agrees with a recent experimental finding of 1.9 measured by microwave reflection.40 Additionally, we determined εr(wet) = 18 ± 2 for wet paper, and this value was used in the numerical calculation of the capacitance (see Table 1). The uncertainty in both cases was calculated as the standard deviation of the experimental dataset. Two preliminary validation experiments were conducted:
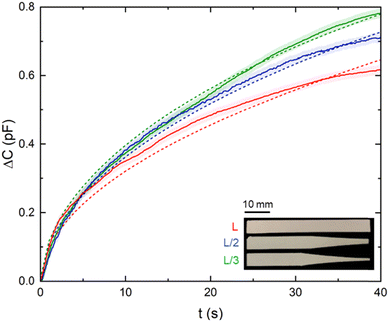
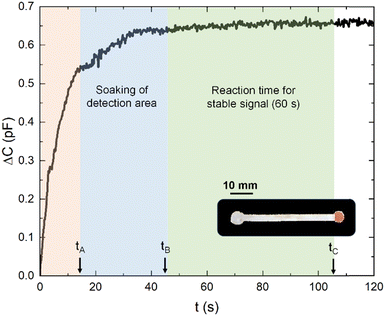
Next, a series of experimental tests were planned to evaluate the performance of the flow monitoring platform in various scenarios, including a reproducibility test, control flow with different paper strip geometries, flow retention with chemical valves, and an application of flow monitoring for accurate analytical determination.
Results and discussion
Experimental validation
Moreover, the temperature sensor integrated into the capacitive detector was utilized to characterize the linear temperature coefficient, αT, within the temperature range of 15 to 35 °C. An average value of αT = 0.6 fF K−1 was obtained. This low thermal drift ensures the reliability of capacitance data under typical testing conditions.
V2. Validation of the numerical capacitance
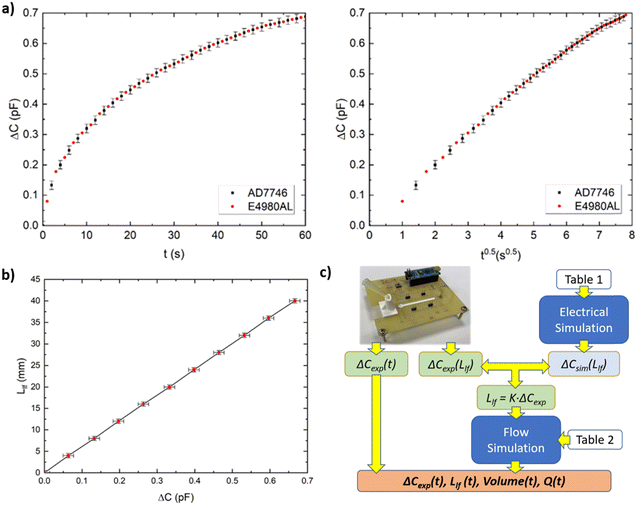
Fig. 4b compares the experimental and simulated capacitances, showing an excellent agreement with no free parameter in the numerical simulation (see Table 2). With this comparison, we consider that our capacitive platform can provide reliable data, and no further video recordings will be required in subsequent experiments. Moreover, a linear trend was obtained with the length of the liquid front, validating the step approximation for the liquid front as a suitable assumption. This linear fitting allows the determination of Llf from the capacitive measurements through a simple proportionality constant. This fact will provide the link to calculate the absorbed mass/volume and flow rate, Q(t), in the paper strip from the measurements of the proposed platform. The flow chart in Fig. 4c details the procedure, which involves the following steps:1. Experimental ΔCexp(t) and ΔCexp(Llf) are registered by our capacitive platform. The latter is performed only once for validation purposes.
2. The numerical calculation of capacitance increment with Llf is performed, ΔCsim(Llf), and it is fitted with ΔCexp(Llf). The simulation includes the platform geometry and electrical parameters, which are checked with this fitting.
3. Using the mentioned linear relationship between the capacitance increment and the length of the liquid flow, Llf = KΔCexp, (where K is a proportionality constant), this capacitance is transformed into the experimental length of the liquid front as a function of time, Llf(t).
4. This magnitude is compared with the COMSOL calculation of the flow dynamics, where magnitudes such as length of liquid front, Llf(t), absorbed mass/volume, and flow rate, Q(t), are numerically calculated.
5. From the fitting between the experimental and numerical lengths of the liquid fronts, the volume and flow rate are also obtained as a function of time, displaying such flow parameters as results on the smartphone. As mentioned above, only the permeability value is a fitting parameter in this numerical calculation. The rest of the geometry, electrical, and flow parameters were measured or provided by manufacturers and previous literature.
Monitoring system performance
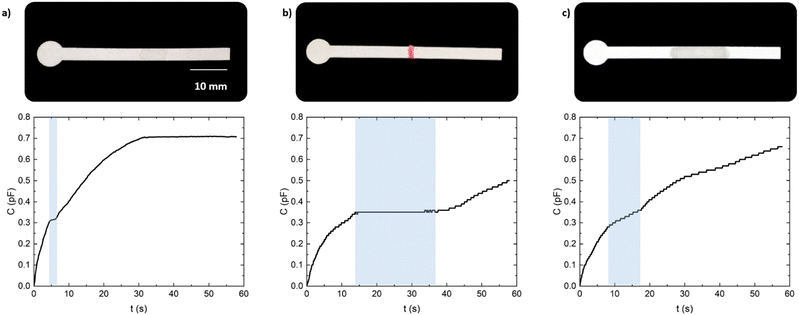
Finally, we investigated the use of a sucrose solution as a valve to slow-down the flow rate in our microfluidic platform. In order to construct an efficient barrier, three layers of 4 μl of saturated sucrose in purified water were deposited, allowing each layer to dry for 20 minutes before depositing the next, and allowing a complete day for the last deposition to dry. A decrease in the flow rate of the liquid between 9 to 17 seconds can be observed in Fig. 7c. Therefore, our capacitive measurement system for paper-strips has successfully demonstrated to accurately monitor both the forward movement and flow rate of liquid solutions, providing information on the position of the liquid front of various reagents that may be utilized in more complex chemical reactions. Furthermore, it would be feasible to monitor the time required for a solution to cross over a previously placed reagent, to ensure the complete reaction before measuring the target information.5
Discussion
We have presented a capacitive sensing platform for flow monitoring in capillary-driven microfluidic devices, specifically demonstrated for μPADs. This proposed system is characterised for its compactness and reusability, utilizing off-the-shelf electronics and fabricated on a printed circuit board. In contrast to alternative solutions, no external or bulky equipment or sensors are required. Furthermore, by incorporating commercially available batteries, the system can operate independently of a computer connection. Configuration of the system and retrieval of data are wirelessly performed using a smartphone, enabling real-time and on-site measurement of liquid flow in paper strips. The smartphone application facilitates system operation by non-trained users through a user-friendly and intuitive interface that guides users through the microfluidic tests.To acquire comprehensive information about the flow process, the capacitive measurements need to be initially combined with numerical simulation, including the physical and chemical parameters that characterize the liquid and the paper strip. However, once the numerical constants establishing the relationship between capacitance and flow parameters (intake liquid volume and flow rate) are determined, the platform can be readily utilized for subsequent tests without the need for further simulations, as long as the liquid and paper strip geometry remain unchanged.
Integrated electrodes for detection or liquid manipulation have already been employed in microfluidic devices for electrokinetic flow, electrowetting, or conductivity monitoring,50 exhibiting excellent performance for local actuation or sensing. Moreover, within our developed versatile flow monitoring platform, the paper substrate could be substituted with fabric, as the capacitive sensing transduction principle will respond to changes in the dielectric constant of a wet fabric. Additionally, by adding more digital capacitance detector chips, the system can be scaled, enabling flow monitoring not only in basic paper strips but also in different paper-based patterns with multiple liquid paths, thereby expanding the capabilities of the system. Therefore, drawing inspiration from our previous expertise in planar printed capacitive sensors and the system presented by Temiz et al.,26 our work introduces several remarkable innovations: i) incorporation of a high-resolution digital capacitive detector with a built-in temperature sensor, ii) application to paper strips, iii) validation of measurements and determination of flow parameters through a physical-based numerical simulator, and iv) easy scalability for multiple paper paths and applicability to fabric substrates.
Conclusions
This work presents a wireless and portable electronic platform designed to monitor the flow and flow rate of liquids in paper-based microfluidic devices driven by capillary force. The full hardware and software tools have been described, and operational specifications have been extracted. Relevant features of this measurement system include its affordability, reusability, and its potential for extension to textile substrates as well. Furthermore, the experimental setup demonstrated notable repeatability and good performance for different paper geometries and chemical valves. Not only qualitative but also quantitative flow and flow rate measurements can be obtained together with numerical simulations of the electrical and flow dynamic phenomena. To achieve this, knowledge of the dielectric constant of the wet paper and flow parameters of the paper and liquid is required, which is the main limitation of this study. Nonetheless, we consider that this information, which is easily accessible, is required to obtain such quantitative information. This fact provides the possibility to deepen in the study of the flow dynamics on paper, an issue still opened to further study and modelling. On the other hand, smartphone have been demonstrated once again as essential and versatile widespread devices capable of visualizing and sharing results, serving as the user-interface for the developed platform.Author contributions
Conceptualization: A. J. P., N. L. R., I. R. G., P. E., formal Analysis: P. E., L. F. C. V., M. A. C., A. J. P., N. L. R., funding acquisition: A. J. P., L. F. C. V., methodology: all authors, software: I. R. G., P. E., N. L. R., validation: all authors, writing – original draft and writing – review & editing: I. R. G., P. E., L. F. C. V., A. J. P., N. L. R. All authors have read and agreed to the published version of the manuscript.Conflicts of interest
There are no conflicts to declare.Acknowledgements
This work was funded by Spanish MCIN/SRA State Research Agency/10.13039/501100011033/ (Projects PID2019-103938RB-I00, ECQ2018-004937-P and grant IJC2020-043307-I) and Junta de Andalucía, Spain, (Projects B-FQM-243-UGR18, P18-RT-2961). The projects and the grant were partially supported by European Regional Development Funds (ERDF) and by European Union NextGenerationEU/PRTR.References
- R. Lucas, Kolloid-Z., 1918, 23, 15–22 CrossRef CAS.
- E. W. Washburn, Phys. Rev., 1921, 17, 273–283 CrossRef.
- A. Böhm, F. Carstens, C. Trieb, S. Schabel and M. Biesalski, Microfluid. Nanofluid., 2014, 16, 789–799 CrossRef.
- N. Walji and B. D. MacDonald, Micromachines, 2016, 7, 73 CrossRef PubMed.
- E. Fu and C. Downs, Lab Chip, 2017, 17, 614–628 RSC.
- Y. Yang, E. Noviana, M. P. Nguyen, B. J. Geiss, D. S. Dandy and C. S. Henry, Anal. Chem., 2017, 89, 71–91 CrossRef CAS PubMed.
- H. Darcy, The Public Fountains of the City of Dijon, Paris, 1856, vol. 647 Search PubMed.
- M. Hamdaoui, F. Fayala and S. Ben Nasrallah, J. Appl. Polym. Sci., 2007, 104, 3050–3056 CrossRef CAS.
- N. Fries, K. Odic, M. Conrath and M. Dreyer, J. Colloid Interface Sci., 2008, 321, 118–129 CrossRef CAS PubMed.
- D. Schuchardt and J. Berg, Wood Fiber Sci., 1991, 23, 342–357 CAS.
- R. Masoodi and K. M. Pillai, AIChE J., 2010, 56, 2257–2267 CAS.
- S. Chang and W. Kim, J. Fluid Mech., 2020, 892, A39 CrossRef CAS.
- L. A. Richards, Physics, 1931, 1, 318 CrossRef.
- R. Masoodi, H. Tan and K. M. Pillai, AIChE J., 2011, 57, 1132–1143 CrossRef CAS.
- D. Rath, N. Sathishkumar and B. J. Toley, Langmuir, 2018, 34, 8758–8766 CrossRef CAS PubMed.
- S. Patari and P. S. Mahapatra, ACS Omega, 2020, 5, 22931–22939 CrossRef CAS PubMed.
- S. Modha, C. Castro and H. Tsutsui, Biosens. Bioelectron., 2021, 178, 113026 CrossRef CAS.
- L. Gervais, N. De Rooij and E. Delamarche, Adv. Mater., 2011, 23, H151 CrossRef CAS PubMed.
- G. G. Morbioli, T. Mazzu-Nascimento, A. M. Stockton and E. Carrilho, Anal. Chim. Acta, 2017, 970, 1–22 CrossRef CAS.
- H. Lim, A. T. Jafry and J. Lee, Molecules, 2019, 24, 1–32 Search PubMed.
- E. Noviana, T. Ozer, C. S. Carrell, J. S. Link, C. McMahon, I. Jang and C. S. Henry, Chem. Rev., 2021, 121, 11835–11885 CrossRef CAS.
- Anushka, A. Bandopadhyay and P. K. Das, Eur. Phys. J.: Spec. Top., 2022, 123, 1–35 Search PubMed.
- R. J. Roberts, T. J. Senden, M. A. Knackstedt and M. B. Lyne, J. Pulp Pap. Sci., 2003, 29, 123–131 Search PubMed.
- C. K. Camplisson, K. M. Schilling, W. L. Pedrotti, H. A. Stone and A. W. Martinez, Lab Chip, 2015, 15, 4461–4466 RSC.
- M. N. Islam, J. W. Yost and Z. R. Gagnon, Analyst, 2022, 147, 587–596 RSC.
- Y. Temiz and E. Delamarche, Sci. Rep., 2018, 8, 1–11 CAS.
- C. Delaney, P. McCluskey, S. Coleman, J. Whyte, N. Kent and D. Diamond, Lab Chip, 2017, 17, 2013–2021 RSC.
- N. Noeth, S. S. Keller and A. Boisen, Sensors, 2014, 14, 229–244 CrossRef PubMed.
- A. Alfadhel, B. Li, A. Zaher, O. Yassine and J. Kosel, Lab Chip, 2014, 14, 4362–4369 RSC.
- L. Zhang, X. Yu, S. You, H. Liu, C. Zhang, B. Cai, L. Xiao, W. Liu, S. Guo and X. Zhao, Appl. Phys. Lett., 2015, 107, 242901 CrossRef.
- Z. Zhang, J. Pan, Y. Tang, Y. Xu, L. Zhang, Y. Gong and L. Tong, Lab Chip, 2020, 20, 2572–2579 RSC.
- M. H. Zarifi, H. Sadabadi, S. H. Hejazi, M. Daneshmand and A. Sanati-Nezhad, Sci. Rep., 2018, 8, 1–10 CAS.
- E. Skotadis, E. Aslanidis, G. Kokkoris, E. A. Vargkas Kousoulas, A. Tserepi and D. Tsoukalas, Sens. Actuators, A, 2022, 344, 113765 CrossRef CAS.
- J. Collins and A. P. Lee, Lab Chip, 2004, 4, 7–10 RSC.
- N. Arjmandi, C. Liu, W. Van Roy, L. Lagae and G. Borghs, Microfluid. Nanofluid., 2012, 12, 17–23 CrossRef CAS.
- J. Wu and J. Ye, Lab Chip, 2005, 5, 1344–1347 RSC.
- C. Bathany, J. R. Han, K. Abi-Samra, S. Takayama and Y. K. Cho, Biosens. Bioelectron., 2015, 70, 115–121 CrossRef CAS PubMed.
- M. N. Islam, S. M. Doria, X. Fu and Z. R. Gagnon, Sensors, 2022, 22, 1489 CrossRef.
- E. Elizalde, R. Urteaga and C. L. A. Berli, Lab Chip, 2015, 15, 2173–2180 RSC.
- A. R. Eldamak and E. C. Fear, Sensors, 2018, 18, 4088 CrossRef PubMed.
- R. H. Brooks and A. T. Corey, J. Irrig. Drain. Div., 1966, 92, 61–90 CrossRef.
- R. Masoodi and K. M. Pillai, J. Porous Media, 2012, 15, 775–783 CrossRef.
- F. L. Dullien, Fluid Transport and Pore Structure, New York, 1992 Search PubMed.
- B. R. Bzdek, L. Collard, J. E. Sprittles, A. J. Hudson and J. P. Reid, J. Chem. Phys., 2016, 145, 054502 CrossRef.
- J. Kestin, I. R. Shankland and R. Paul, Int. J. Thermophys., 1981, 2, 301–314 CrossRef CAS.
- V. P. Mai, C. H. Ku and R. J. Yang, Microfluid. Nanofluid., 2019, 23, 1–10 CrossRef CAS.
- N. Koursari, O. Arjmandi-Tash, A. Trybala and V. M. Starov, Microgravity Sci. Technol., 2019, 31, 589–601 CrossRef.
- R. Liu, Y. Jiang, B. Li and L. Yu, Microfluid. Nanofluid., 2016, 20, 1–13 CrossRef CAS.
- M. J. Arroyo, I. Orbe-Payá, M. Ortega, J. Vilar, D. Gallego, G. J. Mohr, L. F. Capitán-Vallvey and M. M. Erenas, Sens. Actuators, B, 2022, 359, 131549 CrossRef CAS.
- N. Fukuna, T. Sonsa-ard, N. Chantipmanee, P. C. Hauser, P. Wilairant and D. Nacapricha, Sens. Actuators, B, 2020, 339, 129838 CrossRef.
Footnote |
| † Electronic supplementary information (ESI) available. See DOI: https://doi.org/10.1039/d3lc00368j |
| This journal is © The Royal Society of Chemistry 2023 |

