
 Open Access Article
 This Open Access Article is licensed under a
 Creative Commons Attribution 3.0 Unported Licence
Microfluidic in-line dynamic light scattering with a commercial fibre optic system†
Luis M. G.
Torquato
a,
Nelson
Hélaine
b,
Yufan
Cui
a,
Roisin
O'Connell
a,
Jérémie
Gummel
c,
Eric S. J.
Robles
 d,
David
Jacob
e and
João T.
Cabral
*a
d,
David
Jacob
e and
João T.
Cabral
*a
aDepartment of Chemical Engineering, Imperial College London, London SW7 2AZ, UK. E-mail: j.cabral@imperial.ac.uk
bCNRS UMR 5623, Laboratoire des IMRCP, Universite Paul Sabatier, Toulouse, France
cProcter & Gamble, Brussels Innovation Centre, Temselaan 100, 1853 Strombeek-Bever, Belgium
dProcter & Gamble, Newcastle Innovation Centre, Newcastle upon Tyne NE12 9TS, UK
eCordouan Technologies, 11 Avenue Canteranne, 33600 Pessac, France
First published on 18th April 2023
Abstract
We report the coupling of dynamic light scattering (DLS) in microfluidics, using a contact-free fibre-optic system, enabling the under-flow characterisation of a range of solutions, dispersions, and structured fluids. The system is evaluated and validated with model systems, specifically micellar and (dilute) polymer solutions, and colloidal dispersions of different radii (∼1–100 nm). A systematic method of flow-DLS analysis is examined as a function of flow velocity (0–16 cm s−1), and considerations of the relative contribution of ‘transit’ and ‘Brownian’ terms enable the identification of regions where (i) a quiescent approximation suffices, (ii) the flow-DLS framework holds, as well as (iii) where deviations are found, until eventually (iv) the convection dominates. We investigate practically relevant, robust setups, namely that of a capillary connected to microdevice, as well as direct measurement on a glass microdevice, examining the role of capillary dimensions and challenges of optical alignment. We conclude with a demonstration of a continuous flow measurement of a binary surfactant/salt solution, whose micellar dimensions vary with composition, characterised with hundreds of data points (every ∼5 s) and adequate statistics, within a few minutes.
1 Introduction
Dynamic light scattering (DLS) is a ubiquitous experimental technique used to characterise the hydrodynamic size of particles and relaxation processes in simple and complex systems.1–3 Given its extensive use in biology, physical-chemistry and soft matter science, a number of authors have considered both the theoretical and experimental feasibility and implementation of DLS under flow for particle size measurements,4–11 flow velocity and shear determination,12–17 and recently, also coupling with microfluidics.16,18–20Various technical challenges in flow-DLS have been identified, pertaining to optical alignment of the scattering and flow planes,11,16 and limitations on the flow velocity relative to particle diffusion,4,5,12 respectively giving rise to shear flow and transit contributions to the scattering signal, which require complex data analysis, by contrast to that of conventional DLS. In this work, we consider the design requirements for microfluidic-DLS with a view to (i) robustly integrate fibre-optic DLS systems, (ii) minimise and account for shear and flow contributions, and (iii) establish a facile data analysis framework, in order to facilitate the in-line screening and characterisation of complex mixtures under flow.
The paper is organised as follows: we first introduce the fundamentals of quiescent and under-flow DLS theory, focusing on the design considerations to enable robust measurements of the diffusion coefficients and hydrodynamic sizes for a wide range of flow velocities and systems; we then validate our system under quiescent conditions using a range of model systems (micelle and polymer solutions, and colloidal suspensions), and examine the analysis of experimental flow-DLS data up to ∼16 cm s−1 flow velocity, and establish appropriate strategies for analysis of data across the particle size-velocity space. We conclude with a demonstration of the use of the flow-DLS system in the characterisation of a micellar surfactant/salt solution of continually varying composition, under continuous flow, demonstrating the coupling of this instrument with microdevices, or integrated within lab-on-a-chip systems for in-line particle size monitoring.
2 Dynamic light scattering
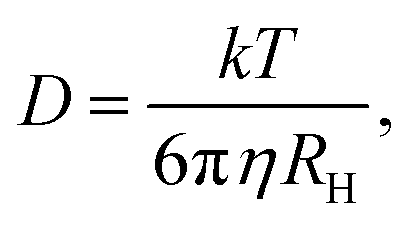
In a DLS experiment, the scattering intensity fluctuations are analysed to infer the diffusion coefficient D and hydrodynamic radius RH of particles in solution undergoing Brownian motion. The normalised intensity correlation function can be expressed as an integral over the product of intensities at time t and delayed time t + τ: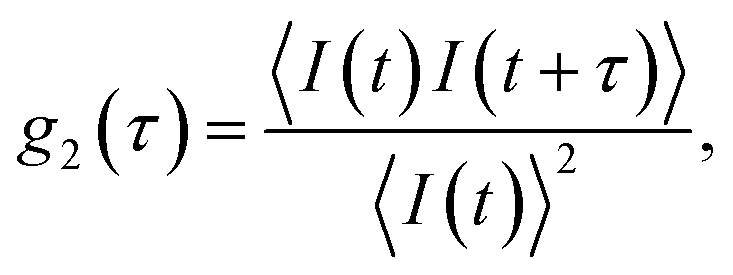 | (1) |
| g2(τ) = B + β|g1(τ)|2, | (2) |
| g1(τ) = e−Dq2τ, | (3) |
 | (4) |
2.1 Challenges to DLS under flow
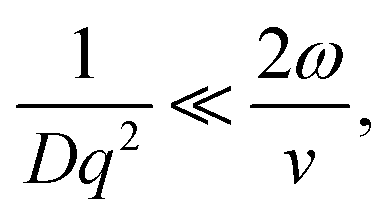
DLS measurements aimed at extracting the size of particles under flow are difficult to perform and interpret due to additional shear and flow contributions to the intensity fluctuations and autocorrelation functions. Pioneering work into the effect of shear by Fuller, Leal and others12–15 demonstrated that the scattering and flow vectors must be near-perfectly orthogonal to enable robust and accurate extraction of diffusion coefficients, as opposed to effectively quantifying the shear rate within the scattering volume. Rusu et al.11 compared the timescales of the Brownian (τB = 1/Dq2) and shear (τ![[small gamma, Greek, dot above]](https://www.rsc.org/images/entities/i_char_e0a2.gif) = 1/Lqv) decorrelations, proposing that, in order to extract diffusive information:
= 1/Lqv) decorrelations, proposing that, in order to extract diffusive information: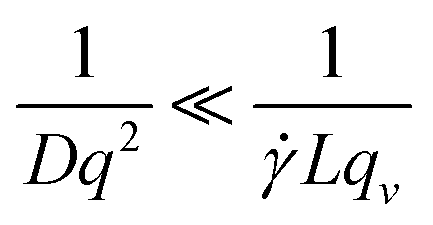 | (5) |
is the shear rate, qv is the projection of the scattering vector along the flow direction, and L is the characteristic length of the scattering volume. Destremaut et al.16 expressed qv in terms of the azimuthal angle, ϕ, between the perpendicular and the scattering vector to emphasise the requirement of orthogonality: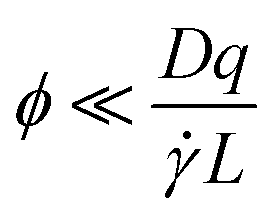 | (6) |
In the work of Rusu et al.,11 the measurement of 1.1 μm polystyrene spheres would require ϕ ∼ 0.00001° and the authors used instead a double homodyne spectrum measurement of small scatters mixed within the solution, in order to infer the diffusion coefficient of the larger particles. Using smaller particles (∼200 nm) under channel flow, and a different scattering geometry, Destremaut et al.16 provided an estimate of ϕ < 0.6° for optical alignment.
In the limit of uniform translational motion (plug flow) where ∼ 0 s−1, thereby alleviating the restriction on ϕ, Taylor and coworkers4,5 showed that the remaining contribution to the autocorrelation function is due to the transit of particles past the Gaussian beam, with a timescale of τT = 2ω/v. Under these flow conditions, in order to obtain diffusive parameters by DLS:
 | (7) |
2.2 Theoretical framework for transit-DLS
The interpretation of DLS data under linear flow takes roots in laser Doppler flowmetry,26 employing heterodyne detection (detecting mixed scattered and unscattered light). Chowdhury et al.4 approximated the total displacement of particles as a sum of Brownian (B) motion and a linear flow or transit (T) component, introducing a homodyne intensity auto-correlation function for particles under linear flow: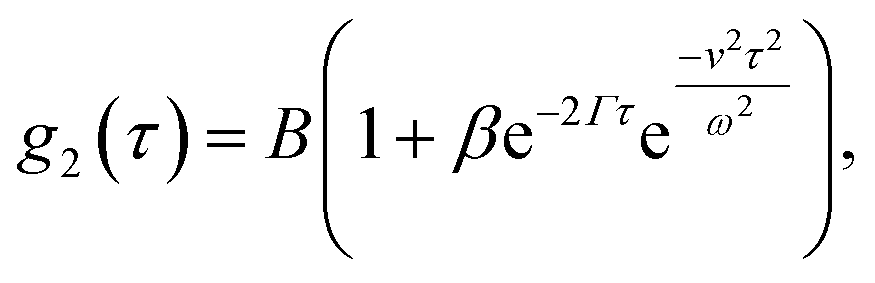 | (8) |
 . This separation of terms is helpful to establish approximate boundaries for DLS analysis4 under microfluidic flow. This framework has been validated and employed in describing several systems under flow, including silica27 and polystyrene nanoparticles,7,8 nanoemulsions,8 and unilamellar vesicles.8 Subsequent theoretical developments have accounted for polydispersity,6 and shear,16 measurement of the shear rate itself,12–17 and analysis of flow data along the incident beam direction in a flow cuvette.9Eqn (8) can be rearranged4,5,7,8 to define a ‘modified correlation function’:
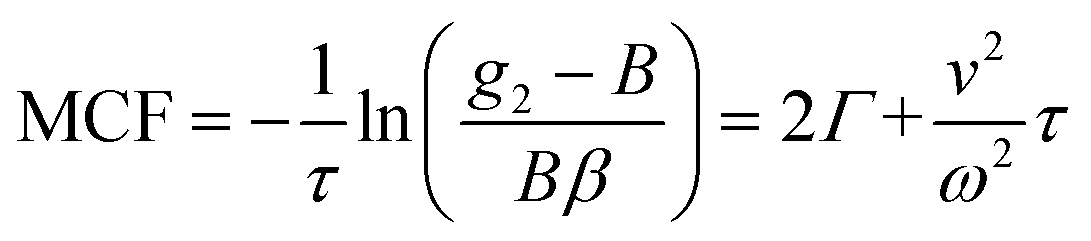 | (9) |
2.3 Microfluidic-DLS
The development of microfluidic flow-DLS is desirable due to the unique attributes of microfluidics, including the precision fluid handling of minute sample volumes, rapid mixing of components, fast heat and mass transfer processes, and screening of large parameter spaces,28 and has therefore been explored by a few authors.16,18–20 Chastek et al.18 developed multiple microfluidic systems with embedded fiber optic probes, and monitored block copolymer micelle synthesis under continuous flow.19 Destremaut et al.16 reported a fibre-optic microfluidic system and examined the affect of Poiseuille flow (and the associated different Doppler shifts arising from the flow velocity profile). Further, they demonstrate the use of the system in the continuous monitoring of the viscosity of a two-fluid mixture, and the assembly of oppositely charged nanoparticles and block copolymers. Chen et al.20 developed a dual-angle microfluidic DLS system that, similarly to cross-correlation DLS, mitigates the effects of multiple scattering thus increasing the accessible sample concentration window. A range of instrument manufacturers have also introduced various flow-through cuvettes compatible with conventional and dual-beam setups, and employed for example in the monitoring of the synthesis of silica nanoparticles10 and coupling to field-flow fractionation for the size characterisation of liposomes.29 In our view, the current flow-DLS setup improves on previously reported commercial technologies since it employs involve a remote measurement fibre-optic unit, which can be coupled directly into microdevices (instead of a dedicated flow cuvette of a fixed geometry), with minimal dead volume and onto microsystems with custom designs and flow geometries.Building upon previous work, we seek to develop a robust, contact-free microflow-DLS system, based on a fibre-optic setup, able to extract accurate diffusion coefficients, accommodating a large range of velocity (0–20 cm s−1) and particle sizes (0–100 s nm). We seek to minimise shear effects, due to the greater complexity of the correlation function and its dependence to the velocity gradient tensor12 (and thus flow geometry13), and account for transit effects which depend instead on (‘sufficiently’ small) beam dimensions and the flow velocity of particles in the scattering volume.
3 Experimental
3.1 Samples and preparation
Sodium dodecyl sulfate (SDS, BioXtra ≥99.0%, Sigma-Aldrich 151213), sodium chloride (NaCl, AnalaR ≥99.5%, VWR Chemicals 7647145), dodecyldimethylamine oxide (DDAO, 30 wt% in water, Sigma-Aldrich 1643205), 80 nm (nominal) polystyrene latex particles (PS NP, 3.55 × 10¹² mL−1, Agar Scientific AGS130), 100 nm (nominal) PS NP (10 wt%, Sigma-Aldrich 43![[thin space (1/6-em)]](https://www.rsc.org/images/entities/char_2009.gif) 302), 200 nm (nominal) PS NP (10 wt%, Sigma-Aldrich 69057), and LUDOX AS-40 colloidal silica particles (40 wt%, Sigma-Aldrich 7631869) were used as received. Aqueous solutions were prepared with ultra-pure 18.2 kΩ cm water, and filtered through a 0.2 μm cellulose acetate membrane (Sartorius), except 200 nm PS NP solutions, where a 0.5 μm pore size was used. Polystyrene (MW = 100 kg mol−1, BDH Chemicals 29789) solutions were prepared in toluene (AnalaR ≥99.5%, VWR Chemicals 108883) and filtered (0.2 μm PTFE, Pall Corporation). All solutions were homogenised on a roller mixer and allowed to rest for 24 h.
302), 200 nm (nominal) PS NP (10 wt%, Sigma-Aldrich 69057), and LUDOX AS-40 colloidal silica particles (40 wt%, Sigma-Aldrich 7631869) were used as received. Aqueous solutions were prepared with ultra-pure 18.2 kΩ cm water, and filtered through a 0.2 μm cellulose acetate membrane (Sartorius), except 200 nm PS NP solutions, where a 0.5 μm pore size was used. Polystyrene (MW = 100 kg mol−1, BDH Chemicals 29789) solutions were prepared in toluene (AnalaR ≥99.5%, VWR Chemicals 108883) and filtered (0.2 μm PTFE, Pall Corporation). All solutions were homogenised on a roller mixer and allowed to rest for 24 h.
The average size and size distribution of the PS NP (with nominal diameters of 80, 100, and 200 nm) were measured by scanning electron microscopy (SEM). The suspensions were deposited on stubs and left to evaporate at 5 °C for 5 days before being coated in ∼10 nm of gold. These were imaged at 5 kV to prevent damage to the sample with a typical working distance of 3.5–5 mm using a Zeiss Auriga Crossbeam microscope.
3.2 Dynamic light scattering
We have employed three distinct DLS systems: a Zetasizer Nano S (Malvern PANalytical) and a VASCO KIN (Cordouan Technologies) system in two distinct configurations, a fixed geometry remote head and a fibre-optic assembly. The Zetasizer and VASCO KIN remote head were employed for validation measurements of model samples under quiescent conditions. The Zetasizer employed a He–Ne laser (λ = 633 nm) and a back-scattering geometry at 173°. Samples where filtered into disposable PMMA cuvettes (VWR 6340677), except for PS/toluene solutions (Starna 1/SOG/10), both with a 10 mm path length, and inserted into the thermalised, enclosed cuvette holder. Data were analysed using the CONTIN algorithm, and also fitted with an exponential function for direct comparison to the MCF results. The VASCO KIN remote head employed a laser diode (λ = 638 nm) and scattering angle 170°. Samples were measured directly from glass sample vials (7 mL, SAMCO T101/V3) after filtration. The path length of the laser was adjusted manually to ≈5 ± 1 mm inside the vial, and the laser power was selected to maximise the coherence factor of individual solutions. Measurements were carried out at room temperature, which was monitored throughout the measurements by Pt100 sensor, such that the viscosity used in the analysis could be adjusted accordingly. Data were analysed using the integrated cumulant and sparse Bayesian learning (SBL) fitting procedures, and also by fitting an exponential, as justified above.The same VASCO KIN (λ = 638 nm) was used to carry out quiescent and under flow measurements on capillaries and microdevices but now the source and probe assembly was mounted on a custom-built holder, in a back-scattering arrangement with a scattering angle of 130°. This scattering angle was optimised in order to yield simultaneously a large wavevector, q, and a large spatial coherence factor β, while keeping parasitic reflections (at high angles) to a minimum. The scattering angle was systematically varied while measuring correlograms for a 1% w/w DDAO micellar solution with small diameter capillaries (0.2–1 mm), and a 130° angle was thereby selected and fixed for our setup, depicted in Fig. 1a and S1.†
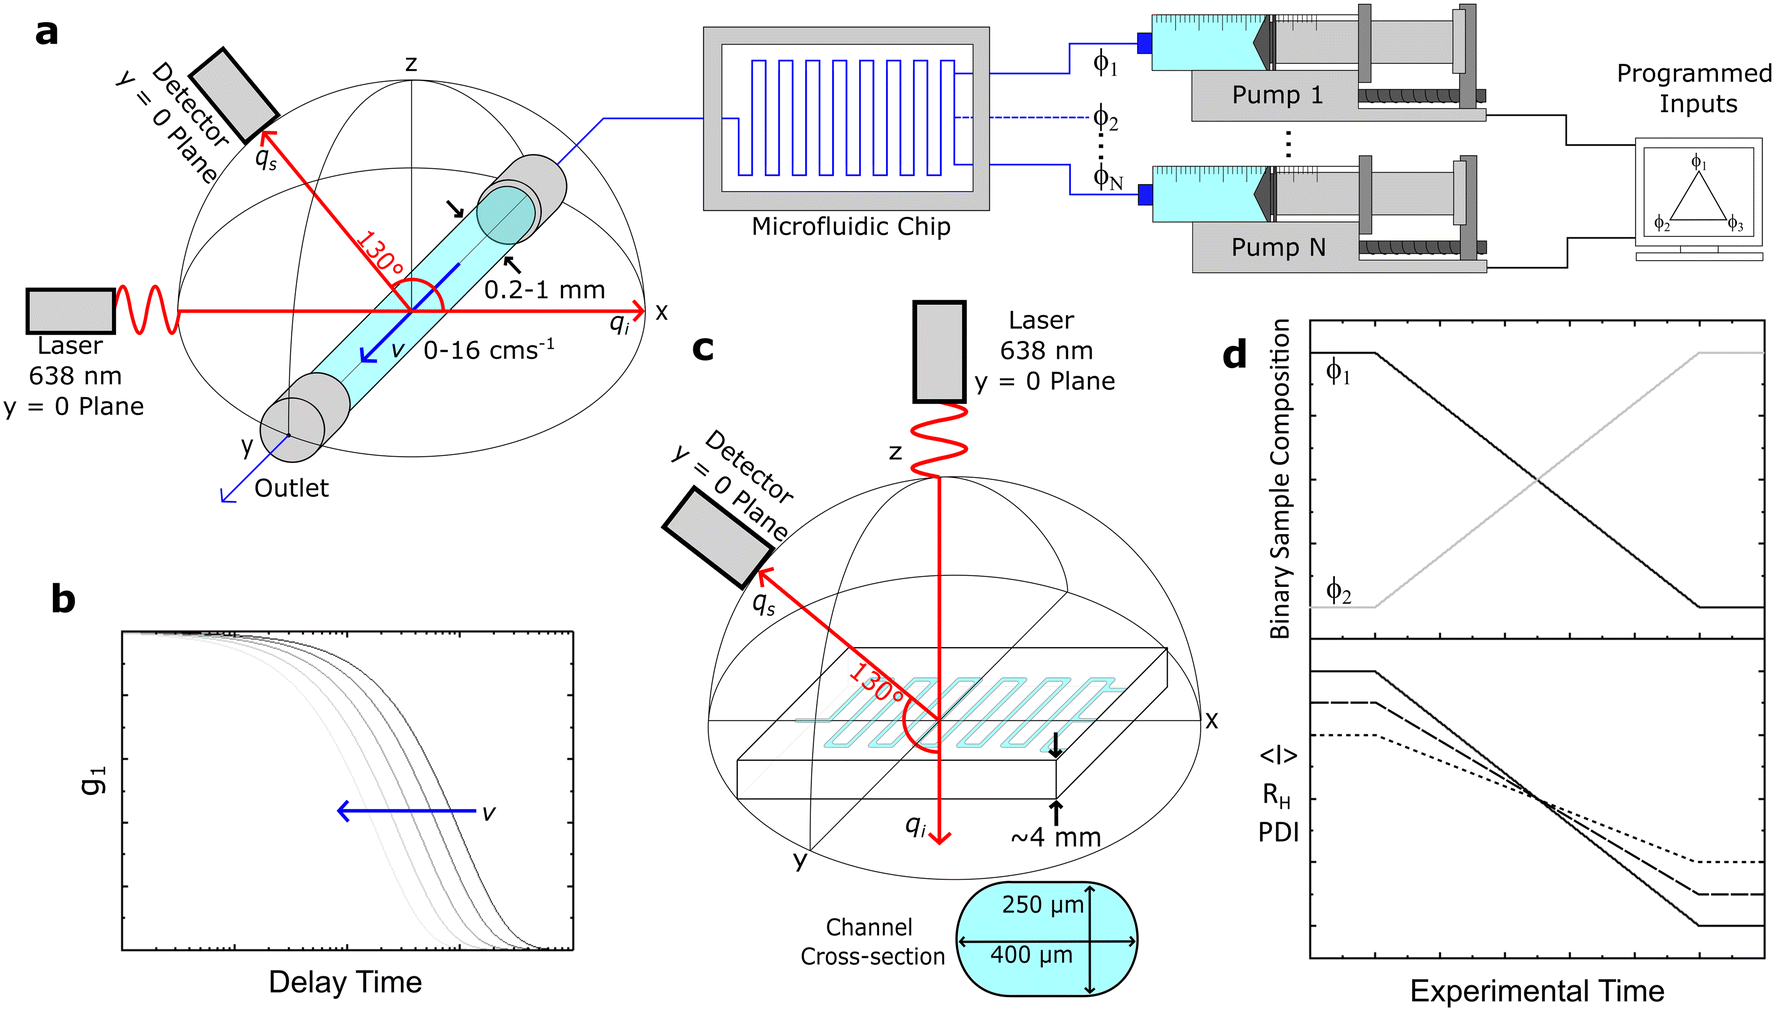 | ||
| Fig. 1 (a) Capillary fibre-optic DLS setup, comprising a laser and detector at prescribed angles, connected to the output of a microfluidic device (e.g., a mixer or reactor) controlled by a system of programmable syringe pumps. (b) Schematic of the affect of flow velocity on the profile of the autocorrelation function. (c) Experimental setup for direct optical fiber DLS measurements on a glass microfluidic device, with dimensions and channel cross-section indicated. (d) Example of a microfluidic dilution or binary mixing experiment (with input concentrations ϕ1 and ϕ2), and associated changes in average scattering intensity 〈I〉, hydrodynamic radius RH, and polydispersity index PDI. | ||
The laser and detector were first aligned onto a single (xz) plane, before the capillary position was adjusted (along xz) until the centre of the capillary and the intersection of the incident and detector beams coincided. This procedure employed an integrated ‘alignment’ laser (colinear with the probe) and the incident (source) laser, enabling the capillary xz position to be sequentially adjusted (x, then z) with ±5% uncertainty, using the refracted beams within an empty capillary, and their reference positions on the optical breadboard and laser safety barrier.
For instance, a round, glass capillary of 1 mm inner diameter thus enables a 50 μm uncertainty in the position of the scattering volume. This uncertainty can be further reduced by refining the xz capillary position while carrying out DLS measurements under Poiseuille flow, as the maximum velocity at the centre will yield the smallest apparent RH, as detailed below. The centreline of the capillary provides also a convenient measurement position, as the velocity gradient is smallest near the maximum of the axisymmetric flow profile. The capillary is positioned, along the y-direction, with respect to the laser such that the scattering volume is located at ∼5 mm from the outlet (largely exceeding the longest entrance length of ∼4.6 mm) of the (2 cm long) capillary.
The maximum azimuthal angle compatible with diffusion measurements under flow using such a setup can be estimated as follows. Taking a suspension of RH = 100 nm particles in water at 25 °C flowing at v = 4 cm s−1, considering the characteristic length of the scattering volume L ∼ 2ω = 50 μm (compatible with a measured beam full width at half high (FWHH) of ∼48.4 μm, Fig. S2†), eqn (6) gives ϕ < 16° (and ϕ < 4° at the maximum flow velocity investigated, v = 16 cm s−1). This optical-flow alignment ϕ condition, corresponding to the alignment of ![[q with combining right harpoon above (vector)]](https://www.rsc.org/images/entities/i_char_0071_20d1.gif) with the perpendicular to
with the perpendicular to ![[v with combining right harpoon above (vector)]](https://www.rsc.org/images/entities/i_char_0076_20d1.gif) , is readily achievable by the design and machining of the fiber optic and capillary holders to achieve ϕ ≈ 0 ± 1°. In our work, the fibre-optic and capillary holders were 3D printed (Ultimaker S5 Pro). Under these conditions, it appears appropriate to assume that shear contributions to the correlation functions are negligible, while accounting for the transit contributions using eqn (8).
, is readily achievable by the design and machining of the fiber optic and capillary holders to achieve ϕ ≈ 0 ± 1°. In our work, the fibre-optic and capillary holders were 3D printed (Ultimaker S5 Pro). Under these conditions, it appears appropriate to assume that shear contributions to the correlation functions are negligible, while accounting for the transit contributions using eqn (8).
3.3 Capillary and microfluidic systems and operation
Fig. 1a depicts under-flow DLS experiments, using round glass capillaries with inner diameters (ID) of 1, 0.4 and 0.2 mm (CM Scientific CV1012-B-100, CV4055-100, CV2033-B-100), cut to 2 cm length and glued to a 3D printed holder. For selected experiments, the capillary was connected to a micromixer (Dolomite 3200401) using a 4-way linear connector (Dolomite 3000024), to enable the continuous flow characterisation of mixtures of varying composition. A LabView interface was used to control the syringe pumps (Braintree Scientific BS-8000). Luer lock disposable syringes (Henke-Ject) were fitted with the aforementioned sample filters and connected to tubing (fluorinated ethylene propylene, FEP, Cole-Parmer WZ-06406-62) using a flangeless fitting (Idex, Cole-Parmer UY-02020-76) and adapter (Idex Threaded, Cole-Parmer UY-02014-22); the other end of the tubing was subsequently connected to the 3D printed threaded capillary holder with the same a flangeless fitting and an O-ring (to prevent leaks). The output tubing from the capillary is similarly connected to the holder and then to a sample ‘waste’ vial. We have explored volumetric flow rates of 0–3.77 mL min−1, corresponding to average flow velocities of 〈v〉 = 0–8 cm s−1, and maximum velocities of v = 0–16 cm s−1 at the centre of the (Poiseuille) flow profile of a 1 mm ID capillary. A schematic of the expected DLS correlograms with increasing v is shown in Fig. 1b.Direct DLS measurements were also carried out on a glass microfluidic device (3 port, 250 μL, Dolomite 3000281) as shown in Fig. 1c, mounted on a 3D printed holder and a single channel was aligned with the optics. Finally, we demonstrated an application of our setup (Fig. 1a) by carrying out a composition scan of a two-component (surfactant/salt/water) micellar solution, over time, and the corresponding experimental observables average intensity 〈I〉, RH and polydispersity index, PDI, illustrated in Fig. 1d.
4 Results
4.1 Quiescent DLS setup validation
A set of model samples was employed to validate our capillary DLS setup, against two established setups, namely the Zetasizer (‘Sizer’) and VASCO KIN ‘Remote Head’. We selected a 3% w/w DDAO aqueous micellar solution, a 0.4% v/v PS (100k) in toluene dilute polymer solution, a 0.4% w/w silica colloidal (Ludox AS-40) aqueous dispersion, and a 0.01% v/v PS nanoparticle aqueous dispersion, covering a large size range (from a few to ∼100 nm), refractive index contrast, and aqueous and organic solvents. Experimental data collected in a 1 mm ID capillary are summarised in Fig. 2 (data acquired with other setups is discussed below and in ESI†). Representative scattered light intensity profiles, acquired over 20 s in the capillary setup, are shown in Fig. 2a–d, and the corresponding (normalised) correlograms obtained with the three DLS setups are shown in Fig. 2e–h. The solid lines in each panel are data fits to| g12 = e2Dq2τ, | (10) |
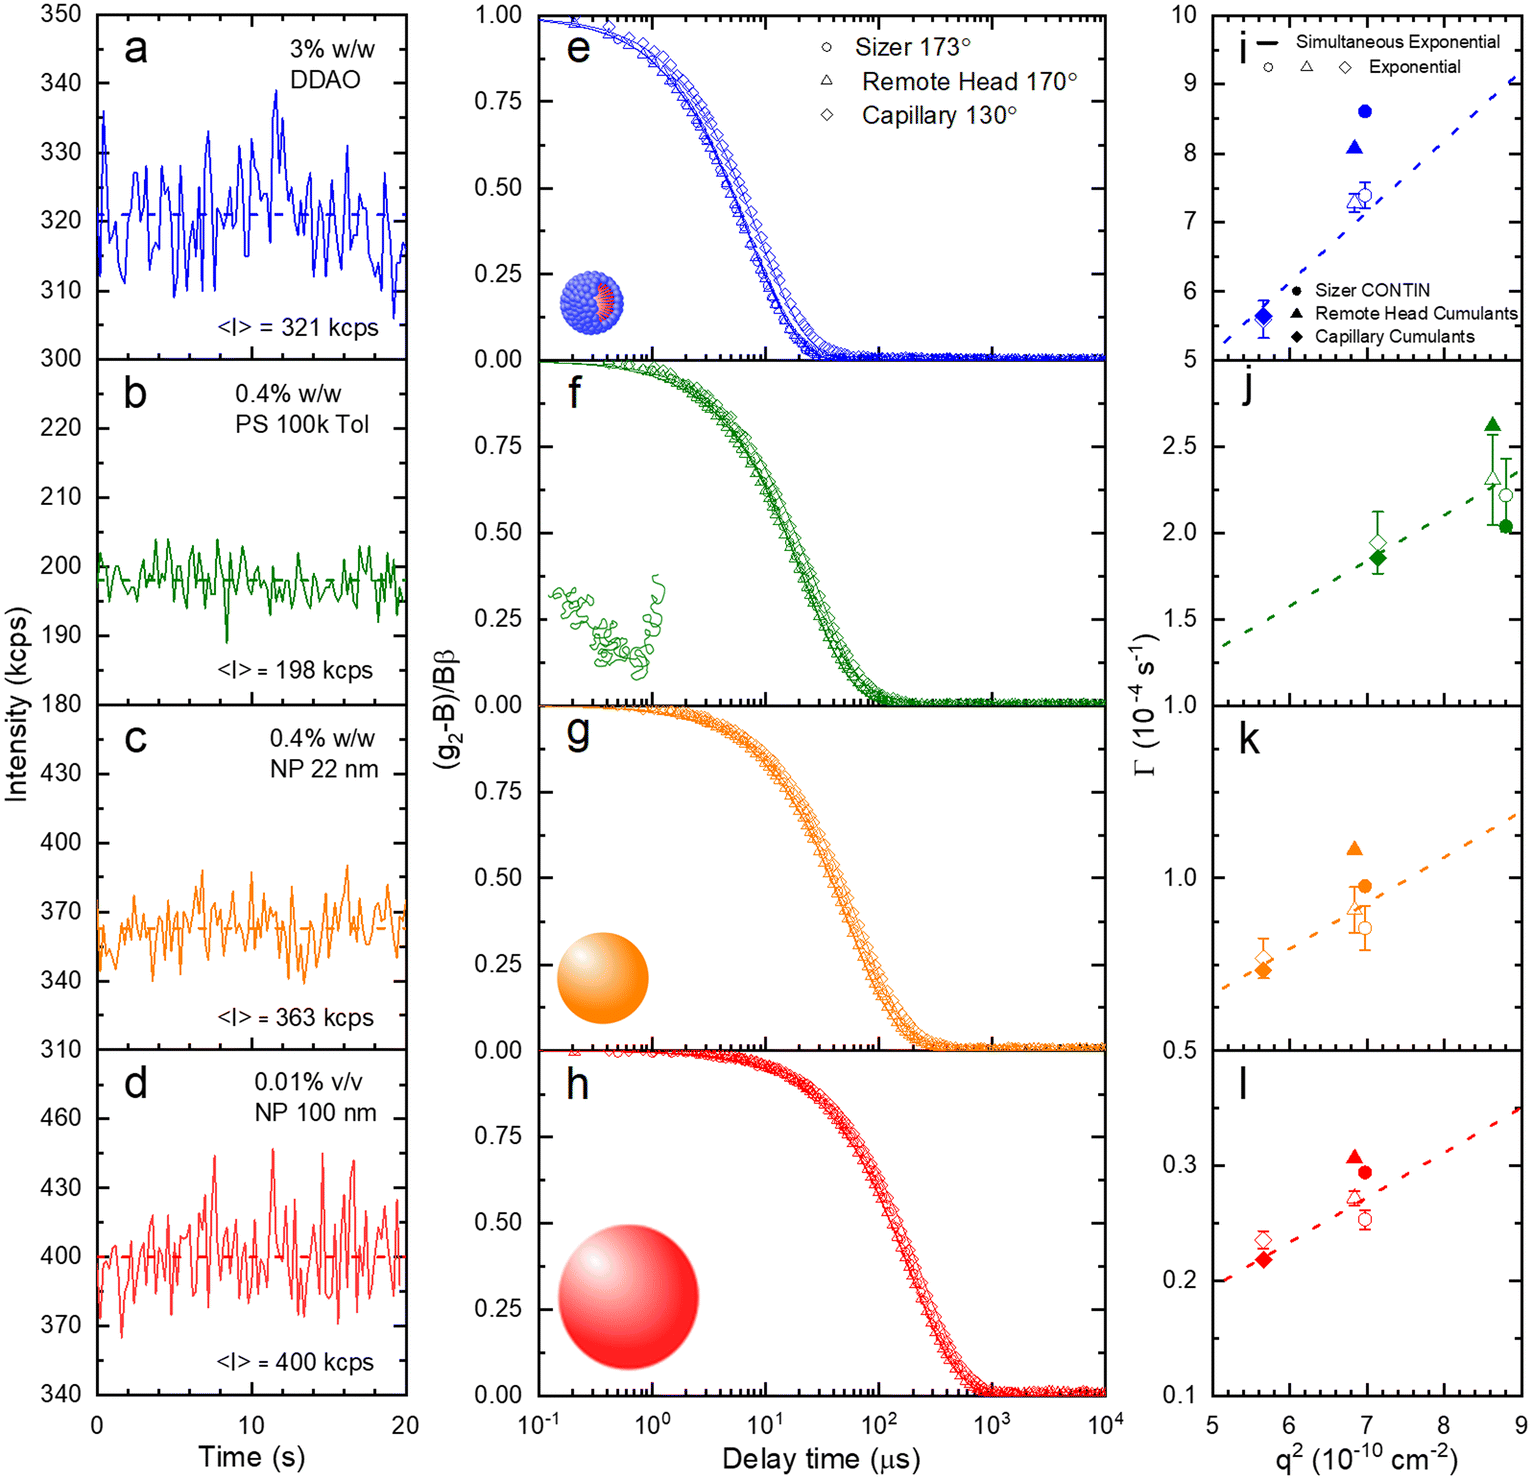 | ||
| Fig. 2 Validation of the capillary DLS setup with distinct model systems and conventional approaches, all measured under quiescent conditions. Experimentally measured scattered intensity acquired over 20 s using the capillary-DLS system for (a) 3% w/w DDAO micellar solution in water, (b) 0.4% w/w polystyrene (100k) solution in toluene, (c) 0.4% w/w silica nanoparticle (ludox AS-40, ∼22 nm diameter) dispersion in water, (d) 0.01% v/v polystyrene latex nanoparticle (∼100 nm diameter) dispersion in water. (e–h) Corresponding normalised intensity g12 correlograms measured on three DLS setups: (○) a particle sizer at 173°, (△) fibre-optic/vial system at 170°, and (◊) the capillary DLS at 130°. (i–l) Corresponding Γ decay constant obtained separately by the three setups using conventional (CONTIN, cummulant) algorithms (solid symbols) and by a simple exponential decay function fit (open symbols); the dashed line shows a simultaneous exponential fit to the data shown in (e–h). | ||
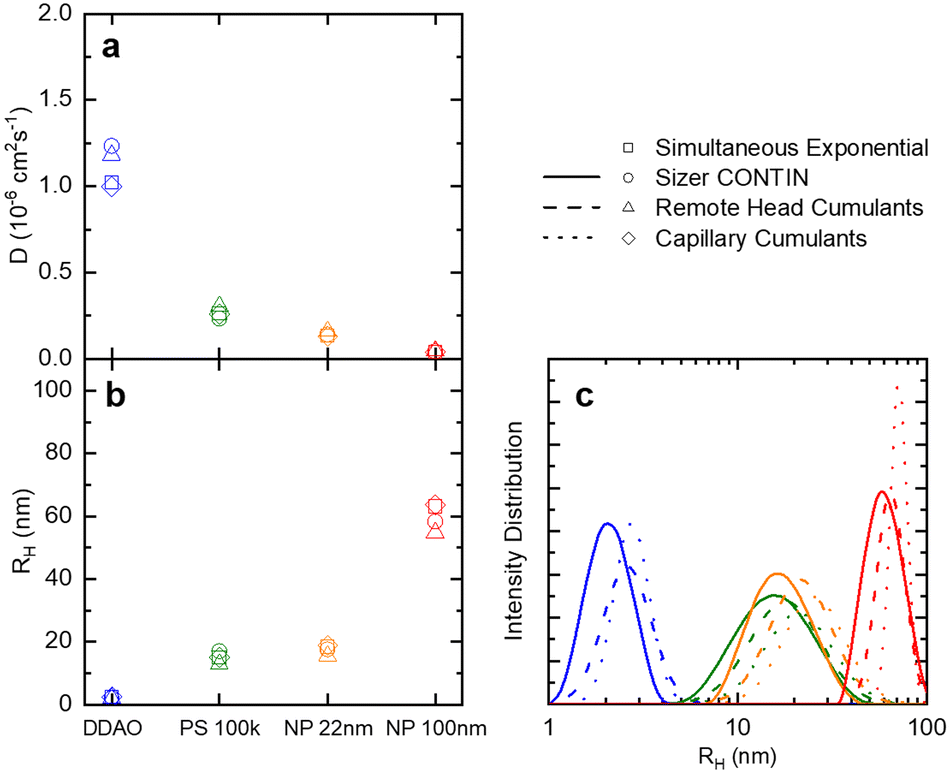 | ||
| Fig. 3 (a) Translational diffusion coefficients D, (b) mean hydrodynamic radii RH, and (c) size distributions obtained for DDAO micelles, PS (100k) polymer chains in solution, ludox NP 22 nm, and polystyrene latex 100 nm. These results are obtained from the raw data shown in Fig. 2. | ||
Fig. 4 examines the variation in RH with measurement time (sample time) for a measurement of 1% w/w DDAO, to estimate the minimum time required for a statistically significant reading. Fig. 4a shows the intensity signal acquired over a total 70 s, which is then subdivided into 5 periods illustrated by the horizontal lines above. For each period, correlograms are obtained as a function of increasing sampling time, from 0.1 s until 10 s, and fitted to a single exponential eqn (10), yielding the RH data shown in Fig. 3b. A minimum of ∼3 s sampling time appears sufficient for this low scattering system at a relatively low concentration, to yield RH values within ±0.1 nm. Correlograms for different sampling times and variations in fitting parameters are provided in Fig. S4.† The repeatability error is estimated as ∼2%, in terms of the variation in RH for different sampling periods above 3 s.
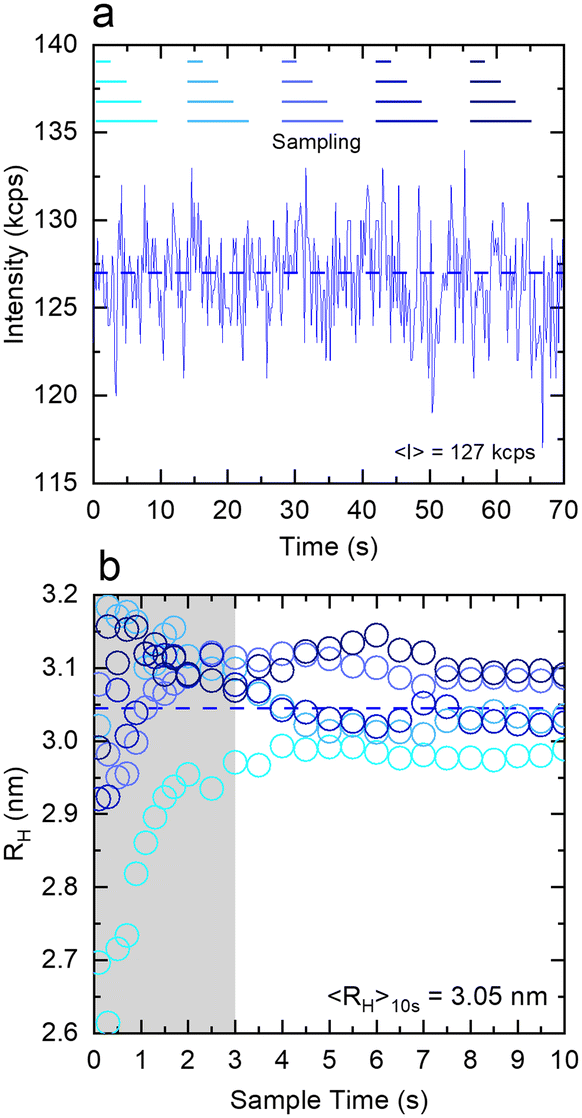 | ||
| Fig. 4 Affect of sampling time on the value and uncertainty of the estimated RH for an illustrative 1% DDAO micellar solution measured in the capillary DLS under quiescent conditions (capillary inner diameter 1 mm). (a) Overall intensity trace acquired over 70 s, subsequently segmented into 5 sections, each analysed for varying time intervals, ranging from 0.1 to 10 s. (b) Hydrodynamic radii, RH, obtained from fitting an exponential function to correlograms obtained from the sampling method above. Beyond the shaded area (≥3 s), acquisition times yield RH measurements within instrumental uncertainty. | ||
4.2 Under flow measurements
After validating the capillary-DLS setup under quiescent conditions, we next consider flow effects, using the same model systems and illustrated within the 1 mm ID capillary. Fig. 5 summarises the experimental results obtained for PS NP of nominal diameters 80, 100 and 200 nm, and a range of velocities up to 16 cm s−1, with maximum Reynolds number Re ≈ 90, thus remaining in the laminar flow regime. For clarity, we consider both the intensity correlation function, familiar to DLS users, and representations of the modified correlation function (MCF) introduced in eqn (9), in a lin-ln (left) and lin-lin (right panels). Previous work4,7 has generally represented the MCF within the delay time range where it is linear, and thus can be readily analysed. Here, we seek to emphasise the coupled effects of particle size and velocity on the analysis procedure itself. A more detailed discussion of the various contributions to the MCF is provided in Fig. S5.†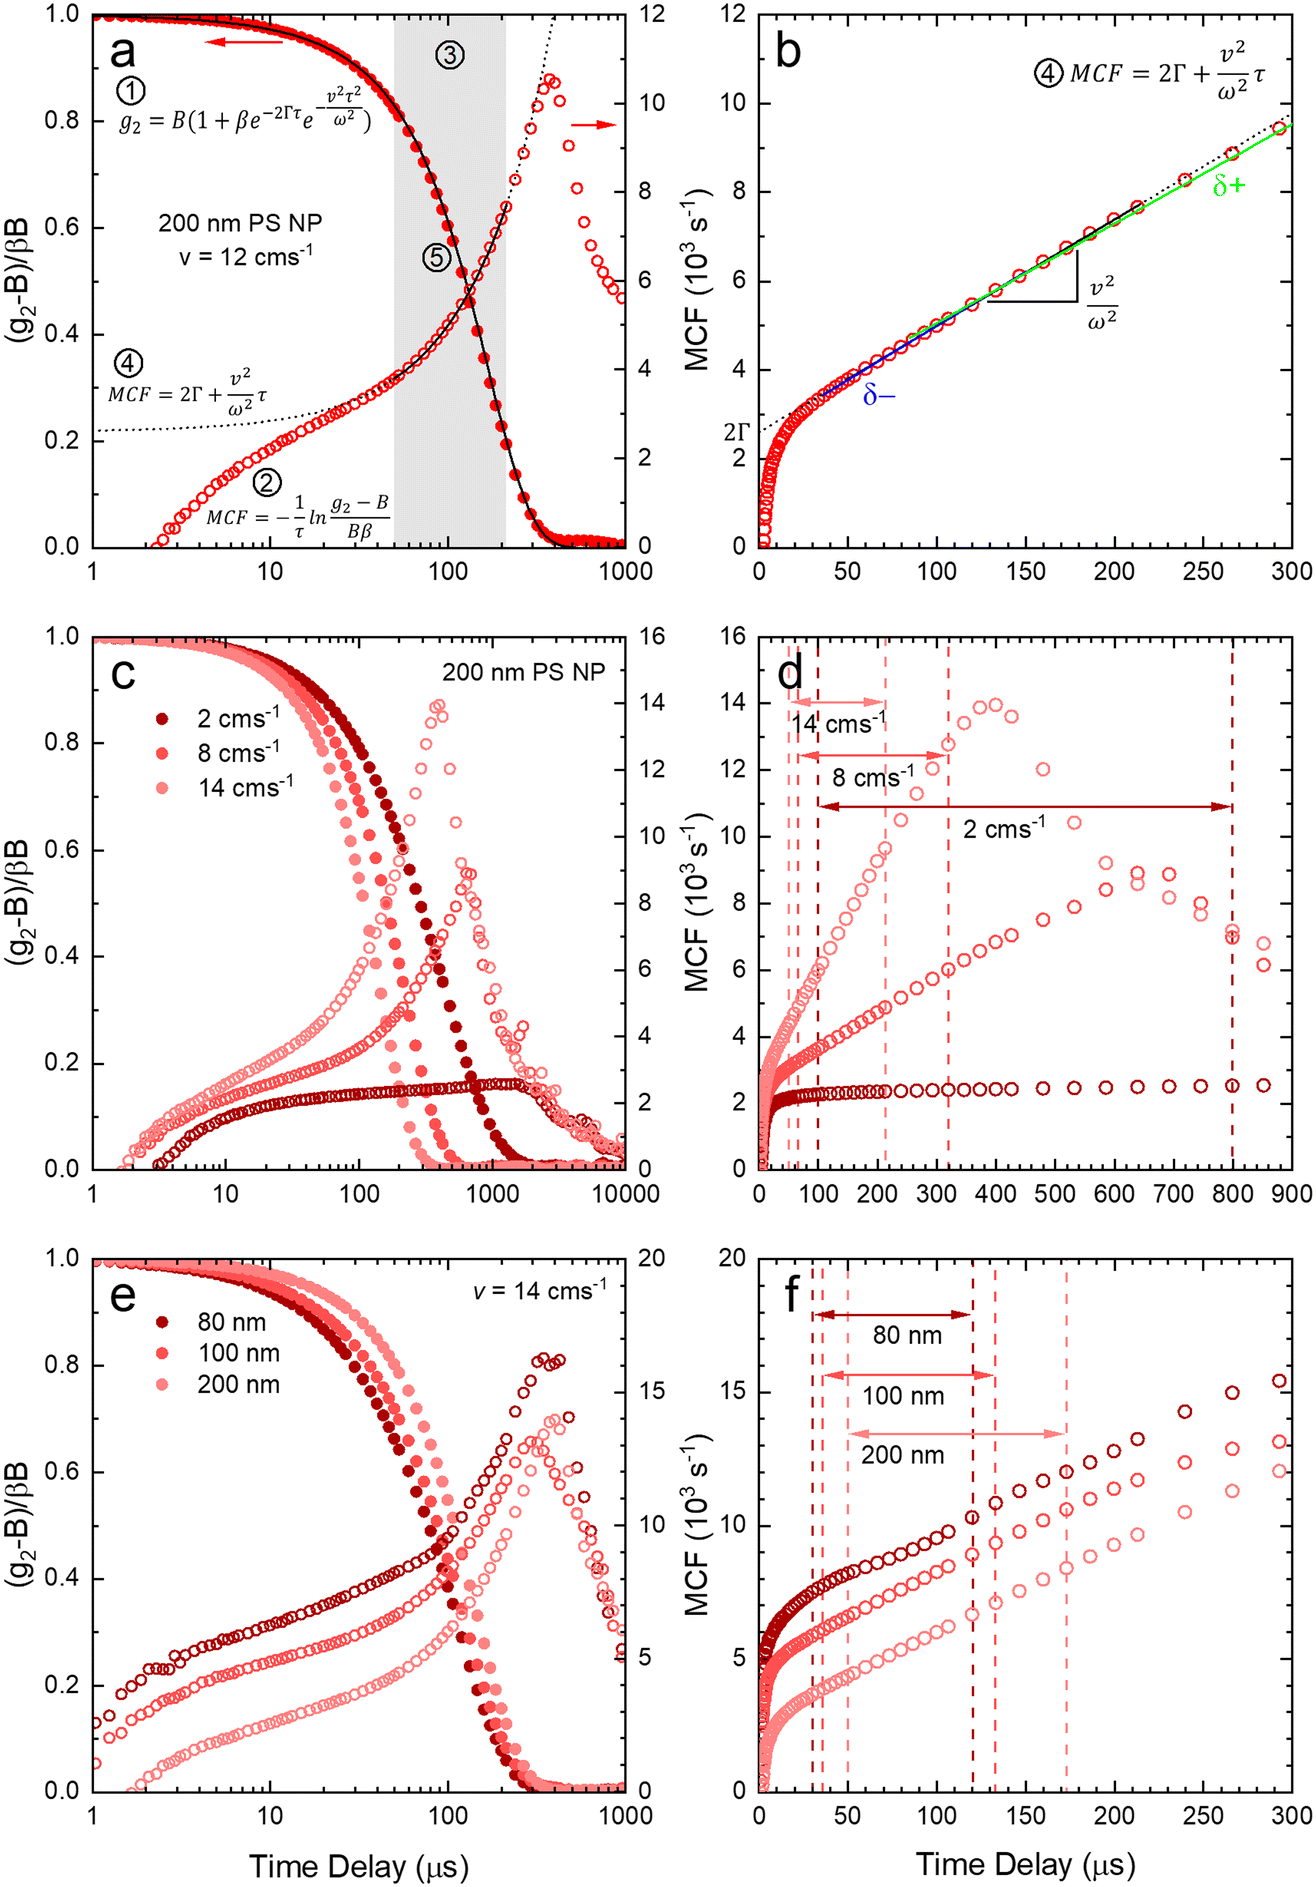 | ||
| Fig. 5 (a) Normalised correlogram (●) obtained for 200 nm PS NP at v = 12 cm s−1, and corresponding modified correlation function (○) (MCF). Analysis steps ①–⑤ described in text. (b) MCF represented in linear timescale and extraction procedure for slope (v2/ω2) and intercept (2Γ). The blue δ− and green δ+ lines indicate, respectively, upper and lower estimates for the slope by shifting the linear fitting range by 5 data points to lower and higher delay times. (c) Normalised correlograms and MCF for 200 nm PS NP for v = 2, 8, 14 cm s−1; (d) corresponding MCF in linear timescale, showing the estimated linear range for each v. (e) Normalised correlograms and MCF for v = 14 cm s−1 at PS NP of 80, 100, and 200 nm diameter; (f) corresponding MCF in linear timescale, showing the estimated linear range for each NP diameter. | ||
Fig. 5(a and b) details the data analysis approach employed for under-flow MCF. First, the raw correlogram is normalised ① by the baseline, B, and coherence factor, β. These correlation data are subsequently rearranged into the MCF representation ② using eqn (9). Here, the fitting region is chosen as the data points that lay between 0.2 < (g2 − B)/Bβ < 0.8, before being transformed into the MCF. ③ This range is selected empirically, as it corresponds approximately to the linear region of the MCF, and provides a simple, yet robust, criterion for analysis. A linear fit can then be applied to this region ④ where it can be seen from Fig. 5(a and b) that outside this region, the data deviate from linearity. The decay constant, Γ, and velocity, v, can then be extracted from the linear fit by extracting the intercept and gradient respectively, shown in Fig. 5(b). Finally, as a verification of the fit, the extracted decay constant and velocity may the used to overlay the model onto the correlogram, over the full τ range ⑤ using eqn (8), as shown in Fig. 5(a). Significantly, fitting the correlogram directly is not a practical approach, as the parameters not single-valued, and the uncertainty becomes unacceptably large. Fig. 5c–f illustrate that the linear approximation region depends both on particle size and flow velocity (at fixed q and T); nevertheless, the empirical criterion to define the fitting range of the delay time, is shown to remain appropriate at all conditions.
Fig. 5c shows that, as the flow velocity increases, the normalised correlograms shift to lower delay times. In conventional (quiescent) DLS analysis, this indicates an apparent decrease in particle size. In the MCF representation, shown in Fig. 5d, it can be seen that the gradient of the decay profile is changing, while the intercept, reflecting particle size, remains constant, as expected. The change in linear fitting region is also illustrated for nanoparticle solutions of different sizes (80, 100 and 200 nm PS NP), subjected to the same flow velocity (v = 14 cm−1), in Fig. 5e. As expected, the correlograms of the smaller particles decay at lower delay times, and indeed the MCFs are approximately shifted vertically to higher values as the particle size decreases, shown in Fig. 5f. As expected for a constant velocity, the gradient remains approximately constant, due to a constant flow velocity, while the acceptable fitting region shifts towards lower times and becomes narrower. While alternative data analysis procedures have been explored (e.g. adjusting iteratively the fitting interval based on fitting R2), the approach described above appears well-suited for our size measurements under flow.
Fig. 6 shows the correlograms and extracted RH for 80, 100, and 200 nm PS NP solutions subjected to flow velocities within 0 and 16 cm s−1. As expected, the correlograms appear to shift towards lower delay times, as shown in Fig. 6a–c, and this shift is more pronounced with increasing particle size. Flow has a greater impact on the size measurement of solutions containing larger particles, and Fig. 6d shows the linear MCF analysis results (solid data points), quantifying this effect. Estimates based on a simple exponential decay fit (open symbols) are also included for comparison. Evidently, the MCF approach provides more accurate RH values, closer to the values expected from quiescent (v = 0 cm s−1) data. While deviations become apparent at higher velocities, due to the separation of the decorrelations terms into a Brownian and flow velocity components, results obtained using the MCF approach remain constant for a range of flow velocities (where the theory is strictly valid) before decreasing with velocity (marking the onset of deviations from the theory). The region where the MCF approach remains valid thus decreases with increasing velocity and with increasing particle size.
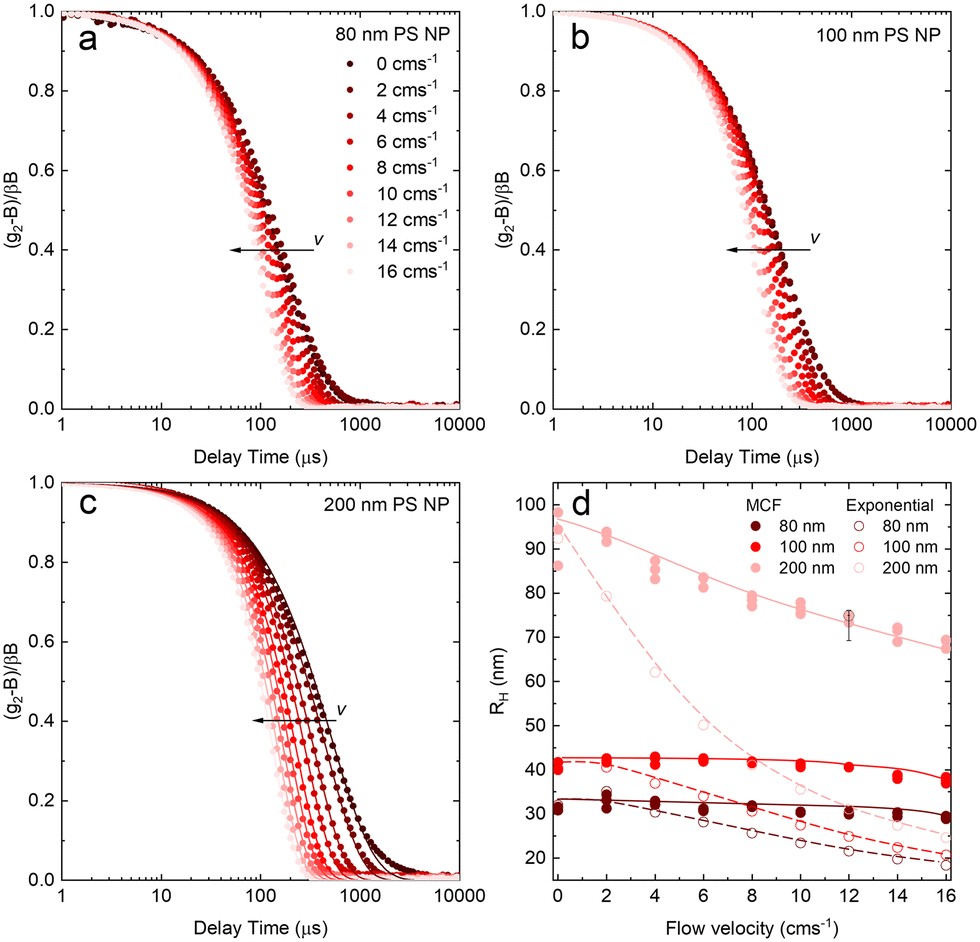 | ||
| Fig. 6 (a) DLS correlograms obtained for PS NP of 80 nm (nominal) diameter as a function of flow velocity (0–16 cm s−1) in a 1 mm ID glass capillary. (b) idem for 100 nm PS NP, and (c) idem for 200 nm PS NP, including data fits using extracted parameters from the velocity-dependent model described. (d) Apparent RH extracted from the velocity-dependent model (solid lines and symbols); for comparison, results obtained from simple exponential fits (dashed lines and open symbols) are also included. | ||
Noting that the experimentally determined particle sizes by DLS employing the MCF approach appeared smaller than their nominal sizes, SEM imaging was carried out on dried PS NP solutions, reported in Fig. S6.† We find that the nominal sizes of 80, 100, and 200 nm NP correspond to mean sizes of 59.3, 93.6, and 189.5 nm respectively, in closer agreement with RH obtained by DLS.
We next report on measurements and analyses of the smaller DLS standard systems under flow, namely DDAO micelles, PS 100k polymer, and Ludox NP, with results shown in Fig. 7. Correlograms for DDAO (Fig. 7a) remain effectively unchanged with v over the whole range 0–16 cm s−1 investigated. This is expected for sufficiently small particles, for which diffusion timescales dominate over flow timescales. In such cases, more common DLS analysis algorithms, including cummulant and CONTIN, can be used for size determination. DLS data for PS chains and Ludox systems, shown in Fig. 7b and c, exhibit a small, albeit visible shift to lower delay times in the correlograms. MCF analysis is required and accurately extracts RH at all, except the very highest v investigated, as shown in Fig. 7d. Results from a simple exponential decay function have been included to illustrate the earlier v onset of deviations in the estimated RH, compared to the MCF analysis.
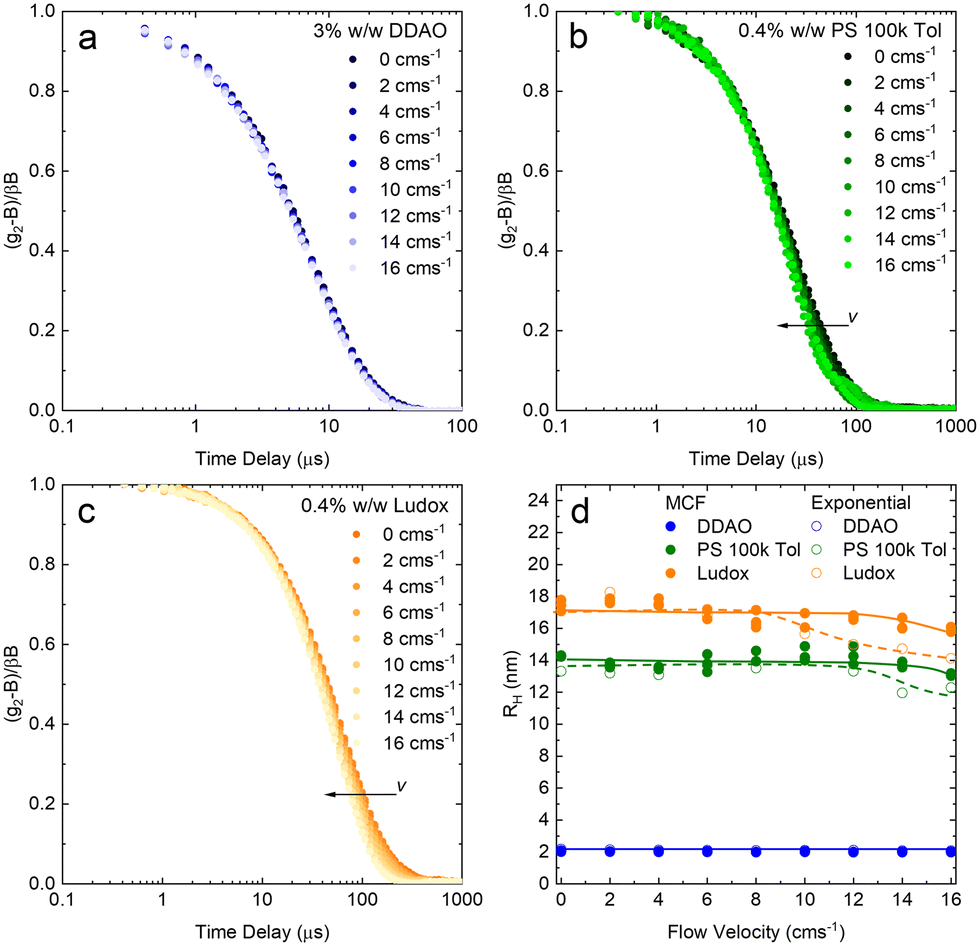 | ||
| Fig. 7 (a) DLS correlograms obtained for a solution of 3% w/w DDAO in water as a function of flow velocity (0–16 cm s−1) in a 1 mm ID glass capillary. (b) idem for 0.4% w/w PS 100k in toluene, (c) idem for 0.4% w/w Ludox AS 40 in water. (d) Apparent RH extracted from the velocity-dependent model (solid lines and symbols); for comparison, results from a simple exponential decay (dashed lines and open symbols) are included. | ||
5 Applicability and limits of data fitting approaches
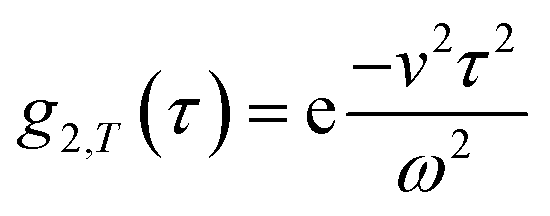
Building upon previous work,4,5,7,8,16,31 we recall that the MCF comprises two physical contributions: an exponential decay due to the stochastic Brownian motion (B) of particles, and a Gaussian decay due to the linear flow, or transit (T), of these particles past the scattering volume. In order to provide approximate boundaries for the applicability of the data fitting approaches, we express eqn (8) as a product of these two contributions:| g2(τ) = B(1 + βg2,B(τ)g2,T(τ)). | (11) |
| τ′ = 2Γω2/v2, | (12) |
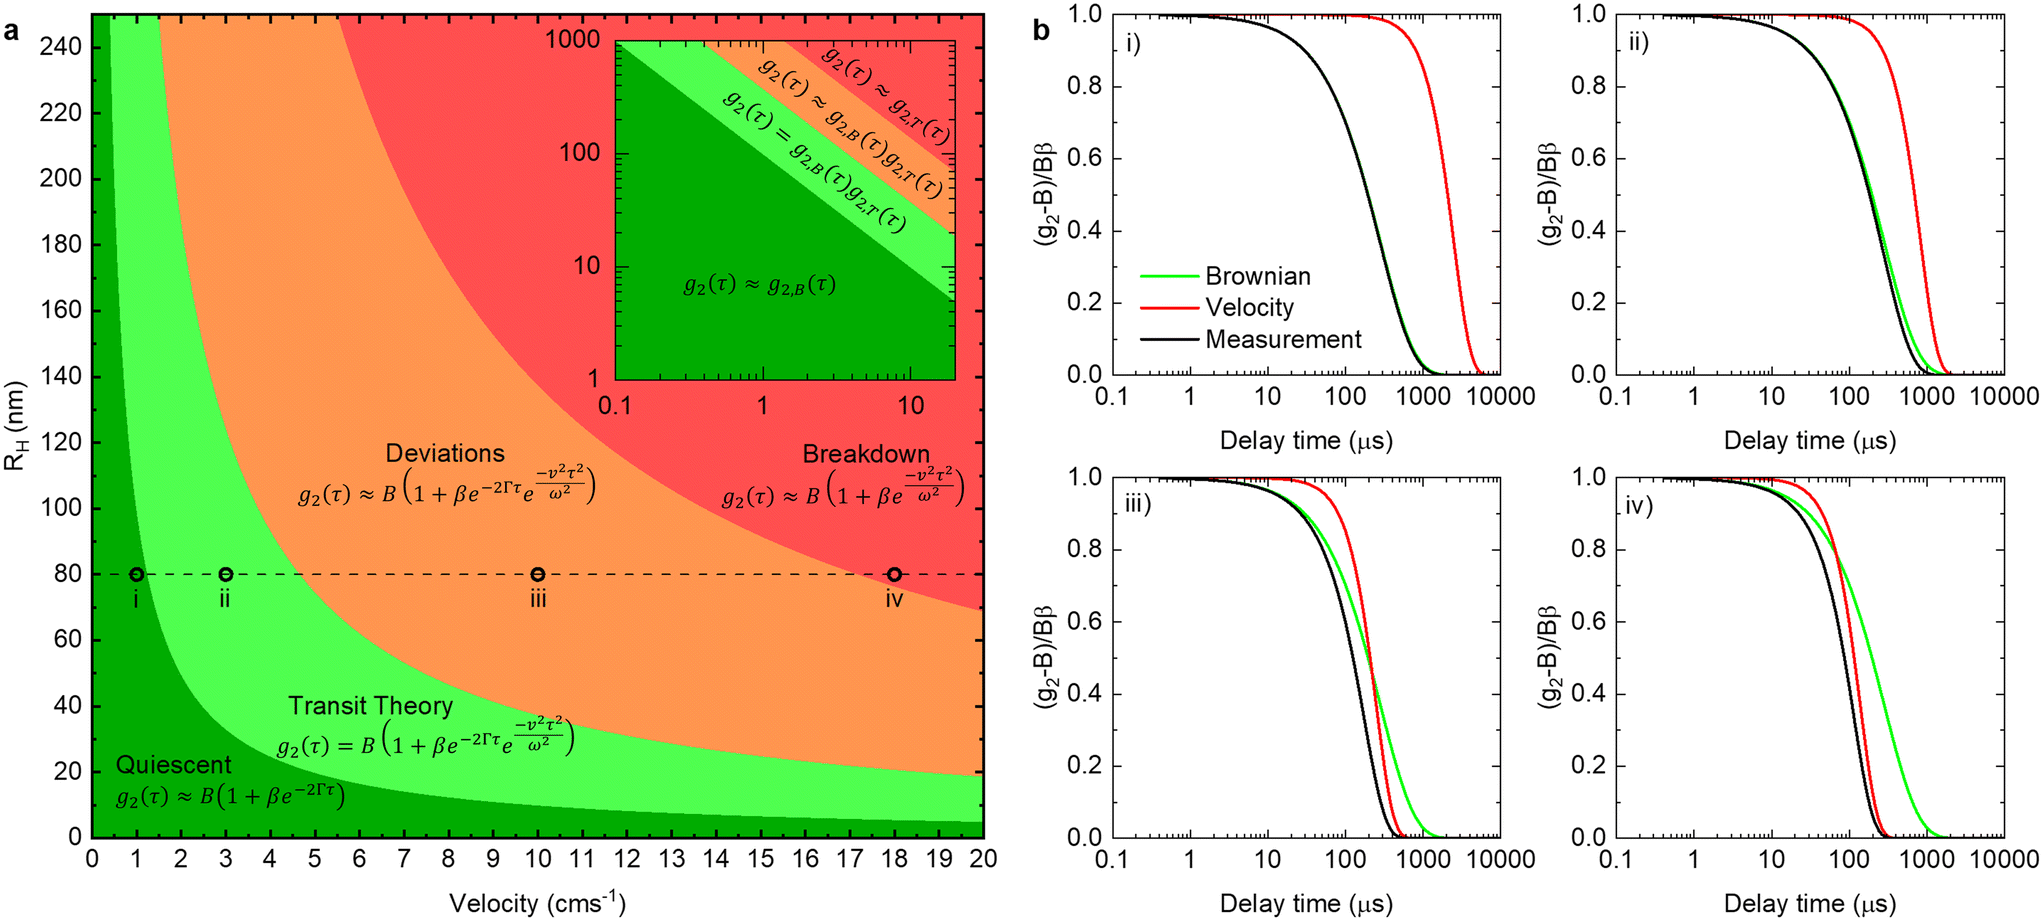 | ||
| Fig. 8 (a) Regions of the approaches required to analyse under flow DLS data for a range of flow velocities (0–20 cm s−1) and RH (<250 nm) with boundaries defined by green: 1 > g2,T(τq) > 0.98, light green: 0.98 > g2,T(τq) > 0.75, orange: 0.75 > g2,T(τq) > 0.02, red: 0.02 > g2,T(τq) using the parameters: θ = 130°, λ = 638 nm, T = 25 °C, refractive index n = 1.33, η = 8.9 × 10⁻⁴ Pa s (water), beam radius ω = 25 μm. (b) The theoretical Brownian exponential decay (green line) and velocity Gaussian (red line) contributions to the overall measured correlogram (black lines) calculated at the marked regions (i–iv) in panel a using the above mentioned instrument parameters. | ||
By comparing the profiles of g2,B ≡ e−2Γτ and g2,T ≡ e−v2τ2/ω2, we pragmatically define four broad regimes in parameter space and their corresponding fitting strategy: (i) the ‘quiescent approximation’ holds when 1 ≳ g2,T(τq) ≳ 0.98, as the experimental signal is effectively reduced to g2,B and thus the quiescent RH can be obtained ignoring the transit contribution. This is illustrated by the correlograms in Fig. 8b i) and the corresponding region is shown as dark green in Fig. 8a; (ii) the ‘transit approximation’ holds up to g2,T(τq) ≈ 0.75, where the model in eqn (8) applies and yields correct values for RH, as illustrated by the relative contributions in Fig. 8b ii). This region is shown and light green; (iii) a ‘model deviation’ region can be defined beyond this limit, estimated by 0.75 ≳ g2,T(τq) ≳ 0.02, where the transit model no longer accurately describes the data, yielding now apparent RH values, smaller than the actual RH, but still closer to the zero velocity RH than the use of quiescent DLS fitting procedures such as eqn (1). Fig. 8b iii) illustrates that both Brownian and transit contributions to the correlogram are significant, and this region is shown in orange; finally, (iv) a ‘breakdown’ region is found at even higher v, as the transit contribution dominates the measured signal over the Brownian term, shown in Fig. 8b iv), which we approximate by g2,T(τq) ≲ 0.02, and this region is shown in red.
The approximate boundaries in Fig. 8 thus correspond to:
 | (13) |
 where g2 ≡ 0.98 between the quiescent and flow approximations (dark to light green), 0.75 between the flow approximation and deviation regions (light green to orange), and 0.02 at the onset of breakdown (red).
While the main findings discussed so far hold in general, the specific (approximate) boundaries of v and RH depend somewhat on the system, and instrument setup. For completion, we provide in Fig. S7† additional estimates for pertinent variations of scattering angle and beam radius, as well as solvent and temperature, which illustrate the impact of each parameter. Similarly, while the main results presented so far were acquired in 1 mm capillaries, data for capillaries of internal diameters 1, 0.4, and 0.2 mm (Fig. 1a) are compared in Fig. S8,† as well as for microdevices with channel cross-section of 250 μm depth × 400 μm (Fig. 1c), where we discuss the requirements of optical alignment and parasitic scattering and refraction signals, signal-to-noise ratio and measurement repeatability.
Our findings demonstrate how the flow-DLS system can be coupled into lab-on-a-chip technologies for real time, in-line monitoring of particles size, requiring only precise xyz positioning or the printing of a microchip holder to facilitate optical alignment and measurement stability. Applications include monitoring the synthesis of nanocrystals or nanoparticles in droplet,32 or continuous33,34 reactors, and the dynamic analysis of a range biomedical and physical–chemical processes. In order to minimise custom alignment of the setup, microdevices can be alternatively coupled to a dedicated capillary DLS section, within a flow system. This approach is explored in the following section where we utilise a micromixer chip to screen the size of micelles in a surfactant–salt system. A simple procedure to automate the data analysis and flow-DLS operation is provided in ESI,† section 10.
5.1 Microfluidic-DLS scanning of surfactant solution composition
We next demonstrate an application of in-line characterisation of a model ternary system, surfactant/salt/solvent, under flow with varying composition, employing microfluidics and flow-DLS. We select the SDS/NaCl/H2O system as micelles of this ubiquitous anionic surfactant increase in size with addition of salt.35,36Conventional batch DLS experiments require the preparation, handling and loading in a cuvette (∼1 mL) of numerous sample mixtures, which are measured sequentially. Employing a microfluidic mixer (Dolomite), we generate a composition library from two stock solutions, of 0.4 M SDS/0.2 M NaCl and 0.4 M SDS, imposing two symmetric flow rate ramps using a LabVIEW-controlled set of syringe pumps, depicted in Fig. 9a and b to vary the salt content from 0 to 0.2 M. A 1 mm ID capillary was then connected to the outlet of the microdevice, and a total flow rate of 1.414 mL min−1 was imposed, corresponding to a maximum flow velocity of v = 6 cm s−1 through the capillary and a Reynolds number Re ≈ 35, as expected for laminar flow, where the DLS measurement takes place, as illustrated in Fig. 1a. The viscosity of water, at the measured temperature, was input for data analyses in aqueous systems. In cases where the viscosity changes considerably with composition, a lab-on-a-chip viscometer37–40 could be used to monitor viscosity changes in-line, which is required for accurate estimations of RH. Following from the map in Fig. 8a, we find that the micellar system (RH ∼ few nm) falls under the ‘dark green’ region, where a quiescent analysis is acceptable and we opt for the SBL algorithm, with no transit correction. Pump 1 (0.2 M NaCl) was initially set to 95% of this total flow rate while pump 2 (0 M NaCl) was set to 5%. After a stabilisation time of 2 min, the flow rates were inverted, over 36 steps, each lasting 10 s, yielding a total ramp duration of 6 min, followed by a final stabilisation time of 2 min, allowing the final composition could be measured multiple times.
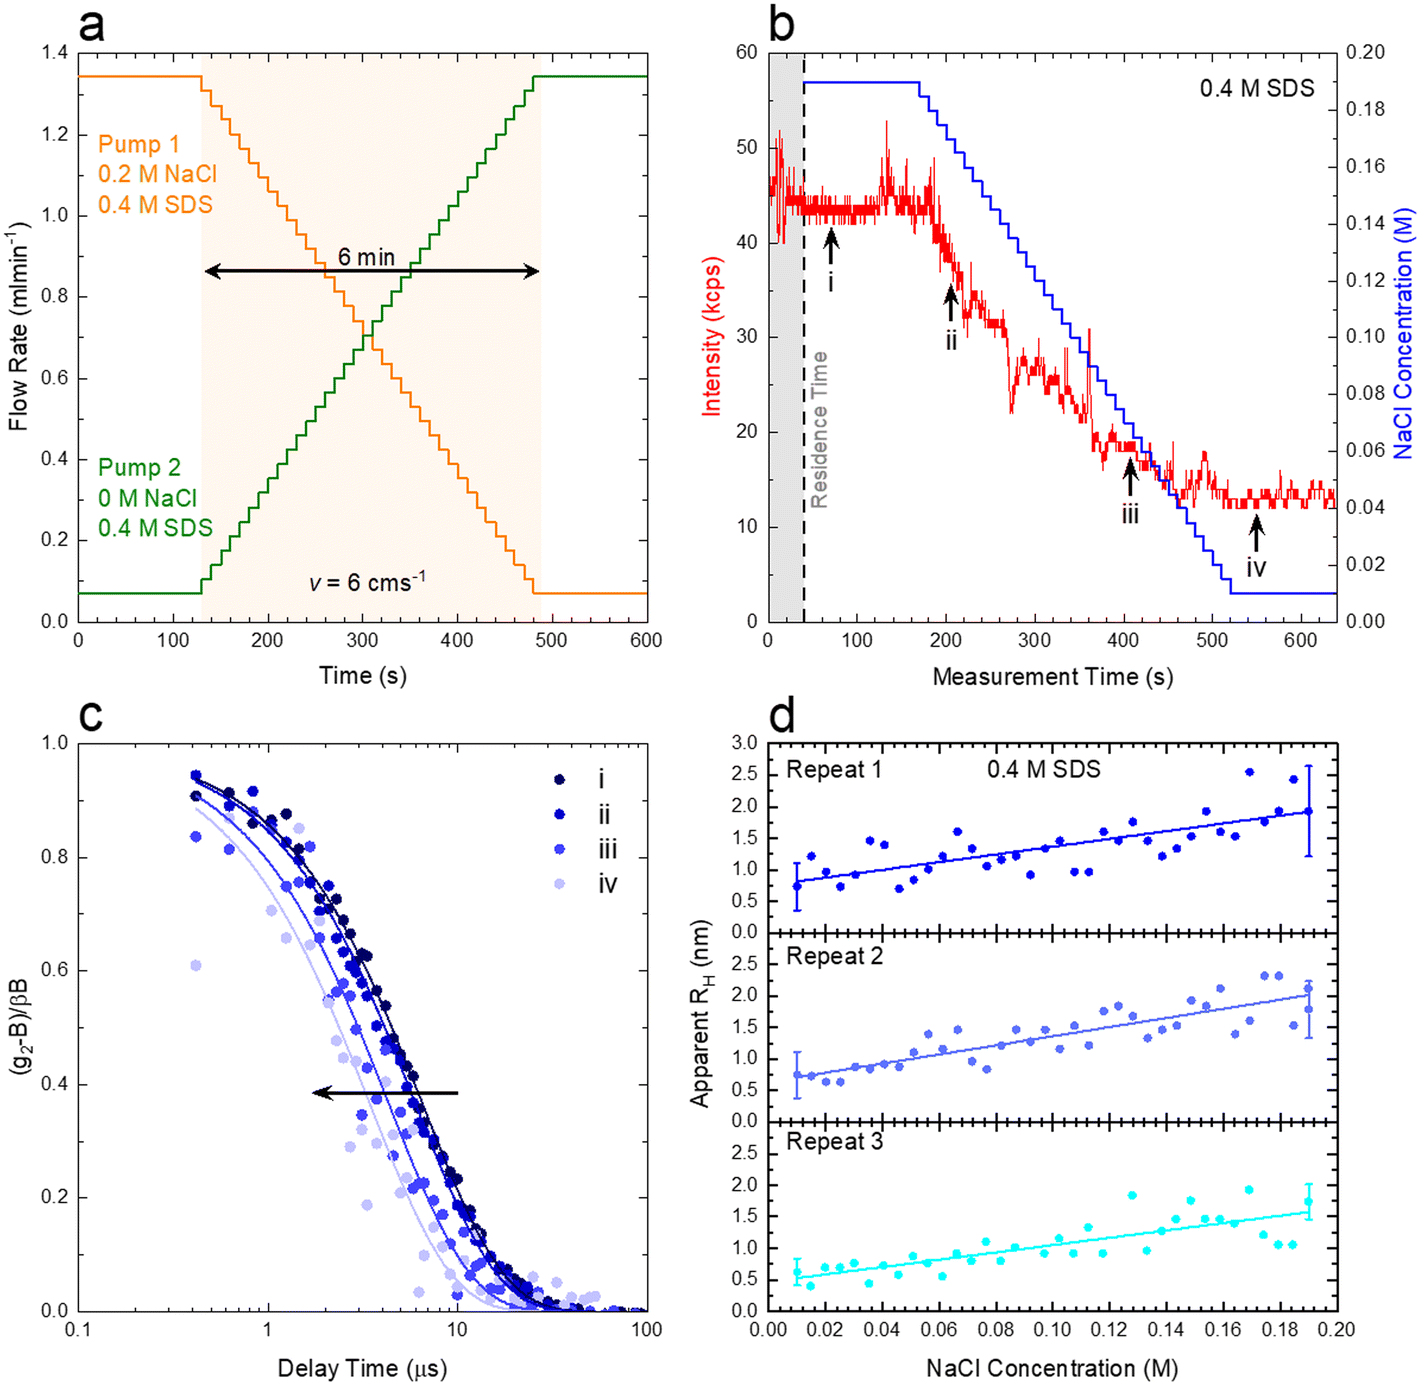 | ||
| Fig. 9 (a) Programmed flow rates for a composition scanning experiment with two inputs, namely 0.2 M SDS with and without added salt (0.4 M), including stabilisation times (∼2 min) and mixing stage (∼6 min) at constant total flow rate that corresponds to a flow velocity of 6 cm s−1. (b) Variation in scattering intensity and nominal NaCl concentration, adjusted by the system's residence time, as a function of measurement time. (c) Normalised correlogram obtained at the marked positions in panel b (corresponding to repeat 1). (d) Variation of the mean RH estimated for SDS micelles upon NaCl addition, for 3 repeats of the same mixing experiment. | ||
Fig. 9b) shows the imposed NaCl concentration profile, alongside the experimentally-measured intensity trace. The shaded area corresponds to the 40 s residence time (due to the microdevice and connector volume). The intensity profile was sectioned into 10 s slices (using ‘kinetic analysis’ of the ‘NanoKin’ software) to produce 60 correlograms that were then fitted using the SBL analysis. Fig. 9c) shows four illustrative correlograms, acquired along the composition ramp, indicated in b).
To examine the repeatability of the measurements, three identical experiments were carried out, and the RH data thus obtained are shown in Fig. 9d), and found to be in excellent agreement. The micelle (apparent) RH increases with NaCl concentration from ∼0.7 to 2 nm over the concentration range. These lower than expected values of RH are related to electrostatic contributions to the diffusion coefficient and have been well documented in the literature for both SDS41–43 and other charged surfactant micelles.43–45 Addition of electrolytes is commonly used to mitigate these effects (which can, however, inadvertently induce changes in solution structure). For completion, analogous measurements on pure SDS solutions were carried on a conventional DLS sizer (ESI† Fig. S9), in good agreement with the flow-DLS data. Overall, our measurements establish that composition (or phase) mapping experiments can be readily carried out under flow, with dynamically varying compositions, with ∼3–10 s integration (or acquisition) times, depending on the data precision required.
6 Conclusions
We have demonstrated a new experimental approach for flow-DLS based in the development and optimisation of a modular, fibre-optic setup, compatible with measurements on capillaries or directly on microdevices. For ease of assembly and operation, we select to build our system employing a commercially available fibre-optic DLS system, designed to measure directly on various vessels. Our flow-setup was validated against common DLS setups using model systems, including a weekly scattering 1% DDAO surfactant solution, for which a 3 s minimum measurement time was estimated (yielding an uncertainty in RH of ∼2%, for this system).Building upon the flow-DLS data analysis approach introduced by Chowdhury et al.4 and others, and a series of experimental measurements on model systems, we establish a systematic procedure for data analysis based on RH and v ranges (and instrumental setup parameters, viz. beam size, scattering angle, wavelength and solvent η, n, T). Under flow particle sizing is shown to be feasible with a reasonable compromise of channel and optical beam dimensions (∼50 μm width) and geometry, permitting a relatively facile alignment of the system. In particular, while direct microfluidic-DLS measurements are demonstrated, we generally favour a ‘daisy-chain’, modular setup, employing a glass capillary (typically, with 1 mm ID) connected along a microfluidic system for ease of operation and connectivity. Reducing the capillary ID or microchannel dimensions increases the shear gradients along the flow cross-section, and decreases the available scattering volume, which requires thus optical alignment of higher precision. Further, parasitic light refraction and reflections from channel walls and edges become more problematic. We could nevertheless obtain low-noise correlograms and invariant RH results for capillaries down to 0.2 mm inner diameter for model systems of DDAO and 100 nm PS NP.
Employing the 1 mm ID capillary setup, at sufficiently low v and RH, a quiescent DLS analysis is shown to be adequate to yield correct particle sizes, followed by a range where the MCF approach permits the diffusion coefficient (and thus RH) as well as flow velocity v to be correctly extracted from its intercept and gradient, respectively, in the linear approximation region. For our system, this range is rather large, encompassing for instance particles of ∼20 nm travelling at ∼20 cm s−1, particles of ∼200 nm travelling at ∼2 cm s−1. As summarised in Fig. 8, further increasing RH and v eventually leads to downward deviations in the measured – or apparent – RH, up to the point where correlograms only contain information on the decorrelation due to particle flow past the scattering volume.
Finally, we demonstrate the use of the flow-DLS system in the rapid characterisation of a model micellar surfactant solution with addition of salt, namely SDS/NaCl/water, where RH is obtained over time as the composition changes, within 5 s intervals. Owing to its remote fibre-optic configuration, our flow-DLS can be readily integrated within a lab-on-a-chip system, our coupled in a modular fashion with other techniques such as SANS,46–50 SAXS,51,52 Raman spectroscopy,53 microrheology,54 viscometry,38 and many other experimental approaches to complement the spatio-temporal characterisation of complex, reactive or dynamic systems.
Author contributions
LMGT: conceptualisation, data curation, formal analysis, methodology, investigation, validation, writing – original draft. NH: investigation, methodology. YC: data curation, formal analysis, investigation, validation. RC: data curation, validation, writing – review & editing. JG: conceptualisation, methodology. ESJR: conceptualisation, methodology, writing – review & editing. DJ: conceptualisation, formal analysis, software, methodology, validation, writing – review & editing. JTC: conceptualisation, formal analysis, methodology, funding acquisition, project administration, supervision, writing – review & editing.Conflicts of interest
DJ is employed by Cordouan Technologies which manufactures the fibre-optic DLS system employed in our setup.Acknowledgements
We thank EPSRC and P&G for funding an iCASE PhD studentship for LMGT and the ANTENNA prosperity partnership (EP/V056891/1), and Plan France Relance for supporting Cordouan's experimental device development. JTC thanks the Royal Academy of Engineering (RAEng, UK) for funding a Research chair.Notes and references
- B. J. Berne and R. Pecora, Dynamic light scattering: with applications to chemistry, biology, and physics, Courier Corporation, 2000 Search PubMed.
- B. Chu, Laser light scattering: basic principles and practice, Courier Corporation, 2007 Search PubMed.
- J. Stetefeld, S. A. McKenna and T. R. Patel, Biophys. Rev., 2016, 8, 409–427 CrossRef CAS.
- D. Chowdhury, C. M. Sorensen, T. Taylor, J. Merklin and T. Lester, Appl. Opt., 1984, 23, 4149–4154 CrossRef CAS PubMed.
- T. W. Taylor and C. M. Sorensen, Appl. Opt., 1986, 25, 2421 CrossRef CAS PubMed.
- R. Weber and G. Schweiger, Appl. Opt., 1998, 37, 4039 CrossRef CAS.
- A. B. Leung, K. I. Suh and R. R. Ansari, Appl. Opt., 2006, 45, 2186–2190 CrossRef.
- S. Sitar, V. Vezoč, P. Mač, K. Kogej, D. Pahovnik and E. Z. Agar, Anal. Chem., 2017, 89, 43 CrossRef.
- G. Huang, B. Xu, J. Qiu, L. Peng, K. Luo, D. Liu and P. Han, IEEE Photonics J., 2021, 13, 1–13 Search PubMed.
- N. Meulendijks, R. van Ee, R. Stevens, M. Mourad, M. Verheijen, N. Kambly, R. Armenta and P. Buskens, Appl. Sci., 2018, 8, 108 CrossRef.
- D. Rusu, D. Genoe, P. Van Puyvelde, E. Peuvrel-Disdier, P. Navard and G. Fuller, Polymer, 1999, 40, 1353–1357 CrossRef CAS.
- G. Fuller, J. Rallison, R. Schmidt and L. Leal, J. Fluid Mech., 1980, 100, 555–575 CrossRef.
- B. Ackerson and N. Clark, J. Phys., 1981, 42, 929–936 CrossRef.
- K. J. Maloy, W. Goldburg and H. K. Pak, Phys. Rev. A: At., Mol., Opt. Phys., 1992, 46, 3288 CrossRef PubMed.
- J. J. Wang, D. Yavich and L. G. Leal, Phys. Fluids, 1994, 6, 3519–3534 CrossRef CAS.
- F. Destremaut, J. B. Salmon, L. Qi and J. P. Chapel, Lab Chip, 2009, 9, 3289–3296 RSC.
- E. Jenner and B. D'Urso, Appl. Opt., 2015, 54, 8821–8826 CrossRef PubMed.
- T. Q. Chastek, K. L. Beers and E. J. Amis, Rev. Sci. Instrum., 2007, 78, 1–8 CrossRef PubMed.
- T. Q. Chastek, K. Iida, E. J. Amis, M. J. Fasolka and K. L. Beers, Lab Chip, 2008, 8, 950–957 RSC.
- M. Chen, Y. Wang, W. Li, M. Xia, Z. Meng and L. Xia, Opt. Laser Technol., 2022, 150, 107891 CrossRef CAS.
- A. Siegert, On the fluctuations in signals returned by many independently moving scatterers, Radiation Laboratory, Massachusetts Institute of Technology, 1943 Search PubMed.
- D. Brogioli, D. Salerno, V. Cassina, S. Sacanna, A. P. Philipse, F. Croccolo and F. Mantegazza, Opt. Express, 2009, 17, 1222–1233 CrossRef CAS PubMed.
- D. E. Koppel, J. Chem. Phys., 1972, 57, 4814–4820 CrossRef CAS.
- S. W. Provencher, Comput. Phys. Commun., 1982, 27, 213–227 CrossRef.
- S.-L. Nyeo and R. R. Ansari, J. Comput. Appl. Math., 2011, 235, 2861–2872 CrossRef.
- R. V. Edwards, J. C. Angus, M. J. French and J. W. Dunning, J. Appl. Phys., 1971, 42, 837 CrossRef CAS.
- M. Cesar Prado Soares, M. Santos Rodrigues, E. Alexandre Schenkel, G. Perli, W. Hideak Arita Silva, M. Kaue Gomes, E. Fujiwara and C. Kenichi Suzuki, Sensors, 2020, 20, 707 CrossRef PubMed.
- G. M. Whitesides, Nature, 2006, 442, 368–373 CrossRef CAS PubMed.
- D. Some and C. Johann, Characterization of Nanopharmaceuticals with Field-Flow Fractionation and Light Scattering (FFF-MALSDLS), 2022, https://www.controlledreleasesociety.org/news/characterization-nano-pharmaceuticals-field-flow-fractionation-and-light-scattering-fff-mals Search PubMed.
- G. Tyagi, D. Seddon, S. Khodaparast, W. N. Sharratt, E. S. Robles and J. T. Cabral, Colloids Surf., A, 2021, 618, 126414 CrossRef CAS.
- T. Mu, J. Shen, M. Wang, J. C. Thomas, X. Zhu, X. Yuan, W. Liu, X. Sun, Y. Wang, J. Han and Z. Liu, Meas. Sci. Technol., 2021, 32, 75007–75018 CrossRef CAS.
- L.-J. Pan, J.-W. Tu, H.-T. Ma, Y.-J. Yang, Z.-Q. Tian, D.-W. Pang and Z.-L. Zhang, Lab Chip, 2018, 18, 41–56 RSC.
- A. Dobhal, A. Kulkarni, P. Dandekar and R. Jain, J. Mater. Chem. B, 2017, 5, 3404–3417 RSC.
- C. Petschacher, A. Eitzlmayr, M. Besenhard, J. Wagner, J. Barthelmes, A. Bernkop-Schnurch, J. G. Khinast and A. Zimmer, Polym. Chem., 2013, 4, 2342–2352 RSC.
- Y. Mirgorod, A. Chekadanov and T. Dolenko, Chem. J. Mold., 2019, 14, 107–119 CAS.
- M. Afzal, P. Kundu, S. Das, S. Ghosh and N. Chattopadhyay, RSC Adv., 2017, 7, 43551–43559 RSC.
- L. Liu, D. Hu and R. H. Lam, Micromachines, 2020, 11, 934 CrossRef PubMed.
- D. E. Solomon and S. A. Vanapalli, Microfluid. Nanofluid., 2014, 16, 677–690 CrossRef CAS.
- S. Puneeth, M. B. Kulkarni and S. Goel, Eng. Res. Express, 2021, 3, 022003 CrossRef.
- Y. J. Kang and S. Yang, Microfluid. Nanofluid., 2013, 14, 657–668 CrossRef CAS.
- M. Almgren, J.-C. Gimel, K. Wang, G. Karlsson, K. Edwards, W. Brown and K. Mortensen, J. Colloid Interface Sci., 1998, 202, 222–231 CrossRef CAS.
- M. Corti and V. Degiorgio, J. Phys. Chem., 1981, 85, 711–717 CrossRef CAS.
- E. Sutherland, S. M. Mercer, M. Everist and D. G. Leaist, J. Chem. Eng. Data, 2009, 54, 272–278 CrossRef CAS.
- N. Amphoterics, S. Einstein, C. Dls and T. Nano, J. Phys. Chem. B, 2006, 1–5 Search PubMed.
- R. Dorshow, J. Briggs, C. Bunton and D. Nicoli, J. Phys. Chem., 1982, 86, 2388–2395 CrossRef CAS.
- C. G. Lopez, T. Watanabe, A. Martel, L. Porcar and J. T. Cabral, Sci. Rep., 2015, 5, 1–7 Search PubMed.
- C. G. Lopez, T. Watanabe, M. Adamo, A. Martel, L. Porcar and J. T. Cabral, J. Appl. Crystallogr., 2018, 51, 570–583 CrossRef CAS.
- M. Adamo, A. S. Poulos, R. M. Miller, C. G. Lopez, A. Martel, L. Porcar and J. T. Cabral, Lab Chip, 2017, 17, 1559–1569 RSC.
- M. Adamo, A. S. Poulos, C. G. Lopez, A. Martel, L. Porcar and J. T. Cabral, Soft Matter, 2018, 14, 1759–1770 RSC.
- L. Donina, L. Porcar and J. T. Cabral, Soft Matter, 2022, 18, 7010–7019 RSC.
- A. Schwamberger, B. De Roo, D. Jacob, L. Dillemans, L. Bruegemann, J. W. Seo and J. P. Locquet, Nucl. Instrum. Methods Phys. Res., Sect. B, 2015, 343, 116–122 CrossRef CAS.
- P. R. Garcia, O. Prymak, V. Grasmik, K. Pappert, W. Wlysses, L. Otubo, M. Epple and C. L. Oliveira, Nanoscale Adv., 2020, 2, 225–238 RSC.
- A. F. Chrimes, K. Khoshmanesh, P. R. Stoddart, A. Mitchell and K. Kalantar-Zadeh, Chem. Soc. Rev., 2013, 42, 5880–5906 RSC.
- K. M. Schultz and E. M. Furst, Soft Matter, 2012, 8, 6198–6205 RSC.
Footnote |
| † Electronic supplementary information (ESI) available. See DOI: https://doi.org/10.1039/d3lc00062a |
| This journal is © The Royal Society of Chemistry 2023 |