DOI:
10.1039/D2LC01064J
(Paper)
Lab Chip, 2023,
23, 1945-1953
High-throughput multi-gate microfluidic resistive pulse sensing for biological nanoparticle detection
Received
16th November 2022
, Accepted 22nd February 2023
First published on 10th March 2023
Abstract
A microfluidic resistive pulse sensing technique offers a simple method for detecting and analysing microparticles in various fields, yet it has challenges such as the noise during detection and low throughput as the signal obtained from a small single sensing aperture and particle position is nonuniform. This study presents a microfluidic chip with multiple detection gates in the main channel to enhance the throughput while maintaining a simple operational system. A hydrodynamic sheathless particle focusing on a detection gate by modulation of the channel structure and measurement circuit with a reference gate to minimize the noise during detection is used for detecting resistive pulses. The proposed microfluidic chip can analyse the physical properties of 200 nm polystyrene particles and exosomes from MDA-MB-231 with high sensitivity with an error of <10% and high-throughput screening of more than 200![[thin space (1/6-em)]](https://www.rsc.org/images/entities/char_2009.gif) 000 exosomes per seconds. The proposed microfluidic chip can analyse the physical properties with high sensitivity, so that it can be potentially used for exosome detection in biological and in vitro clinical applications.
000 exosomes per seconds. The proposed microfluidic chip can analyse the physical properties with high sensitivity, so that it can be potentially used for exosome detection in biological and in vitro clinical applications.
Introduction
The occurrence of chronic diseases is increasing with the aging global population. This has led to a shift in the medical paradigm from treatment to prevention of diseases. To effectively prevent diseases, biomarkers, which are indicators of changes in the human body and are based on cells, blood vessels, proteins, and DNA, must be analyzed. Recently, extracellular vesicles (i.e., exosomes) have gained importance as biomarkers. Exosomes are derived from the endoplasmic reticulum and are widely distributed in body fluids such as blood, urine, and saliva. They contain a variety of DNAs and RNAs for intercellular communication, making them novel biomarkers. Biomarkers are analyzed by evaluating their physical properties such as size and concentration. The analysis of the physical properties, such as the diameter and concentration of biological samples for biomedical applications1–4a,b (e.g., biomarker detection in human serum), has evolved over decades. In the nascent stages, optical microscopy5 was used to analyze cells; however, this technique is time-consuming, and the results depend on the skill of the operator. Several samples can be accurately analyzed using commonly applied techniques such as flow cytometry and nanoparticle tracking analysis.6,7 However, these techniques require complex workflows and are not suitable for large-scale applications, rendering them unsuitable for realizing portable real-time in vitro diagnostics. As a promising solution to these problems, microfluidic lab-on-a-chip technologies have garnered considerable interest owing to their low cost, compactness, and capability for rapid response. In a lab-on-a-chip device, the entire process, including sample preparation, synthesis, and analysis, occurs over a single integrated chip.8–10 Numerous techniques have been developed to analyze biomarkers using microfluidic devices based on colorimetric, electrochemical, and fluorescence methods. Although these methods can rapidly detect samples, their detection limit is relatively lower than that of conventional automated devices. Moreover, the experimental setup of these methods is complex.
Microfluidic resistive pulse sensing techniques based on the Coulter principle11 can overcome these challenges owing to their simple operating principle; when a liquid containing a particle with voltage flows into the sensing area, the resistance of the particle changes the current, and the strength of the pulse is proportional to the particle size.12–16 Owing to its simple operation, microfluidic resistive pulse sensing is suitable for miniaturized, portable in vitro diagnosis systems. However, despite the advantages of conventional microfluidic resistive pulse sensing, the throughput is low because of the small sensing area, and spurious signals may be generated owing to the migration profile of the particles as they move across the microchannel. Hence, extensive research was conducted on Coulter counters, in which a nanopore membrane was used as the detector. Nanopores can be synthesized from biological materials17–21 and solid-state materials such as glass,22–24 poly(ethylene terephthalate),25,26 and silicon nitride membranes.27,28 To minimize the noise during experiments, nanopores can be fabricated so that their size is similar to that of the target particles. In addition, we can fabricate nanopores with a diameter of less than 100 nm, which is the appropriate size for detecting and analyzing nanometer-scale biomolecules, such as extracellular vesicles and DNA. However, this size is not suitable for detecting target particles of various sizes because the size of the nanopores depends on the size of the target particles.
In this study, we developed a microfluidic resistive pulse sensor chip consisting of multiple detection gates in the main channel with a single inlet and outlet to maximize the throughput while maintaining a simple workflow. Each detection gate has a step channel structure to ensure that the particles are in a single equilibrium position and isolation between particles through hydrodynamic effects29 in the proposed microchannel structure to enhance the signal detection accuracy. Polystyrene particles with a diameter of 200 nm and exosomes from MDA-MB-231 were used for the samples, and the proposed microfluidic chip can detect the physical properties of the biological samples such as exosomes with a high sensitivity to enable rapid and straightforward in vitro diagnosis of diseases.
Materials and methods
Device fabrication
The microchannel was fabricated using a soft lithography process. We used an SU-8 2005 photoresist to perform two-step photolithography for building the microchannel mold. The SU-8 photoresist was poured onto a silicon wafer. This framework was spin-coated at 3000 rpm for 30 s, soft-baked on a hot plate for 1 min at 95 °C, subjected to ultraviolet (UV) exposure for 9.5 s using an MA-6 aligner, hard-baked on a hot plate for 1 min at 95 °C, and allowed to develop in an SU-8 developer for ∼1 min. To fabricate the microchannel, polydimethylsiloxane (PDMS, Dow Corning) mixed with a curing agent in a 10:1 ratio was poured onto the microchannel mold and cured on a hot plate for 1 h at 50 °C; subsequently, it was peeled off from the microchannel mold.
To fabricate a sensing electrode, we performed photolithography for patterning the electrode on a glass substrate using DNR-300 L-40. After photolithography, a Ti/Au–metal source with a thickness of 100/1000 Å was deposited using e-beam evaporation equipment. After fabrication, the PDMS microchannel and electrode substrate were pretreated using a UV ozone cleaner for 6 min and bonded.
Sample preparation
Exosomes for biological application were obtained by purification using differential centrifugation from MDA-MB-231 cell cultures (American Type Culture Collection). The supernatants collected from the cell cultures were centrifuged at 300 × g for 3 min, 2500 × g for 25 min and 10000 × g for 30 min, respectively, at a temperature of 4 °C. The centrifugated culture was filtered by using 0.22 μm syringe filters, and the filtered supernatants were centrifuged again at 120000 × g for 90 min at 4 °C. The exosome pellets were resuspended with phosphate-buffered-saline 1X (PBS, Gibco) and centrifuged at 120000 × g for 90 min. After centrifugation, the supernatants were homogenized in PBS for additional analysis. The purity of exosomes from the cell culture is analyzed using NTA (Nanosight).
Experimental setup
To verify the counting and sizing of the microparticles, polystyrene beads were introduced into a diluted electrolyte (potassium chloride, Sigma Aldrich) solution to which 0.01% Tween 80 (Samchun) was added to prevent bead aggregation. The diameter of the polystyrene beads was 200 nm, and the exosomes from MDA-MB-231 were used as biological samples. The target samples were uniformly vortexed for dispersion with the electrolyte fluid. During the experiment, a DC power supply (Odacore) was used to apply voltage, and a syringe pump (Chemyx) was used to inject the solution containing the target beads into the detection gate at a flow rate of 1 μL min−1. The output signal was obtained using a digital oscilloscope (keysight), and the signal data were analyzed using a MATLAB code.
Device design
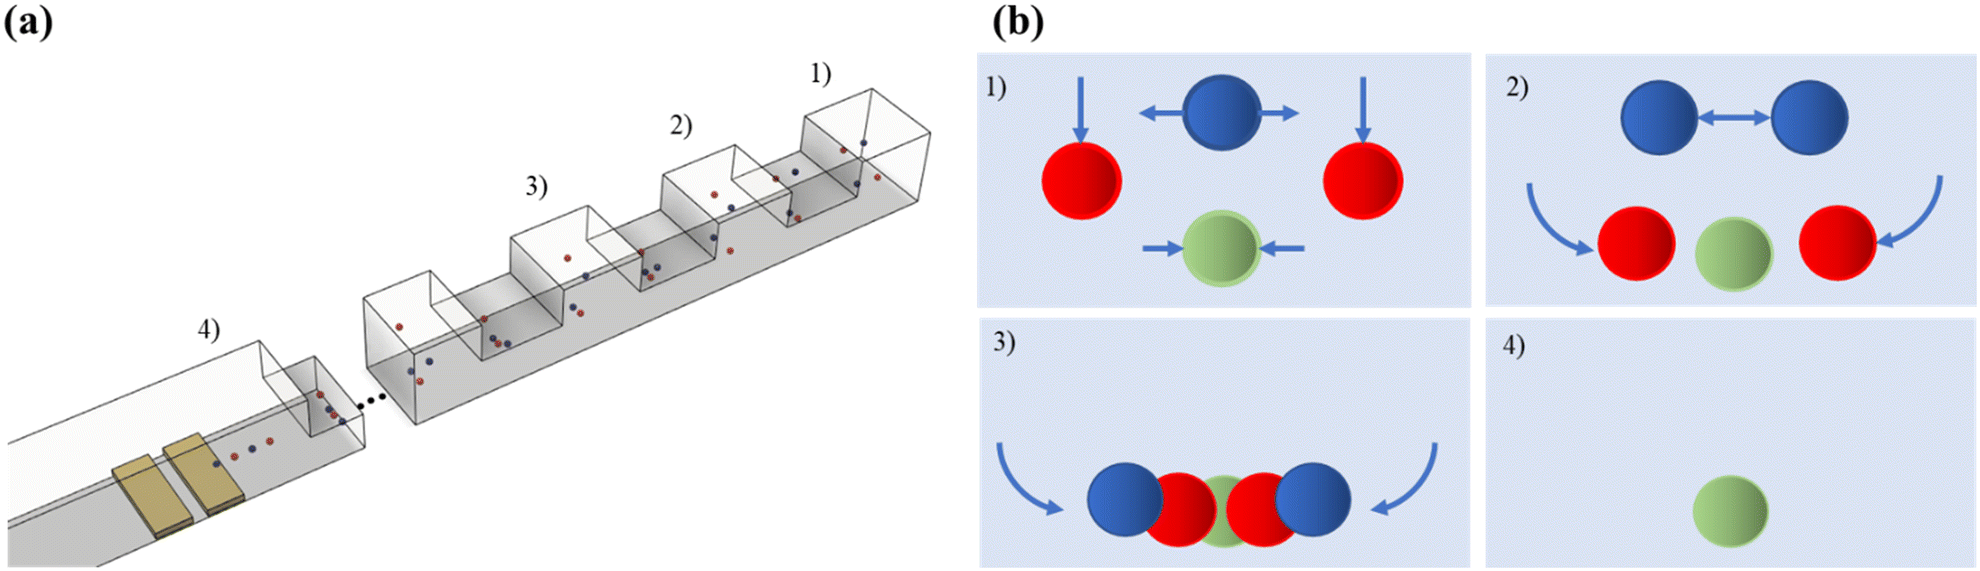
Fig. 1 shows the images of the proposed microfluidic resistive pulse-sensing chip. The device has a main channel with a single inlet and outlet for the sample and four narrow detection gates (width and height: 10 μm) at the center of the main channel.
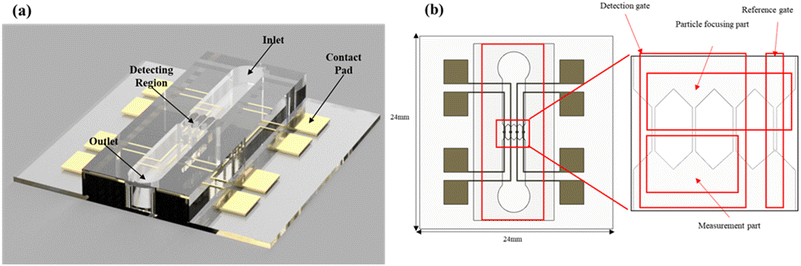 |
| | Fig. 1 (a) Schematic of the microfluidic resistive pulse sensor. (b) Top image of the microfluidic resistive pulse sensor. The detecting region consists of three detection gates and one gate, and each gate consists of particle-focusing and measurement parts. | |
Each detection gate has two parts: a particle-focusing part for hydrodynamic focusing and a measurement part for signal processing. Fig. 2 shows the structure of the particle-focusing part and the procedure. The cross section of the microchannel is designed as a series of step channels to focus the particle into a single equilibrium position34 for minimizing the differences in the output signals. The particle-focusing part has repeated square and rectangular regions with an aspect ratio of 0.5. In the square region, the particle migrates to four equilibrium positions owing to the interaction between the shear gradient lift force and the wall lift force, 0.6R (R is the hydraulic diameter) from the centerline on each side of the channel wall. When the particles traverse a rectangular region, the number of equilibrium positions changes from 4 to 2 at the long side of the channel, owing to a decrease in the shear gradient lift force induced by the blunted fluid velocity profile on the lateral side of the wall.35,36 The repetition of the square and rectangular shapes leads to the generation of a helical secondary flow, which focuses the particles into a single equilibrium position. The square and rectangular regions in the stepped channel have a height of 10 and 5 μm, respectively, and the step design is repeated for 30 cycles to maximize the helical secondary flow. The measurement part has four pairs of Ti/Au electrodes in each detection channel to apply voltage and measure the output signal. Each electrode pair simultaneously measures multiple channels to enhance the throughput. To minimize the measurement noise, one of the detection gates is operated as a reference gate; this part only measures the fluid signal without any target particles and does not have any outlet to the main channel. When an electrolyte without a target particle is injected into the main channel before measurement, the reference gate is only filled with the electrolyte. After the measurement, backpressure is generated owing to the lack of any outlet in the reference gate. Consequently, the electrolyte with the target particle does not enter the reference gate, and the signal for the electrolyte is processed in this gate. The change in the output resistance owing to the resistivity of the particle is measured using an electrode pair placed in each channel. An insulating structure is installed between each channel to avoid crosstalk with the neighboring electrodes during measurement. The multiple detection gates in the main single-channel structure have a single inlet and outlet, and no additional injection equipment is required. The output signal from each detection and reference gate is amplified using a differential amplifier, and these data are obtained using a data acquisition system; the size and concentration of the target particle is calculated through a custom-made MATLAB code, as shown in Fig. 3.
 |
| | Fig. 2 (a) Schematic of the microchannel in the particle focusing part and (b) the particle focusing procedure. The channel consists of a series of stepped channels to control the inertial focusing and secondary flow. | |
 |
| | Fig. 3 Schematic image of the working principle of microfluidic resistive pulse sensing. | |
Results and discussion
The working principle of microfluidic resistive pulse sensing based on Coulter's principle is shown in Fig. 4. Maxwell and Lord Rayleigh proposed a method to calculate the change in the resistance caused by the presence of particles in electrolyte solutions.30–33 The effective resistivity, which is the resistivity of the electrolyte solution containing particles, is represented as follows:| | 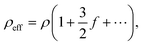 | (1) |
where ρ is the resistivity of the electrolyte solution without particles, and f is the fractional volume of the solution occupied by particles. The resistance of a cylindrical detection region with diameter D and length L can be defined as follows:| |  | (2) |
When the diameter of the target particle, d, is considerably smaller than D, f can be defined as| |  | (3) |
The resistance R′ of the detection region with a particle of diameter d can be determined by substituting eqn (1) and (3) into (2).| |  | (4) |
By modulating the resistance, the change in the resistance, ΔR, can be expressed as follows:| | 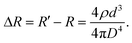 | (5) |
Therefore, the relative resistance can be determined using eqn (5) and (2) as| |  | (6) |
When constant current I is passed through the detection region, the relative resistance induces a decrease in the voltage applied across the detection region. This decrease can be expressed as shown in eqn (8).| |  | (7) |
| |  | (8) |
For the verification of the nanoparticle measurement using the proposed multi-gate microfluidic resistive pulse sensing, a comparison of the output signal with the reference signal was carried out. Fig. 5(a) shows the output signal of the microfluidic resistive pulse sensing with a sample of bare electrolyte. As shown in result, the range of output is from 0 to 4.23 × 10⁻⁷, which has a significantly lower range than that with 200 nm polystyrene particles, as shown in Fig. 5(b). The calculated size based on Fig. 5(a) is less than 40 nm, and it shows that the proposed microfluidic chip is applicable to biological nanoparticles larger than a diameter of 40 nm. For enhancing the sensitivity, focusing the target particle by helical secondary flow induced by step channels was performed in this work. In the case of larger particles, the helical secondary flow of the step channel cannot migrate the large particle. The particle focusing efficiency of the step channel in this work with dimensions of 10 μm × 10 μm decreases for particles larger than 2 μm, and the decrease of focusing efficiency induces diversity of particle positions in the detection gate which causes the decrease of sensitivity. Thus, it can be assumed that the proposed microfluidic resistive pulse sensing is applicable for nanoparticles with diameters from 40 nm to 2 μm.
 |
| | Fig. 4 Schematic diagram for the microfluidic resistive pulse sensing procedure. | |
 |
| | Fig. 5 Output signal of multi-gate microfluidic resistive pulse sensing (a) without the target particle and (b) with the 200 nm polystyrene particle. | |
Polystyrene bead measurement
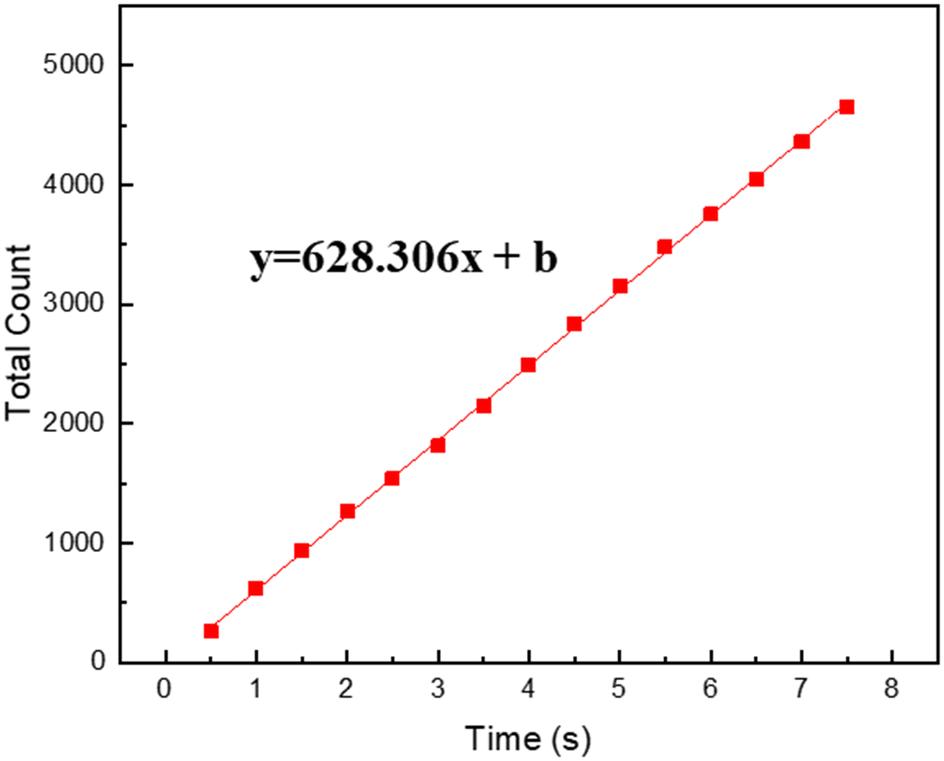
The variation in the resistance change versus time graph of each detection gate of the 200 nm polystyrene particle measurement is shown in Fig. 6, which is obtained from voltage traces on each sampling resistor. To calculate the total concentration of the 200 nm polystyrene particles, each measured resistive pulse signal is summated in every 0.5 s. According to the polystyrene particle reference datasheet, the size range of the 200 nm polystyrene particles is 200–300 nm, and the median diameter is 220 nm. Based on the reference datasheet, the range of the resistive peaks is calculated to be 0.0000157–0.000053, and the resistive peaks induced by the median diameter particles are 0.000021. The ranges of the measured peaks induced by the traversal of the 200 nm polystyrene particles were 0.00002–0.000084, 0.00002–0.000072, and 0.000018–0.000086 for detection channels 1–3, respectively. Compared to the range of peaks calculated from reference data, the measured range is slightly broader, but the median peak is similar to the reference peaks. The particle's position when traversing the detection gate might contribute to the difference in the measured range since the electric field in the detection gate applied from the electrode pair is proportional to the distance from the electrode, so the efficiency of the hydrodynamic focusing is crucial in this section. For the analysis of the physical properties of the target particle, size and concentration measurements are necessary. Fig. 7 shows the size distribution and concentration results of the 200 nm polystyrene particle measurement calculated using eqn (8). In the size distribution results, the median peak of measurement was 209 nm, which has a relative error of 5% with the reference datasheet with a median size of 220 nm. The calculated measurement concentration is 3.98 × 10¹⁰, which also has a slight error with the concentration from the reference datasheet. As noted in the introduction, this study's key objective is to analyse the size and concentration of target particles with high sensitivity. To analyse the efficiency of the hydrodynamic structure, we measured the microfluidic chip's total count. The main purpose of this structure is to isolate the target particle in a specific position of the detection gate for preventing the aggregation of the target particle. If the hydrodynamic structure can isolate polystyrene particles with high efficiency, the count number increases linearly since the number of particles traversing the detection gate is uniform. Fig. 8 shows the total count of the 200 nm polystyrene particle measurement. The measured plot is linearly fitted, the slope of the line was 628, and the measured total count scale is linear like a linearly fitted line. Furthermore, we compared the measurement result of a microfluidic chip with a conventional straight channel. Fig. 9 shows the output signal and the calculated size distribution results of 200 nm polystyrene particles using a microfluidic chip comprising the straight and the proposed channels. As shown in the figure, the output signal of the conventional straight channel was smaller than that of the proposed one. Since there is no hydrodynamic effect in the straight channel, the particle position when traversing the detection gate is varied, and the output signal is smaller when the particle is far from the electrode. The calculated median peak (126 nm) was smaller than that of the proposed one, and the results for the proposed channel were much closer to the reference datasheet. From this result, it can be assumed that the hydrodynamic structure of the detection gate can effectively isolate polystyrene particles uniformly on each measurement procedure. Moreover, the hydrodynamic structure of the detection gate might contribute to particle isolation, thereby measuring the size and concentration of the target particle with high sensitivity.
 |
| | Fig. 6 (a) Output signal of 200 nm polystyrene particle measurement, and (b) change of resistance in each detection gate using the proposed microfluidic chip. | |
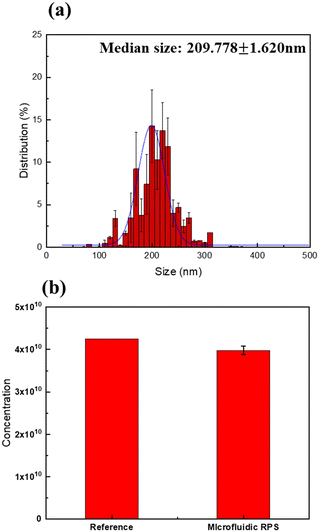 |
| | Fig. 7 The analyzed result of the 200 nm polystyrene particle measurement. (a) The size distribution result, with the median peak of the calculated result being 209 nm. (b) The concentration results, in comparison with the reference datasheet. | |
 |
| | Fig. 8 The total count of the proposed microfluidic chip in the 200 nm polystyrene particle measurement for analyzing efficiency of particle focusing and isolation. The counted particle in each 0.5 s was uniform, about 628. | |
 |
| | Fig. 9 The output signal and size distribution result of the (a) conventional straight channel and (b) proposed microchannel. | |
Exosome measurement (MDA-MB-231)
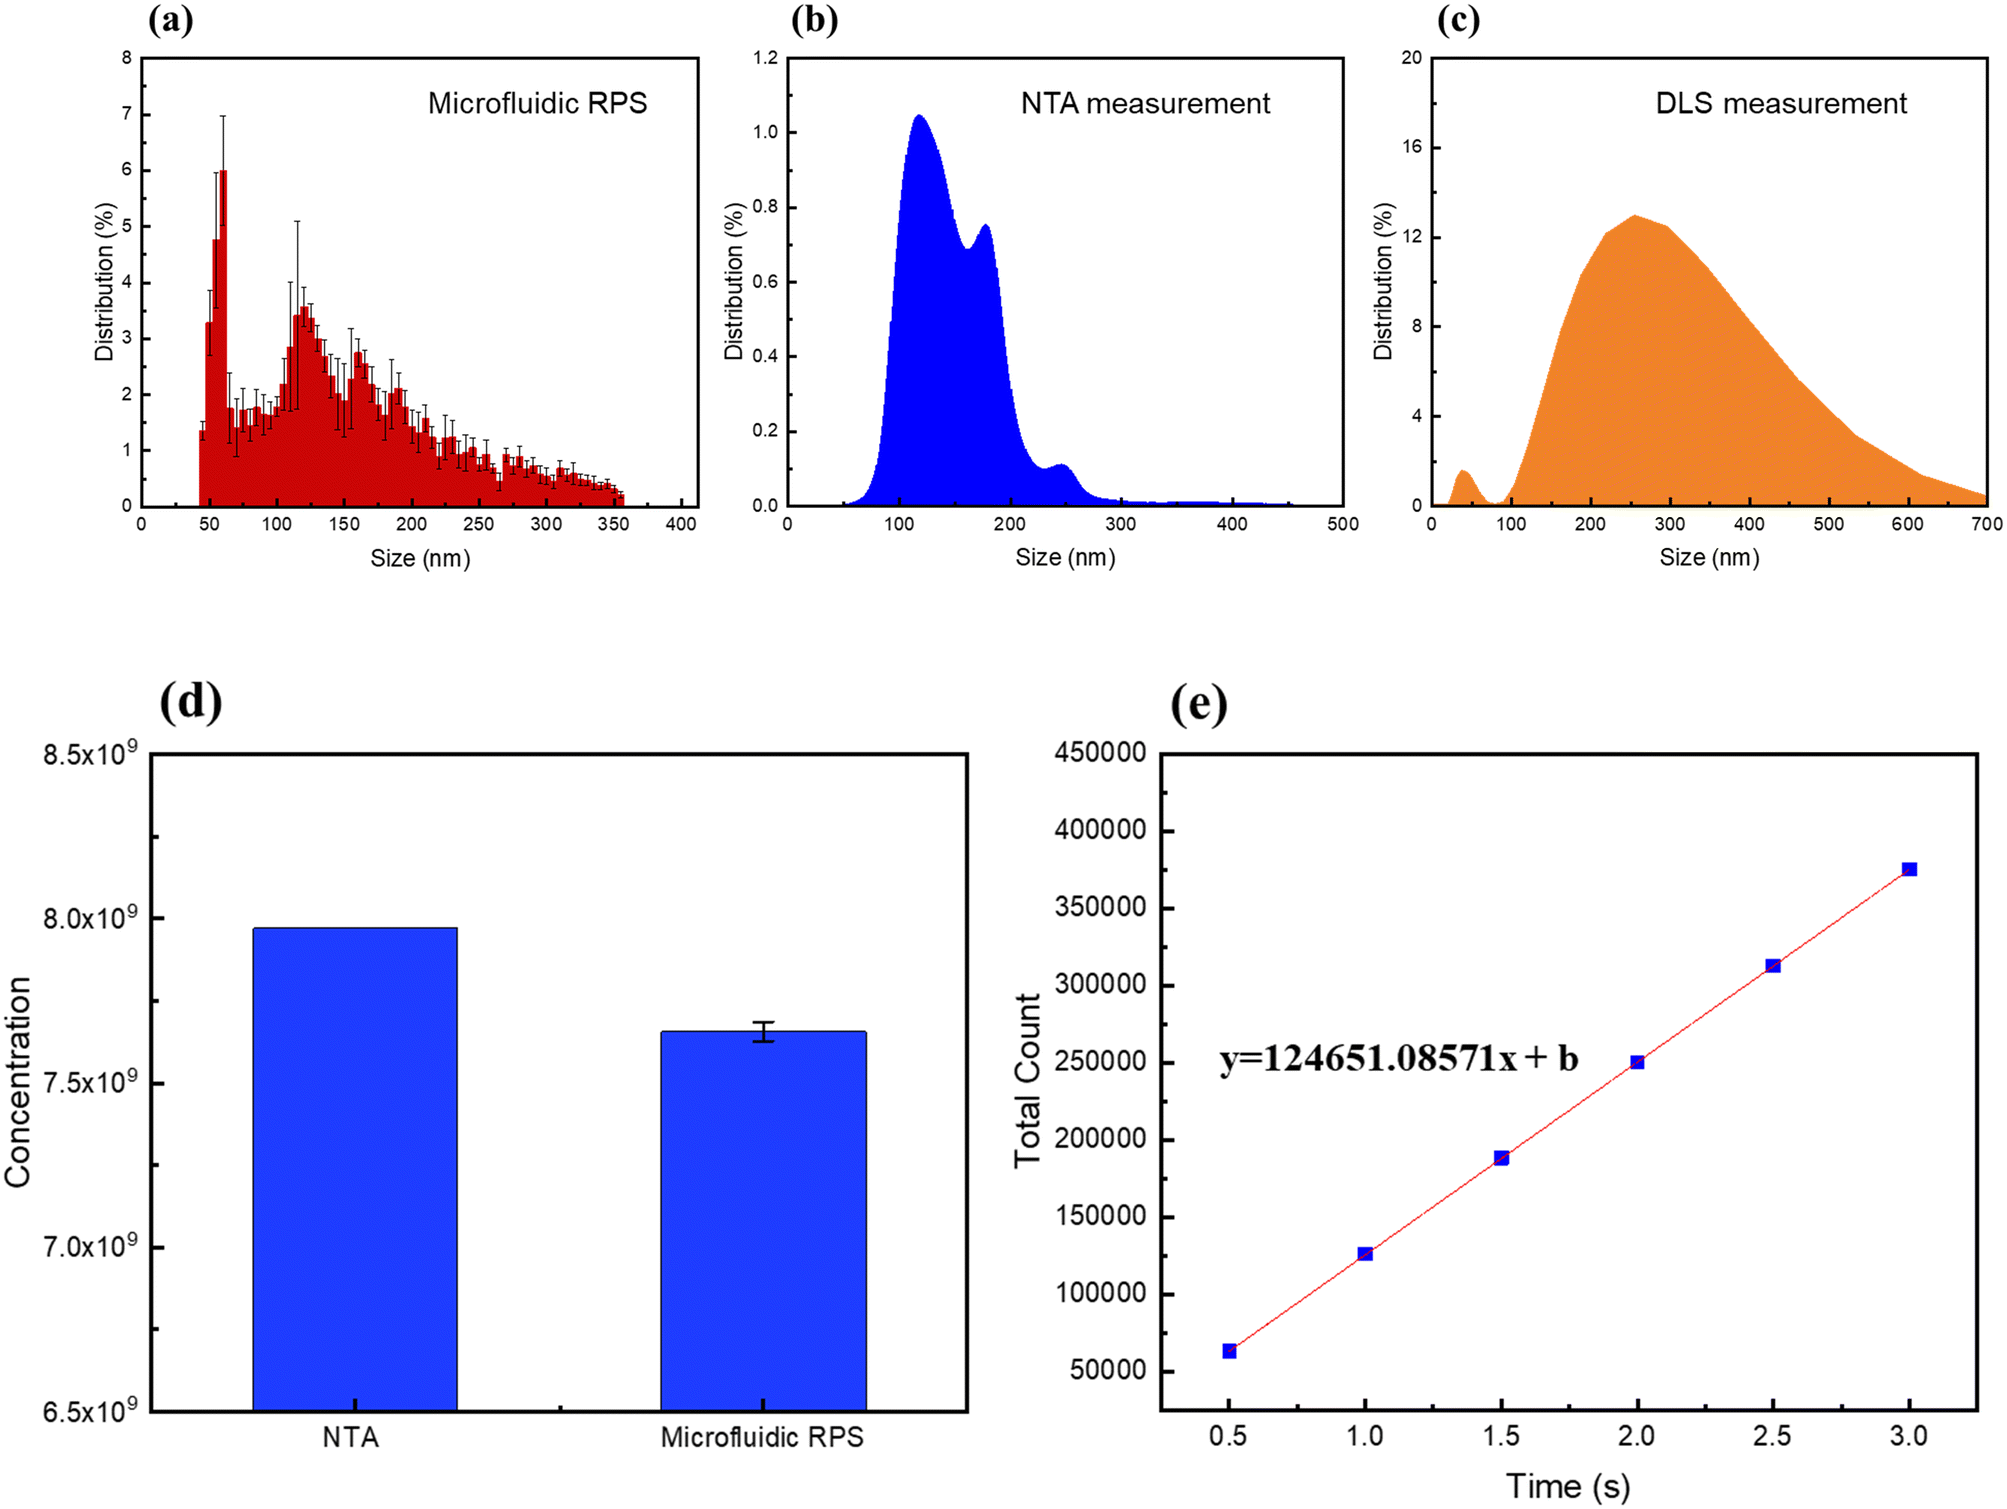
To verify the practical application of the proposed diagnosis for in vitro diagnosis, an experimental procedure of the biological samples is necessary. In this study, we used exosomes from MDA-MB-231, which is the breast cancer cell, for size and concentration analyses. Nanoparticle Tracking Analysis and Dynamic Light Scattering (DLS, Malvern) measurement were also performed to compare the size and concentration results and the concentration of the exosome samples. To confirm the reliability of the results, we compared the results obtained using the microfluidic chip with the NTA measurement results. Fig. 10(a)–(c) show the size distribution result of the EV measurement using the proposed microfluidic chip, as well as the NTA and DLS measurements. The peak sizes of the size distribution result obtained using the microfluidic chip were 60, 120, and 160 nm, those obtained using the NTA were 125 and 180 nm, and those using the DLS were 38 and 253.7 nm, respectively. In a range smaller than 100 nm, there are major peaks in the microfluidic chip results and DLS measurement, whereas peaks do not appear in the NTA measurement. Since DLS is suitable for small particles <20 nm such as proteins, the DLS measurement has a lower limit of detection than the NTA measurement. However, the overall size distribution results from the DLS measurement can be different since DLS has drawbacks due to the limitation of the working principle, which is based on intensity-based detection.37 The intensity of scattered light from the target particle is proportional to the square of the particle volume, so that the measurement of large particles can be different with the actual size. The overlapping and covering of exosome also can lead to different size distributions of the DLS result.38 The size distribution results of the NTA with a size of 50 to 100 nm can be attributed to two reasons: the limited resolution of the NTA equipment and the efficiency of the hydrodynamic effect. The detection limit of the NTA equipment depends on the scattered intensity of the target particle, which is proportional to the refractive indices of the target particle.39,40 In the case of exosomes, the refractive indices are estimated to be 1.34–1.37, which is relatively lower than those of the polystyrene particles. Hence, the limit of detection may be larger than 50 nm. Therefore, future work needs to be performed for verifying the distribution of exosomes with a diameter smaller than 100 nm. To examine the particle-focusing efficiency, in the case of the polystyrene particle measurement, the analysis of the count rate and concentration is necessary. Fig. 10 shows the count rate and concentration results of the exosome measurement. The number of counted exosomes in each 0.5 s interval increased linearly and had a slope of 124651. This means that the exosome is uniformly counted at ∼61231 per 0.5 s; hence, we can assume that the target exosomes are focused and isolated uniformly because of the hydrodynamic effect of the channel. The concentration of exosome was measured to be 7.66 × 10⁹, and the difference with the NTA measurement was less than 5%. Thus, it is clear that the hydrodynamic effect of the channel prevents particle aggregation, and the proposed microfluidic chip detects the size and concentration of exosomes with very high sensitivity.
 |
| | Fig. 10 The measurement result of exosome application and the size distribution of the (a) proposed microfluidic chip. (b) NTA measurement. (c) DLS measurement. (d) The concentration result calculated using the proposed microfluidic chip compared with the NTA result. (e) The total count of the measured exosomes during the experiment. | |
Conclusions
This study established a high-throughput microfluidic resistive pulse sensing with a multi-detection gate for submicron and biological sample analysis. The proposed microfluidic chip comprises three detection gates and one reference gate in a single main channel for measuring target particles through simultaneous detection in multiple gates with a simple operational procedure. By introducing the reference gate and modulating the structure of detection gates for focusing and isolating target particles via hydrodynamic effects, the measurement noise can be effectively eliminated, thereby enhancing the signal-to-noise ratio. Experiments were conducted using polystyrene particles with diameters of 200 nm and exosomes from MDA-MB-231, and the measured size distribution and concentration were similar to the actual size distribution and concentration of both types of target particles with an error smaller than 5%, respectively. The proposed sensor can detect nanometre-sized target particles without decreasing the size of the sensing region and represents a rapid and straightforward platform for analysing submicron biomarkers with different sizes and concentrations. Thus, the proposed microfluidic chip can be effectively employed for in vitro diagnosis platforms.
Author contributions
J. S. K. and S. Y. K. performed chip design and data analysis. J. Y. L., S. D. K. and D. Y. K. performed the experiments. H. K., N. J. and J. W. performed the sample preparation. M. H. and S. H. K. provided suggestions on data analysis and wrote the paper.
Conflicts of interest
There are no conflicts to declare.
Acknowledgements
This research was supported by the Bio &Medical Technology Development Program of the National Research Foundation (NRF) funded by the Ministry of Science &ICT (2017M3A9G8083382), the BK21 FOUR project funded by the Ministry of Education, Korea (4199990113966), the Basic Science Research Program through the National Research Foundation of Korea (NRF) funded by the Ministry of Education (2022R1A6A3A01087544) and the Korea Innovation Foundation (INNOPOLIS) grant funded by the Korea government (MSIT) (2020-DD-UP-0348).
Notes and references
- Z. Wang, X. Wang, S. Liu, J. Yin and H. Wang, Fluorescently imaged particle counting immunoassay for sensitive detection of DNA modifications, Anal. Chem., 2010, 82(23), 9901–9908, DOI:10.1021/ac102416f.
- J. G. Barnard, S. Singh, T. W. Randolph and J. F. Carpenter, Subvisible particle counting provides a sensitive method of detecting and quantifying aggregation of monoclonal antibody caused by freeze-thawing: insights into the roles of particles in the protein aggregation pathway, J. Pharm. Sci., 2011, 100(2), 492–503, DOI:10.1002/jps.22305.
- H. Benech, F. Théodoro, A. Herbet, N. Page, D. Schlemmer, A. Pruvost, J. Grassi and J. R. Deverre, Peripheral blood mononuclear cell counting using a DNA-detection-based method, Anal. Biochem., 2004, 330(1), 172–174 CrossRef CAS PubMed.
-
(a) B. Huang, H. K. Wu, D. Bhaya and A. Grossman, Science, 2007, 315, 81–84, DOI:10.1016/j.ab.2004.03.015;
(b) B. Huang, H. Wu, D. Bhaya, A. Grossman, S. Granier, B. K. Kobilka and R. N. Zare, Counting low-copy number proteins in a single cell, Science, 2007, 315(5808), 81–84, DOI:10.1126/science.1133992.
- K. Goda, A. Ayazi, D. R. Gossett, J. Sadasivam, C. K. Lonappan, E. Sollier, A. M. Fard, S. C. Hur, J. Adam, C. Murray, C. Wang, N. Brackbill, D. Di Carlo and B. Jalali, High-throughput single-microparticle imaging flow analyzer, Proc. Natl. Acad. Sci. U. S. A., 2012, 109(29), 11630–11635, DOI:10.1073/pnas.1204718109.
- A. Adan, G. Alizada, Y. Kiraz, Y. Baran and A. Nalbant, Flow cytometry: basic principles and applications, Crit. Rev. Biotechnol., 2017, 37(2), 163–176, DOI:10.3109/07388551.2015.1128876.
- Y. Huang, B. Liang and X. Chen, Exosomal circular RNA circ_0074673 regulates the proliferation, migration, and angiogenesis of human umbilical vein endothelial cells via the microRNA-1200/MEOX2 axis, Bioengineered, 2021, 12(1), 6782–6792, DOI:10.1080/21655979.2021.1967077.
- E. Weatherall and G. R. Willmott, Conductive and biphasic pulses in tunable resistive pulse sensing, J. Phys. Chem. B, 2015, 119(16), 5328–5335, DOI:10.1021/acs.jpcb.5b00344.
- G. M. Whitesides and A. D. Stroock, Flexible methods for microfluidics, Phys. Today, 2001, 54(6), 42–48, DOI:10.1063/1.1387591.
- J. C. McDonald and G. M. Whitesides, Poly(dimethylsiloxane) as a material for fabricating microfluidic devices, Acc. Chem. Res., 2002, 35(7), 491–499, DOI:10.1021/ar010110q.
- D. J. Beebe, G. A. Mensing and G. M. Walker, Physics and applications of microfluidics in biology, Annu. Rev. Biomed. Eng., 2002, 4(1), 261–286, DOI:10.1146/annurev.bioeng.4.112601.125916.
- J. Menestrina, C. Yang, M. Schiel, I. Vlassiouk and Z. S. Siwy, Charged particles modulate local ionic concentrations and cause formation of positive peaks in resistive-pulse-based detection, J. Phys. Chem. C, 2014, 118(5), 2391–2398, DOI:10.1021/jp412135v.
- J. C. Maxwell, 1904, A treatise on electricity and magnetism, 3rd ed. Clarendon: Oxford, Vol. 1(14) Zheng S, Liu M, Tai YC. Micro coulter counters with platinum black electroplated electrodes for human blood cell sensing, Biomed. Microdevices, 2008, 10(2), 221–231, DOI:10.1007/s10544-007-9128-5.
- H. Zhang, C. H. Chon, X. Pan and D. Li, Methods for counting particles in microfluidic applications, Microfluid. Nanofluid., 2009, 7, 739–749, DOI:10.1007/s10404-009-0493-7.
- A. V. Jagtiani, J. Carletta and J. Zhe, A microfluidic multichannel resistive pulse sensor using frequency division multiplexing for high throughput counting of micro particles, J. Micromech. Microeng., 2011, 21(6), 065004, DOI:10.1088/0960-1317/21/6/065004.
- A. L. Richards, M. D. Dickey, A. S. Kennedy and G. D. Buckner, Design and demonstration of a novel micro-Coulter counter utilizing liquid metal electrodes, J. Micromech. Microeng., 2012, 22(11), 115012, DOI:10.1088/0960-1317/22/11/115012.
- L. Song, M. R. Hobaugh, C. Shustak, S. Cheley, H. Bayley and J. E. Gouaux, Structure of staphylococcal α-hemolysin, a heptameric transmembrane pore, Science, 1996, 274(5294), 1859–1866, DOI:10.1126/science.274.5294.1859.
- E. C. Yusko, J. M. Johnson, S. Majd, P. Prangkio, R. C. Rollings, J. Li, J. Yang and M. Mayer, Controlling protein translocation through nanopores with bio-inspired fluid walls, Nat. Nanotechnol., 2011, 6(4), 253–260, DOI:10.1038/nnano.2011.12.
- K. Göpfrich, C. V. Kulkarni, O. J. Pambos and U. F. Keyser, Lipid nanobilayers to host biological nanopores for DNA translocations, Langmuir, 2013, 29(1), 355–364, DOI:10.1021/la3041506.
- R. Hemmler, G. Böse, R. Wagner and R. Peters, Nanopore unitary permeability measured by electrochemical and optical single transporter recording, Biophys. J., 2005, 88(6), 4000–4007, DOI:10.1529/biophysj.104.058255.
- M. Pastoriza-Gallego, L. Rabah, G. Gibrat, B. Thiebot, F. G. van der Goot, L. Auvray, J. M. Betton and J. Pelta, Dynamics of unfolded protein transport through an aerolysin pore, J. Am. Chem. Soc., 2011, 133(9), 2923–2931, DOI:10.1021/ja1073245.
- J. Kudr, S. Skalickova, L. Nejdl, A. Moulick, B. Ruttkay-Nedecky, V. Adam and R. Kizek, Fabrication of solid-state nanopores and its perspectives, Electrophoresis, 2015, 36(19), 2367–2379, DOI:10.1002/elps.201400612.
- J. Sha, W. Si, W. Xu, Y. Zou and Y. Chen, Glass capillary nanopore for single molecule detection, Sci. China: Technol. Sci., 2015, 58(5), 803–812, DOI:10.1007/s11431-015-5779-2.
- L. J. Steinbock, O. Otto, C. Chimerel, J. Gornall and U. F. Keyser, Detecting DNA folding with nanocapillaries, Nano Lett., 2010, 10(7), 2493–2497, DOI:10.1021/nl100997.
- M. Ali, B. Yameen, R. Neumann, W. Ensinger, W. Knoll and O. Azzaroni, Biosensing and supramolecular bioconjugation in single conical polymer nanochannels. Facile incorporation of biorecognition elements into nanoconfined geometries, J. Am. Chem. Soc., 2008, 130(48), 16351–16357, DOI:10.1021/ja8071258.
- J. Wang and C. R. Martin, A new drug-sensing paradigm based on ion-current rectification in a conically shaped nanopore, Nanomedicine, 2008, 3(1), 13–20, DOI:10.2217/17435889.3.1.13.
- H. Kwok, K. Briggs and V. Tabard-Cossa, Nanopore fabrication by controlled dielectric breakdown, PLoS One, 2014, 9(3), e92880, DOI:10.1371/journal.pone.0092880.
- K. Briggs, H. Kwok and V. Tabard-Cossa, Automated Fabrication of 2-nm Solid-State nanopores for Nucleic Acid Analysis, Small, 2014, 10(10), 2077–2086, DOI:10.1002/smll.20130360.
- M. J. Kennedy, S. J. Stelick, L. G. Sayam, A. Yen, D. Erickson and C. A. Batt, Hydrodynamic optical alignment for microflow cytometry, Lab Chip, 2011, 11(6), 1138–1143, 10.1039/C0LC00500B.
- W. R. Smythe, Flow around a spheroid in a circular tube, Phys. Fluids, 1964, 7(5), 633–638, DOI:10.1063/1.1711260.
- R. W. DeBlois, C. P. Bean and R. K. A. Wesley, Electrokinetic measurements with submicron particles
and pores by the resistive pulse technique, J. Colloid Interface Sci., 1977, 61(2), 323–335, DOI:10.1016/0021-9797(77)90395-2.
- E. C. Gregg and K. D. Steidley, Electrical counting and sizing of mammalian cells in suspension, Biophys. J., 1965, 5(4), 393–405, DOI:10.1016/S0006-3495(65)86724-8.
-
O. A. Saleh, A novel resistive pulse sensor for biological measurements, Princeton University, 2003 Search PubMed.
- A. J. Chung, D. R. Gossett and D. Di Carlo, Three dimensional, sheathless, and high-throughput microparticle inertial focusing through geometry-induced secondary flows, Small, 2013, 9(5), 685–690, DOI:10.1002/smll.201202413.
- D. Di Carlo, J. F. Edd, K. J. Humphry, H. A. Stone and M. Toner, Particle segregation and dynamics in confined flows, Phys. Rev. Lett., 2009, 102(9), 094503, DOI:10.1103/PhysRevLett.102.094503.
- D. R. Gossett, H. T. Tse, J. S. Dudani, K. Goda, T. A. Woods, S. W. Graves and D. Di Carlo, Inertial manipulation and transfer of microparticles across laminar fluid streams, Small, 2012, 8(17), 2757–2764, DOI:10.1002/smll.201200588.
-
B. J. Berne and R. Pecora, Dynamic light scattering: with applications to chemistry, biology, and physics, Dover Publications, Dover edn, 2000 Search PubMed.
-
R. Xu, Particle characterization: Light scattering methods, Kluwer Academic, 2001 Search PubMed.
-
C. F. Bohren and D. R. Huffman, Absorption and scattering by a sphere, in Absorption and scattering of light by small particles, ed. C. F. Bohren and D. R. Huffman, Wiley-VCH Verlag GmbH, Weinheim, 2007, pp. 83–129 Search PubMed.
- R. A. Dragovic, C. Gardiner, A. S. Brooks, D. S. Tannetta, D. J. Ferguson, P. Hole, B. Carr, C. W. Redman, A. L. Harris, P. J. Dobson, P. Harrison and I. L. Sargent, Sizing and phenotyping of cellular vesicles using Nanoparticle Tracking Analysis, Nanomed.: Nanotechnol., Biol. Med., 2011, 7(6), 780–788, DOI:10.1016/j.nano.2011.04.003.
Footnote |
| † These authors contributed equally to this work. |
|
| This journal is © The Royal Society of Chemistry 2023 |
Click here to see how this site uses Cookies. View our privacy policy here. 
 Open Access Article
 This Open Access Article is licensed under a Creative Commons Attribution-Non Commercial 3.0 Unported Licence
 ,
Soon Yeol
Kwon†
,
Jae Yong
Lee
,
Seung Deok
Kim
,
Da Ye
Kim
,
Hyunjun
Kim
,
Noah
Jang
,
Jiajie
Wang
,
Maeum
Han
* and
Seong Ho
Kong
*
,
Soon Yeol
Kwon†
,
Jae Yong
Lee
,
Seung Deok
Kim
,
Da Ye
Kim
,
Hyunjun
Kim
,
Noah
Jang
,
Jiajie
Wang
,
Maeum
Han
* and
Seong Ho
Kong
*