 Open Access Article
Laser-assisted protein micropatterning in a thermoplastic device for multiplexed prostate cancer biomarker detection†
André
Kling
,
Lorin
Dirscherl
and
Petra S.
Dittrich
 *
*
Department of Biosystems Science and Engineering, ETH Zurich, Mattenstrasse 26, CH-4058 Basel, Switzerland. E-mail: petra.dittrich@bsse.ethz.ch
First published on 4th January 2023
Abstract
Immunoassays are frequently used for analysis of protein biomarkers. The specificity of antibodies enables parallel analysis of several target proteins, at the same time. However, the implementation of such multiplexed assays into cost-efficient and mass-producible thermoplastic microfluidic platforms remains difficult due to the lack of suitable immobilization strategies for different capture antibodies. Here, we introduce and characterize a method to functionalize the surfaces of microfluidic devices manufactured in the thermoplastic material cyclic olefin copolymer (COC) by a rapid prototyping process. A laser-induced immobilization process enables the surface patterning of anchor biomolecules at a spatial resolution of 5 μm. We employ the method for the analysis of prostate cancer associated biomarkers by competitive immunoassays in a microchannel with a total volume of 320 nL, and successfully detected the proteins PSA, CRP, CEA and IGF-1 at clinically relevant concentrations. Finally, we also demonstrate the simultaneous analysis of three markers spiked into undiluted human plasma. In conclusion, this method opens the way to transfer multiplexed immunoassays into mass-producible microfluidic platforms that are suitable for point of care applications.
Introduction
Liquid biopsies enable the non-invasive diagnosis of cancer and monitoring of the disease during treatment, and are convenient for the patient.1 Blood samples from cancer patients hold valuable information that can indicate the progression, regression or relapse of a tumour. Target analytes include circulating tumour cells (CTCs), extracellular vesicles (EVs), and cell-free tumour-derived deoxyribonucleic acids (ctDNAs).2–4 Proteomic biomarkers in the blood, that are either directly secreted from the cancerous tissue or general indicators for inflammation in the body, complement the diagnosis.5Microfluidic devices provide the possibility to perform a multiplexed analysis of liquid biopsy samples. The simultaneous measurement of different analytes either by the patients at home or by doctors in the clinics is referred to as multiplexed point-of-care testing (xPOCT).6,7 In recent years, microfluidic methods have enabled the implementation of multiplexed analysis of cancer biomarkers, mostly on the basis of sandwich immunoassays with optical or electrochemical detection systems.8–10 For example, Jones et al. presented an electrochemical platform that is able to detect up to 8 different markers for prostate cancer simultaneously.11 While most studies try to identify overexpressed proteins of diseased cells, others include certain metabolites to improve the diagnostic and prognostic accuracy.12,13
Immunoassays on microfluidic platforms for a single analyte are well established, however, the multiplexed analysis requires the discrimination of the formed antigen–antibody complexes. This is accomplished either by use of differently tagged detection antibodies or site-specific immobilization of the capture antibodies.8 For the latter approach, biomolecule patterning techniques such as micro contact printing (μCP) were established for site-specific patterning of proteins and antibodies on glass surfaces,14 but require a bonding procedure that is compatible with the already printed molecules. Alternatively, microchannel networks were used for delivery of the antibodies to defined areas.15–17 In addition, light-induced patterning techniques that are applied in readily fabricated microchannel networks, enable multiplexing, gradient formation and 3D patterning.18,19 Despite the great success of all these methods, they all pose restrictions to the fabrication, chip material and design, setup complexity and readout.
Besides the need for multiplexed analysis, the choice of material for microfluidic point-of-care devices is a very important aspect to consider. Microfluidic chips in research labs are frequently fabricated in polydimethylsiloxane (PDMS) by soft lithography using established and facile prototyping procedures for rapid prototyping. However, PDMS is not the material of choice for commercialization due to its high cost, the absorption of small hydrophobic molecules (i.e. potential biomarkers), unstable control of surface properties, and the lack of upscaling the manufacturing.20 Chemically inert thermoplastic materials, such as polystyrene (PS), poly(methyl methacrylate) (PMMA) or cyclic olefin copolymer (COC) on the other hand provide a cheap alternative. Microdevices made out of thermoplastics can be fabricated in large quantities in routine processes such as injection moulding or thermal imprinting.
In our here presented study, we have chosen COC, because it offers advantageous properties for sensitive fluorescence detection such as a high transparency and very low auto-fluorescence. To enable the initial development and fast optimization of the chip design in a research laboratory before production can be upscaled, we introduce a versatile manufacturing protocol that facilitates rapid prototyping of COC devices.
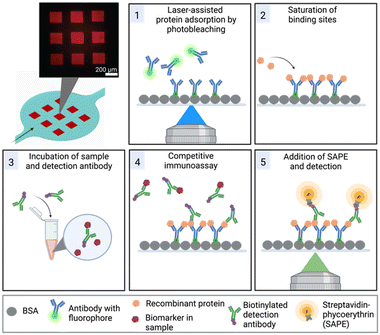
Furthermore, we have overcome the challenge of surface functionalization by adopting a method referred to as laser-assisted protein adsorption by photobleaching (LAPAP). The principle of LAPAP has been introduced before,21–23 but up to now, it has not been demonstrated for a concrete application. In LAPAP, a dye molecule is bleached upon exposure to laser light. The formed reactive radical binds rapidly to a bovine serum albumin (BSA)-coated surface. This process is defined by the laser light, hence the use of focused light results in immobilization of the dye molecule with a resolution of a few micrometres. To exploit this method for realization of multiplexed immunoassays, we used antibodies tagged with dye molecules, and patterned up to three different antibodies on defined areas in a single microfluidic platform (Fig. 1).
We demonstrate the utilization of the platform for the detection of biomarkers for prostate cancer, both in buffer and in spiked blood plasma. Prostate carcinoma remains to be one of the leading causes of death amongst men.24 For early diagnosis, the current gold standard is the detection of a protein named prostate-specific antigen (PSA). However, the use of PSA as the only biomarker is heavily debated.25 The main critique is the low specificity and a corresponding high number of false positive biopsies for men with an elevated serum PSA level. The lack of specificity of a single marker can be overcome by observing a panel of multiple biomarkers.26,27 Here, we focus on the measurement of serum-derived PSA, insulin-like growth factor 1 (IGF-1),28,29 carcinoembryonic antigen-related cell adhesion molecule 5 (CEA)30 and C-reactive protein (CRP).31 The combined analysis of PSA and CRP as diagnostic markers together with IGF-1 and CEA as prognostic markers can potentially improve the diagnosis and treatment surveillance of prostate cancer.
Materials and methods
Chemicals and reagents
Cyclic olefin copolymer foil and microscopy slides were acquired from microfluidic ChipShop GmbH, Germany. Sylgard 184 silicone elastomer kit was purchased from Dow Inc., USA. Cyclohexane and perfluorooctyl trichlorosilane were acquired from Sigma Aldrich, USA. Acetone, SU8-3025 photoresist, mr-Dev 600 developer, OrmoStamp and OrmoPrime were purchased from micro resist technology GmbH, Germany. Dulbecco's phosphate buffered saline (PBS), Invitrogen 10× universal assay buffer and Invitrogen ProcartaPlex 10× wash buffer reagents were purchased from ThermoFisher Scientific, USA. Additionally, a list of the employed immunoassay biomolecules is presented in ESI.†Chip fabrication
We established a rapid prototyping process to replicate the microchannel structures by thermal imprinting from a SU-8 photoresist master (ESI† Fig. S1). Therefore, SU8 3025 is spin coated at 3000 rpm on a 4-inch silicon wafer. After soft bake, the resist is exposed through a foil mask with UV light (i-line) at a dose of 200 mJ cm−2. Subsequently, a 3 min post exposure bake is conducted followed by a development for 6 min in a mr-Dev 600 developer bath. After a hard bake the master mould is silanized with perfluorooctyl trichlorosilane (PFOTS). From this initial master mould, a positive replica is made out of PDMS. Therefore, PDMS curing agent and base polymer are mixed in a 1![[thin space (1/6-em)]](https://www.rsc.org/images/entities/char_2009.gif) :
:![[thin space (1/6-em)]](https://www.rsc.org/images/entities/char_2009.gif) 10 ratio, poured on the master mould and cured at 80 °C for 1 h. This intermediate mould is then also silanized with PFOTS. The positive mould is subsequently, transferred to a heat resistant stamp made out of OrmoStamp resist. A glass wafer is primed by spin coating OrmoPrime at 4000 rpm for 60 s followed by a hardbake at 150 °C for 5 min. For the transfer of the structures, the OrmoStamp resist is sandwiched between the silanized PDMS mould and the primed glass wafer. After UV curing of the resist, the glass wafer carrying the negative structure from the master mould can be released, hard baked and also silanized with PFOTS. The stamp is used to imprint the channels into COC8007 foils with a glass transition temperature of 78 °C and a thickness of 240 μm for 3 min at 130 °C at 6 bar using a compact nanoimprint (CNI) tool (NIL Technology, Denmark). Finally, the imprinted foils are diced into a microscopy slide format. Solvent-assisted bonding is used to seal the channels with a 2 mm thick COC microscopy slide with incorporated access holes (Ø 0.8 mm). The microscopy slides are immersed in a mixture of acetone and cyclohexane (1
10 ratio, poured on the master mould and cured at 80 °C for 1 h. This intermediate mould is then also silanized with PFOTS. The positive mould is subsequently, transferred to a heat resistant stamp made out of OrmoStamp resist. A glass wafer is primed by spin coating OrmoPrime at 4000 rpm for 60 s followed by a hardbake at 150 °C for 5 min. For the transfer of the structures, the OrmoStamp resist is sandwiched between the silanized PDMS mould and the primed glass wafer. After UV curing of the resist, the glass wafer carrying the negative structure from the master mould can be released, hard baked and also silanized with PFOTS. The stamp is used to imprint the channels into COC8007 foils with a glass transition temperature of 78 °C and a thickness of 240 μm for 3 min at 130 °C at 6 bar using a compact nanoimprint (CNI) tool (NIL Technology, Denmark). Finally, the imprinted foils are diced into a microscopy slide format. Solvent-assisted bonding is used to seal the channels with a 2 mm thick COC microscopy slide with incorporated access holes (Ø 0.8 mm). The microscopy slides are immersed in a mixture of acetone and cyclohexane (1![[thin space (1/6-em)]](https://www.rsc.org/images/entities/char_2009.gif) :
:![[thin space (1/6-em)]](https://www.rsc.org/images/entities/char_2009.gif) 1) for 45 s blow dried and brought into contact with the imprinted channel structures. The channels are sealed with a pressure of 3 bar for 5 min. A chip-to-world connection is achieved by press fitting dispense tips (Ø 0.82 mm) with a luer fitting (Nordson EFD, USA) into the access holes. Flow through the channel is applied with a syringe pump (Cetoni, Germany) in withdraw mode.
1) for 45 s blow dried and brought into contact with the imprinted channel structures. The channels are sealed with a pressure of 3 bar for 5 min. A chip-to-world connection is achieved by press fitting dispense tips (Ø 0.82 mm) with a luer fitting (Nordson EFD, USA) into the access holes. Flow through the channel is applied with a syringe pump (Cetoni, Germany) in withdraw mode.
Surface functionalization
Prior to the laser-assisted surface functionalization the microchannels are filled with a 3% (w/v) solution of BSA in PBS and incubated for 1 h at 4 °C. Just before introducing the desired anchor-dye conjugate the channels are washed with PBS for 10 min at 1 μL min−1. Subsequently, the anchor-dye conjugate is introduced to the channel for 5 min at 1 μL min−1 and constantly supplied at the indicated flow rate. The use of a laser scanning confocal microscope (SP8, Leica Microsystems, Germany) provided the sufficient control of the bleaching and quantification of surface bound molecules. For the bleaching a 10× NA 0.3 objective is used with a set resolution of 1024 × 1024 pixels and the laser was scanned in bidirectional mode at 200 Hz. Thus, the applied bleaching time was adjusted with the number of line and frame averages per spot.LAPAP characterization
For the investigation of the resolution and the applied LAPAP parameters biotin–FITC, goat-anti-rabbit IgG TRITC and rabbit anti-mouse IgG FITC were introduced to the channel and bleached while varying either the bleaching time, anchor-conjugate concentration, flow rate or laser power. Except the investigated parameter the other settings were fixed to a bleaching time of 15 min, an anchor-dye concentration of 50 μg mL−1 or 300 μg mL−1 for biotin–FITC or IgGs, respectively, a flowrate of 0.25 μL min−1 and a laser power of 30%. Upon a subsequent washing step of 15 min at 1 μL min−1 with 1% BSA in PBS solution the biotin patterned surfaces were labelled with 200 ng mL−1 streptavidin–phycoerythrin (SAPE) for 15 min at 0.25 μL min−1. 10 μg mL−1 mouse anti-CD3 Alexa Fluor 647 or 10 μg mL−1 rabbit anti-mouse IgG FITC were introduced to the channel for 45 min at 0.25 μL min−1 to quantify rabbit anti-mouse IgGs and goat anti-rabbit IgGs on the surface.Multiplexing
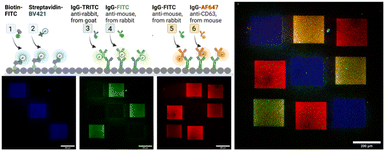
Within the same chamber three squares (200 × 200 μm) each of biotin–FITC, goat anti-rabbit IgG TRITC and rabbit anti-mouse IgG FITC were consecutively functionalized for 15 min. During bleaching of the anti-mouse IgGs previously immobilized regions with anti-rabbit IgG are labelled. Subsequently, the channel was washed and a mixture of 200 ng mL−1 Brilliant Violet 421 streptavidin conjugate and 10 μg mL−1 mouse anti-CD3 Alexa Fluor 647 antibody was introduced to label the patterned proteins.Competitive immunoassays
Different competitive cancer biomarker assays are implemented by tag-specific anchor antibodies patterned on the channel surface, each binding certain recombinant competitor proteins. Again 200 × 200 μm squares are patterned on the BSA coated channel surface. 300 μg mL−1 rabbit anti 6× polyhistidine (His)-tag antibodies, rabbit anti glutathione S-transferase (GST)-tag antibodies or rabbit anti DYKDDDDK (FLAG)-tag antibodies in PBS are introduced to the channel for 5 min at 1 μL min−1 and bleached for 34 min while supplying unbleached molecules at 0.15 μL min−1. Next, the channels are washed with 1× wash buffer solution for 25 min at 1 μL min−1. Subsequently, the patterned antibodies are saturated with the recombinant proteins bearing the respective tag introduced at a concentration of 10 μg mL−1 in 1× universal assay buffer for 90 min at 0.25 μL min−1. After another washing step the samples containing the native proteins of interest, diluted in 1× universal assay buffer, are mixed off-chip with the respective biotinylated detection antibody for 30 min and injected to the functionalized channels for another 30 min at 0.25 μL min−1. Here we employ a solution of 0.08 μg mL−1 of a biotinylated anti-CRP antibody, 0.5 μg mL−1 of a biotinylated anti-CEA antibody, 0.5 μg mL−1 of a biotinylated anti-IGF-1 antibody and 0.25 μg mL−1 of a biotinylated anti-PSA antibody. Subsequently, unbound detection antibodies are washed with 1× wash buffer solution for 15 min at 1 μL min−1. All site-specific assays are quantified by introducing 200 ng mL−1 SAPE label applied for 15 min at 0.25 μL min−1 followed by another washing step. The obtained fluorescent signals are normalized to their respective null value measured when no native protein is added.Multiplexed measurement in buffer and plasma
The platform was evaluated for the simultaneous measurement of cancer biomarkers in PBS as well as healthy human donor blood plasma. First, the different immunoassays for the prostate cancer markers were patterned consecutively with the different anchor antibodies against His/GST/FLAG tag followed by a wash step for 25 min at 1 μL min−1 with 1× wash buffer solution. Next, a mixture of CEA, IGF-1 and CRP recombinant proteins each at a concentration of 10 μg mL−1 in 1X universal assay buffer was introduced to the functionalized channels for 90 min at 0.25 μL min−1. As described above the detection antibodies were mixed with the sample solution, incubated in the channel and labelled with SAPE. The cross-sensitivity was assessed by spiking the individual or a mixture of 1 μg mL−1 CEA, 1 μg mL−1 IGF-1 or 100 μg mL−1 CRP in 1× universal assay buffer.Finally, the multiplexed detection was assessed in undiluted plasma. Healthy human donor EDTA blood was purchased from a blood donation bank (Blutspendezentrum beider Basel, Switzerland). Directly after pick-up the samples were centrifuged at 2000 × g for 20 min at 4 °C to retrieve the plasma samples. Collected blood plasma samples were aliquoted and stored at −20 °C until further use. Native, untagged, proteins were spiked in concentrations of 1 μg mL−1 CEA, 1 μg mL−1 IGF-1 or 100 μg mL−1 CRP in plasma. After an off-chip incubation of the prepared samples for 30 min together with the respective concentration of detection antibodies the mixture was introduced to the channel and supplied for another 30 min at 0.25 μL min−1. After a washing step of 15 min at 1 μL min−1 with 1× wash buffer solution SAPE was introduced to label the bound antibodies. After another 15 min the channels were washed again and the fluorescent values were measured.
Imaging and image analysis
Functionalized regions are imaged on the same point-scanning confocal microscope used for the bleaching process with a 20× NA 0.75 objective and a resolution of 1024 × 1024 pixels. Average pixel intensities from functionalized regions were quantified using ImageJ software. The signals were corrected by subtraction of the background intensity measured outside the functionalized regions.Drawing of images
Fig. 1, 3a and b, and the sketch in Fig. 4, as well as the graphical abstract are created with https://biorender.com/.Results and discussion
The microfluidic platform enables a multiplexed analysis of different biomarker proteins found in liquid biopsy samples of cancer patients. The workflow, presented in Fig. 1, is based on five steps: (1) surface functionalization with tag-specific anchor antibodies, (2) saturation of functionalized regions with recombinant proteins, (3) off-chip mixing of the sample with biotinylated detection antibodies, (4) on-chip incubation of sample mixture for the competitive immunoassay, (5) labelling of the detection antibodies with SAPE and detection of the signals. In the following, we first describe the microfluidic device and the optimization of the process for protein patterning (step 1) in more detail.Chip design
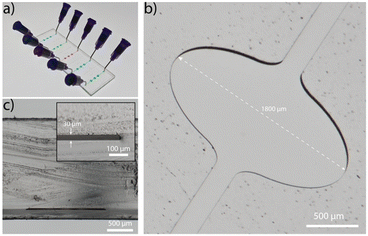
The microfluidic platform is fabricated in COC (ESI† Fig. S1 and S2) and comprises five straight channels (Fig. 2a), with a total volume of 320 nL each. The channel incorporates three widened chambers with a width and height of 1800 μm and 30 μm, respectively (Fig. 2b). The rigid thermoplastic material COC allows the fabrication of the extreme aspect ratio without collapsing of the chamber's ceiling (Fig. 2c). The wide chamber ensures a strong reduction of flow rates in this region, a low vertical diffusion length and sufficient space for immobilization of capture antibodies. The homogeneous flow distribution is confirmed with a finite element simulation (Comsol Multiphysics, ESI† Fig. S3).Characterization and optimization of LAPAP on COC
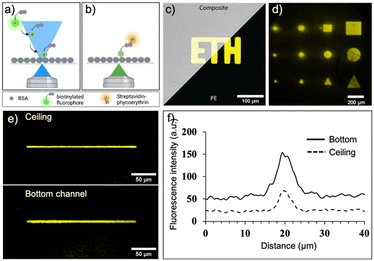
We first evaluated and optimized various parameters of laser-assisted protein adsorption by photobleaching for the COC surfaces. Prior to the actual laser bleaching, we coated the channels with BSA simply by filling and incubating a BSA solution. BSA serves as binding site as well as blocking agent to prevent unspecific adsorption in the following immunoassays. Next, we supplied biotin–FITC and irradiated selected regions with focused laser light (λ = 488 nm). We have chosen either FITC and TRITC, because both dye molecules are prone to bleaching. Bleaching occurs in the light-exposed area, as depicted in Fig. 3a and b. Notably, the bleached molecules bind to both bottom and ceiling of the channel. Subsequent addition of fluorescent SAPE conjugate allowed to visualize the regions, where biotin–FITC was immobilized. Regions that were exposed to light (shapes like squares, circles and triangles of different sizes) were clearly visible (Fig. 3c and d and S4a†). Structures with a size of 25 × 25 μm could be clearly associated to the desired form. A minimum line width of 5 μm was achieved when a single pixel line with a theoretical pixel size of 195.92 nm was bleached for 90 s using a 20× (NA 0.75) objective (Fig. 3e and f). Additionally, the best resolution was achieved with a laser scan rate of 200 Hz (ESI† Fig. S4b).The process depends on several further parameters summarized in the supplemental information, Fig. S5.† The higher the laser intensity and the longer the exposure time of the dye, the more FITC molecules are bleached and bind to the surface (ESI† Fig. S5a, b and f). Likewise, higher concentration of biotin–FITC and FITC or TRITC labelled IgGs lead to increasing immobilization at the light-exposed regions until a saturation is visible (ESI† Fig. S5c and e). The immobilization of a small molecule such as biotin (0.244 kDa) required lower concentrations than the larger IgG molecules (150 kDa). The process is independent of the applied flow rate (>0.1 μL min−1) of biotin–FITC (ESI† Fig. S5d). Altogether, these results indicate that we can influence the number of immobilized molecules by carefully adjusting the parameters. For the following experiments, we fixed the parameters to a bleaching time of 34 min, an anchor-dye concentration of 50 μg mL−1 or 300 μg mL−1 for biotin–FITC or IgGs, respectively, a flowrate of 0.15 μL min−1 and a laser power of 30%.
Next, we demonstrate in a series of three LAPAP steps the possibility to bleach and immobilize proteins and antibodies (immunoglobulin G, IgG) in different regions of the same channel (Fig. 4). Three squares (200 × 200 μm) in the same chamber were consecutively functionalized with biotin–FITC, anti-rabbit IgG-TRITC and anti-mouse IgG-FITC. The channel was washed and for visualization we supplied a mixture of dye-labelled binding partners, here streptavidin-Brilliant Violet 421, rabbit IgG-FITC, and mouse anti-CD3 Alexa Fluor 647 antibody were introduced to label the patterned proteins. The different labels of the secondary biomolecules enabled a fluorescent readout in different fluorescent channels. Although we observe unspecific binding in the non-functionalized areas, the signal in the functional areas are at least three times higher than in the non-functionalize regions (ESI,† Fig. S6).
Measurement of cancer biomarkers
We employ a competitive assay as indicated in Fig. 1. Here, the proteins equivalent to the biomarkers of interest in the sample (PSA, CRP, CEA, IGF-1) have to be immobilized on the surface (Fig. 1, step 2). We realized this by use of recombinant proteins bearing the different tags His, GST and FLAG that usually facilitate a downstream purification step.32,33 In our assay, the tags were the epitopes to bind to the respective antibodies that are immobilized on the surface by the above described LAPAP. The advantage of this assay strategy is that the first step is always the same regardless which targets or combination of target analytes are selected later. Shortly before employing the chip, we perform the next step by adding the tagged recombinant proteins that we want to detect in the sample. Therefore, the strategy gives a high flexibility for possible target analytes. Nevertheless, the choice of antibodies for immobilization of the proteins as well as the detection antibodies was critical to obtain a multiplexed signal without unspecific binding across the detection sites and are listed in Tables 1, and in S2,† respectively.| Biomarker | Immobilized antibody | Recombinant protein | LOD (ng mL−1) | Clinically relevant threshold (ng mL−1) |
|---|---|---|---|---|
| Native human PSA | FITC anti-6× His tag | His-tagged PSA | 0.2 | 4 (ref. 34) |
| Native human CEA | FITC anti-6× His tag | His-tagged CEA | 1 | 5 (ref. 30) |
| Fc-tagged IGF-1 | FITC anti-GST tag | GST-tagged IGF-1 | 5 | 160 (ref. 35) |
| Native human CRP | FITC anti-FLAG tag | FLAG-tagged CRP | 1500 | 10![[thin space (1/6-em)]](https://www.rsc.org/images/entities/char_2009.gif) 000 (ref. 36) 000 (ref. 36) |
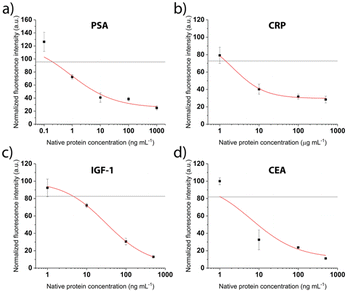
After patterning the antibodies, the next steps of the competitive immunoassays were optimized to facilitate the detection of biomarkers in the relevant concentration range. The binding sites were saturated with the respective tag-specific recombinant protein. The sample, pre-incubated with the detection antibody, was introduced and incubated for 30 min, before a final washing step and fluorescent labelling was performed. Calibration curves were recorded for all proteins separately for concentrations between 0.6 ng mL−1 and 500 ng mL−1. Fig. 5 shows drop of the signal for increasing concentrations as expected for the competitive assays. The grey line depicts the background signal (no protein present) plus 3 times the standard deviation, used to determine the limit of detection (LOD). For all biomarkers, the LOD is clearly below clinically relevant concentrations (Table 1).
Multiplexed analysis of cancer biomarkers
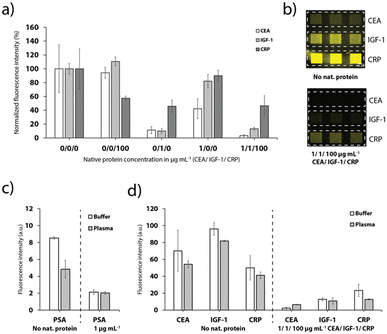
The different anchor antibodies were thoroughly chosen to enable a detection of up to three proteins simultaneously. Therefore, the channels were sequentially functionalized with the three different tag-specific antibodies and their respective recombinant proteins for the CEA, IGF-1 and CRP assay. Addition of the sample with all proteins (pre-mixed with the detection antibodies), results in a strong signal quenching on all detection sites (Fig. 6a and b), as expected. Furthermore, the results depicted in Fig. 6a show that no cross-binding could be observed if only CEA or CRP were added to the sample. Addition of IGF-1, however, influenced also the signal for CEA and CRP, respectively, indicating a weak specificity of the antibodies to IGF-1. We assume that the cross-binding was enhanced due to the use of FC-tagged IGF-7 instead of a native human IGF-1 protein, which we chose due to unavailability of a human extract.Finally, the platform was used for the detection of PSA, CRP, CEA and IGF-1 spiked into undiluted healthy human blood plasma as shown in Fig. 6c and d. Despite the more complex matrix compared to buffer and the expected adverse influence on the competitive immunoassay, the detection of the biomarkers was still feasible (Fig. 6c and d). The effect on the signal for PSA was fairly strong. We speculate that the plasma sample taken from male donors contained a low level of PSA. For the CEA, IGF-1 and CRP detection sites, the signal dropped to 77.3%, 85.2% and 82.3%, respectively, when plasma instead of buffer was supplied. Nevertheless, multiplexed detection of the biomarkers was still achieved, as demonstrated in Fig. 6d.
Conclusion
In this work we developed and characterized a thermoplastic, low-cost microfluidic platform for the multiplexed analysis of cancer biomarkers. We employed a facile rapid prototyping procedure for manufacturing of the COC devices and successfully adopted and characterized a laser-assisted process for functionalization of the surface with antibodies and proteins. A BSA-coated surface is required for LAPAP, but otherwise it is not limited to COC and can be presumably transferred to other thermoplastic materials. Moreover, we developed and optimized competitive immunoassays for PSA, CEA, IGF-1 and CRP to detect three cancer markers simultaneously with limits of detection well below clinically relevant thresholds. Finally, we presented multiplexed detection of CEA, IGF-1 and CRP in buffer as well as in undiluted plasma. The implemented competitive assay format based on tag-specific anchors can be easily adapted to other cancer biomarkers, or extended by means of further tag-specific antibodies. It should be emphasized that the immobilization strategy that we developed is very flexible and can also be used to implement other assay formats such as standard enzyme-linked immunoassays (ELISAs), however, the sensitivity and specificity of the immunoassays depends on the quality of the available antibodies (or other capture molecules). In our current approach, we obtain a yes/no answer for the presence of the biomarkers, but for quantitative evaluation of the biomarkers in plasma, further efforts and more specific antibodies are required. While the current microfluidic method is a prototype for research, the integration of these versatile assays in a thermoplastic device is a first step towards the use at a site for medical care. Further engineering efforts, such as increasing the throughput of LAPAP, automation of fluid handling and imaging as well as further tests and optimization of the shelf life of the devices and immobilized antibodies are necessary to reach this ultimate goal.Conflicts of interest
There are no conflicts to declare.Acknowledgements
We thank the European Research Council for partially funding this work (ERC Consolidator Grant No. 681587). We gratefully acknowledge support from the members of the microscopy and cleanroom facility at the Department of Biosystems Science and Engineering of ETH Zurich, Switzerland.References
- J. L. Garcia-Cordero and S. J. Maerkl, Curr. Opin. Biotechnol., 2020, 65, 37–44 CrossRef CAS PubMed.
- S. H. Hussain, C. S. Huertas, A. Mitchell, A. L. Deman and E. Laurenceau, Biosens. Bioelectron., 2022, 197, 113770 CrossRef CAS PubMed.
- S. Cheng, Y. Li, H. Yan, Y. Wen, X. Zhou, L. Friedman and Y. Zeng, Lab Chip, 2021, 21, 3219–3243 RSC.
- G. Vandekerkhove, W. J. Struss, M. Annala, H. M. L. Kallio, D. Khalaf, E. W. Warner, C. Herberts, E. Ritch, K. Beja, Y. Loktionova, A. Hurtado-Coll, L. Fazli, A. So, P. C. Black, M. Nykter, T. Tammela, K. N. Chi, M. E. Gleave and A. W. Wyatt, Eur. Urol., 2019, 75, 667–675 CrossRef CAS PubMed.
- R. Etzioni, N. Urban, S. Ramsey, M. McIntosh, S. Schwartz, B. Reid, J. Radich, G. Anderson and L. Hartwell, Nat. Rev. Cancer, 2003, 3, 243–252 CrossRef CAS PubMed.
- J. Kling, Nat. Biotechnol., 2006, 24, 891–893 CrossRef CAS PubMed.
- C. Dincer, R. Bruch, A. Kling, P. S. Dittrich and G. A. Urban, Trends Biotechnol., 2017, 35, 728–742 CrossRef CAS PubMed.
- J. Aidoo-Brown, D. Moschou and P. Estrela, Sensors, 2021, 21, 5023 CrossRef CAS PubMed.
- C. J. Kim, L. Dong, S. R. Amend, Y. K. Cho and K. J. Pienta, Lab Chip, 2021, 21, 3263–3288 RSC.
- C. Dejous and U. M. Krishnan, Biosens. Bioelectron., 2021, 173, 112790 CrossRef CAS PubMed.
- A. L. Jones, L. Dhanapala, T. A. Baldo, M. Sharafeldin, C. E. Krause, M. Shen, S. Moghaddam, R. C. Faria, D. K. Dey, R. W. Watson, R. Andrawis, N. H. Lee and J. F. Rusling, Anal. Chem., 2021, 93, 1059–1067 CrossRef CAS PubMed.
- R. Yan, N. Lu, S. Han, Z. Lu, Y. Xiao, Z. Zhao and M. Zhang, Biosens. Bioelectron., 2022, 197, 113797 CrossRef CAS PubMed.
- V. F. Annese, S. B. Patil, C. Hu, C. Giagkoulovits, M. A. Al-Rawhani, J. Grant, M. Macleod, D. J. Clayton, L. M. Heaney, R. Daly, C. Accarino, Y. D. Shah, B. C. Cheah, J. Beeley, T. R. J. Evans, R. Jones, M. P. Barrett and D. R. S. Cumming, Microsyst. Nanoeng., 2021, 7, 21 CrossRef CAS PubMed.
- A. Bernard, J. P. Renault, B. Michel, H. R. Bosshard and E. Delamarche, Adv. Mater., 2000, 12, 1067–1070 CrossRef CAS.
- A. Bernard, B. Michel and E. Delamarche, Anal. Chem., 2001, 73, 8–12 CrossRef CAS PubMed.
- A. Kling, C. Chatelle, L. Armbrecht, E. Qelibari, J. Kieninger, C. Dincer, W. Weber and G. A. Urban, Anal. Chem., 2016, 88, 10036–10043 CrossRef CAS PubMed.
- R. Bruch, M. Johnston, A. Kling, T. Mattmüller, J. Baaske, S. Partel, S. Madlener, W. Weber, G. A. Urban and C. Dincer, Biosens. Bioelectron., 2021, 177, 112887 CrossRef CAS PubMed.
- J. Schwarz, V. Bierbaum, J. Merrin, T. Frank, R. Hauschild, T. Bollenbach, S. Tay, M. Sixt and M. Mehling, Sci. Rep., 2016, 6, 36440 CrossRef CAS PubMed.
- P.-O. Strale, A. Azioune, G. Bugnicourt, Y. Lecomte, M. Chahid and V. Studer, Adv. Mater., 2016, 28, 2024–2029 CrossRef CAS PubMed.
- E. Berthier, E. W. K. Young and D. Beebe, Lab Chip, 2012, 12, 1224–1237 RSC.
- M. A. Holden and P. S. Cremer, J. Am. Chem. Soc., 2003, 125, 8074–8075 CrossRef CAS PubMed.
- J. M. Bélisle, D. Kunik and S. Costantino, Lab Chip, 2009, 9, 3580–3585 RSC.
- N. Keller, T. M. Nargang, M. Runck, F. Kotz, A. Striegel, K. Sachsenheimer, D. Klemm, K. Länge, M. Worgull, C. Richter, D. Helmer and B. E. Rapp, Lab Chip, 2016, 16, 1561–1564 RSC.
- F. H. Schröder, J. Hugosson, M. J. Roobol, T. L. J. Tammela, M. Zappa, V. Nelen, M. Kwiatkowski, M. Lujan, L. Määttänen, H. Lilja, L. J. Denis, F. Recker, A. Paez, C. H. Bangma, S. Carlsson, D. Puliti, A. Villers, X. Rebillard, M. Hakama, U. H. Stenman, P. Kujala, K. Taari, G. Aus, A. Huber, T. H. Van Der Kwast, R. H. N. Van Schaik, H. J. De Koning, S. M. Moss and A. Auvinen, Lancet, 2014, 384, 2027–2035 CrossRef PubMed.
- C. Manceau, G. Fromont, J. B. Beauval, E. Barret, L. Brureau, G. Créhange, C. Dariane, G. Fiard, M. Gauthé, R. Mathieu, R. Renard-Penna, G. Roubaud, A. Ruffion, P. Sargos, M. Rouprêt and G. Ploussard, Cancers, 2021, 13, 1–21 CrossRef PubMed.
- V. Kuci Emruli, L. Liljedahl, U. Axelsson, C. Richter, L. Theorin, A. Bjartell, H. Lilja, J. Donovan, D. Neal, F. C. Hamdy and C. A. K. Borrebaeck, Proteomics: Clin. Appl., 2021, 15, 1–13 Search PubMed.
- S. Detchokul and A. G. Frauman, Br. J. Clin. Pharmacol., 2011, 71, 157–174 CrossRef CAS PubMed.
- A. Turkes, W. B. Peeling and K. Griffiths, Prostate Cancer Prostatic Dis., 2000, 3, 173–175 CrossRef CAS PubMed.
- J. M. Chan, M. J. Stampfer, E. Giovannucci, P. H. Gann, J. Ma, P. Wilkinson, C. H. Hennekens and M. Pollak, Science, 1998, 279, 563–567 CrossRef CAS PubMed.
- G. D. Juang, T. I. S. Hwang and Y. H. Wang, Urol. Sci., 2014, 25, 28–30 CrossRef.
- W. A. Hall, D. C. Nickleach, V. A. Master, R. S. Prabhu, P. J. Rossi, K. Godette, S. Cooper and A. B. Jani, Cancer, 2013, 119, 3272–3279 CrossRef CAS PubMed.
- J. J. Lichty, J. L. Malecki, H. D. Agnew, D. J. Michelson-Horowitz and S. Tan, Protein Expression Purif., 2005, 41, 98–105 CrossRef CAS PubMed.
- M. E. Kimple, A. L. Brill and R. L. Pasker, Curr. Protoc. Protein Sci., 2013, 73, 1–23 Search PubMed.
- H. G. Welch and P. C. Albertsen, N. Engl. J. Med., 2020, 382, 1557–1563 CrossRef PubMed.
- A. Wolk, C. S. Mantzorus, S.-O. Andersson, L. B. Signorello, P. Lagiou, H.-O. Adami and D. Trichopoulos, J. Natl. Cancer Inst., 1998, 90, 911–915 CrossRef CAS PubMed.
- P. C. Hart, I. M. Rajab, M. Alebraheem and L. A. Potempa, Front. Immunol., 2020, 11, 1–17 CrossRef PubMed.
Footnote |
| † Electronic supplementary information (ESI) available. See DOI: https://doi.org/10.1039/d2lc00840h |
| This journal is © The Royal Society of Chemistry 2023 |

