DOI:
10.1039/D3JA00140G
(Technical Note)
J. Anal. At. Spectrom., 2023,
38, 1560-1563
Single cell ICP-MS as a powerful analytical tool to determine metal content in individual pollen grains
Received
28th April 2023
, Accepted 7th July 2023
First published on 10th July 2023
Abstract
The acquisition and storage of essential metals (Fe, Cu, Zn, Mn…) is considered to be crucial for the quality of pollen grains. It is therefore strategic to develop analytical approaches to study metal homeostasis in pollen grains that are constituted of a single cell. In this work, the coupling of a single cell introduction system with a multiquadrupole ICP MS allowed the development of a method for the analysis of Fe and Mn using the mass shift mode with oxygen or direct analysis, respectively. The method was applied for the analysis of pollen collected from wild type Arabidopsis thaliana plants grown in standard conditions and Fe- or Mn-supplemented conditions. This analytical strategy offered, as main advantages over classical bulk ICP MS approach: the analysis of extremely low quantities of samples with almost no preparation; the possibility to discriminate and determine the concentrations of intracellular metal and metal loosely bound to the grain surface in a single run; and finally, the determination of metal content in individual cells, reflecting the heterogeneity of a cell population, information that would be otherwise lost.
Introduction
Pollen plays a central role in the life cycle of flowering plants and, as such, is a key actor for fertility and for the productivity of crops, whether the final product is a fruit or a seed. Pollen development is extremely susceptible to environmental cues such as high temperatures, drought or nutritional deficiencies that could provoke fertility losses or even sterility.1 Interestingly, several imaging studies have uncovered that the anthers, the floral organs that generate pollen, accumulate particularly high concentrations of iron (Fe)2 and copper (Cu),3 strongly suggesting that the production of pollen might be a high metal-demanding process.
During their development within the anther, pollen grains are nourished by a specific cell layer called the tapetum. At the molecular level, very little is known on the process of metal transport in flowers and in particular between the tapetum and the pollen cells. Two transcription factors, CITF1 and SPL7, were shown to regulate the delivery of Cu to anthers, since single and double CITF1 SPL7 knock out mutants displayed a strong reduction in Cu accumulation in anthers, together with a highly decreased pollen production and therefore an overall very low fertility.3 The transport of Fe between the tapetum cells and pollen grains was shown to rely on its high-affinity ligand citrate and in particular on the activity of the citrate efflux transporter FRD3. Mutations in the FRD3 gene provoked the interruption of Fe transport between tapetum and pollen cells, abortion of developing pollen grains and ultimately the sterility of the FRD3 mutant flowers.4 The last illustration of the metal requirements was related to the fecundation of the ovule by the pollen grain. When pollen grains reach the female part of flowers (stigma) they germinate and develop a pollen tube that will grow from the stigma down to the ovary to reach the ovule and deliver the male nuclei. Mutations in PML3, a Golgi-localized manganese transporter expressed in pollen, provoke defects in pollen tube growth, affecting fertility and, eventually, seed yield.5 Taken together, these three examples illustrate the importance of metal homeostasis for pollen production and to maintain fertility, a process that is vital for the plant's life cycle and crop productivity.
In this context, there is a need for analytical approaches that will allow the quantification of metal content of pollen grains that are simple to set up. These should only require few steps of sample preparation, from little amounts of material. Even though the methods to collect pollen from flowers are straightforward, the amounts collected almost never reach milligram scale in laboratory conditions. The resolution of pollen metal content should reach single cell level since pollen grains from a single flower can be genetically different. For instance, a plant that is heterozygous for a specific gene will generate two different populations of pollen grains, within the same flower. The technique that opens perspectives for all these requirements is Single Cell Inductively Coupled Plasma Mass Spectrometry (SC-ICP-MS), which is based on the well-established technique of Single Particle ICP-MS (SP-ICP-MS). While the latter can provide information about the size of a pure nanoparticle, SC-ICP-MS allows to determine the intrinsic metal content (despite its form) of a cell population in a cell-by-cell basis, more representative than the regular bulk analysis, at the attogram level, and from a few tens of microliters.6,7 The aim of this study was to prove the capabilities of SC-ICP-MS to provide critical information about the Fe and Mn content in pollen cells collected from plants grown in different media, and hence to become an important tool for the elucidation of metal homeostasis in pollen production.
Experimental
Plant material, pollen harvest and sample preparation
Arabidopsis thaliana plants (ecotype Columbia-0) were cultivated in a greenhouse on soil (Jiffy GO-PP4, Jiffy group, France) irrigated with water (standard condition) or with either 2 g L−1 Fe–EDDHA (Fe excess) or 4 mM MnCl2 (Mn excess). Both metal-excess treatments were applied when plants started to bolt (once 1 week before pollen harvest and once 1 day before). Pollen grains were harvested (Fig. 1) by applying vacuum to open flowers, using a 1000 μL pipet tip inserted in silicon tube sections, interspaced with a 60 μm mesh followed by a 5 μm mesh, where the pollen grains were blocked (adapted from Johnson-Brousseau and McCormick).8 The resulting 5 μm pollen-covered filters were placed in microtubes and stored at 4 °C until analysed by SC-ICP-MS. Pollen grains were resuspended by addition of 200 μL MilliQ water, followed by quick vortexing (10 s) and by gently scrapping the filters with a plastic spatula and one additional vortexing. The pollen grain suspensions were prepared immediately before SC-ICP-MS analyses.
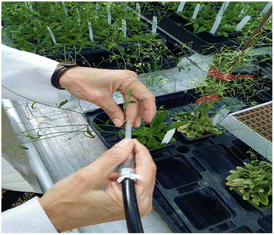 |
| | Fig. 1 The test plants at the moment of pollen collection. | |
Instrumentation
A NexION 5000 ICP multi-quadrupole mass spectrometer, (PerkinElmer, Shelton, CT) equipped with a single cell sample introduction kit (Asperon™ spray chamber and HEN single cell nebulizer) was used to perform analysis. The sample was introduced to the ICP-MS system at rate of 10 μL min−1 by a syringe pump (Pump33, Harvard Apparatus, Mollista, MA) connected directly to the nebulizer with a home-made connection. The analysis of Mn was carried out using only Q3 while Fe was measured in the mass shift mode with O2 (DRC oxygen optimized to 0.65 mL min−1). The dwell time for both elements was set to 100 μs. Data were treated with the integrated Syngistix Nano Application Module (PerkinElmer) as well as with the open source Python-based data processing platform “SPCal” version 0.8.2 developed by Lockwood et al.9 for comparison purposes. Pollen suspension pictures were taken with an Olympus BX61 microscope connected to a colour camera (Progres C5, Jenoptik).
Results and discussion
Signal interpretation and data treatment
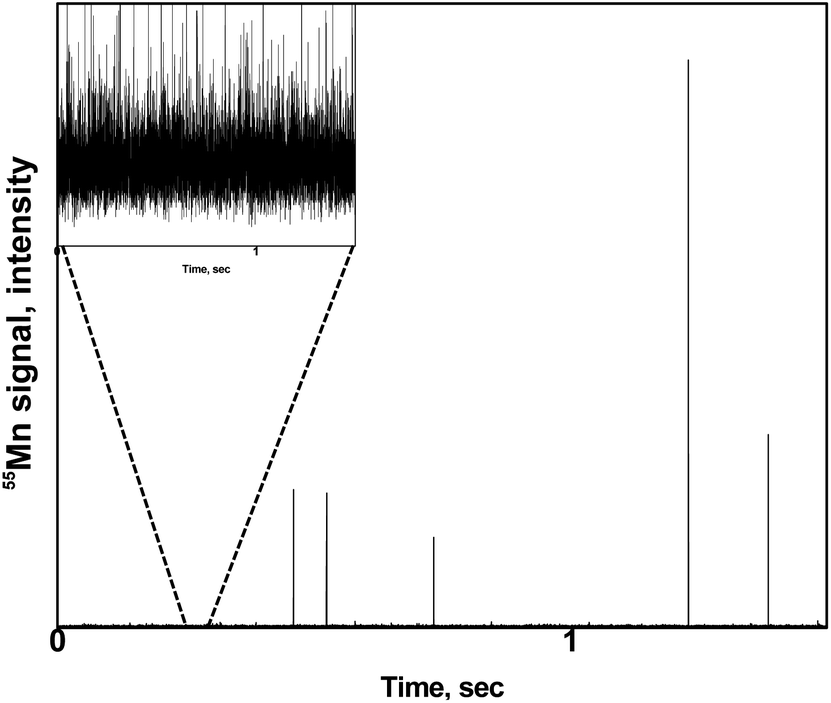
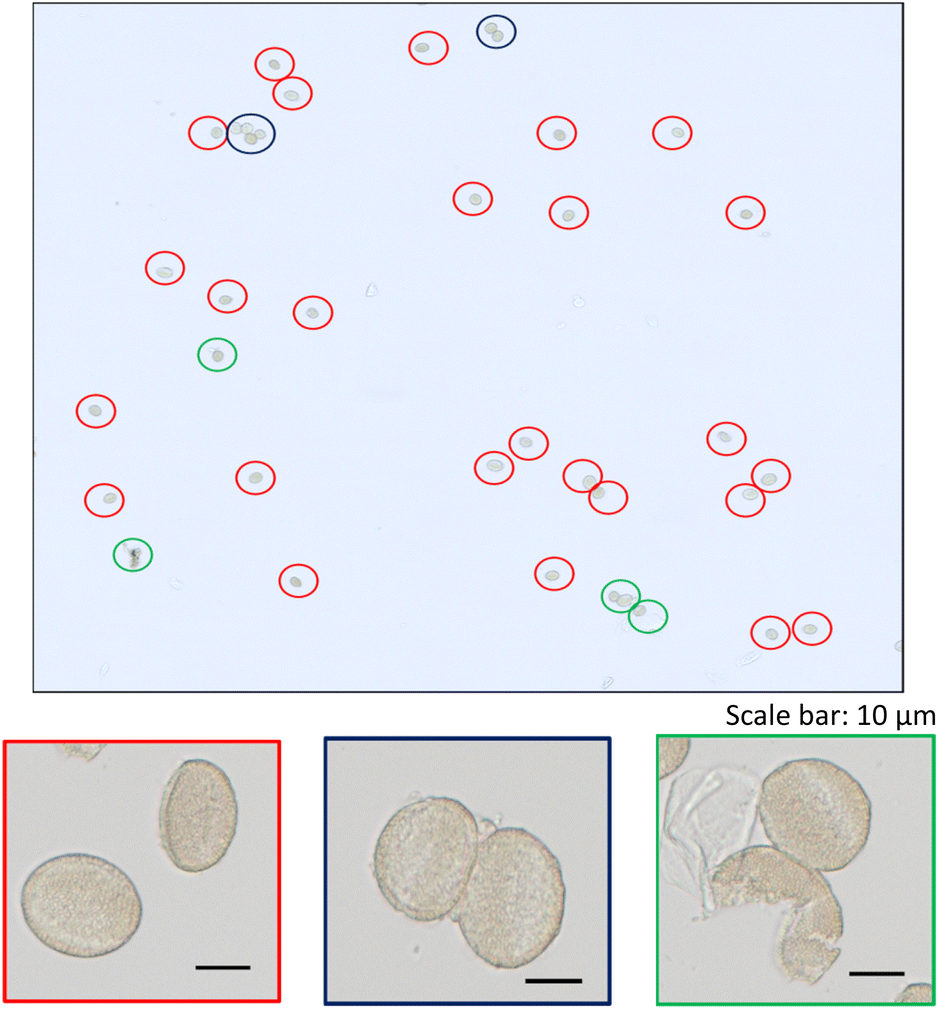
A zoom of a typical time scan obtained after the analysis of a pollen suspension by the SC-ICP-MS set-up is shown in Fig. 2. Three different type of signals can be observed: (i) a significant number of pulses above the baseline coming from the metal ions, and hence the metal content, detected after the introduction of individual pollen cells in the plasma, (ii) pulses of higher intensity coming most probably from cell agglomerates, and (iii) a significant background indicating the presence of the metal in its ionic form. The signal interpretation described above is confirmed by the observation of microscope image performed on a droplet of a pollen suspension (Fig. 3). The image shows a significant number of individual pollen cells (red circles) but also some agglomerates containing more than one cell (blue circles). In addition, a non-neglectable fraction of cells appears to be broken in the cell suspension (green circles), which could explain, at least in part, the presence of a significant background of dissolved metal ions in the time scans obtained by SC-ICP-MS.
 |
| | Fig. 2 Typical time scan obtained by SC-ICP-MS of a pollen suspension. Insert: zoom of the baseline. | |
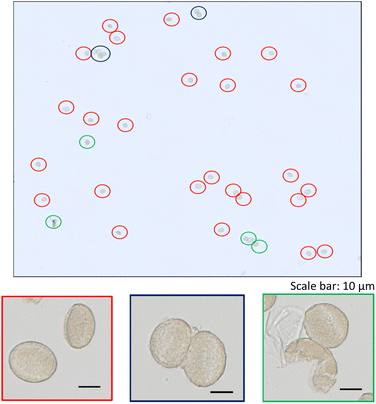 |
| | Fig. 3 Microscope image of a pollen suspension with zooms on: individual pollen cells (framed in red); agglomerates (framed in blue); broken cells (framed in green). | |
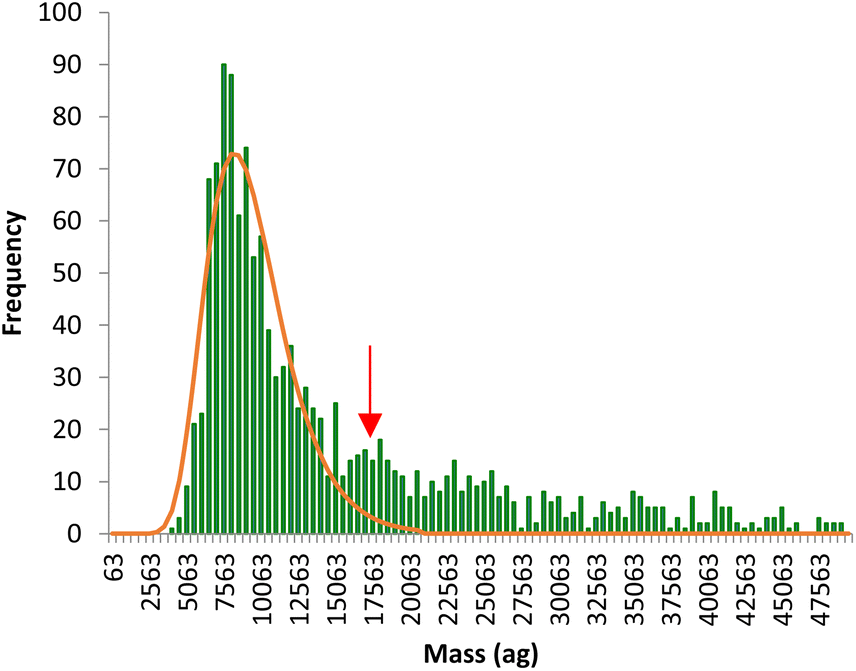
The time scans obtained were directly converted into mass distributions, which reflect the total metal (Fe or Mn) content per individual pollen cell in the whole population. An example of Fe mass distribution per cell is shown in Fig. 4. The mass distribution shows a main population reflecting the signal intensities produced by a single pollen cell while a second, less significant, population is observed at masses twice higher than the main population (red arrow), coming from agglomerates of two pollen cells. The main population, corresponding to individual cells, was fitted to a lognormal distribution and the median mass calculated for each analysis.
 |
| | Fig. 4 Typical mass distribution of Fe per pollen cell obtained by SC-ICP-MS. The red arrow signals the population coming from agglomerates of two pollen cells. | |
Total metal content in Arabidopsis thaliana pollen cells
Pollen collected from Arabidopsis thaliana grown in 3 different conditions (growth medium irrigated with water or supplemented with either Fe or Mn) was analysed by SC-ICP-MS and the median mass of each metal of interest per cell was determined according to the protocol described above. Triplicates of each condition were analysed (for a total n = 9) and the corresponding average calculated.
Determination of iron content.
Fig. 5 shows the results obtained for the determination of Fe content in pollen cells. The SC-ICP-MS analyses revealed that Arabidopsis pollen grains contained amounts of Fe in the range of ca. 6250 ag per cell (Fig. 5). Interestingly, comparable values were reported for spleen and liver cells analysed by SC-ICP-MS.10 When exposed to Fe excess in the soil, plants can accumulate Fe in several organs such as roots, leaves and even whole flowers.11,12 Pollen grains collected from plants that had been exposed to excess Fe did contain more Fe than the control pollen, strongly suggesting that this Fe excess had been taken up and transported in the whole plant, up to the flowers and pollen. The fact that the soil condition can ultimately affect the amount of Fe accumulated in pollen grains raises the question of the impact of the mineral nutrition on the overall fertility of plants. Surprisingly, pollen from plants treated with Mn excess also displayed higher Fe accumulation (Fig. 5). This unexpected result actually illustrates the inter-dependence of metal ions responses. One explanation could be that the overload of Mn in the soil displaced a fraction of Fe atoms, inducing an indirect carry-over of Fe in the plant. In all cases, this unexpected result, never reported before, could only be obtained thanks to a dedicated single-cell approach such as SC-ICP-MS.
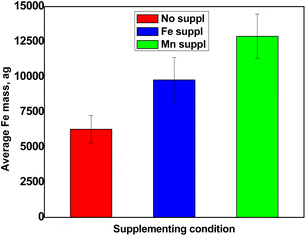 |
| | Fig. 5 Average Fe content per cell obtained for non-supplemented pollen (red), pollen supplemented with Fe (blue) and pollen supplemented with Mn (green). Values represent average +/− SD, n = 3. | |
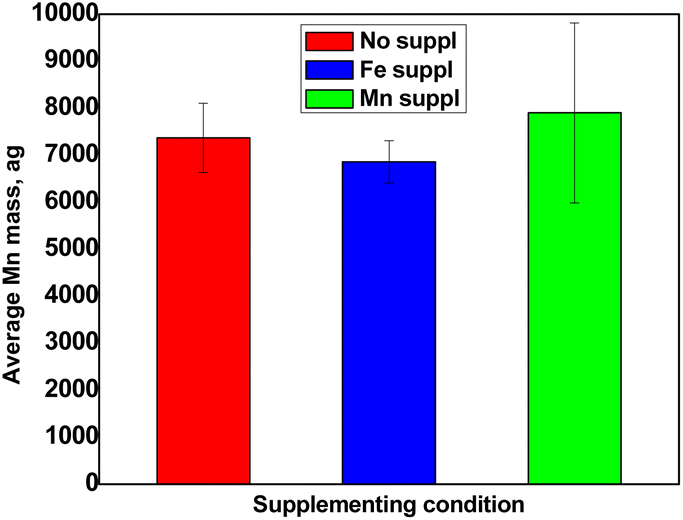
Determination of manganese content.
Fig. 6 shows the results obtained for the determination of Mn content in pollen cells. Pollen grains accumulated an average of 7000 ag Mn per cell. These values, which are comparable to Fe, do reflect the fact that plants tend to accumulate comparable amounts of Fe and Mn in the different organs analysed so far.13,14 However, contrary to Fe, the Mn excess treatment did not provoke an increased accumulation in pollen grains, compared to control condition (Fig. 6). This unexpected result might suggest that Mn is somehow less mobile than Fe within the plant and therefore excess supply has less impact on the plants.
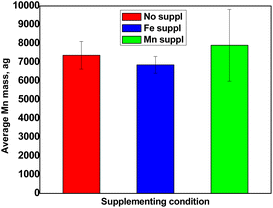 |
| | Fig. 6 Average Mn content per cell obtained for non-supplemented pollen (red), pollen supplemented with Fe (blue) and pollen supplemented with Mn (green). Values represent average +/− SD, n = 3. | |
Determination of dissolved metal content.
The quantification of dissolved metals revealed that the pollen grains had released Fe and Mn in the medium (Table 1). If this release of metal ions were mostly due to pollen grain breakage, as illustrated in Fig. 3, then comparable concentrations of Fe and Mn should be measured, since pollen grains do accumulate comparable masses of the two metals. The fact that pollen grains released around 10 times more Fe than Mn strongly suggests that the presence of metals, particularly Fe, cannot be only attributed to pollen grain breakage. Instead, this observation suggests that rehydrated pollen grains could specifically release Fe in the medium. This hypothesis is actually reminiscent of a previous observation where we could detect Fe bound at the surface of the pollen grains, by histochemical staining of Fe.2 Taken together, these findings suggest that there might be a pool of Fe, loosely bound at the surface of the pollen grains, that is released in the medium upon rehydration (contrary to Mn), paving the way for future questions on the biological role(s) of this pool of Fe.
Table 1 Pollen grains density (number per mL) and average Fe and Mn dissolved in pollen suspensions
|
|
Cells mL−1 |
Fe conc. μg L−1 |
Mn conc. μg L−133 |
| No suppl |
1.5 × 10⁵ ± 1.1 × 10⁴ |
57 ± 12 |
6 ± 1 |
| Fe suppl |
1.7 × 10⁵ ± 1.7 × 10⁴ |
98 ± 10 |
5 ± 1 |
| Mn suppl |
1.9 × 10⁵ ± 3.0 × 10⁴ |
114 ± 10 |
13 ± 3 |
Conclusions
This work has established that SC-ICP-MS is a suitable analytical technique to quantify metals in pollen, in a cell-by-cell basis and at very low concentrations. This set-up requires very little amounts of pollen grains, opening very promising perspectives for biologists interested in studying metal homeostasis in this particularly important plant material (e.g., characterization of mutants, genetic screens). The approach was successfully applied for the determination of Fe and Mn content in pollen grains collected from wild type Arabidopsis thaliana grown in different metal regimes. The concentrations measured ranged between 5000 and 12![[thin space (1/6-em)]](https://www.rsc.org/images/entities/char_2009.gif) 500 ag Fe per cell depending on supplementation level and around 7000 ag Mn per cell regardless of the supply. Moreover, the thorough analysis of the data obtained has also revealed the presence of an unexpectedly high concentration of dissolved Fe, that could correspond to a new pool of Fe, loosely bound to the pollen grain surface, of unknown function.
500 ag Fe per cell depending on supplementation level and around 7000 ag Mn per cell regardless of the supply. Moreover, the thorough analysis of the data obtained has also revealed the presence of an unexpectedly high concentration of dissolved Fe, that could correspond to a new pool of Fe, loosely bound to the pollen grain surface, of unknown function.
Author contributions
A. L. produced the plant material. J. S. provided the resources and supervised. J. J. L., K. B., C. C. and S. M. collected and prepared the samples, designed the experiments and analysed the data. J. J. L., K. B. and S. M. wrote the manuscript.
Conflicts of interest
There are no conflicts to declare.
Acknowledgements
The authors wish to thank the “Metallo-Mix 2021” program (CNRS, France) for the funding of the “FERRUM” project, awarded to S. M. and K. B.
Notes and references
- E. Pacini and R. Dolferus, Front. Plant Sci., 2019, 10, 679 CrossRef PubMed.
- H. Roschzttardtz, G. Conéjéro, F. Divol, C. Alcon, J.-L. Verdeil, C. Curie and S. Mari, Front. Plant Sci., 2013, 4, 350 CrossRef PubMed.
- J. Yan, J.-C. Chia, H. Sheng, H. Jung, T.-O. Zavodna, L. Zhang, R. Huang, C. Jiao, E. J. Craft, Z. Fei, L. V. Kochian and O. K. Vatamaniuk, Plant Cell, 2017, 29, 3012–3029 CrossRef CAS PubMed.
- H. Roschzttardtz, M. Séguéla-Arnaud, J.-F. Briat, G. Vert and C. Curie, Plant Cell, 2011, 23, 2725–2737 CrossRef CAS PubMed.
- B. Zhang, C. Zhang, C. Liu, A. Fu and S. Luan, Plant Commun., 2021, 2, 100178 CrossRef CAS PubMed.
- A. B. S. da Silva and M. A. Z. Arruda, J. Trace Elem. Med. Biol., 2023, 75, 127086 CrossRef CAS PubMed.
- X. Yu, M. He, B. Chen and B. Hu, Anal. Chim. Acta, 2020, 1137, 191–207 CrossRef CAS PubMed.
- S. A. Johnson-Brousseau and S. McCormick, Plant J., 2004, 39, 761–775 CrossRef CAS PubMed.
- T. E. Lockwood, R. Gonzalez De Vega and D. Clases, J. Anal. At. Spectrom., 2021, 36, 2536–2544 RSC.
- R. Álvarez-Fernández García, L. Gutiérrez Romero, J. Bettmer and M. Montes-Bayón, Nanomaterials, 2023, 13, 12 CrossRef PubMed.
- K. Ravet, B. Touraine, J. Boucherez, J.-F. Briat, F. Gaymard and F. Cellier, Plant J., 2009, 57, 400–412 CrossRef CAS PubMed.
- T. Oliveira de Araujo, M. P. Isaure, G. Alchoubassi, K. Bierla, J. Szpunar, N. Trcera, S. Chay, C. Alcon, L. Campos da Silva, C. Curie and S. Mari, Plant Physiol. Biochem., 2020, 151, 144–156 CrossRef CAS PubMed.
- E. E. Rogers and M. Lou Guerinot, Plant Cell, 2002, 14, 1787–1799 CrossRef CAS PubMed.
- I. Baxter, C. Hermans, B. Lahner, E. Yakubova, M. Tikhonova, N. Verbruggen, D. Yin Chao and D. E. Salt, PLoS One, 2012, 7, 1–12 Search PubMed.
|
| This journal is © The Royal Society of Chemistry 2023 |
Click here to see how this site uses Cookies. View our privacy policy here. 
 a,
Katarzyna
Bierla
a,
Katarzyna
Bierla