
 Open Access Article
 This Open Access Article is licensed under a Creative Commons Attribution-Non Commercial 3.0 Unported Licence
Catching up on calibration-free LIBS
Francesco
Poggialini
,
Beatrice
Campanella
,
Bruno
Cocciaro
,
Giulia
Lorenzetti
,
Vincenzo
Palleschi
 * and
Stefano
Legnaioli
* and
Stefano
Legnaioli
Applied and Laser Spectroscopy Laboratory, Institute of Chemistry of Organometallic Compounds, National Research Council, Via G. Moruzzi 1, 56124 Pisa, Italy. E-mail: vincenzo.palleschi@cnr.it
First published on 11th July 2023
Abstract
This review paper will present and critically discuss the evolution of the calibration-free LIBS (CF-LIBS) method and some of its new applications that appeared since the last extensive review on the topic, which was published more than 10 years ago by the inventors of the technique. This will allow the interested researchers to catch up on the new trends of the method and the strategies that have been devised in the last decade for improving the analytical factors of merit of CF-LIBS.
1. Introduction
The calibration-free LIBS method was firstly introduced by Ciucci, Corsi, Palleschi, Salvetti, Rastelli and Tognoni in 1999.1 The 1999 article was followed, in 2002, by another article by Bulajic et al.,2 describing the effects of self-absorption in LIBS quantitative analysis3 giving, at the same time, specific indication on how to take into account and compensate for the self-absorption effect in CF-LIBS.In the following years, the interest of the LIBS community in improving and applying the CF-LIBS method grew, although quite slowly at the beginning (see Fig. 1). The reasons of the growing interest were the clear advantages of a method which does not rely on the use of calibration samples and fully overcomes both physical and chemical matrix effects4 by giving compositional information about the sample which:
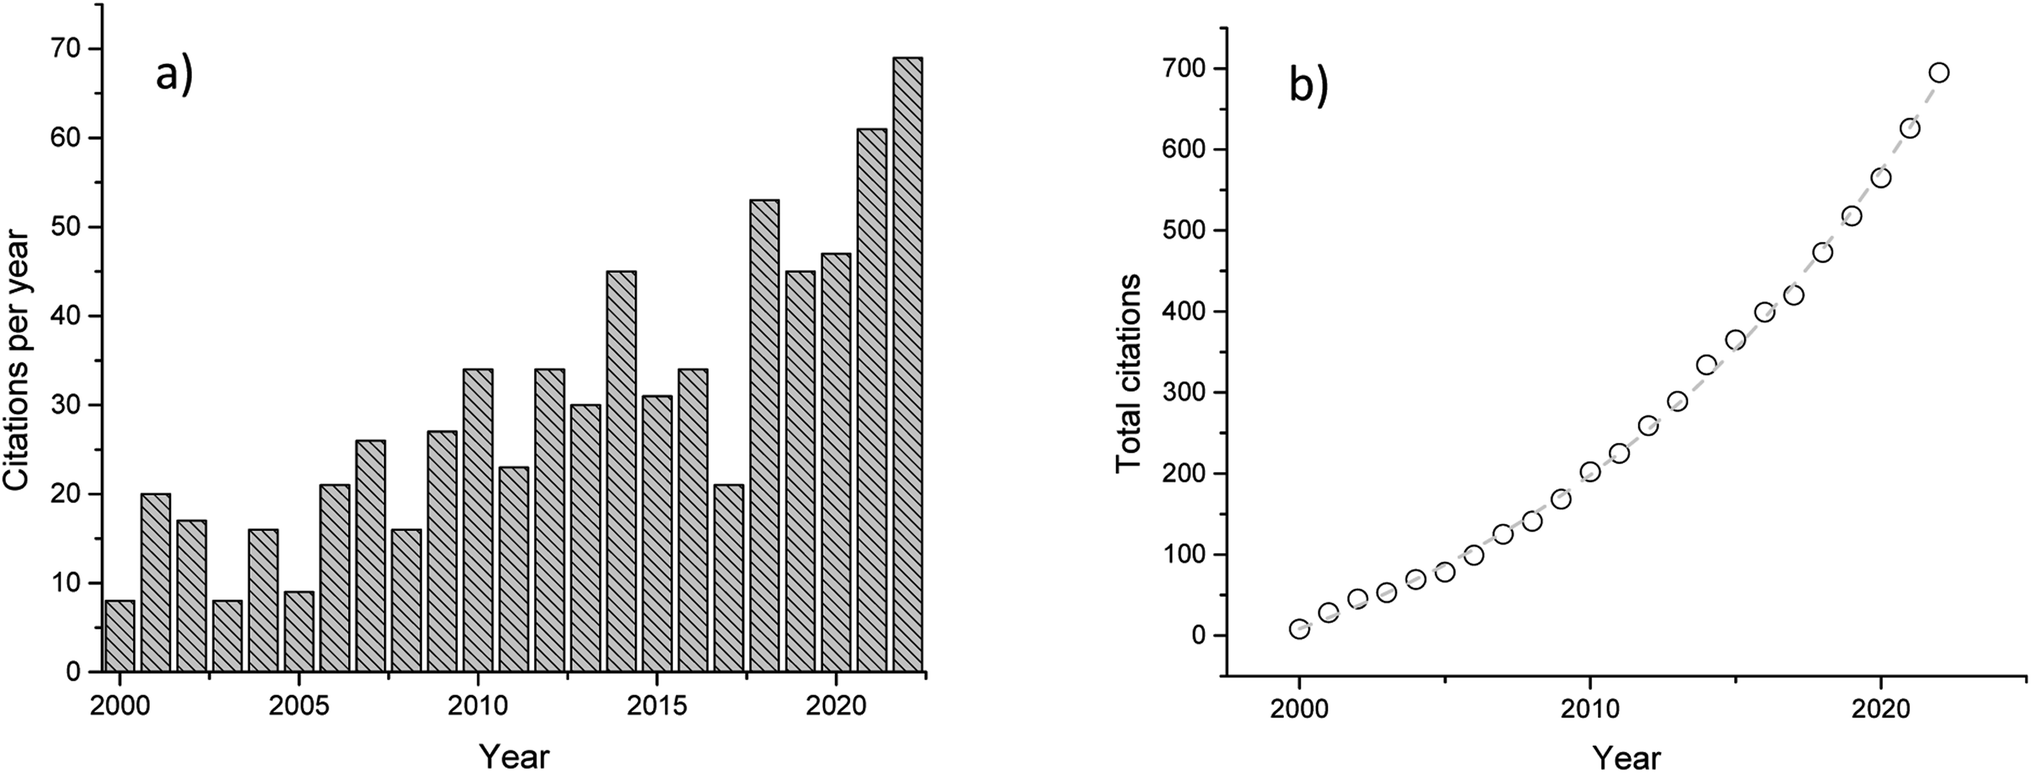 | ||
| Fig. 1 Number of citations of the 1999 CF-LIBS paper per year (a) and cumulative (b). The dashed line in (b) represents the exponential fit of the total number of citations vs. time. | ||
(a) does not depend on the variation the ablated mass from sample to sample, which is one of the main consequences of the physical matrix effect;
(b) does not depend on the variation of electron temperature and number density, a consequence of the physical and chemical matrix effects, since these key plasma parameters are directly evaluated from the LIBS spectra.
In the first five/six years after the introduction of the CF-LIBS method, the average number of citations of the paper was slightly more than 10 per year (and some of them were citations from the same inventors of the method, too). After that, the interest about the method exploded, and the total number of citations started to grow with an exponential trend which continued up to the present.
At the moment of writing this review, the overall citations of the first CF-LIBS paper are more than 700, making it the research article (thus excluding books and reviews) most quoted in the history of LIBS.
The exponential growth of the papers related to CF-LIBS also means that since the last exhaustive review on CF-LIBS, compiled in 2010 by Tognoni et al.,5 more than 500 papers have been published on the topic of standard-less LIBS quantitative analysis. Although not all of them can be considered relevant for this review, several of them have significantly contributed to improving the analytical figures of merit of the method or, in any case, to expand its applicability to different fields.
The purpose of this paper is thus the discussion of the main contributions to the CF-LIBS method, which appeared in the literature from the 2010 review to present. Programmatically, as in the 2010 review, we will not discuss the calibration-free methods based on the matching between the experimental and synthetic LIBS spectra,6 because this method uses a completely different approach with respect to the Ciucci et al.1 procedure. The issues related to the applications of the two methods have been recently discussed in an excellent paper by Hermann et al.7
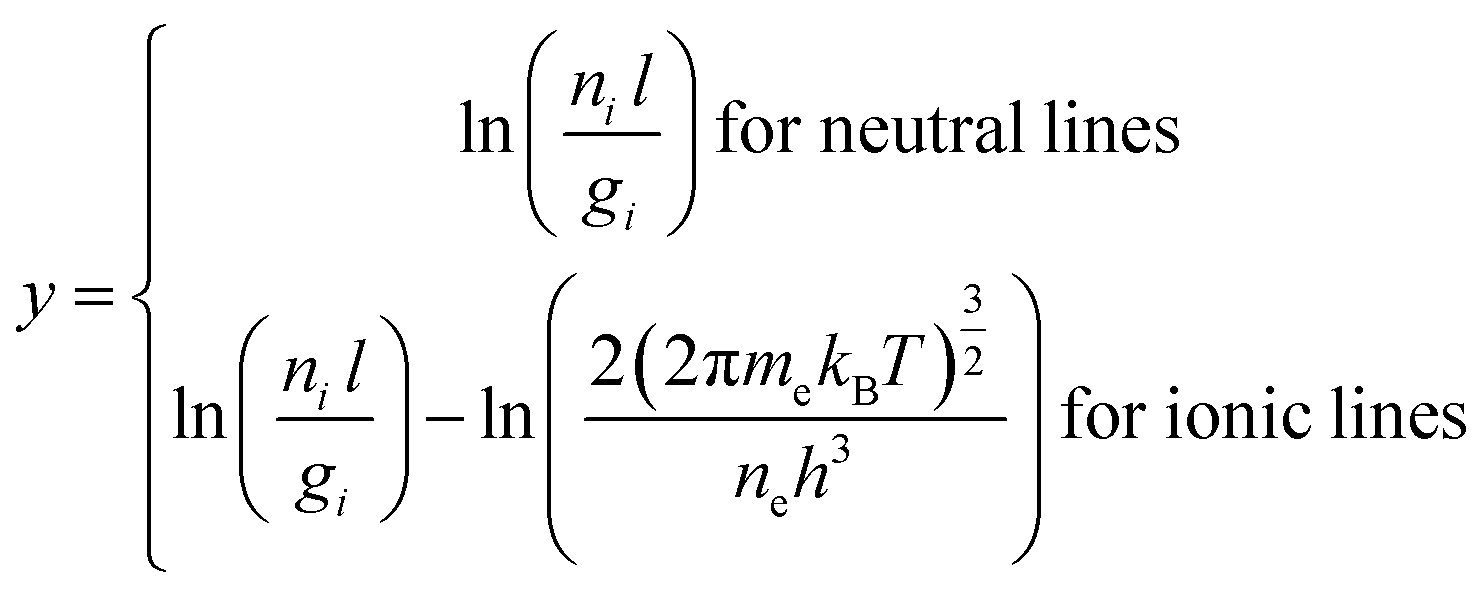
2. Background
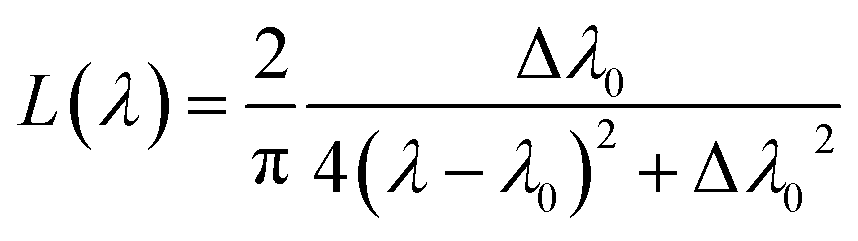
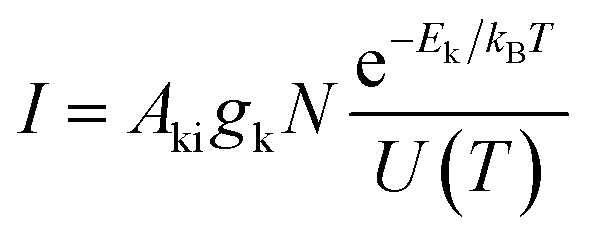
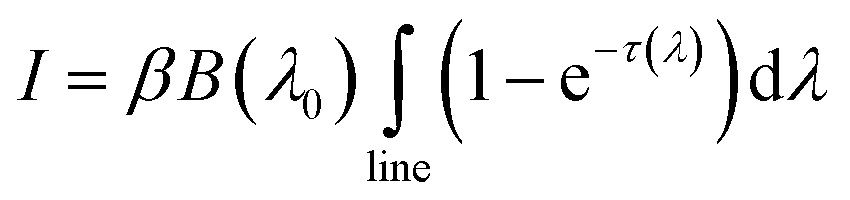
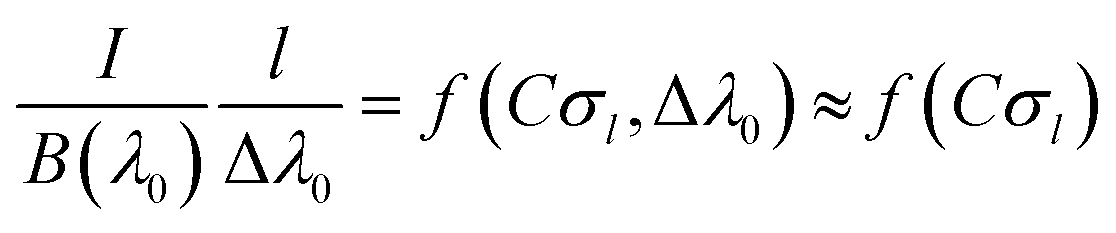
The CF-LIBS algorithm is described in detail in many papers; it would not be particularly useful to repeat the simple but rather tedious description of the various steps of the algorithm. However, in our opinion it's worth reminding the reader that the main idea of CF-LIBS is to determine the electron temperature and, eventually, the electron number density of the LIBS plasma, under suitable hypothesis about the existence of some sort of equilibrium between the excitation/deexcitation and ionization/recombination processes in the same plasma. After that, the elemental concentrations of the species in the plasma are calculated, up to a constant multiplicative scale factor F, exploiting the equations which link the measured LIBS intensity to the species number concentration, at the measured electron temperatures and number density, from the knowledge of the spectral parameters of the transitions (energy levels, degeneracies, and transition probabilities) and of the elements (first ionization energies). The constant scale factor depends on the ablated mass and on the efficiency of the chain collection optics/spectrometer/detector. It can be determined by imposing the closure to 100% of the sum of the concentrations of all the species in the plasma; the sample composition is thus determined using the sole information obtained from the LIBS spectrum, without the need for external or internal standards, reference samples, etc.We were purposedly vague on how the plasma electron temperature and electron number density are determined from the LIBS spectrum, as well as on the equations which link these parameters and the measured line intensities to the number concentration of the species in the sample.
This is because over the years our ability in treating the LIBS spectral information has considerably improved, so that some approximations that were considered necessary 23 years ago (such as, for example, the approximation of optically thin plasma) are now not necessary anymore. From the 1999 work of Gornushkin et al. on the application of the Curve-of-Growth (COG) approach to LIBS plasmas8 to the cited 2002 work of Bulajic et al.,2 based on the Gornushkin paper, passing through the 2002 Amamou et al. equations9 to arrive to the 2005 Pisa group paper, which definitively solved the issue,10 we have progressively learnt to treat the radiation transfer equation, which gives the number of photons per unit time emitted along the line of sight by a plasma
 | (1) |
 | (2) |
 | (3) |
 | (4) |
Having an effective tool for solving eqn (1), the k(λ)l ≪ 1 approximation which simplifies it, after integration of the line emission, in the commonly used Boltzmann equation:
 | (5) |
Using in the CF-LIBS algorithm the correct eqn (1) instead of its approximated form (5) (or, equivalently, continuing using eqn (5) and correcting the line intensities for compensating for the self-absorption effects) does not change the principle of CF-LIBS and definitely, does not entitle anyone to claim to have ‘enhanced’ the CF-LIBS method for just applying some straightforward self-absorption corrections to the basic CF-LIBS equations.
The same argument applies to the papers which boast as improvements minor changes in the method with respect to the 1999 original paper (such as using double pulses for creating the LIBS plasma11 or using the Saha–Boltzmann plot method12 instead of the Boltzmann plot for determining the plasma electron temperature). These ‘improved’ methods must be considered as routine applications of the conventional CF-LIBS algorithm. The use of purposedly invented, fancy new acronyms to indicate minimal variations, or in many cases just plain reformulations of the original CF-LIBS idea, should be deprecated.
In the following, we will present and discuss only the articles published after the 2010 review5 which, in some way, have changed the CF-LIBS paradigm, neglecting all the papers which do not contributed to real improvements of the CF-LIBS method.
This will be done in the next sections.
3. Evolution of the CF-LIBS technique
In this section, we will describe some calibration-free approaches that are substantially different on the classical formulation based on the Ciucci et al. 1999 paper.1 Basically, these are improvements of the original technique which can be grouped into two different classes: the first group refers to approaches that evolve the CF-LIBS idea maintaining a strict standard-less approach. The second group comprises, instead, the versions of CF-LIBS, which exploit the information acquired from a single standard of known composition for improving the figures of merit of the classical CF-LIBS calculation. By analogy with the fundamental parameter method in X-ray fluorescence,13 these techniques can be classified as fundamental parameter CF-LIBS approaches.14 In Table 1, we have listed the main approaches discussed in the text, summarizing their basic merits and analytical performances. With respect to this last point, Tognoni et al.15 reported that an analytical estimation on the uncertainty of the CF-LIBS results is very complex, if not impossible. Moreover, it is difficult to infer the analytical figures of merit of the different approaches because different parameters are considered in the different papers and, in some cases, these parameters were only presented in the graphical form, by plotting the predicted vs. nominal concentration of the samples, for example. Therefore, in Table 1 we tried to assess the analytical performances of the different CF-LIBS approaches in terms of their trueness and precision on the determination of the composition of the samples considered (when available). We refer the reader to the discussion in the text and to the relevant papers for a more detailed analysis of these approaches.| Method | Proponents | Ref. | Advantages | Application | Error | |
|---|---|---|---|---|---|---|
| Alternative CF-LIBS approaches (strictly standard-less) | Self-calibrated LIBS | De Giacomo et al. | 17 and 19 | The analysis does not require plasma under LTE conditions | Meteorites17 | Trueness better than 5 wt% on major element concentration |
| Copper-based alloys19 | Trueness better than 2 wt% on Sn concentration | |||||
| 3D–CF–LIBS | Bredice et al. | 24 | Analysis at different delay times, better determination of plasma temperature | Binary lead–tin alloys | Relative error <7% on the major component of the alloy (precision ± 2 wt%) | |
| Artificial neural network CF-LIBS | D'Andrea et al. | 30 | Fast CF-LIBS analysis | Cu–Ni binary alloy (synthetic spectra) | Not applicable (synthetic spectra) | |
| Columnar density CF-LIBS | Cristoforetti and Tognoni | 31 | Calibration-free analysis in the presence of strong self-absorption | Ca in limestone samples | Relative error <4% on CaO concentration | |
| Fundamental parameter CF-LIBS approaches (use one or more standards of known composition) | One-point calibration CF-LIBS (OPC) | Cavalcanti et al. | 27 | Corrects errors due to uncertainties in detector efficiency and transition probabilities. Partially compensates for self-absorption effects | Copper-based alloys | Trueness better than 1 wt% on the major element concentration |
| Inverse CF-LIBS | Gaudiuso et al. | 35–38 | Better determination of plasma temperature | Archaeological bronze samples36 | Trueness better than 6 wt% on Zn concentration | |
| C-sigma method | Aragon and Aguilera | 40 and 41 | Compensates for weak self-absorption | Fused glass samples41 | Average relative error <10% | |
| Extended C-sigma | Safi et al. | 42 | Extends the C-sigma method compensating for self-absorption of arbitrary strength | Steel samples | Not reported | |
| Time-independent extended C-sigma (TIECS) | Poggialini et al. | 43 | Improves the extended C-sigma method considering spectra acquired at different delay times | Tantalum samples | Not reported |
3.1 Alternative CF-LIBS approaches
De Giacomo et al.17 proposed a variant of the CF-LIBS method, called self-calibrated LIBS (SC-LIBS) based on the assumption that partial local thermal equilibrium (p-LTE) is present in the plasma. In a p-LTE plasma the distribution of the electron energies in the atoms does not follow the Boltzmann statistics. However, in general the deviations from LTE principally affect the ground state of the transition, while the higher energy levels are less affected by the non-ideality of the plasma. The determination of the electron temperature is usually done by plotting the logarithm of the line intensity vs. the energy of the upper level of the transition (Boltzmann plot).18 Therefore, excluding from the Boltzmann plot the transitions ending on the ground state of the species and considering the same energy range interval for each species, an estimation of the plasma electron temperature can be obtained also under non-LTE conditions. To minimize the temperature changes during the (long) acquisition time, the authors also excluded from the Boltzmann plot all the transitions with emission times comparable with the time associated with plasma variations. As a further interesting differentiation with respect to conventional CF-LIBS analysis, the authors normalized the signals to the background black body emission, to obtain the calculated species concentrations without recurring to the 100% closure conditions for the determination of the experimental scale factor.
The authors of ref. 17 tested the possibility of using this method analysing the composition of four different meteorites using large gate times (5000 ns in their paper).19 First, they verified the LTE assumption for Fe I lines (the prevailing element in all samples) in a wide energy range, and then restricted the analysis only to the transitions with upper energy levels in the previously measured energy range, to be sure that this assumption was also valid for other elements. Besides the transitions involving the ground state and the ones with characteristic lifetimes longer than the characteristic decay time of the plasma temperature, the authors excluded from the Boltzmann plot all the emission lines with high relative intensity, to avoid the overestimation of the corresponding population.
Moreover, for all examined samples they found out that the contribution of ionized fraction of the elements in the LIBS spectrum was generally 2 orders of magnitude lower than the neutral fraction, and therefore the authors only determined the concentrations of the neutral species, estimating the concentration of the ionized species using the Saha–Eggert equation.
In a paper published by the Pisa group,20 the authors faced the same issue discussed in ref. 19 of using a CF-LIBS approach on spectra acquired with a long integration time (milliseconds, in their case). They demonstrated that, when the lifetime of the emission lines considered for the determination of the electron temperature is much shorter than the integration time, the time-integrated signal obtained provides information about the plasma parameters which is equivalent to the one that could be achieved using a time-resolved spectrometer, with a gate time comparable with the decay time of the LIBS spectral intensity, which is, under the typical LIBS conditions, of the order of a few hundreds of nanoseconds.
In the recent LIBS literature, several authors have justified the use of time-integrated spectrometers for performing CF-LIBS analysis by quoting the results of ref. 17, 19 and 20. However, from the discussion above it is clear that the conditions for using the CF-LIBS approach with long integration times are very narrow and cannot be generalized before being tested case-by-case. To simplify the analysis and avoiding unnecessary approximations, the authors of ref. 20 illustrated a simple method for the recovery of time-resolved spectra using a time-integrated spectrometer, based on the numerical estimation of the changes occurring between two spectra taken at different delays (and very long integration times) after the laser pulse, i.e.
| S(t,Δt) = S(t + Δt,∞) − S(t,∞) | (6) |
This simple and effective method has been identically reproposed by Ahmed et al.21 in 2016 (two years after the publication of the original paper by the Pisa group).
The main difference between the 3D Boltzmann plot and the conventional Boltzmann plot is that on the y axis of the 3D Boltzmann plot are plotted the logarithms of the ratio between the line intensities at times t and t0 (the minimum delay time considered in the analysis). Note that this ratio is independent on the transition probabilities, which are often known with large uncertainties. Comparing the intensities of two emission lines of the same element at two or more time delays after the laser pulse allows for a better estimation of the plasma temperature with respect to the conventional Boltzmann plot.
When applied to calibration-free analysis, this procedure is called 3D-CF-LIBS.24 Considering the fact that the composition of the sample does not change in time, it has been demonstrated that the study of the temporal evolution of the line emission allows for more precise quantitative results than averaging the compositional results of conventional CF-LIBS at the different delays considered.
From a theoretical point of view, if the plasma can be considered homogeneous and under nearly LTE conditions, the temporal evolution of the plasma electron temperature can be inferred from a time-dependent function, the coefficients (Bi) of which can be determined by the best polynomial fit of the logarithm of the intensity ratio of the spectral lines considered.
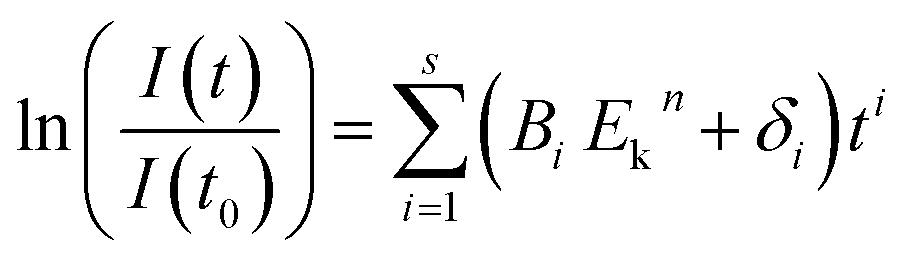 | (7) |
Eqn (7) in most cases can be well approximated by the first element in the sum (exponential decay of the emission lines). Consequently, the electron temperature at time t can this be expressed as a function of the temperature T0 at time t0:
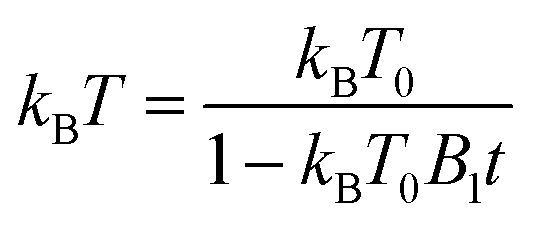 | (8) |
It is worth noting that eqn (8) is obtained without exploiting the knowledge of the transition probabilities of the lines and is independent of the spectrometer efficiency. However, these parameters are still necessary for the determination of the temperature at time t = 0.
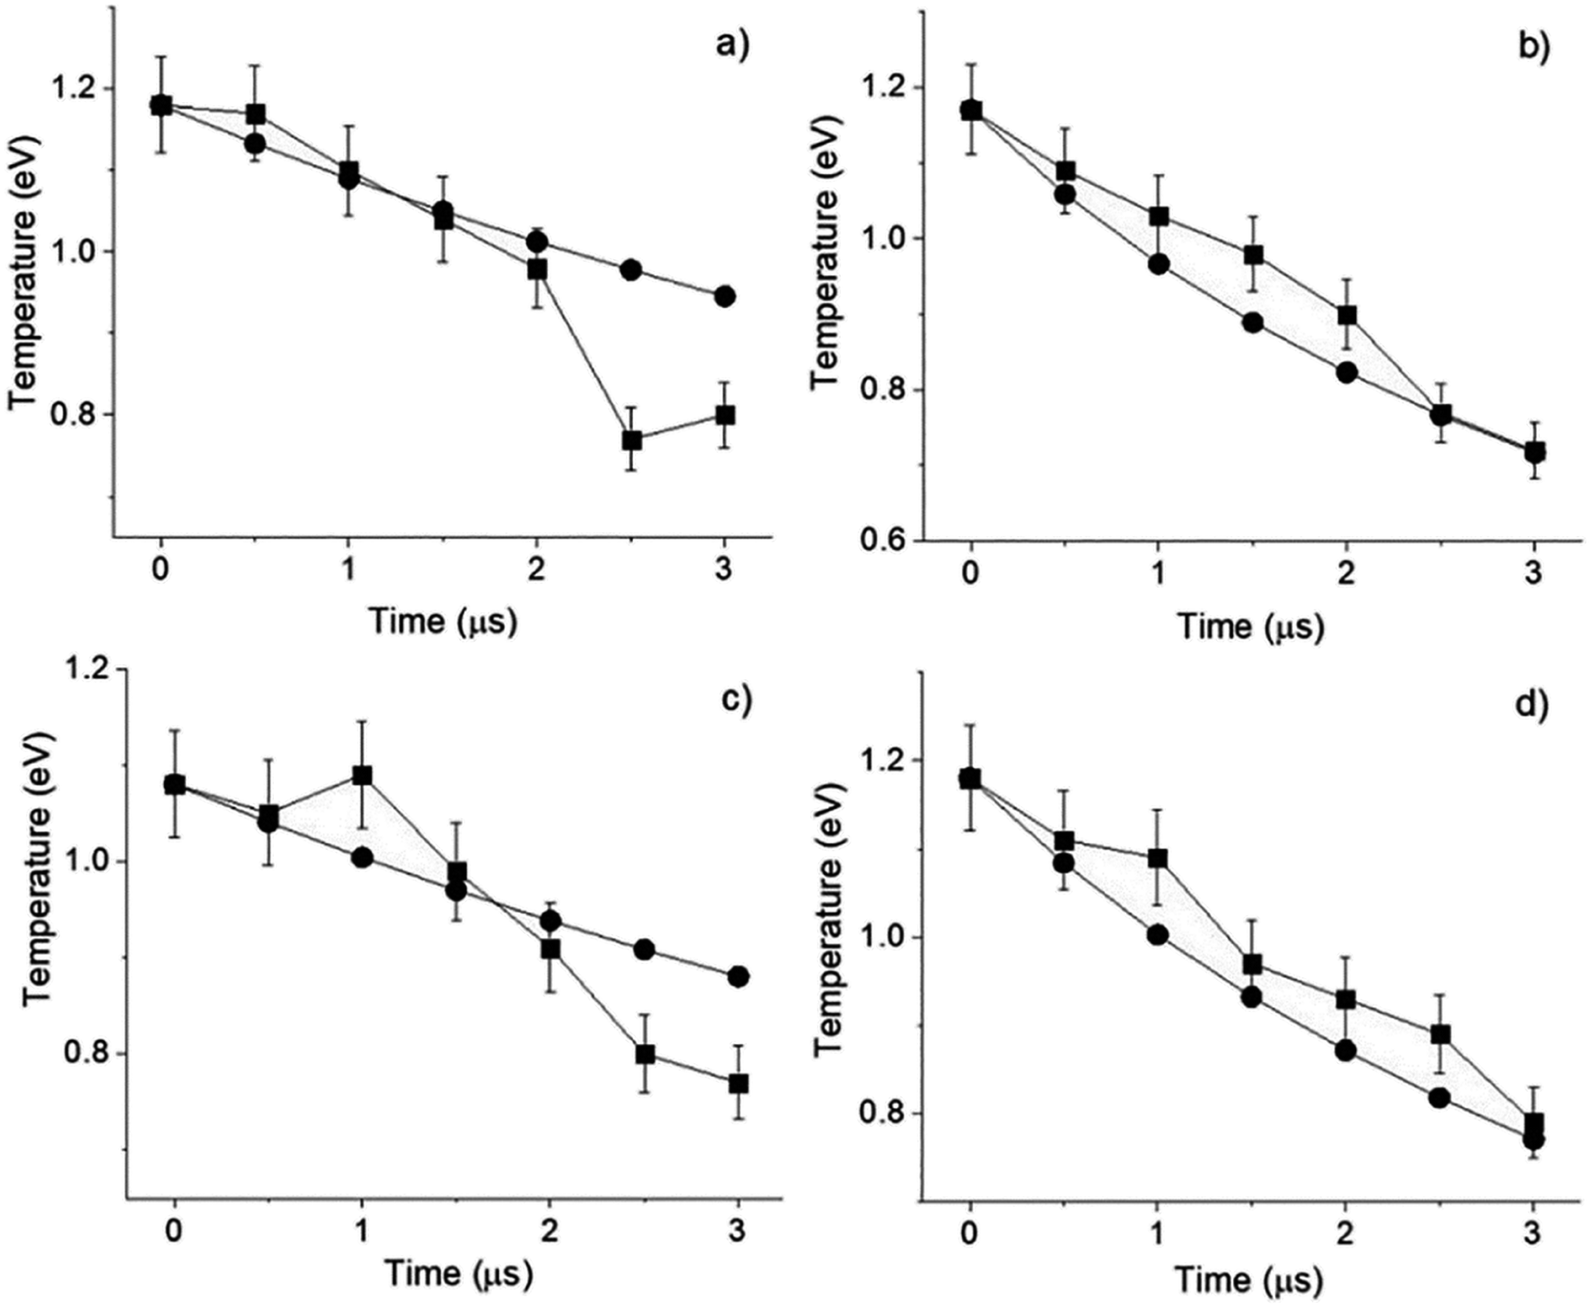
The authors verified the reliability of the electron temperature estimation given by eqn (8) studying several Cd lines in laser-produced plasma spectra emitted from a pure-cadmium sample, at two different time delays, 2 and 6 μs.23 They pointed out that the error in the determination of the Bi coefficients can be substantially reduced using lines that have well-separated upper energy levels, to reduce the dispersion of the experimental points.
In the 3D-CF-LIBS method, after having determined the electron temperature at all the delay times considered from eqn (8), the intercept q of the species is calculated at t = t0, using the combined information carried by all the lines of the species at all the delay times used for building the 3D Boltzmann plot. The sample composition is then obtained in the usual way, from the closure to 100% of the sum of the species concentration.
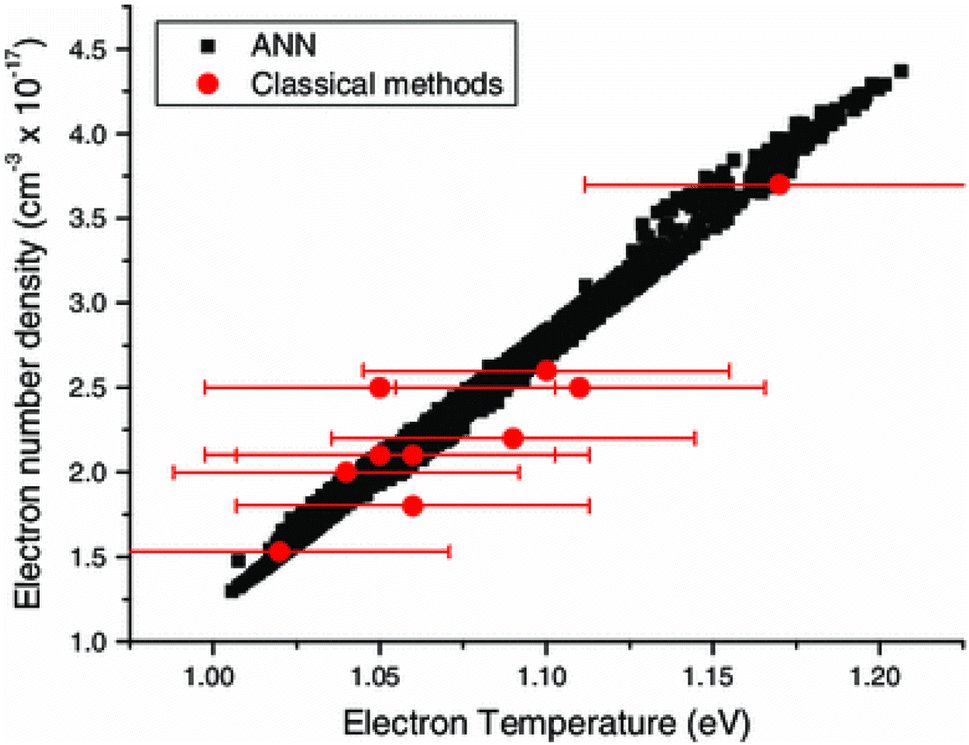
The authors tested their method in ref. 24 calculating the composition of binary lead-tin alloys. The parameter B1 was calculated using four ionic lines of Pb (under the experimental conditions used in the paper, the ionic species of Pb and Sn where predominant in the plasma) and the corresponding concentrations evaluated using the 3D-CF-LIBS procedure were compared with the results of conventional CF-LIBS (see Fig. 2).
 | ||
| Fig. 2 Comparison between the temperatures predicted by the 3D-Boltzmann technique (circles) and calculated from the conventional Saha–Boltzmann plot (squares). (a) 15% Pb–85% Sn, (b) 30% Pb–70% Sn, (c) 70% Pb–30% Sn, and (d) 85% Pb–15% Sn. The error bars correspond to the uncertainty in the temperature calculated using the Saha–Boltzmann equation. They are due to the uncertainty in the electronic density and the intensity of the spectral lines used in the calculation. Reproduced from ref. 24 with permission from Elsevier, copyright 2020. | ||
The authors found that both the approaches slightly overestimated the Pb concentration (thus underestimating the one of Sn), probably due to the errors in the transition probabilities of the Pb lines considered. In any case, 3D-CF-LIBS provides a closer trueness than conventional CF-LIBS and much better precision. They also commented that the constant bias of ±4.5% of the 3D-CF-LIBS results could have been totally compensated for using the One-point Calibration (OPC) approach,27 which will be discussed in the next section.
Despite the obvious advantages of the 3D-CF-LIBS method, it should be highlighted that the calculation of the temperature evolution requires the determination of the line intensities at separate times and their elaboration. The authors proposed a substantial improvement of the method recurring, for simplifying the building of the 3D Boltzmann plot and the consequent determination of the temporal dependence of the plasma electron temperature, to a variant of the Independent Component Analysis (ICA)28 called Mean-Field Independent Component Analysis (MFICA).24 This variant of the ICA technique was chosen by the authors because it has a better physical sense for describing LIBS spectra, the different components being always positive.
The method was tested on a set of brass alloy targets (∼60% Cu and ∼40% Zn) containing Fe, Mn, Pb, Sn, Ni and Al as minor components; the LIBS spectra were acquired in the interval between 1000 and 5000 ns after the laser pulse with a 250 ns gate width. The authors were also able to identify in the LIBS spectra the lines most affected by the self-absorption/self-reversal effect, avoiding their use for the electron temperature determination. A good agreement between the results obtained with this method and the classical Saha–Boltzmann plot approach was proved.
The 3D Boltzmann plot has been also successfully adopted to measure the atomic transition probabilities of the emission lines of a given element:26 Urbina et al. verified that the constants Bi can be considered as constants depending only on the species considered. Moreover, the calculation of these coefficients also allowed the determination of the time interval in which the plasma LTE conditions are reasonably satisfied.
 | ||
| Fig. 3 Correlation between electron temperature and electron number density. Black squares: ANN prediction and large red dots: value calculated from the average spectrum. The error bars represent the confidence limits on the electron temperature determined by the Saha–Boltzmann method. Reproduced from ref. 29 with permission from Springer, copyright 2014. | ||
The feasibility of the ANN-CF-LIBS method was tested on a pure titanium target where 50 single LIBS spectra were acquired in four independent spots, under 12 different experimental conditions. The intent was to obtain a set of spectra corresponding to a relatively wide range of electron temperatures and number densities for training the ANN, which accepted the titanium line intensities as input giving as an output the corresponding electron temperature and number density. The efficiency of the method was tested using the leave-one-out method, with excellent results.
The ANN-CF-LIBS approach was then successively applied to the determination of the composition of computer-simulated Cu–Ni alloys.30 In this case, 1000 spectra per sample were simulated, corresponding to different electron temperatures and number densities. After proper training, the ANN-CF-LIBS algorithm was able to recover the composition of the samples giving, at the same time, an evaluation of the electron temperature and number density on a single-spectrum basis.
Since the Bulajic et al.2 paper, published shortly after the introduction of the CF-LIBS method, it became clear that the self-absorption effects in most cases cannot be neglected nor is always possible to pick the emission lines in the spectrum to perform the CF-LIBS analysis using only optically thin lines.
After the paper of the Palleschi group which introduced a simple way for evaluating and compensating for the effects of self-absorption on the line intensity,10 optically thick and optically thin lines can be managed together in a pure CF-LIBS approach without any particular difficulty.
On the other hand, it has been noted that the self-absorption effects can also be exploited for improving the analytical performances of the LIBS technique.3
Cristoforetti and Tognoni in ref. 31 proposed that, in the presence of strong self-absorption, the composition of an unknown sample can be calculated using a CF-LIBS approach, which exploits a modified version of the Saha–Boltzmann plot.
According to their approach, the Saha–Eggert equation describing the ionization equilibrium in the plasma can be rewritten in a linear form similar to the Saha–Boltzmann plot:
 | (9) |
 | (10) |
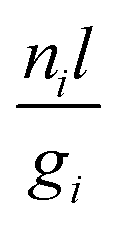
 | (11) |
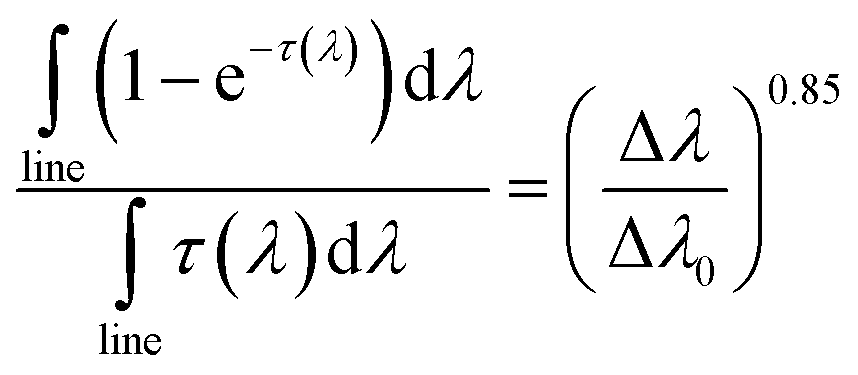
The term that takes the place of the species concentration in eqn (9) is now the columnar density Nl of the element, while the parameter that takes the place of the line intensity in eqn (11) is the columnar density of the population of the emitting species at the lower level of the transition.
The y coordinates in this modified Saha–Boltzmann plot can be written in terms of the integrated absorption coefficient of the corresponding emission line considering that, according to eqn (5):
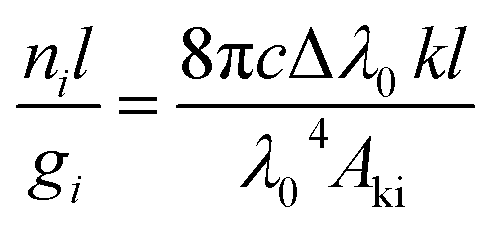 | (12) |
Moreover, the relationship found by the Pisa group10 between the integrated absorption coefficient, the FWHM of the emission line and its measured value Δλ:
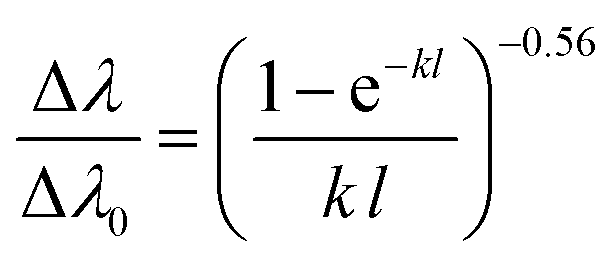 | (13) |
 from eqn (12)).
The value of Δλ0 can be estimated by measuring the electron number density ne32 and knowing the Stark broadening coefficients ws of the emission lines, exploiting the linear relationship that links Δλ0 to these two parameters:
| Δλ0 = wsne | (14) |
The authors of ref. 31 tested the analytical performances of their columnar density Saha–Boltzmann plot calculating the Ca concentration in a limestone sample. A very good agreement was found, after the conversion of the elemental concentration to the equivalent CaO weight concentration (about 52 wt% against a certified value of 50.07 wt% – an error of less than 4%).
3.2 Fundamental parameter CF-LIBS approaches
In their paper ‘from calibration-free to fundamental parameters analysis’14 the authors discussed the advantages of partially relaxing the basic principle of the CF-LIBS approach, i.e. the standardless determination of unknown sample composition based only on the information derived from its LIBS spectrum.Adding to the CF-LIBS paradigm the information coming from a single standard (of similar composition to the samples to be analysed) would greatly improve the trueness of the method while maintaining the capability of CF-LIBS to compensate for changes in electron temperature and number density from one LIBS spectrum to the other. In the following, we will illustrate some of these methods, introduced after the publication of the 2010 review.5
This transformation is then applied to the Boltzmann plot of the unknown samples, for the determination of the corresponding electron temperature and composition. It is worth noting that in the OPC method the information about the single standard is exploited only for calculating the F(λ) correction factor; after that, the workflow follows the conventional CF-LIBS calculation. In the work of Cavalcanti et al. this approach was applied to a set of copper-based samples to determine the concentrations of the four main elements Cu, Zn, Sn and Pb. By rescaling the points in the Boltzmann plot with the F(λ) corrections obtained on a single standard, a much better correspondence of the concentrations calculated with the nominal composition of the standards was obtained using the OPC method than the one obtained using conventional LIBS analysis (Fig. 4).
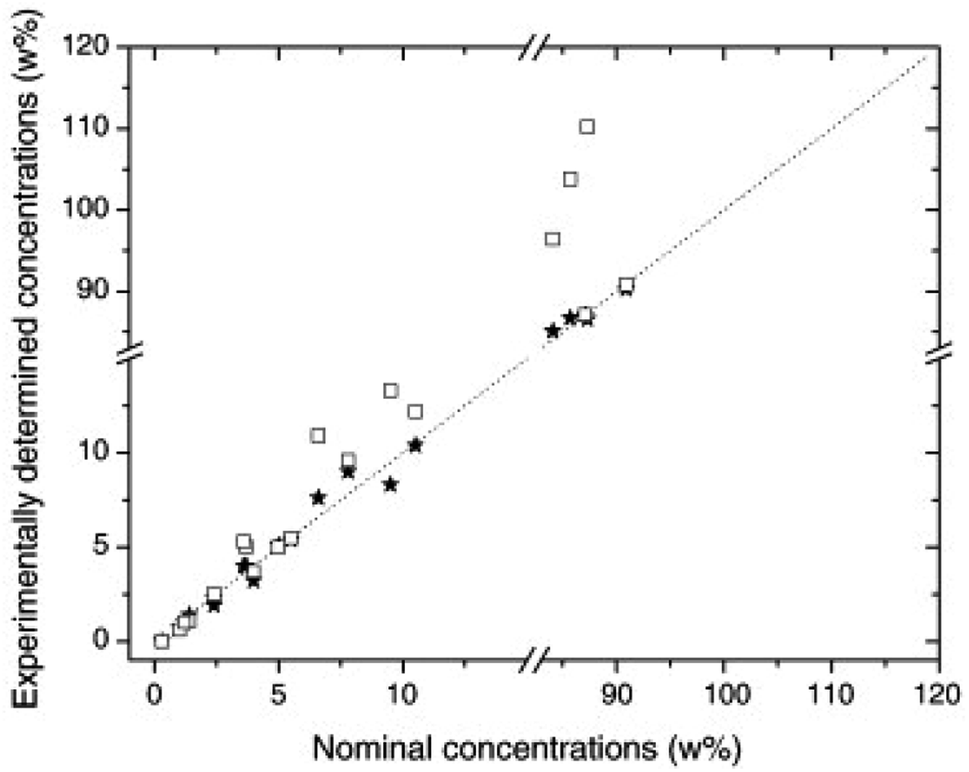 | ||
| Fig. 4 Comparison of the concentrations calculated by OPC-LIBS (stars) and by conventional LIBS (squares) vs. the known concentrations (measured by XRF). The dashed line corresponds to the ideal correspondence between nominal concentration and experimentally determined concentration. Reproduced from ref. 27 with permission from Elsevier, copyright 2013. | ||
Minimal modifications to the OPC algorithm were proposed by several authors.33,34 As discussed in the Introduction, it's not worth discussing them here, since these ‘improved’ methods are just straightforward applications of CF-LIBS and do not add anything new to the knowledge in the field.
The plasma electron temperature is determined by applying a conventional CF-LIBS calculation of the reference sample composition at different temperatures T. The optimum plasma temperature is taken as the one that minimizes the discrepancy between the calculated and the nominal composition of the certified sample
 | (15) |
The method assumes that if different samples with similar matrices are ablated under the same conditions, the excitation temperatures of the produced plasmas would be the same. Therefore, the inverse CF-LIBS method is not capable, by definition, to deal with changes in the electron temperature from one spectrum to the other, due to laser energy fluctuations or slight matrix changes between samples. On the other hand, since the electron temperature is defined by the procedure, the Boltzmann plot can be drawn even in the extreme case, where just a single emission line for each element is available.
Gaudiuso and co-workers validated the inverse CF-LIBS procedure for a set of bronze and brass standards working under different experimental conditions (7 ns and 250 fs laser pulse, and three laser wavelengths), and applied it to the analysis of various archaeological objects.35,36 The results obtained in ref. 36 with inverse CF-LIBS on a set of archaeological brooches made of various copper-based alloys were found to be in good agreement with the ones obtained using the LA-ICP-MS technique.
Gaudiuso also demonstrated the use of the CF inverse method for depth-profile analysis.37 At first the author demonstrated that, during the in-depth analysis, no geometrical, instrumental, or physical factors systematically affect the process of plasma formation and emission of radiation. The observation of systematic changes of the electron temperature throughout the depth profile would make the application of the inverse CF method impossible since the electron temperature is assumed to be constant (and the same evaluated on the single standard through minimization of eqn (9)). The author concluded that the inverse method is best suitable for shallow craters with a low depth/diameter aspect ratio, where plasma confinement in the crater is not important. Depth-resolved analysis was then performed for the analysis of Pb and Sn in archaeological findings. The analytes were determined by both the inverse CF method and the classical calibration-line method (by using certified bronzes as standard samples), finding a good linear correlation between the two series of measurements (see Fig. 5).
 | ||
| Fig. 5 Correlation plots of the concentration of Sn ((a), (c) and (e)) and Pb ((b), (d) and (f)) along the depth profiles of the three archaeological handiworks (top frames: brooch; middle frames: pendant; bottom frames: coin) as determined with two LIBS methods (CF inverse method and calibration line method). Reproduced from ref. 37 with permission from Elsevier, copyright 2016. | ||
Inverse CF-LIBS was compared to OPC CF-LIBS by the group of Palleschi exploiting modern bronze samples.14 The authors found that, as it was expected, the inverse CF method did not perform properly in the presence of self-absorbed lines. The average uncertainty of the OPC approach was around 15% against the 53% of the inverse CF method. However, the authors concluded that by applying proper corrections for self-absorption, the two methods will probably give similar results.
The feasibility of the inverse method in the cases of unknown samples with matrices different from that of the employed standard, a critical issue in quantitative LIBS analysis, was lately demonstrated by Gaudiuso et al.38 In their work the concentration of Hg, Ag, Cu, Pb, Au, Si, and Ca in ancient coins was determined using a homemade ternary bronze as a reference sample. The authors obtained results in good agreement with those acquired from independent micro-XRF measurements. A further observation regarded the thermal character of the ablation, which is detrimental to the depth resolution, and the efforts that should be made in the future to reduce it.
Also in this case, minimal ‘improvements’ of the inverse CF-LIBS method have been proposed39 which will not be discussed here.
A COG is the function which expresses the intensity of a given spectral line as a function of the concentration of the analyte and the spectral and experimental parameters (eqn (16))
 | (16) |
Finding a COG model that can be readily and widely applied to all the emission lines is not a trivial task. In their studies, Aguilera and Aragon aimed at obtaining a generalized COG equation that could be applied to spectral lines having different linewidths, both under optically thin and optically thick conditions. To account for the inhomogeneity of the plasma, the proposed model uses two different distributions: one for neutral species and one for ions. They then obtained a generalized COG equation as:
 | (17) |
 | (18) |
The authors found that, by plotting the line intensity (left term of eqn (17)) for different emission lines with different widths as a function of Cσ, the obtained curves (called Cσ curves) closely follow the same trend. Moreover, such curves are linear when the values of Cσ are small, with a slope depending on the plasma electron temperature.
The proposed Cσ method has the definite advantage of being widely applicable and having almost no restrictions. That being said, it remains a fairly complicated approach. The equation of the generalized COG contains an integral part that must be solved by recursive analysis of the experimental data in order to obtain the final Cσ plot or approximated in some way. Starting from these considerations, Safi et al.42 proposed an extension of the C-sigma method which can also be applied in the case of very strong self-absorption and guarantees the linearity of the C-sigma plot for all the values of the self-absorption parameter.
According to the authors, an extended Cσ model can be obtained by using the relationship derived by the Pisa group:10
 | (19) |
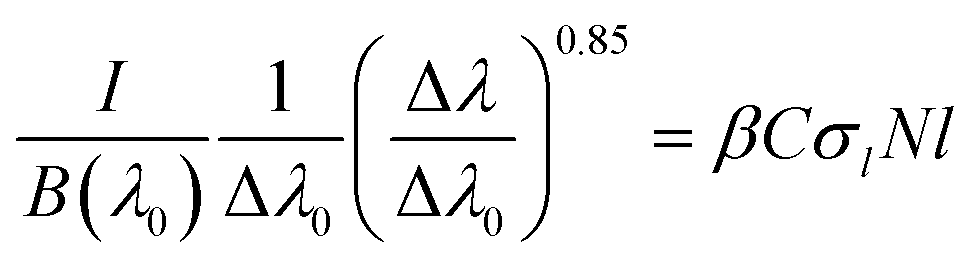 | (20) |
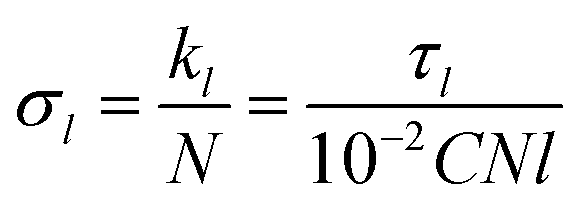
The product Nl is the columnar density31 of the element of interest, C is the concentration of the species considered and σl is the absorption cross-section averaged along the line profile.
Using eqn (14), an extended (and linear) C-sigma plot can be easily obtained, since both the line intensity and the FWHM can be experimentally determined. This makes the fit of the experimental data fast and more accurate, allowing a determination of the sample composition not affected by the self-absorption (see Fig. 6). The original formulation of the method by Aragon and Aguilera was limited to weakly self-absorbed lines (Δλ ≈ Δλ0).
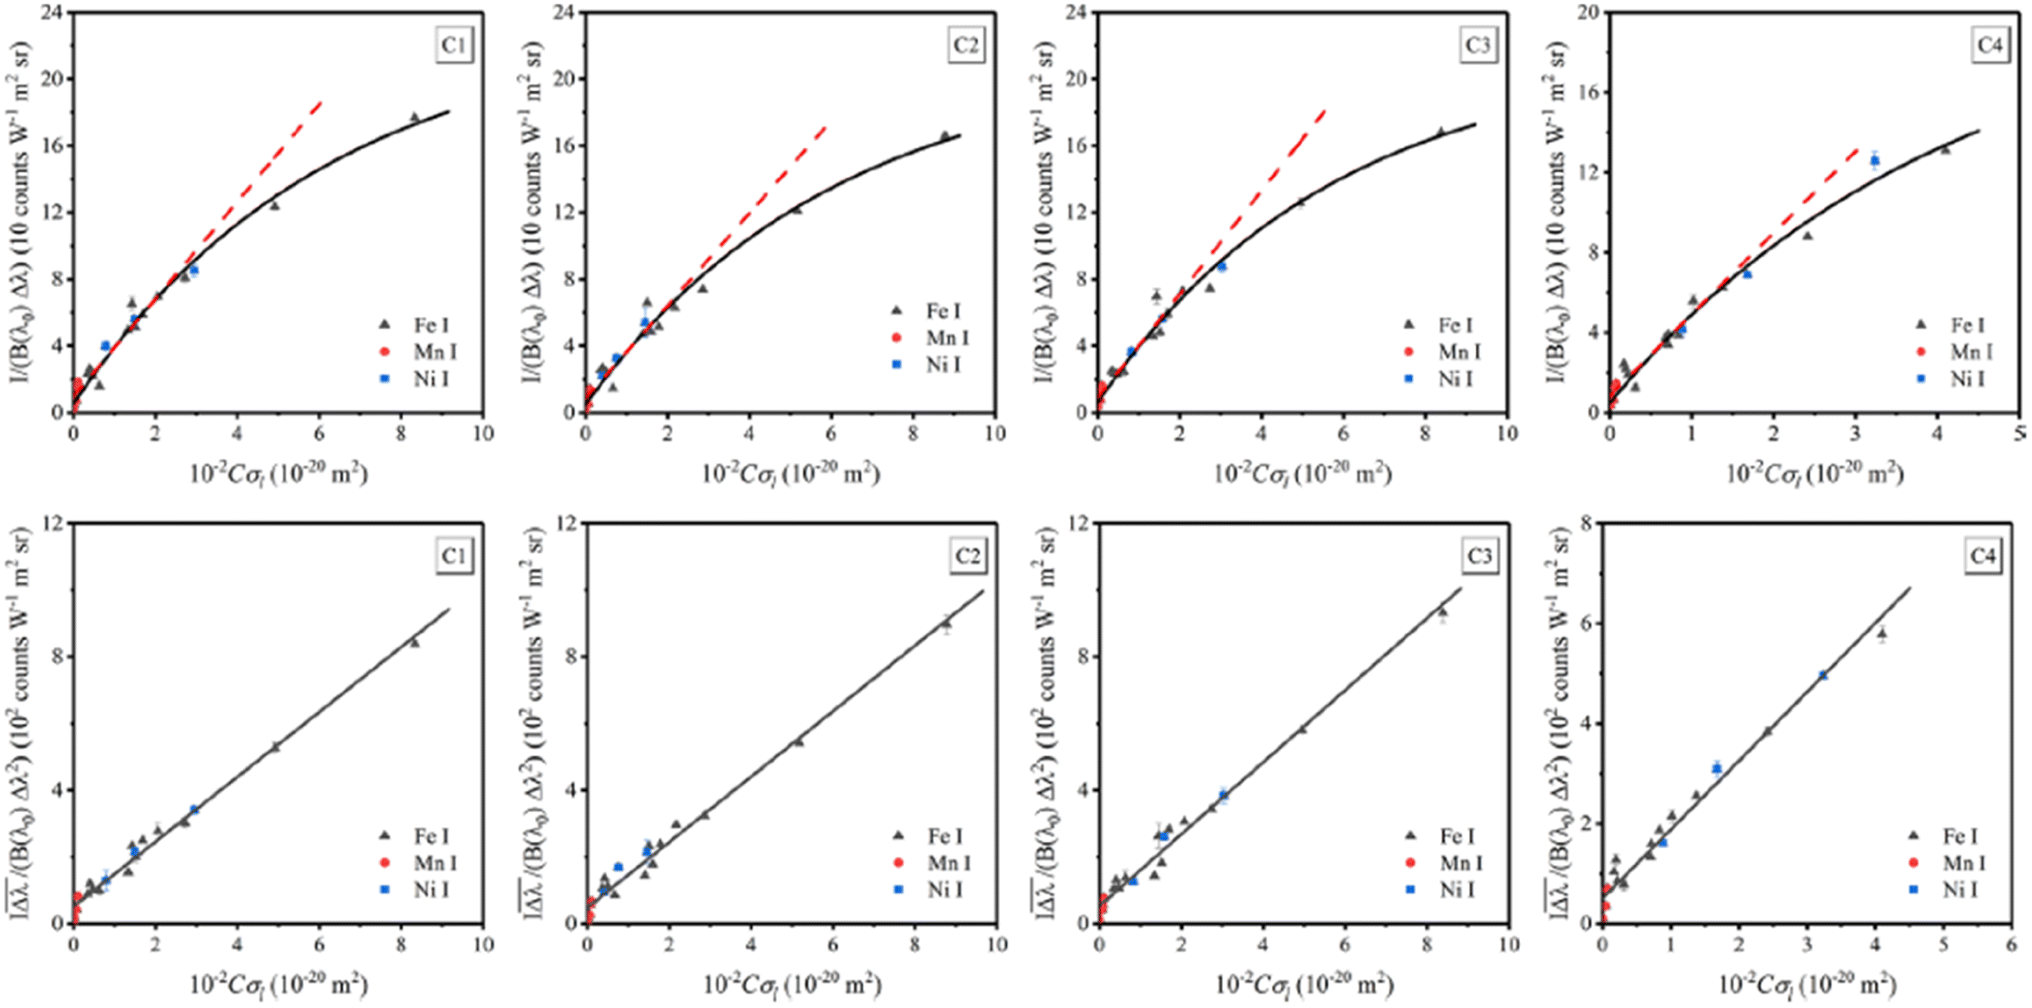 | ||
| Fig. 6 C-Sigma (top) and extended C-sigma (bottom) plots, showing the linearity of the ECS model. Reproduced from ref. 42 with permission from ACS Publications, copyright 2019. | ||
In both the original C-sigma approach and the extended one, the optically thin linewidths Δλ0 can be obtained by measuring the electron number density32 and knowing the Stark broadening coefficients ws of the emission lines.
The work by Poggialini et al.43 demonstrates the possibility of measuring the Stark coefficients of emission lines whose transition probabilities are known, by acquiring LIBS spectra at different times after the onset of the plasma (Time-Independent Extended C-Sigma – TIECS) method. In the TIECS approach the points corresponding to a few optically thin lines are used as a reference for calculating the plasma temperature and the electron number density at the different time delays and defining the C-sigma curve. The ordinates of the optically thick lines are then re-calculated to have their corresponding points lie on the previously determined curve by adjusting the value of the Stark broadening coefficient, which is the only free parameter. Each emission line would be plotted n times, with n equal to the number of different delays considered.
Using the TIECS method, the authors determined the Stark broadening parameters of 23 Ta lines (4 neutral and 19 ionic) with a precision of around 30% (on average).
A similar procedure can be used for the determination of the transition probabilities of emission lines whose Stark coefficients are known.44 The authors also remarked that the TIECS method can also be used for the determination of the composition of an unknown sample, provided that all the spectral parameters (transition probabilities and Stark coefficients) are known (i.e. when well-known spectral lines are monitored).
The same approach and method were applied in a subsequent study by Safi et al.45 for the determination of the spectroscopic parameters of several Ag I and Ag II emission lines. In that work, the authors were able to obtain both the Stark coefficients and the transition probabilities (Aki) of the studied lines.
4. Applications
In this section, we will review some applications of CF-LIBS in many different fields, ranging from industrial applications to environmental analysis and geology, to cultural heritage. The focus will be mainly on the most recent papers that were not included in the review by Tognoni et al.54.1 Industrial applications
The CF-LIBS technique has been extensively used for the analysis of industrial materials. From the historical point of view, the first example of the capabilities of the CF-LIBS method was in the standard-less determination of precious alloy composition.1,46 The method is still considered very useful in the precious metals industry, given the large variability of the materials that can be used in this field. Ahmed et al.47 in 2018 reproposed this idea for the determination of the gold caratage of precious alloys, thus confirming the findings of the Palleschi group that first proposed this application.Praher et al.48 in 2011 analysed the composition of industrial oxides using CF-LIBS. In their paper, the authors also recalculated the α and β coefficients obtained by the Palleschi group in 2005,10 confirming essentially the same results.
In 2013 Cavalcanti et al.49 applied the CF-LIBS algorithm to the stratigraphic analysis of oil scales using a double-pulse LIBS configuration.
Ahamer et al.50 in 2016 determined the concentration of CaO, Al2O3, MgO, SiO2, FeO, MnO and TiO2 oxides in steel waste. They also studied the influence of detection geometry and signal normalization on the trueness of the results obtained. Diaz Pace et al.51 in 2017 similarly studied the composition of foundry wastes.
Fayyaz et al.52 compared CF-LIBS with many other analytical techniques such as LA-TOF-MS, EDX, PIXE, and XRF in the study of the elemental composition of cements. Akhtar et al.53 did the same comparing CF-LIBS with LA-TOF-MS in the study of cements used in building dams and barrages, to prevent pollution of the water. Shakeel et al.54 analysed a Gd/Ge/Si alloy and demonstrated that CF-LIBS could be applied online in the manufacturing process of photovoltaic devices.
Many techniques, which also include CF-LIBS, were investigated by Babos et al.55 to determine Al and Pb in waste printed circuit boards. Iqbal et al.56,57 used the CF-LIBS method for the analysis of coal. Similarly, Israr et al.58 investigated the presence of heavy metals in coal samples, using a time-integrated spectrometer with the method introduced by Grifoni et al.20
Haq et al.59 used CF-LIBS for the study of a polymer (Chitosan). Ahmed et al.60 used CF-LIBS for the quality control of alloys, by comparing it with ICP-MS in the study of an iron-copper alloy. Fayyaz et al.61 compared CF-LIBS and LA-TOF-MS for the quantification of a high-entropy CoCrFeNiMo alloy.
4.2 Environmental analysis
Another field of interest for the application of the CF-LIBS method is environmental diagnostics. Kwak et al.62 in 2011 used CF-LIBS for the quantitative determination of the concentration of lead in soil. Similarly, Kumar et al.63 successfully applied CF-LIBS to quantify the concentration of toxic metals (Cr and Pb) in the sludges of industrial wastewaters.Akhmetzhanov et al.64 measured the Mn/Fe ratio in ferromanganese nodules and found that CF-LIBS correlates well with ICP-AES. The same authors confirmed the feasibility of CF-LIBS analysis on these materials using a portable diode-pumped solid-state laser.65 By investigating Cu emission lines, Jabbar et al.66 demonstrated, using a long-duration pulse, the possibility of doing CF-LIBS quantitative analysis of metal alloys immersed in water. Hafeez et al.67 explored, using CF-LIBS, the possible presence of precious elements in a copper-rich mineral (malachite) and confirmed the results obtained by X-ray fluorescence. Sushkov et al.68 determined by CF-LIBS the Li, Mg, and Ca ratios in zooplankton and confirmed the results with ICP-MS.
Shells are of paramount importance as climate proxies. In a paleoclimate study, Garcia-Escárzaga et al.69 and Martinez-Minchero et al.70 measured Mg/Ca ratios in Patella depressa shells and found a correlation with sea surface temperature (SST), thus highlighting the potential of CF-LIBS in paleoclimatology and archaeology.
Anzano et al.71 performed a multielemental quantitative analysis of Antarctica soil, thus showing that CF-LIBS can be a valuable tool for the characterization of complex samples from remote regions. Rehan et al.72 used CF-LIBS to investigate the effect of earthquakes on the elemental distribution of soil and confirmed the results with ICP-OES. The same group73 found a correlation between nutritional elements in cultivated soils and the quality of the irrigation water by combining CF-LIBS with a conventional calibration-curve approach. They validated their results using ICP-OES.
Elsayed et al.74 proposed the use of CF-LIBS for fast determination of phosphorus concentration in phosphogypsum waste samples, while Khoso et al.75 analysed soils with CF-LIBS to prevent heavy metal contamination of plants used in human alimentation.
4.3 Thermonuclear fusion energy research
One of the most important emerging applications of CF-LIBS is the study of materials that will be used in future thermonuclear fusion energy reactors. In 2012 Almaviva et al.76,77 and Fantoni et al.78 investigated the possibility of using CF-LIBS for the online monitoring of the inner wall of the ITER fusion vessel. In 2016 Pribula et al.79 studied by CF-LIBS tungsten materials used in fusion research.CF-LIBS also entered the ITER project via the research of Karhunen,80 aimed at analyzing deposition on ITER tiles, and by Fantoni et al.81 and Mišcovičová82 to investigate the concentration of impurities in Mo alloys. Almaviva et al.83 estimated the relative concentration of W, Al and D in ITER divertor PFCs to assess the retention of fuel on the wall structure at the ITER. Further CF-LIBS analysis was performed by Maurya et al.84,85 to study the impurities deposited on plasma-facing components and their depth profile in the Indian Aditya Tokamak. Concentration measurements of tantalum (Ta) and rhenium (Re) in tungsten-Ta and -Re alloys were performed by Ibano et al.,86 who aimed at using CF-LIBS for in situ diagnosis of nuclear transmutation.
Veis et al.87 and Dwivedi et al.88 performed a quantitative analysis of H/D in Be/W mixed layers to monitor the fuel retention on the ITER first wall and found a fair agreement with thermal desorption spectroscopy measurements. Hydrogen isotopes in plasma facing components were also investigated by Almaviva et al.,89 who also tested the use of a robotic arm to perform LIBS analysis inside the fusion vessel.
Cao et al.90 investigated the feasibility of CF-LIBS to obtain a quantitative depth profile of corrosion layers in fusion reactors. Feng et al.91 analyzed the depth distribution of lithium corrosion resistance of erbium oxide (Er2O3) to prevent damage to Tokamak blanket systems. Imran et al.92,93 employed CF-LIBS to quantify and depth profile impurities in fusion devices.
WTa + D coatings to be used as plasma-facing components (PFCs) were investigated by Dwivedi et al.94 Roldán et al.95 similarly compared ps and ns LIBS for the characterization of tungsten-based materials (Wzr(D)), while Atikukke et al.96 investigated the erosion and fuel retention in PFCs, by detecting Pb in traces and bulk quantities in Sn-based alloys.
4.4 Cultural heritage and archaeology
The large variety of materials to be analysed in cultural heritage and archaeological studies and the corresponding difficulty in obtaining suitable standards for quantitative analysis have pushed several researchers to develop and use CF-LIBS methods in this kind of application.Gaudiuso et al. successfully applied inverse CF-LIBS to the analysis of archaeological samples36 and performed in-depth profile quantitative analysis exploiting this method.37,38 In 2015 Takahashi et al.97 analysed submersed brass objects with a combination of long and short laser pulses, finding very good agreement with the nominal composition of the major components of the alloy.
Smaldone et al.98 used inverse CF-LIBS with a fs laser to analyse brass objects, while Pagnotta et al.99 in 2018 performed a fast quantitative elemental mapping of highly inhomogeneous cultural heritage materials by first applying a clustering method through the use of Kohonen self-organizing maps,100 and then using CF-LIBS on the prototype spectra of the different clusters. Using a similar approach, Živković et al.101 analysed and performed elemental mapping of mortars and construction materials and found a good discrimination between materials of different compositions, thus allowing an easier classification for mineral-petrographic investigations. Lluveras-Tenorio et al.102 adopted a multi-analytical approach (including thermogravimetry, differential scanning calorimetry, FTIR, micro-Raman, X-ray powder diffraction and CF-LIBS) to analyse 3 commercial carbon-based black pigments, thus providing valuable information for restoration processes.
Senesi et al.103 used calibration-free LIBS for the analysis of LIBS spectra acquired with handheld instrumentation on stone monuments, while Santi et al.104 studied by CF-LIBS and X-ray fluorescence the composition of four mysterious ‘black stones’ conserved at the child home of the famous Italian poet Giacomo Leopardi, in Recanati. The authors found that the stones had a stoichiometric Mg/Si ratio between 1.4 and 1.6, thus confirming the identification of the black stones as serpentine (Mg6(OH)8Si4O10). The clear peaks of Na and Al in the LIBS spectrum also suggested the presence of a low amount of jadeite (NaAlSi2O2), while the peaks of Ca and Fe were attributed to the presence of amphibole of the tremolite-actinolite species (Ca2(Mg,Fe)5[OH,F(Si4O11)]2).
4.5 Food and health
In 2011 Lei et al.105 determined by CF-LIBS the presence of mineral elements in dry milk powder, obtaining a good agreement with ICP-AES measurements and nominal concentrations. Dry milk powder was also analysed by Rehan et al.106 with the aim to detect toxic components. Good agreement between CF-LIBS and atomic emission spectroscopy was also achieved by Agrawal et al.107 in the study of food supplements. In 2017 Ahmed et al.108 investigated the composition of different cigarette brands using CF-LIBS. Other papers have dealt with the CF-LIBS analysis of edible plants (see Rehan et al.109,110 in 2018 and Jabbar et al.111 in 2019). Jabbar et al.112 also characterized inorganic nutrients in maize samples. Ahmed et al.113 combined CF-LIBS with laser-ablation time-of-flight mass spectrometry (LA-TOF-MS) to check the toxicity of commercial antidiabetic tablets. Han et al.114 compared CF-LIBS concentration of Ca, Mg, Al and Fe in Astragalus, a traditional Chinese herb, and demonstrated that CF-LIBS could be effectively used to monitor the dissolution of metallic elements in the material decoction process. Wang et al.115 also studied by CF-LIBS the levels of magnesium and calcium in a traditional Chinese medicine plant (Codonopsis pilosula).Umar et al.116 studied by CF-LIBS the quantity of micronutrients and toxic elements (Li, Al, Si, and Sr) in leaves of plants (Moringa oleifera) used as human food. Jabbar et al.117 investigated the concentration of soluble saline metal in roots grown in salty areas. Aldakheel et al.118 also investigated the presence of toxic elements in roots used in traditional medicine and found a good agreement with ICP-OES results. The same group119 used CF-LIBS for the quantitative determination of nutritional elements and poisonous metals in herbs often used in ayurvedic medicine. By performing quantitative analysis of toxic and nutritional elements in different kinds of black teas, Rehan et al.120 proposed the use of CF-LIBS for spectrochemical analysis of food products. Zhang et al.,121 following the idea already presented in an old paper by Corsi et al.,122 measured the relative concentration of Ca and Mg with respect to Na in hair and nail and confirmed that the CF-LIBS method can be a promising tool for application in biomedicine.
The applications of CF-LIBS to beverages, food and herbal remedies of traditional medicine have grown exponentially in the last few years. In that regard, it should be noted that some reasonable doubt should be raised on the reliability of papers which report the presence of pollutants/poisonous substances in practically all the products analysed. The CF-LIBS algorithm, and the LIBS technique in general, does not work well for elements present at trace levels; it is therefore possible that very small quantities of a substance, not dangerous for health, could be erroneously evaluated as dangerous.
4.6 Geology
The LIBS technique has been widely applied to geochemical analysis, as discussed in a recent review paper by Harmon and Senesi,123 because of its important advantages, including the possibility of using handheld instrumentation.103,124 Consequently, there have been also numerous applications of CF-LIBS methods, some of them already discussed in the sections devoted to specific applications i.e., industry, environment and cultural heritage.Ahmad et al.125 compared CF-LIBS and XRF for the compositional analysis of astrophyllite, demonstrating its feasibility for the compositional analysis of multielemental geological materials of industrial and technological interest.
Fayyaz et al.126 used CF-LIBS for the analysis of rare-earth elements (La, Ce, Nd, Sm and Yb) in deposits of phosphorite, finding excellent agreement with the results of Energy-Dispersive X-ray (EDX) spectroscopy. Horňáčková et al.127 studied by CF-LIBS acid pitchstone, while Wang et al.128 worked on the analysis of the acidity of iron ore.
Agrosì et al.129 in 2014 applied CF-LIBS for the analysis of emeralds using a double-pulse μ-LIBS instrument130 and Tempesta and Agrosì131 used the same technique in 2016 to analyse red beryls. Abbasi et al.132 used CF-LIBS and EDX to chemically analyse thermoluminescence colourless topaz crystals from Pakistan, while Khan et al.133 investigated the elemental composition, mineral phases, and crystalline structure of nephrite jade with CF-LIBS, Raman spectroscopy and X-ray diffraction.
Another promising field for the geological application of the CF-LIBS method is the research on space objects. Dell'Aglio et al.134 and Horňáčková et al.135 used CF-LIBS for an elemental analysis of meteorite fragments. Ozdin et al.136 in 2015 also analysed by CF-LIBS a meteorite found in Košice, Slovakia.
Senesi et al.137 found a good agreement between the composition of meteorites determined by CF-LIBS, ICP-MS and energy-dispersive X-ray spectroscopy-scanning electron microscopy. Tempesta et al.138 applied CF-LIBS for the μ-LIBS analysis of an iron meteorite found in Russia in 2000, while Rai et al.139 performed by CF-LIBS the spectrochemical characterization of moldavite, a glass originating from a meteorite impact. The same group140 determined the concentration of Ni, Cr, Co and Ir in the Dergaon meteorite, in India, thus assessing CF-LIBS as a promising analytical tool in view of future application of LIBS in in situ analysis of extra-terrestrial objects and in planetary rover missions.
5. Conclusion
The calibration-free method, more than 20 years after its introduction, is still evolving and the fields in which it finds fruitful application are expanding. However, the numerous papers inspired to the CF-LIBS algorithm should not mislead the researchers in the field into thinking that the basic principles of the method and the best practices for its application would be finally rooted in the LIBS community. A quick survey of the recent literature tells a different story. We have mentioned a plethora of papers published in recent years boasting ‘improvements’ of the technique that are, at the best, very minor. A favorite topic in this literature is the ‘correction’ of the self-absorption in CF-LIBS; we have shown that the ‘problem’ of self-absorption is essentially solved and there is no justification for continuing presenting reformulations of the same concepts already derived more than 15 years ago.10 In fact, we have shown that the presence of self-absorbed lines should be considered as an opportunity in CF-LIBS analysis, rather than a problem to solve.The same attention should be given to the evaluation of the results that we have reported on the applications of CF-LIBS in many different fields. There are many studies that ignore the need for having time-resolved spectral information for the application of the CF-LIBS algorithm or justify the use of time-integrated spectra with a wrong interpretation of the papers of De Giacomo et al.17 or Grifoni et al.20 In both the cases, the results reported cannot be reproduced without a careful study on the spectral properties of the materials under study. The same papers give all the information necessary for validating the results obtained.
Our wish is that this review will help all the persons involved in the process (researchers, editors, and reviewers) of improving the quality of the literature on CF-LIBS fundamentals and applications, which at the moment seems to be growing in a rather uncontrolled way.
Conflicts of interest
There are no conflicts to declare.Acknowledgements
This research was partially funded by the Italian Ministry of Education, University and Research, Research Projects of National Relevance PRIN 2020, Project UNDERLANDSCAPE, grant no. 2020428LS8.References
- A. Ciucci, M. Corsi, V. Palleschi, S. Rastelli, A. Salvetti and E. Tognoni, New procedure for quantitative elemental analysis by laser-induced plasma spectroscopy, Appl. Spectrosc., 1999, 53, 960–964, DOI:10.1366/0003702991947612
.
- D. Bulajic, M. Corsi, G. Cristoforetti, S. Legnaioli, V. Palleschi, A. Salvetti and E. Tognoni, A procedure for correcting self-absorption in calibration free-laser induced breakdown spectroscopy, Spectrochim. Acta, Part B, 2002, 57, 339–353, DOI:10.1016/S0584-8547(01)00398-6
- F. Rezaei, G. Cristoforetti, E. Tognoni, S. Legnaioli, V. Palleschi and A. Safi, A review of the current analytical approaches for evaluating, compensating and exploiting self-absorption in Laser Induced Breakdown Spectroscopy, Spectrochim. Acta, Part B, 2020, 169, 105878, DOI:10.1016/J.SAB.2020.105878
- V. Palleschi, Laser-induced breakdown spectroscopy: principles of the technique and future trends, ChemTexts, 2020, 6, 18, DOI:10.1007/s40828-020-00114-x
- E. Tognoni, G. Cristoforetti, S. Legnaioli and V. Palleschi, Calibration-Free Laser-Induced Breakdown Spectroscopy: State of the art, Spectrochim. Acta, Part B, 2010, 65, 1–14, DOI:10.1016/j.sab.2009.11.006
- K. K. Herrera, E. Tognoni, I. B. Gornushkin, N. Omenetto, B. W. Smith and J. D. Winefordner, Comparative study of two standard-free approaches in laser-induced breakdown spectroscopy as applied to the quantitative analysis of aluminum alloy standards under vacuum conditions, J. Anal. At. Spectrom., 2009, 24, 426, 10.1039/b820494b
- J. Hermann, C. Gerhard, M. Burger, V. Craciun and F. Pelascini, Progress in calibration-free laser-induced breakdown spectroscopy, Spectrochim. Acta, Part B, 2023, 200, 106595, DOI:10.1016/J.SAB.2022.106595
- I. B. B. Gornushkin, J. M. M. Anzano, L. A. A. King, B. W. W. Smith, N. Omenetto and J. D. D. Winefordner, Curve of growth methodology applied to laser-induced plasma emission spectroscopy, Spectrochim. Acta, Part B, 1999, 54, 491–503, DOI:10.1016/S0584-8547(99)00004-X
- H. Amamou, A. Bois, B. Ferhat, R. Redon, B. Rossetto and P. Matheron, Correction of self-absorption spectral line and ratios of transition probabilities for homogeneous and LTE plasma, J. Quant. Spectrosc. Radiat. Transfer, 2002, 75, 747–763, DOI:10.1016/S0022-4073(02)00040-7
- A. M. El Sherbini, Th. M. El Sherbini, H. Hegazy, G. Cristoforetti, S. Legnaioli, V. Palleschi, L. Pardini, A. Salvetti and E. Tognoni, Evaluation of self-absorption coefficients of aluminum emission lines in laser-induced breakdown spectroscopy measurements, Spectrochim. Acta, Part B, 2005, 60, 1573–1579, DOI:10.1016/j.sab.2005.10.011
-
G. Cristoforetti and V. Palleschi, Double-pulse Laser Ablation of Solid Targets in Ambient Gas: Mechanisms and Effects, Nova Science Publishers, Inc., 2011 Search PubMed
- Ş. Yalçin, D. R. R. Crosley, G. P. P. Smith and G. W. W. Faris, Influence of ambient conditions on the laser air spark, Appl. Phys. B, 1999, 68, 121–130, DOI:10.1007/s003400050596
- F. He and P. J. Van Espen, General approach for quantitative energy dispersive x-ray fluorescence analysis based on fundamental parameters, Anal. Chem., 1991, 63, 2237–2244, DOI:10.1021/ac00020a009
- E. Grifoni, S. Legnaioli, G. Lorenzetti, S. Pagnotta, F. Poggialini and V. Palleschi, From Calibration-Free to Fundamental Parameters Analysis: A comparison of three recently proposed approaches, Spectrochim. Acta, Part B, 2016, 124, 40, DOI:10.1016/j.sab.2016.08.022
- E. Tognoni, G. Cristoforetti, S. Legnaioli, V. Palleschi, A. Salvetti, M. Mueller, U. Panne and I. Gornushkin, A numerical study of expected accuracy and precision in Calibration-Free Laser-Induced Breakdown Spectroscopy in the assumption of ideal analytical plasma, Spectrochim. Acta, Part B, 2007, 62, 1287–1302, DOI:10.1016/j.sab.2007.10.005
-
R. W. P. McWhirter, in Plasma Diagnostic Techniques, ed. R. H. Huddlestone and S.L. Leonard, Academic Press, New York, 1965 Search PubMed
- A. De Giacomo, M. Dell'Aglio, O. De Pascale, S. Longo and M. Capitelli, Laser induced breakdown spectroscopy on meteorites, Spectrochim. Acta, Part B, 2007, 62, 1606–1611, DOI:10.1016/j.sab.2007.10.004
- E. Tognoni, V. Palleschi, M. Corsi and G. Cristoforetti, Quantitative micro-analysis by laser-induced breakdown spectroscopy: A review of the experimental approaches, Spectrochim. Acta, Part B, 2002, 57, 1115–1130, DOI:10.1016/S0584-8547(02)00053-8
- A. De Giacomo, M. Dell'Aglio, O. De Pascale, R. Gaudiuso, R. Teghil, A. Santagata and G. P. Parisi, ns- and fs-LIBS of copper-based-alloys: A different approach, Appl. Surf. Sci., 2007, 253, 7677–7681, DOI:10.1016/j.apsusc.2007.02.037
- E. Grifoni, S. Legnaioli, M. Lezzerini, G. Lorenzetti, S. Pagnotta and V. Palleschi, Extracting time-resolved information from time-integrated laser-induced breakdown spectra, J. Spectrosc., 2014, 849310, DOI:10.1155/2014/849310
- R. Ahmed, N. Ahmed, J. Iqbal, M. A. Baig and M. Aslam Baig, An inexpensive technique for the time resolved laser induced plasma spectroscopy, Phys. Plasmas, 2016, 23, 083101, DOI:10.1063/1.4959866
- F. Bredice, F. O. Borges, H. O. Di Rocco, R. S. Mercado, M. Villagrán-Muniz and V. Palleschi, A Procedure for Estimating the Electron Temperature and the Departure of the LTE Condition in a Time-Dependent, Spatially Homogeneous, Optically Thin Plasma, Braz. J. Phys., 2013, 43, 239–246, DOI:10.1007/s13538-013-0146-x
- F. Bredice, P. Pacheco Martinez, C. Sánchez-Aké and M. Villagrán-Muniz, Temporal evolution of the spectral lines emission and temperatures in laser induced plasmas through characteristic parameters, Spectrochim. Acta, Part B, 2015, 107, 25–31, DOI:10.1016/J.SAB.2015.02.012
- I. Urbina, D. Carneiro, S. Rocha, E. Farias, F. Bredice and V. Palleschi, Study of binary lead-tin alloys using a new procedure based on calibration-free laser induced breakdown spectroscopy, Spectrochim. Acta, Part B, 2020, 105902, DOI:10.1016/j.sab.2020.105902
- F. Bredice, P. Pacheco Martinez, R. Sarmiento Mercado, C. Sánchez-Aké, M. Villagrán-Muniz, J. B. Sirven, M. El Rakwe, E. Grifoni, S. Legnaioli, G. Lorenzetti, S. Pagnotta and V. Palleschi, Determination of electron temperature temporal evolution in laser-induced plasmas through Independent Component Analysis and 3D Boltzmann plot, Spectrochim. Acta, Part B, 2017, 135, 48–53, DOI:10.1016/j.sab.2017.07.004
- I. Urbina, D. Carneiro, S. Rocha, E. Farias, F. Bredice and V. Palleschi, Measurement of atomic transition probabilities with laser-induced breakdown spectroscopy using the, 3D Boltzmann plot method, 2019, 154, 91–96, DOI:10.1016/j.sab.2019.02.008
- G. H. Cavalcanti, D. V. Teixeira, S. Legnaioli, G. Lorenzetti, L. Pardini and V. Palleschi, One-point calibration for calibration-free laser-induced breakdown spectroscopy quantitative analysis, Spectrochim. Acta, Part B, 2013, 87, 51–56, DOI:10.1016/j.sab.2013.05.016
-
Chemometrics and Numerical Methods in LIBS, V. Palleschi, John Wiley, 2022 Search PubMed
- F. O. Borges, G. H. Cavalcanti, G. C. Gomes, V. Palleschi and A. Mello, A fast method for the calculation of electron number density and temperature in laser-induced breakdown spectroscopy plasmas using artificial neural networks, Appl. Phys. B, 2014, 117, 437–444, DOI:10.1007/s00340-014-5852-8
- E. D'Andrea, S. Pagnotta, E. Grifoni, S. Legnaioli, G. Lorenzetti, V. Palleschi and B. Lazzerini, A hybrid calibration-free/artificial neural networks approach to the quantitative analysis of LIBS spectra, Appl. Phys. B, 2015, 118, 353–360, DOI:10.1007/s00340-014-5990-z
- G. Cristoforetti and E. Tognoni, Calculation of elemental columnar density from self-absorbed lines in laser-induced breakdown spectroscopy: A resource for quantitative analysis, Spectrochim. Acta, Part B, 2013, 79–80, 63–71, DOI:10.1016/j.sab.2012.11.010
- L. Pardini, S. Legnaioli, G. Lorenzetti, V. Palleschi, R. Gaudiuso, A. De Giacomo, D. M. Diaz Pace, F. Anabitarte Garcia, G. De Holanda Cavalcanti and C. Parigger, On the determination of plasma electron number density from Stark broadened hydrogen Balmer series lines in Laser-Induced Breakdown Spectroscopy experiments, Spectrochim. Acta, Part B, 2013, 88, 98–103, DOI:10.1016/j.sab.2013.05.030
- L. C. L. Borduchi, D. M. B. P. Milori and P. R. Villas-Boas, One-point calibration of Saha–Boltzmann plot to improve accuracy and precision of quantitative analysis using laser-induced breakdown spectroscopy, Spectrochim. Acta, Part B, 2019, 160, 105692, DOI:10.1016/J.SAB.2019.105692
- J. Yang, X. Li, J. Xu and X. Ma, A Calibration-Free Laser-Induced Breakdown Spectroscopy (CF-LIBS) Quantitative Analysis Method Based on the Auto-Selection of an Internal Reference Line and Optimized Estimation of Plasma Temperature, Appl. Spectrosc., 2018, 72, 129–140, DOI:10.1177/0003702817734293
- R. Gaudiuso, M. Dell'Aglio, O. De Pascale, A. Santagata and A. De Giacomo, Laser-induced plasma analysis of copper alloys based on Local Thermodynamic Equilibrium: An alternative approach to plasma temperature determination and archeometric applications, Spectrochim. Acta, Part B, 2012, 74–75, 38–45, DOI:10.1016/j.sab.2012.06.034
- R. Gaudiuso, M. Dell'Aglio, O. De Pascale, S. Loperfido, A. Mangone and A. De Giacomo, Laser-induced breakdown spectroscopy of archaeological findings with calibration-free inverse method: Comparison with classical laser-induced breakdown spectroscopy and conventional techniques, Anal. Chim. Acta, 2014, 813, 15–24, DOI:10.1016/j.aca.2014.01.020
- R. Gaudiuso, Calibration-free inverse method for depth-profile analysis with laser-induced breakdown spectroscopy, Spectrochim. Acta, Part B, 2016, 123, 105–113, DOI:10.1016/j.sab.2016.08.002
- R. Gaudiuso, K. Uhlir and M. Griesser, Micro-invasive depth profile analysis by laser-induced breakdown spectroscopy (LIBS): the case of mercury layers on Sasanian coins, J. Anal. At. Spectrom., 2019, 34, 2261–2272, 10.1039/C9JA00165D
- M. Xu, Q. Lin, G. Yang, T. Xu, T. Zhang, X. Wang, S. Wang, F. Bian and Y. Duan, A single-beam-splitting technique combined with a calibration-free method for field-deployable applications using laser-induced breakdown spectroscopy, RSC Adv., 2014, 5, 4537–4546, 10.1039/C4RA10132D
- C. Aragón and J. A. A. Aguilera, CSigma graphs: A new approach for plasma characterization in laser-induced breakdown spectroscopy, J. Quant. Spectrosc. Radiat. Transfer, 2014, 149, 90–102, DOI:10.1016/j.jqsrt.2014.07.026
- C. Aragón and J. A. Aguilera, Quantitative analysis by laser-induced breakdown spectroscopy based on generalized curves of growth, Spectrochim. Acta, Part B, 2015, 110, 124–133, DOI:10.1016/j.sab.2015.06.010
- A. Safi, S. H. H. Tavassoli, G. Cristoforetti, E. Tognoni, B. Campanella, S. Legnaioli, S. Pagnotta, F. Poggialini and V. Palleschi, Exploiting self-absorption for plasma characterization in Laser-Induced Breakdown Spectroscopy experiments: a comparison of two recent approaches, Anal. Chem., 2019, 91, 8595–8601, DOI:10.1021/acs.analchem.9b01885
- F. Poggialini, B. Campanella, R. Jafer, S. Legnaioli, F. Bredice, S. Raneri and V. Palleschi, Determination of the Stark broadening coefficients of tantalum emission lines by time-independent Extended C-sigma method, Spectrochim. Acta, Part B, 2020, 105829, DOI:10.1016/j.sab.2020.105829
- S. Messaoud Aberkane, A. Safi, A. Botto, B. Campanella, S. Legnaioli, F. Poggialini, S. Raneri, F. Rezaei and V. Palleschi, Laser-Induced Breakdown Spectroscopy for Determination of Spectral Fundamental Parameters, Appl. Sci., 2020, 10, 4973, DOI:10.3390/app10144973
- A. Safi, S. M. Aberkane, A. Botto, B. Campanella, S. Legnaioli, F. Poggialini, S. Raneri, F. Rezaei and V. Palleschi, Determination of Spectroscopic Parameters of Ag(I) and Ag(II) Emission Lines Using Time-Independent Extended C-Sigma Method, Appl. Spectrosc., 2021, 75, 654–660, DOI:10.1177/0003702821999425
- M. Corsi, G. Cristoforetti, V. Palleschi, A. Salvetti and E. Tognoni, A fast and accurate method for the determination of precious alloys caratage by Laser Induced Plasma Spectroscopy, Eur. Phys. J. D, 2001, 13, 373–377, DOI:10.1007/s100530170255
- N. Ahmed, R. Ahmed and M. A. Baig, Analytical Analysis of Different Karats of Gold Using Laser Induced Breakdown Spectroscopy (LIBS) and Laser Ablation Time of Flight Mass Spectrometer (LA-TOF-MS), Plasma Chem. Plasma Process., 2017, 38(1), 207–222, DOI:10.1007/S11090-017-9862-2
- B. Praher, V. Palleschi, R. Viskup, J. Heitz and J. D. Pedarnig, Calibration free laser-induced breakdown spectroscopy of oxide materials, Spectrochim. Acta, Part B, 2010, 65, 671–679, DOI:10.1016/j.sab.2010.03.010
- G. H. Cavalcanti, A. A. Rocha, R. N. Damasceno, S. Legnaioli, G. Lorenzetti, L. Pardini and V. Palleschi, Double-pulse laser-induced breakdown spectroscopy analysis of scales from petroleum pipelines, Spectrochim. Acta, Part B, 2013, 87, 188–191, DOI:10.1016/j.sab.2013.05.018
- C. M. Ahamer, S. Eschlböck-Fuchs, P. J. Kolmhofer, R. Rössler, N. Huber and J. D. Pedarnig, Laser-induced breakdown spectroscopy of major and minor oxides in steel slags: Influence of detection geometry and signal normalization, Spectrochim. Acta, Part B, 2016, 122, 157–164, DOI:10.1016/j.sab.2016.06.008
- D. M. Diaz Pace, R. E. E. Miguel, H. O. O. Di Rocco, F. Anabitarte Garcia, L. Pardini, S. Legnaioli, G. Lorenzetti, V. Palleschi, D. M. Díaz Pace, R. E. E. Miguel, H. O. O. Di Rocco, F. Anabitarte García, L. Pardini, S. Legnaioli, G. Lorenzetti and V. Palleschi, Quantitative analysis of metals in waste foundry sands by calibration free-laser induced breakdown spectroscopy, Spectrochim. Acta, Part B, 2017, 131, 58–65, DOI:10.1016/j.sab.2017.03.007
- A. Fayyaz, U. Liaqat, Z. Adeel Umar, R. Ahmed and M. Aslam Baig, Elemental Analysis of Cement by Calibration-Free Laser Induced Breakdown Spectroscopy (CF-LIBS) and Comparison with Laser Ablation – Time-of-Flight – Mass Spectrometry (LA-TOF-MS), Energy Dispersive X-Ray Spectrometry (EDX), X-Ray Fluorescence Spectroscopy (XRF), and Proton Induced X-Ray Emission Spectrometry (PIXE), Anal. Lett., 2019, 52, 1951–1965, DOI:10.1080/00032719.2019.1586914
- M. Akhtar, N. Ahmed, S. Mahmood, A. Jabbar, R. Ahmed, Z. A. Umar, J. Iqbal and M. A. Baig, Elemental Analysis of Cement and Its Components by Laser-Induced Breakdown Spectroscopy (LIBS) and Laser Ablation Time of Flight Mass Spectrometry (LA-TOF-MS), Anal. Lett., 2021, 55, 904–916, DOI:10.1080/00032719.2021.1972118
- H. Shakeel, S. U. Haq, Q. Abbas, A. Nadeem and V. Palleschi, Quantitative analysis of Ge/Si alloys using double-pulse calibration-free laser-induced breakdown spectroscopy, Spectrochim. Acta, Part B, 2018, 146, 101–105, DOI:10.1016/j.sab.2018.05.008
- V. C. Costa, J. P. Castro, D. F. Andrade, D. Victor Babos, J. A. Garcia, M. A. Sperança, T. A. Catelani and E. R. Pereira-Filho, Laser-induced breakdown spectroscopy (LIBS) applications in the chemical analysis of waste electrical and electronic equipment (WEEE), TrAC, Trends Anal. Chem., 2018, 108, 65–73, DOI:10.1016/j.trac.2018.08.003
- S. M. Z. Iqbal, Z. Uddin, N. Ahmed, Z. A. Umar and M. A. Baig, On the compositional analysis of Coal using calibration free laser induced breakdown spectroscopy, Laser Phys., 2019, 29, 036101, DOI:10.1088/1555-6611/aaff58
- S. M. Z. Iqbal, Z. Uddin, Z. A. Umar, N. Ahmed, R. Ahmed and M. A. Baig, Analysis of Lakhra Coal by Calibration Free Laser-Induced Breakdown Spectroscopy (CF-LIBS) and Comparison of Self-Absorption Correction Procedures, Anal. Lett., 2022, 55, 11–23, DOI:10.1080/00032719.2021.1910831
- M. A. Israr, Q. Abbas, S. U. Haq and A. Nadeem, Analysis of Carbon Contents and Heavy Metals in Coal Samples Using Calibration-free LIBS Technique, J. Spectrosc., 2022, 3328477, DOI:10.1155/2022/3328477
- A. U. Haq, M. Abrar, T. Iqbal, M. N. Khan and M. Shafique, Qualitative and quantitative discrimination of major elements in Chitosan (natural polymer) using laser induced breakdown spectroscopy, Opt. Laser Technol., 2022, 154, 108222, DOI:10.1016/J.OPTLASTEC.2022.108222
- N. Ahmed, S. Shahida, S. M. Kiani, M. I. Razzaq, M. U. Hameed, S. M. Z. Iqbal, S. A. Abbasi, M. Rafique and M. A. Baig, Analysis of an Iron-Copper Alloy by Calibration-Free Laser-Induced Breakdown Spectroscopy (CF-LIBS) and Inductively Coupled Plasma – Mass Spectrometry (ICP-MS), Anal. Lett., 2022, 55, 2239–2250, DOI:10.1080/00032719.2022.2052307
- A. Fayyaz, U. Liaqat, K. Yaqoob, R. Ahmed, Z. A. Umar and M. A. Baig, Combination of laser-induced breakdown spectroscopy, and time–of–flight mass spectrometry for the quantification of CoCrFeNiMo high entropy alloys, Spectrochim. Acta, Part B, 2022, 198, 106562, DOI:10.1016/J.SAB.2022.106562
- J. Kwak, K.-W. Kim, M. Park, J. Kim and K. Park, Determination of lead in soil at a historical mining and smelting site using laser-induced breakdown spectroscopy, Environ. Technol., 2012, 33, 2177–2184, DOI:10.1080/09593330.2012.665485
- R. Kumar, A. K. Rai, D. Alamelu and S. K. Aggarwal, Monitoring of toxic elements present in sludge of industrial waste using CF-LIBS, Environ. Monit. Assess., 2013, 185, 171–180, DOI:10.1007/s10661-012-2541-0
- T. F. Akhmetzhanov, T. A. Labutin, S. M. Zaytsev, A. N. Drozdova and A. M. Popov, Determination of the Mn/Fe Ratio in Ferromanganese Nodules Using Calibration-Free Laser-Induced Breakdown Spectroscopy, Opt. Spectrosc., 2019, 126, 316–320, DOI:10.1134/S0030400X19040027/FIGURES/5
- T. F. Akhmetzhanov, A. N. Drozdova and A. M. Popov, Calibration-Free Libs for Determination of the Mn/Fe Ratio in Ferromanganese Nodules with a Portable Diode-Pumped Solid-State Laser, J. Appl. Spectrosc., 2022, 89, 631–637, DOI:10.1007/S10812-022-01403-8/METRICS
- A. Jabbar, Z. Hou, J. Liu, R. Ahmed, S. Mahmood and Z. Wang, Calibration-free analysis of immersed metal alloys using long-pulse-duration laser-induced breakdown spectroscopy, Spectrochim. Acta, Part B, 2019, 157, 84–90, DOI:10.1016/J.SAB.2019.05.013
- M. Rafique, J. Iqbal, M. Hafeez, N. Ahmad, S. A. Abbasi, R. Hayder, S. Shahida and M. Sajid, Calibration-free laser-induced breakdown spectroscopic analysis of copper-rich mineral collected from the Gilgit-Baltistan region of Pakistan, Appl. Opt., 2020, 59(1), 68–76, DOI:10.1364/AO.59.000068
- N. I. Sushkov, N. V. Lobus, I. V. Seliverstova and T. A. Labutin, Chemical Analysis of Zooplankton by Calibration-Free Laser-Induced Breakdown Spectroscopy, Opt. Spectrosc., 2020, 128, 1343–1349, DOI:10.1134/S0030400X20090222/TABLES/4
- A. García-Escárzaga, M. Martínez-Minchero, A. Cobo, I. Gutiérrez-Zugasti, A. Arrizabalaga and P. Roberts, Using Mg/Ca Ratios from the Limpet Patella depressa Pennant, 1777 Measured by Laser-Induced Breakdown Spectroscopy (LIBS) to Reconstruct Paleoclimate, Appl. Sci., 2021, 11, 2959, DOI:10.3390/APP11072959
- M. Martínez-Minchero, A. Cobo, A. Méndez-Vicente, J. Pisonero, N. Bordel, I. Gutiérrez-Zugasti, P. Roberts, Á. Arrizabalaga, J. Valdiande, J. Mirapeix, J. M. López-Higuera and A. García-Escárzaga, Comparison of Mg/Ca concentration series from Patella depressa limpet shells using CF-LIBS and LA-ICP-MS, Talanta, 2023, 251, 123757, DOI:10.1016/J.TALANTA.2022.123757
- J. M. Anzano, A. Cruz-Conesa, R. J. Lasheras, C. Marina-Montes, L. V. Pérez-Arribas, J. O. Cáceres, A. I. Velásquez and V. Palleschi, Multielemental analysis of Antarctic soils using calibration free laser-induced breakdown spectroscopy, Spectrochim. Acta, Part B, 2021, 180, 106191, DOI:10.1016/J.SAB.2021.106191
- I. Rehan, M. A. Gondal, S. Sultana, M. A. Dastageer, R. K. Aldakheel, M. A. Almessiere, R. Muhammad, K. Rehan and D. Domyati, Elemental Compositions of Earthquake-Stricken Soil from the Vicinity of the Epicenter at Eurasian and Indian Tectonic Plates Using Calibration Free Laser Induced Breakdown Spectroscopy, Arabian J. Sci. Eng., 2021, 46, 6101–6108, DOI:10.1007/S13369-021-05503-Z/FIGURES/7
- I. Rehan, M. A. Gondal, R. K. Aldakheel, K. Rehan, S. Sultana, M. A. Almessiere and Z. Ali, Development of laser induced breakdown spectroscopy technique to study irrigation water quality impact on nutrients and toxic elements distribution in cultivated soil, Saudi J. Biol. Sci., 2021, 28, 6876–6883, DOI:10.1016/J.SJBS.2021.07.064
- K. Elsayed, W. Tawfik, A. E. M. Khater, T. S. Kayed and M. Fikry, Fast determination of phosphorus concentration in phosphogypsum waste using calibration-free LIBS in air and helium, Opt. Quantum Electron., 2022, 54, 1–14, DOI:10.1007/S11082-021-03474-X/FIGURES/5
- M. A. Khoso, N. M. Shaikh, M. S. Kalhoro, S. Jamali, Z. A. Ujan and R. Ali, Comparative elemental analysis of soil of wheat, corn, rice, and okra cropped field using CF-LIBS, Optik, 2022, 261, 169247, DOI:10.1016/J.IJLEO.2022.169247
- S. Almaviva, L. Caneve, F. Colao, R. Fantoni and G. Maddaluno, Laboratory feasibility study of fusion vessel inner wall chemical analysis by Laser Induced Breakdown Spectroscopy, Chem. Phys., 2012, 398, 228–232, DOI:10.1016/j.chemphys.2011.07.012
- S. Almaviva, L. Caneve, F. Colao, P. Gasior, M. Kubkowska, M. Łepek and G. Maddaluno, Double pulse Laser Induced Breakdown Spectroscopy measurements on ITER-like samples, Fusion Eng. Des., 2015, 96–97, 848–851, DOI:10.1016/j.fusengdes.2015.02.068
- R. Fantoni, S. Almaviva, L. Caneve, F. Colao, A. M. Popov and G. Maddaluno, Development of Calibration-Free Laser-Induced-Breakdown-Spectroscopy based techniques for deposited layers diagnostics on ITER-like tiles, Spectrochim. Acta, Part B, 2013, 87, 153–160, DOI:10.1016/j.sab.2013.05.032
- M. Pribula, J. Krištof, M. Suchoňová, M. Horňáčková, J. Plavčan, A. Hakola and P. Veis, Use of the near vacuum UV spectral range for the analysis of W-based materials for fusion applications using LIBS, Phys. Scr., 2016, T167, 014045, DOI:10.1088/0031-8949/T167/1/014045
-
J. Karhunen, A. Hakola, J. Likonen, A. Lissovski, P. Paris, M. Laan, K. Piip, C. Porosnicu, C. P. Lungu and K. Sugiyama, Development of Laser-Induced Breakdown Spectroscopy for Analyzing Deposited Layers in ITER, 2014, DOI:10.1088/0031-8949/2014/T159/014067
- R. Fantoni, S. Almaviva, L. Caneve, F. Colao, G. Maddaluno, P. Gasior and M. Kubkowska, Hydrogen isotope detection in metal matrix using double-pulse laser-induced breakdown-spectroscopy, Spectrochim. Acta, Part B, 2017, 129, 8–13 CrossRef CAS
- J. Miškovičová, M. Anguš, H. van der Meiden and P. Veis, Selection of molybdenum lines by quantitative analysis of molybdenum- zirconium-titanium alloy by CF-LIBS for future fusion applications, Fusion Eng. Des., 2020, 153, 111488, DOI:10.1016/J.FUSENGDES.2020.111488
- S. Almaviva, L. Caneve, F. Colao and G. Maddaluno, Deuterium detection and quantification by laser-induced breakdown spectroscopy and calibration-free analysis in ITER relevant samples, Fusion Eng. Des., 2019, 146, 2087–2091, DOI:10.1016/J.FUSENGDES.2019.03.109
- G. S. Maurya, R. Kumar, A. Kumar and A. K. Rai, Analysis of impurities on contaminated surface of the tokamak limiter using laser induced breakdown spectroscopy, Spectrochim. Acta, Part B, 2016, 126, 17–22, DOI:10.1016/j.sab.2016.10.010
-
G. S. Maurya, P. K. Tiwari, R. Kumar, R. K. Singh and A. K. Rai, Study of the different parts of a tokamak using laser-induced breakdown spectroscopy, Laser-Induced Breakdown Spectroscopy, 2nd edn, 2020, pp. 385–399, DOI:10.1016/B978-0-12-818829-3.00017-4
- K. Ibano, D. Nishijima, Y. Ueda and R. P. Doerner, LIBS measurement of trace tantalum and rhenium in tungsten for in-situ diagnostic of nuclear transmutation, J. Nucl. Mater., 2019, 522, 324–328, DOI:10.1016/j.jnucmat.2019.05.030
- P. Veis, A. Marín-Roldán, V. Dwivedi, J. Karhunen, P. Paris, I. Jogi, C. Porosnicu, C. P. Lungu, V. Nemanic and A. Hakola, Quantification of H/D content in Be/W mixtures coatings by CF-LIBS, Phys. Scr., 2020, 2020, 014073, DOI:10.1088/1402-4896/AB7EBD
- V. Dwivedi, A. Marín-Roldán, J. Karhunen, P. Paris, I. Jõgi, C. Porosnicu, C. P. Lungu, H. van der Meiden, A. Hakola and P. Veis, CF-LIBS quantification and depth profile analysis of Be coating mixed layers, Nucl. Mater. Energy, 2021, 27, 100990, DOI:10.1016/J.NME.2021.100990
- S. Almaviva, L. Caneve, F. Colao, G. Maddaluno and R. Fantoni, Accessory laboratory measurements to support quantification of hydrogen isotopes by in-situ LIBS from a robotic arm inside a fusion vessel, Spectrochim. Acta, Part B, 2021, 181, 106230, DOI:10.1016/J.SAB.2021.106230
- Z. Cao, Y. An, X. Wang, C. Chen and Y. Li, Characterization of Corrosion Behavior of CLF-1 in Liquid Lithium Using Calibration-Free Laser-Induced Breakdown Spectroscopy in Depth Profile Analysis, Materials, 2020, 13, 240, DOI:10.3390/MA13010240
- S. Feng, C. Ke, Y. Chen, H. Zhang, Y. He and Y. Zhao, CF-LIBS analysis in depth profile of lithium corrosion resistance of Er2O3 coatings prepared by sol-gel method, Fusion Eng. Des., 2021, 170, 112506, DOI:10.1016/J.FUSENGDES.2021.112506
- M. Imran, Z. Hu, F. Ding, M. Li, G. N. Luo, H. Sattar, M. Iqbal and H. Ding, Diagnostic study of impurity deposition in fusion device by calibration-free laser-induced breakdown spectroscopy, Spectrochim. Acta, Part B, 2022, 198, 106568, DOI:10.1016/J.SAB.2022.106568
- M. Imran, Z. hua Hu, F. Ding, H. Ding, M. Iqbal, J. M. Ashfaq, G. Remnev and G. N. Luo, Diagnostic study of interface materials of co-deposition simulating impurity relevant to international thermonuclear experimental reactor by using calibration-free laser-induced breakdown spectroscopy, Spectrochim. Acta, Part B, 2022, 194, 106480, DOI:10.1016/J.SAB.2022.106480
- V. Dwivedi, M. Veis, A. Marín Roldán, E. Grigore, F. Baiasu, I. Bogdanovič Radovič, Z. Siketić and P. Veis, CF-LIBS study of pure Ta, and WTa + D coating as fusion-relevant materials: a step towards future in situ compositional quantification at atmospheric pressure, Eur. Phys. J. Plus, 2021, 136(11), 1–12, DOI:10.1140/EPJP/S13360-021-02179-0
- A. M. Roldán, V. Dwivedi, M. Veis, S. Atikukke, H. Van Der Meiden, M. Držík and P. Veis, Quantification of hydrogen isotopes by CF-LIBS in a W-based material (WZr) at atmospheric pressure: from ns towards ps, Phys. Scr., 2021, 96, 124061, DOI:10.1088/1402-4896/AC35F2
- S. Atikukke, A. Marín Roldán, V. Dwivedi, M. Veis and P. Veis, Calibration-free laser-based spectroscopic study of Sn-based alloys, Phys. Scr., 2021, 96, 124066, DOI:10.1088/1402-4896/AC3A4E
- T. Takahashi, B. Thornton, K. Ohki and T. Sakka, Calibration-free analysis of immersed brass alloys using long-ns-duration pulse laser-induced breakdown spectroscopy with and without correction for nonstoichiometric ablation, Spectrochim. Acta, Part B, 2015, 111, 8–14, DOI:10.1016/j.sab.2015.06.009
- A. Smaldone, A. De Bonis, A. Galasso, A. Guarnaccio, A. Santagata and R. Teghil, Inverse Calibration Free fs-LIBS of Copper-Based Alloys, Z. fur Phys. Chem., 2016, 230(9) DOI:10.1515/zpch-2015-0704
- S. Pagnotta, M. Lezzerini, B. Campanella, G. Gallello, E. Grifoni, S. Legnaioli, G. Lorenzetti, F. Poggialini, S. Raneri, A. Safi and V. Palleschi, Fast quantitative elemental mapping of highly inhomogeneous materials by micro-Laser-Induced Breakdown Spectroscopy, Spectrochim. Acta, Part B, 2018, 146, 9–15, DOI:10.1016/j.sab.2018.04.018
- T. Kohonen, The self-organizing map, Neurocomputing, 1998, 21, 1–6, DOI:10.1016/S0925-2312(98)00030-7
- S. Živković, A. Botto, B. Campanella, M. Lezzerini, M. Momčilović, S. Pagnotta, V. Palleschi, F. Poggialini and S. Legnaioli, Laser-Induced Breakdown Spectroscopy elemental mapping of the construction material from the Smederevo Fortress (Republic of Serbia), Spectrochim. Acta, Part B, 2021, 181, 106219, DOI:10.1016/J.SAB.2021.106219
- A. Lluveras-Tenorio, A. Spepi, M. Pieraccioni, S. Legnaioli, G. Lorenzetti, V. Palleschi, M. Vendrell, M. P. Colombini, M. R. Tinè, C. Duce and I. Bonaduce, A multi-analytical characterization of artists' carbon-based black pigments, J. Therm. Anal. Calorim., 2019, 138, 3287–3299, DOI:10.1007/s10973-019-08910-5
- G. S. S. Senesi, D. Manzini and O. De Pascale, Application of a laser-induced breakdown spectroscopy handheld instrument to the diagnostic analysis of stone monuments, Appl. Geochem., 2018, 96, 87–91, DOI:10.1016/j.apgeochem.2018.06.008
- P. Santi, S. Pagnotta, V. Palleschi, M. P. Colombini and A. Renzulli, The Cultural Heritage of “Black Stones” (Lapis Aequipondus/Martyrum) of Leopardi's Child Home (Recanati, Italy), Materials, 2022, 15, 3828, DOI:10.3390/MA15113828
- W. Q. Lei, J. El Haddad, V. Motto-Ros, N. Gilon-Delepine, A. Stankova, Q. L. Ma, X. S. Bai, L. J. Zheng, H. P. Zeng and J. Yu, Comparative measurements of mineral elements in milk powders with laser-induced breakdown spectroscopy and inductively coupled plasma atomic emission spectroscopy, Anal. Bioanal. Chem., 2011, 400, 3303–3313, DOI:10.1007/s00216-011-4813-x
- I. Rehan, M. Zubair Khan, K. Rehan, S. Sultana, R. Muhammad and M. U. Rehman, Detection of Nutrition and Toxic Elements in Dry Milk Powders Available in Pakistan Using Laser Induced Breakdown Spectroscopy, Plasma Chem. Plasma Process., 2019, 39, 1413–1427, DOI:10.1007/S11090-019-10021-W/FIGURES/5
- R. Agrawal, R. Kumar, S. Rai, A. K. Pathak, A. K. Rai and G. K. Rai, LIBS: A Quality Control Tool for Food Supplements, Food Biophys., 2011, 6, 527–533, DOI:10.1007/s11483-011-9235-y
- N. Ahmed, Z. A. Umar, R. Ahmed and M. Aslam Baig, On the elemental analysis of different cigarette brands using laser induced breakdown
spectroscopy and laser-ablation time of flight mass spectrometry, Spectrochim. Acta, Part B, 2017, 136, 39–44, DOI:10.1016/j.sab.2017.08.006
- I. Rehan, S. Sultana, K. Rehan, R. Muhammad, A. Mateen and M. A. Farooque, Application of Laser Induced Breakdown in Air in Conjunction with Atomic Absorption Spectroscopy for Detection of Trace Elements in Fennel Seeds, Opt. Spectrosc., 2018, 125, 130–136, DOI:10.1134/S0030400X18070238
- I. Rehan, K. Rehan, S. Sultana, M. Z. Khan and R. Muhammad, LIBS coupled with ICP/OES for the spectral analysis of betel leaves, Appl. Phys. B, 2018, 124, 76, DOI:10.1007/s00340-018-6947-4
- A. Jabbar, M. Akhtar, A. Ali, S. Mehmood, S. Iftikhar and M. A. Baig, Elemental composition of rice using calibration free laser induced breakdown spectroscopy, Optoelectron. Lett., 2019, 15, 57–63, DOI:10.1007/s11801-019-8099-0
- A. Jabbar, M. Akhtar, S. Mahmood, R. Ahmed and M. A. Baig, Determination of Major Inorganic Nutrients in Maize Tissues by Calibration-Free Laser Induced Breakdown Spectroscopy, Anal. Lett., 2019, 53, 1328–1341, DOI:10.1080/00032719.2019.1705477
- N. Ahmed, U. Liaqat, M. Rafique, M. A. Baig and W. Tawfik, Detection of toxicity in some oral antidiabetic drugs using LIBS and LA-TOF-MS, Microchem. J., 2020, 155, 104679, DOI:10.1016/J.MICROC.2020.104679
- W. Han, M. Su, D. Sun, Y. Yin, Y. Wang, C. Gao, F. Yang and Y. Fu, Analysis of metallic elements dissolution in the Astragalus at different decocting time by using LIBS technique, Plasma Sci. Technol., 2020, 22, 085501, DOI:10.1088/2058-6272/AB861B
- Y. Wang, M. Su, D. Sun, C. Wu, X. Zhang, Q. Lu and C. Dong, Comparative study of magnesium and calcium in Codonopsis pilosula samples detected by CF-LIBS and LCGD-AES, Microchem. J., 2018, 137, 318–323, DOI:10.1016/J.MICROC.2017.11.011
- Z. A. Umar, U. Liaqat, R. Ahmed, R. Hedwig, M. Ramli, M. A. Marpaung, K. H. Kurniawan, M. Pardede and M. A. Baig, Determination of Micronutrients and Toxic Elements in Moringa Oleifera Leaves by Calibration Free Laser-Induced Breakdown Spectroscopy (LIBS), Anal. Lett., 2021, 55, 755–769, DOI:10.1080/00032719.2021.1966794
- A. Jabbar, B. Rehman, M. Iqbal, R. Ahmed, S. Mahmood and M. A. Baig, Elemental Analysis of Plants Cultivated in Saline Soil by Laser-Induced Breakdown Spectroscopy (LIBS), Anal. Lett., 2020, 54, 1351–1365, DOI:10.1080/00032719.2020.1802738
- R. K. Aldakheel, M. A. Gondal, M. M. Nasr, M. A. Dastageer and M. A. Almessiere, Quantitative elemental analysis of nutritional, hazardous and pharmacologically active elements in medicinal Rhatany root using laser induced breakdown spectroscopy, Arabian J. Chem., 2021, 14, 102919, DOI:10.1016/J.ARABJC.2020.102919
- R. K. Aldakheel, M. A. Gondal, H. N. Alsayed, M. A. Almessiere, M. M. Nasr and A. M. Shemsi, Rapid Determination and Quantification of Nutritional and Poisonous Metals in Vastly Consumed Ayurvedic Herbal Medicine (Rejuvenator Shilajit) by Humans Using Three Advanced Analytical Techniques, Biol. Trace Elem. Res., 2022, 200, 4199–4216, DOI:10.1007/S12011-021-03014-4/TABLES/3
- I. Rehan, M. A. Gondal, R. K. Aldakheel, M. A. Almessiere, K. Rehan, S. Khan, S. Sultana and M. Z. Khan, Determination of Nutritional and Toxic Metals in Black Tea Leaves Using Calibration Free LIBS and ICP: AES Technique, Arabian J. Sci. Eng., 2022, 47, 7531–7539, DOI:10.1007/S13369-021-06233-Y/TABLES/2
- S. Zhang, Z. Hu, Z. Zhao, F. Chen, Y. Tang, Z. Sheng, D. Zhang, Z. Zhang, H. Jin, H. Pu and L. Guo, Quantitative analysis of mineral elements in hair and nails using calibration-free laser-induced breakdown spectroscopy, Optik, 2021, 242, 167067, DOI:10.1016/J.IJLEO.2021.167067
- M. Corsi, G. Cristoforetti, M. Hidalgo, S. Legnaioli, V. Palleschi, A. Salvetti, E. Tognoni and C. Vallebona, Application of laser-induced breakdown spectroscopy technique to hair tissue mineral analysis, Appl. Opt., 2003, 42, 6133, DOI:10.1364/AO.42.006133
- R. S. Harmon and G. S. Senesi, Laser-Induced Breakdown Spectroscopy – A geochemical tool for the 21st century, Appl. Geochem., 2021, 128, 104929, DOI:10.1016/J.APGEOCHEM.2021.104929
- G. S. Senesi, R. S. Harmon and R. R. Hark, Field-portable and handheld laser-induced breakdown spectroscopy: Historical review, current status and future prospects, Spectrochim. Acta, Part B, 2021, 175, 106013, DOI:10.1016/J.SAB.2020.106013
- A. Ahmad, S. A. Abbasi, M. Hafeez, T. M. Khan, M. Rafique, N. Ahmed, P. Ahmad, M. R. I. Faruque, M. U. Khandaker and M. Javed, Detection and Quantification of Precious Elements in Astrophyllite Mineral by Optical Spectroscopy, Materials, 2021, 14, 6277, DOI:10.3390/MA14216277
- A. Fayyaz, H. Asghar, A. M. Alshehri and T. A. Alrebdi, LIBS assisted PCA analysis of multiple rare-earth elements (La, Ce, Nd, Sm, and Yb) in phosphorite deposits, Heliyon, 2023, 9, e13957, DOI:10.1016/J.HELIYON.2023.E13957
- M. Horňáčková, J. Plavčan, Z. Grolmusová, J. Hulík, P. Konečný, I. Holický and P. Veis, Analysis of acid pitchstone (Iceland) using laser induced breakdown spectroscopy (LIBS), Acta Montan. Slovaca, 2013, 18, 1–8 Search PubMed
- Z. Wang, C. Yan, J. Dong, T. Zhang, J. Wei and H. Li, Acidity analysis of iron ore based on calibration-free laser-induced breakdown spectroscopy (CF-LIBS) combined with a binary search algorithm (BSA), RSC Adv., 2016, 6, 76813–76823, 10.1039/C6RA13038K
- G. Agrosì, G. Tempesta, E. Scandale, S. Legnaioli, G. Lorenzetti, S. Pagnotta, V. Palleschi, A. Mangone, M. Lezzerini, G. Agrosi, G. Tempesta, E. Scandale, S. Legnaioli, G. Lorenzetti, S. Pagnotta, V. Palleschi, A. Mangone and M. Lezzerini, Application of Laser Induced Breakdown Spectroscopy to the identification of emeralds from different synthetic processes, Spectrochim. Acta, Part B, 2014, 102, 48–51, DOI:10.1016/j.sab.2014.10.012
- R. Grassi, E. Grifoni, S. Gufoni, S. Legnaioli, G. Lorenzetti, N. Macro, L. Menichetti, S. Pagnotta, F. Poggialini, C. Schiavo and V. Palleschi, Three-dimensional compositional mapping using double-pulse micro-laser-induced breakdown spectroscopy technique, Spectrochim. Acta, Part B, 2017, 127, 1–6, DOI:10.1016/j.sab.2016.11.004
- G. Tempesta, F. Bosi and G. Agrosì, Crystal Chemical Characterisation of Red Beryl by ‘Standardless’ Laser-Induced Breakdown Spectroscopy and Single-Crystal Refinement by X-Ray Diffraction: An Example of Validation of an Innovative Method for the Chemical Analysis of Minerals, Geostand. Geoanal. Res., 2020, 44, 685–693, DOI:10.1111/GGR.12346
- S. A. Abbasi, M. Rafique, T. M. Khan, A. Khan, N. Ahmad, M. R. I. Faruque, M. U. Khandaker, P. Ahmad and A. Saboor, Chemical Analysis of Thermoluminescent Colorless Topaz Crystal Using Laser-Induced Breakdown Spectroscopy, Minerals, 2021, 11, 367, DOI:10.3390/MIN11040367
- R. A. Khan, M. Anwar-ul-Haq, M. Qasim, M. S. Afgan, S. U. Haq and S. Z. Hussain, Spectroscopic and crystallographic analysis of nephrite jade gemstone using laser induced breakdown spectroscopy, Raman spectroscopy, and X-ray diffraction, Heliyon, 2022, 8, e11493, DOI:10.1016/J.HELIYON.2022.E11493
- M. Dell'Aglio, A. De Giacomo, R. Gaudiuso, O. De Pascale and S. Longo, Laser Induced Breakdown Spectroscopy of meteorites as a probe of the early solar system, Spectrochim. Acta, Part B, 2014, 101, 68–75, DOI:10.1016/j.sab.2014.07.011
- M. Hornáčková, J. Plavcan, J. Rakovsky, V. Porubcan, D. Ozdín and P. Veis, Calibration-free laser induced breakdown spectroscopy as an alternative method for found meteorite fragments analysis, Eur. Phys. J.: Appl. Phys., 2014, 66, 10702, DOI:10.1051/EPJAP/2014130465
- D. Ozdín, J. Plavčan, M. Horňáčková, P. Uher, V. Porubčan, P. Veis, J. Rakovský, J. Tóth, P. Konečný and J. Svoreň, Mineralogy, petrography, geochemistry, and classification of the Košice meteorite, Meteorit. Planet. Sci., 2015, 50, 864–879, DOI:10.1111/maps.12405
- G. S. Senesi, G. Tempesta, P. Manzari and G. Agrosì, An Innovative Approach to Meteorite Analysis by Laser-Induced Breakdown Spectroscopy, Geostand. Geoanal. Res., 2016, 40, 533–541, DOI:10.1111/ggr.12126
- G. Tempesta, G. S. Senesi, P. Manzari and G. Agrosì, New insights on the Dronino iron meteorite by double-pulse micro-Laser-Induced Breakdown Spectroscopy, Spectrochim. Acta, Part B, 2018, 144, 75–81, DOI:10.1016/j.sab.2018.03.014
- A. K. Rai, J. K. Pati and R. Kumar, Spectro-chemical study of moldavites from Ries impact structure (Germany) using LIBS, Opt. Laser Technol., 2019, 114, 146–157, DOI:10.1016/J.OPTLASTEC.2019.01.028
- A. K. Rai, J. K. Pati, C. G. Parigger, S. Dubey, A. K. Rai, B. Bhagabaty, A. C. Mazumdar and K. Duorah, The Plasma Spectroscopic Study of Dergaon Meteorite, Molecules, 2020, 25, 984, DOI:10.3390/MOLECULES25040984
| This journal is © The Royal Society of Chemistry 2023 |