
 Open Access Article
 This Open Access Article is licensed under a
 Creative Commons Attribution 3.0 Unported Licence
Analysis of trace elements in uranium by inductively coupled plasma-optical emission spectroscopy, design of experiments, and partial least squares regression†
Luke R.
Sadergaski
 *,
Benjamin T.
Manard
and
Hunter B.
Andrews
*,
Benjamin T.
Manard
and
Hunter B.
Andrews
Oak Ridge National Laboratory, 1 Bethel Valley Rd, Oak Ridge, TN 37830, USA. E-mail: sadergaskilr@ornl.gov
First published on 17th March 2023
Abstract
Partial least squares regression models were optimized for the quantification of trace elements including lanthanides (e.g., Ce, Nd), transition metals (e.g., Fe, Cr, Ni, Zr), post-transition metals (e.g., Al, Pb), alkali/alkaline earth metals (e.g., Na, Mg), metalloids (e.g., Si, As) and nonmetals (e.g., P) in uranium (U) by analyzing inductively coupled plasma-optical emission spectra. Chemical separations are commonly used to separate U from trace elements to enable highly reliable measurements by removing low lying spectral interferences from U in optical emission spectra. Here, an innovative multivariate regression approach was tested to circumvent the need for separations under relevant trace concentration ranges (20–5000 μg per g U). An I-optimal design was used to efficiently select training set samples, which were validated against several quality control samples with root mean square error of the prediction values ranging from 1% to 3% for 30 elements. The methodology was validated by the analysis of reference materials CRM 124-1 and CUP-2 and compared to partial least squares regression predictions from experimental values. The exemplar results indicate that the multivariate regression approach can account for covarying and overlapping spectral features better than standard software protocols. This unique approach provides a powerful tool for measuring trace elements in U without the time and waste associated with separations or matrix matched calibration standards and may be adapted to other systems.
1. Introduction
Inductively coupled plasma-optical emission spectroscopy (ICP-OES) and inductively coupled plasma-mass spectrometry (ICP-MS) are well established techniques routinely used to measure trace elements in uranium (U) and other nuclear materials.1–3 Measuring trace elements aids in quality control, material viability, and could provide forensic signatures.4–6 Trace elemental analysis by each technique is generally performed by diluting samples such that the U matrix is low, and matrix matching the calibration standards,1 or separating the matrix completely.7 ICP-OES analytical data comes from the emission spectra of elements excited within a plasma with temperatures as high as 10![[thin space (1/6-em)]](https://www.rsc.org/images/entities/char_2009.gif) 000 K. The ICP-OES method measures photons, rather than ICP-MS which measures ions of specific mass and is limited by emission rich f-block elements (e.g., U and Pu), which could interfere with trace element spectra.
000 K. The ICP-OES method measures photons, rather than ICP-MS which measures ions of specific mass and is limited by emission rich f-block elements (e.g., U and Pu), which could interfere with trace element spectra.
The electron-rich spectrum for U results in low-lying peaks that overlap with the emission spectra of most trace elements. Thus, separation technologies including solvent extraction and ion exchange chromatography have been developed to minimize spectral interferences resulting from high concentrations of U relative to the trace elements.7–15 Recent efforts have focused on minimizing sample size, reducing method time, and automation to improve these highly effective separations.2 Separations are generally assumed to be the superlative way to obtain quality ICP-OES results for each element at all trace-level concentrations. However, multivariate chemometric regression techniques could account for complex optical emission spectral signatures directly, without needing matrix matched samples.
In recent decades, advanced multivariate chemometric techniques have been developed to build high-fidelity regression models in systems with confounding, covarying, and overlapping spectral features.16 One of the most popular examples is partial least squares regression (PLSR).17–19 This technique has been implemented with great success in numerous fields of science and technology including food processing, pharmaceutical, and nuclear industries. PLSR is a factor analysis method that maximizes the covariance between two matrices corresponding to the spectra (X) and concentrations (Y) using combinations of latent variables (LVs). It is a supervised form of machine learning and requires a representative training set that can be efficiently selected using design of experiments to minimize time and resource consumption.20–24 PLSR could be used to model optical emission spectra and avoid the need for the U matrix removal, but such an approach has not been studied previously. This would improve the analytical time and efficiency of ICP-OES measurements.
Here, we optimize PLSR models built from optical emission spectra, determine limits of detection for numerous trace elements in a U matrix, and validate the method using quality control samples and two uranium oxide reference materials. Calibration and validation spectral data sets were selected by I-optimal designs to minimize the samples required in the training set, which spanned concentrations of U (4–1000 μg mL−1) and trace elements (0.02–2 μg mL−1) and covered the anticipated solution conditions (20–5000 μg per g U). These conditions are highly relevant to numerous applications in the nuclear field. Three points of scientific advancement are covered in this work: (1) multivariate analysis enabled direct quantification of trace elements and U without separations, (2) I-optimal design provided a statistical framework to minimize the number of samples in the training set without user bias, and (3) established limits of detection for numerous trace elements in U using a novel PLSR approach. Herein, we report the first-time multivariate analysis was used to model optical emission spectra and accurately measure trace elements without the need for the U matrix removal.25 This new approach enables the analysis of trace elements and U simultaneously, which is expected to greatly improve the timeliness and efficiency of ICP-OES measurements in niche applications like U production, trace element determination in nuclear fuel, and intentional forensics.25,26 It also provides a viable option to measure elements which are difficult to chemically separate from U (e.g., Zr, Nb, and Th). This state-of-the-art approach can be extended to many applications within and beyond the nuclear field.
2. Experimental
All chemicals were commercially obtained (ACS grade) and used as received unless otherwise stated. Nitric acid 70% (HNO3) was purchased from Sigma-Aldrich. NIST traceable U (10000 μg mL−1) and multielement (100 μg mL−1) ICP-OES standard solutions in HNO3 were purchased from High-Purity Standards. Samples were prepared using deionized water with Milli-Q purity (18.2 MΩ cm at 25 °C).
2.1. Sample preparation
Training set samples contained U and trace elements covering the anticipated solution conditions (20–5000 μg per g U). A list of trace elements included in the sample set are summarized in Tables S1 and S2.† Samples were prepared gravimetrically, using a Mettler Toledo model XS204 balance with an accuracy of ±0.0001 g. Aliquots were diluted in 4% HNO3 or 2 M HNO3. Sample concentration uncertainties were determined by standard error propagation methods described in the ESI.† Uranium oxide (U3O8) certified reference materials (CRM) 124-1 (New Brunswick Laboratory Program Office, Argonne, IL, USA) and a Canadian Uranium Product (CUP-2) U ore reference material (Ottawa, Canada) were prepared by digesting 250 mg in a Savillex vessel using 8 M HNO3 and 0.05 M hydrogen fluoride (HF) with heat (100 °C overnight). The resulting solution was diluted to 1000 μg per mL U in 2 M HNO3 before ICP-OES analysis.2.2. Experimental design
Design of experiments was used to statistically select sample concentrations with Design-Expert (v.11.0.5.0) by Stat-Ease Inc., within the Unscrambler software package by Camo Analytics. A two-component I-optimal design was used to select training set sample concentrations using a quadratic process order and both point and coordinate exchange. The design required six model points to estimate the coefficients in the design model; these were included in the calibration set. The model points were augmented with ten lack-of-fit (LOF) points, which were used as either calibration or validation set samples. LOF points maximize the distance to other runs while satisfying the optimality criterion. The design included two numeric factors, trace element (0.02–2 μg mL−1) and U (4–1000 μg mL−1) concentrations, and a constraint −0.005 × U μg mL−1 + trace μg mL−1 ≤ 0 to ensure trace concentrations relative to U ranged from 20 to 5000 μg per g U. The design was evaluated using the fraction of design space technique.27 The I-optimality criterion, used to calculate I-optimal designs (also called IV or Integrated Variance), is the most desirable option when prediction performance is important.28 The algorithm selects points to minimize the integral of prediction variance throughout the design space.2.3. Inductively coupled plasma-optical emission spectroscopy
ICP-OES was used to quantify elemental concentrations in each sample. The elemental analyses were evaluated in axial view using a Thermo Fisher (Bremen, Germany) iCAP PRO instrument operated at 1150 W with an Ar flow rate of 12 L min−1. The ICP-OES is equipped with a simultaneous echelle spectrometer and a high-speed charge injection device (CID) detector for the simultaneous detection of all wavelengths (167–852 nm). All samples were introduced with an Elemental Scientific Inc. (ESI, Omaha, NE, USA) SC-2DXi autosampler into a quartz nebulizer housed within a quartz spray chamber. All measurements were made with axial plasma viewing for enhanced sensitivity. Emission spectra were processed by adjusting the background correction and integration area using Qtegra™ Intelligent Scientific Data Solution™ software (Bremen, Germany). The interelement correction can be applied to raw data intensity values when the spectral overlap from the dominant emission lines is known. External calibration was used to determine unknown elemental concentrations using either a standard calibration curve for each element (0.01–5 μg mL−1) or an I-optimal design selected training set (Section 2.2). Spectral data were postprocessed using Thermo Fisher software to help account for overlapping peaks when determining elemental concentrations by software derived intensity values. Trace metal ICP-OES measurements in U were validated against quality control and reference samples (CMR 124-1 and CUP-2).2.4. Partial least squares regression
PLSR is one of the most popular supervised multivariate modeling methods. It models both the X (spectra) and Y (concentration) matrices simultaneously to find the factors (also known as latent variables, LVs) in X that best predict Y, by iteratively maximizing the covariance between X and Y. The ideal number of LVs is typically selected by comparing the calibration and validation root mean square error (RMSE) vs. the number of factors in the model. Factor selection is typically performed using a set of test samples to evaluate model performance by from cross-validation or an independent set. The last factor with an appreciable decrease in the RMSE of the cross validation (RMSECV) generally corresponds to the ideal number of LVs. Including too many factors can overfit the model and introduce unwanted noise. A full cross validation, leaving one sample out at a time, was used.The Unscrambler X software (version 10.4) was used for multivariate analysis and data preprocessing. A NIPALS algorithm with 100 iterations was used for PLSR model calibration.29 PLS2 models, which handle multiple Y responses simultaneously, were used unless otherwise stated. Variable selection based on significant regression coefficients did not improve the models. Data preprocessing and feature selection methods were evaluated; however, these did not result in significant improvements (data not shown here).22,30,31
2.5. Statistics and limits of detection
The RMSE was used as the primary metric for cross validation (CV) statistics and prediction (P) error, defined in eqn (1):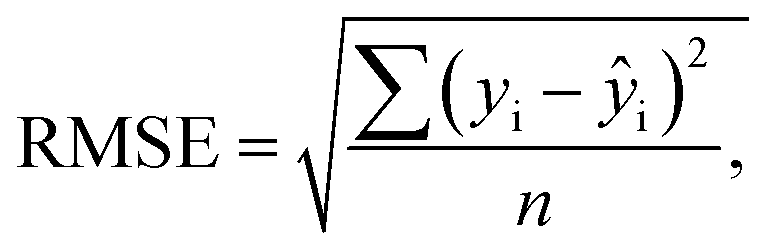 | (1) |
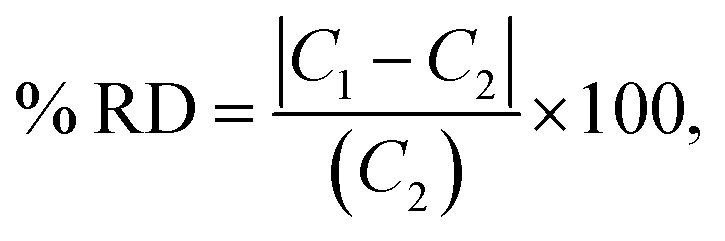
Percent relative difference (% RD) was used to calculate how close the predictions were to the reported mean concentration in the verification samples using eqn (2):
 | (2) |
 | (3) |
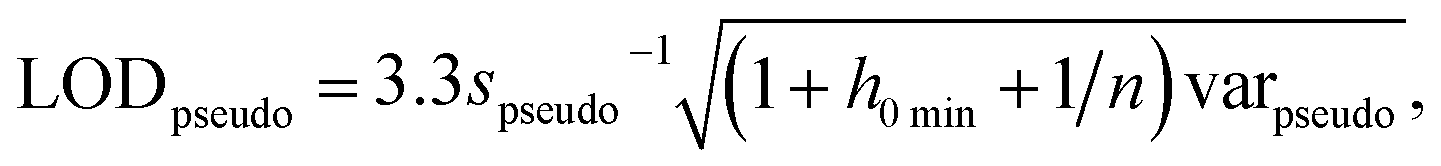
The International Union of Pure and Applied Chemistry defines the LOD as the lowest concentration that can be detected with reasonable certainty for a given method.34 Ortiz provided an expansion of the traditional univariate LOD equation for multivariate methods to determine a pseudounivariate LOD (LODpseudo),35 summarized in eqn (4):
 | (4) |
3. Results and discussion
3.1. Optical emission spectra
The optical emission spectra of most elements on the periodic table are well established. These spectra originate from atoms or ions that absorb energy from the plasma, causing electrons to move from ground to excited states. When excited electrons transition back to lower energy levels, each element emits characteristic photons of light at wavelengths corresponding to the energy change between levels. The linear relationship between the intensity of the light emitted by a given number of atoms is described by the Beer–Lambert law. Univariate regression curves are commonly used to describe how the intensity of light is related to the concentration of each element in solution. However, this calibration approach necessitates the input of spectra free from the interference of overlapping spectral features related to other elements in solution.37 This linear relationship breaks down when measuring trace elements in nuclear materials with line-rich emission spectra like U.Several emission spectra are shown in Fig. 1 to illustrate the range of U matrix spectral interference on trace element spectra. The U interference with the Fe 238.20 nm emission line resulted in a relatively simple baseline offset. On the other hand, the V 310.23 nm was more significantly influenced by convolution with the U emission peaks. The effect(s) of low-lying U peaks vary from element to element. Additionally, these effects vary significantly between emission lines from the same element (Fig. S1†). Thus, multiple emission peaks for each element must be considered.
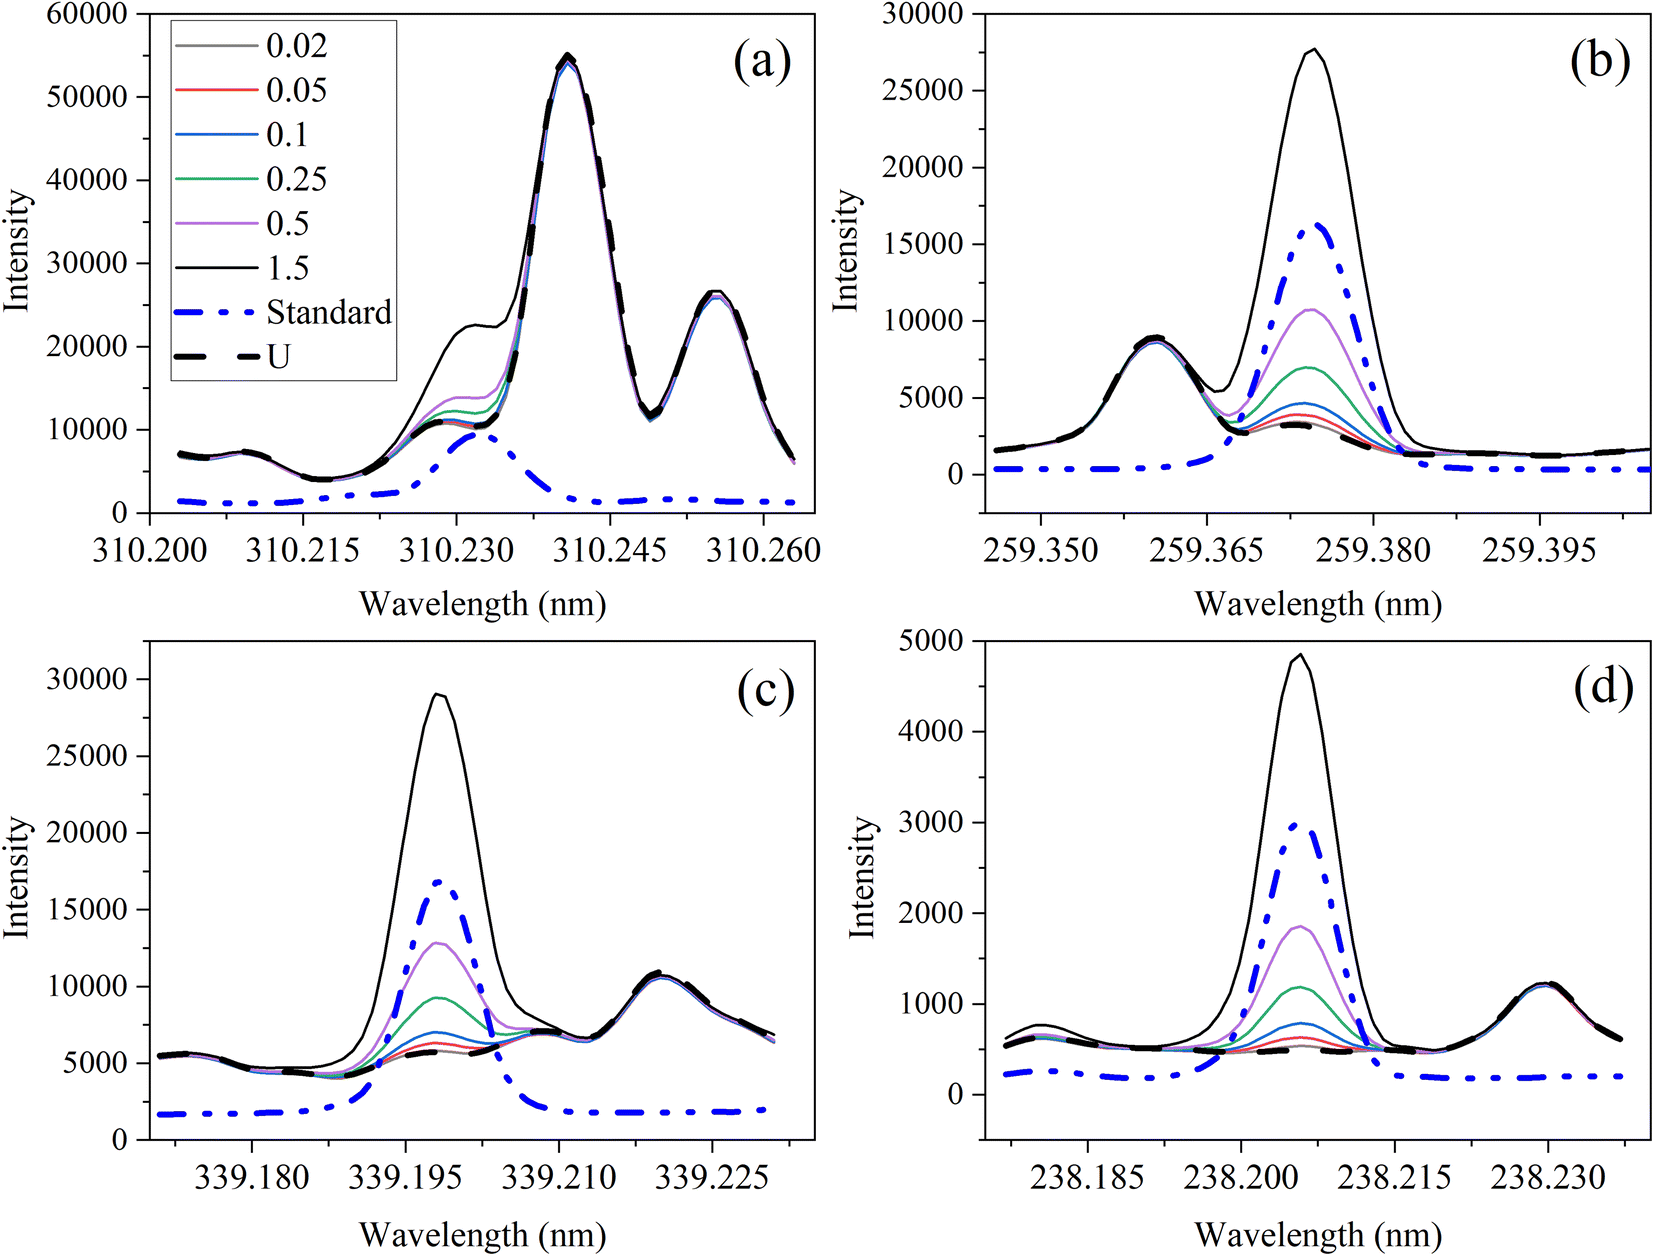 | ||
| Fig. 1 Optical emission spectra of trace elements from 0.02 to 1.5 μg mL−1 in 1000 μg per mL U for (a) V 310.23 nm, (b) Mn 259.37 nm, (c) Zr 339.20 nm, and (d) Fe 238.20 nm compared to a standard (1 μg mL−1 multielement standard) and a 1000 μg per mL U sample. | ||
Interferences from adjacent or overlapping emission lines from the matrix (U) complicated quantification of most elements using standard univariate calibration and instrument software settings. Several examples are provided in Table 1. The emission spectra were postprocessed by adjusting the background integration area using Qtegra™ Intelligent Scientific Data Solution™ software. The univariate calibration curves for each species, without the U matrix, were used to quantify trace elements in the U matrix for several quality control samples (Table S4†). The RMSE% for five trace elements when compared to reference values are shown in Table 1. The RMSE% for U concentration (emission peak 385.96 nm) by the univariate approach was 2.6%. Trace Fe was the only element quantifiable by this standard approach (i.e., ≤5%). This confirms previous findings that required matrix separation of trace elements before quantification with standard ICP-OES methods.8 Therefore, a multivariate approach was investigated to account for overlapping U peaks and improve trace quantification by analyzing optical emission spectra directly.
| Element (nm) | RMSE% |
|---|---|
| Mn 259.37 | 15.7 |
| Nb 309.42 | 16.8 |
| V 310.23 | 111.0 |
| Zr 339.20 | 11.7 |
| Fe 238.20 | 3.2 |
3.2. Selecting sample concentrations
Supervised multivariate regression models must contain samples covering the anticipated conditions; trace concentrations from 20 to 5000 μg per g U. Optimal designs have been used with great success to minimize the number of samples in spectral training sets.21,22 They are the most flexible, user friendly, and efficient option for selecting training set concentrations when the fewest number of samples is desired. One-factor-at-a-time methods, more commonly used for selecting samples, result in numerous samples.24 For example, a 2-factor set varied at 5 levels would require 25 samples (52).Sample concentrations were selected by I-optimal experimental design. Six model points were augmented with ten LOF points (Table 2). The ratio was calculated by dividing the trace (μg) by the U (g) to obtain μg per g U. LOF samples fall within the factor space (i.e., no vertex points) and can be added to the calibration set or used as a statistically derived validation set to avoid user bias. Here, the calibration set contained 12 samples, and the validation set contained 10 samples including 4 LOF points and an additional set of 6 validation samples (Table S3†) to cover the factor space for each variable. Additional LOF points could be included in future designs to provide more quality controls. Optimal designs encompass both mixture and process variables, contain different high and low components, and accommodate constraints with factor limits so they can easily be tailored to specific conditions.
| Run | U (μg mL−1) | Trace (μg mL−1) | Space type | Build type | Ratio (μg per g U) |
|---|---|---|---|---|---|
| a (*) LOF points included in the validation set. Required model points are bolded. Abbreviations include lack of fit (LOF). U and ratio concentrations were rounded to the nearest integer. | |||||
| 1 | 532 | 0.396 | Interior | Model | 745 |
| 2 | 4 | 0.020 | Vertex | Model | 5000 |
| 3 | 1000 | 0.020 | Vertex | Model | 20 |
| 4 | 704 | 2.000 | Edge | Model | 2839 |
| 5 | 1000 | 1.208 | Edge | Model | 1208 |
| 6 | 259 | 1.293 | Vertex | Model | 5000 |
| 7 | 233 | 0.020 | Edge | LOF | 86 |
| 8 | 392 | 1.801 | Interior | LOF | 4589 |
| 9* | 522 | 1.178 | Interior | LOF | 2258 |
| 10 | 1000 | 0.514 | Edge | LOF | 514 |
| 11* | 756 | 1.446 | Interior | LOF | 1912 |
| 12* | 104 | 0.515 | Interior | LOF | 4971 |
| 13 | 701 | 0.020 | Edge | LOF | 29 |
| 14 | 751 | 0.822 | Interior | LOF | 1094 |
| 15* | 340 | 0.782 | Interior | LOF | 2304 |
| 16 | 1000 | 1.602 | Edge | LOF | 1602 |
3.3. PLSR model development and performance
PLSR was used to correlate optical emission spectra to analyte concentration. The concentration of samples in the calibration set is shown in Table 2. The predictor matrix X comprised the entire spectrum for each analyte. Trimming the spectra to only include regions specific to the trace elements did not improve the model performance (data not shown here). Individual PLSR models were built for each trace element. Uranium concentration was modeled using low-lying peaks in the trace element regions of interest for most elements. This allowed the quantification of both trace species and U simultaneously (i.e., single ICP-OES measurement). The limit of detection for U using low-lying peaks varied from element to element because the levels of low-lying U peaks relative to trace element emission intensity in each region varied significantly. For several elements, U measurements were improved by modeling (PLS1) the U emission peak (385.96 nm) to predict U concentration. PLS1 and PLS2 models could be combined in a stacked regression approach in future work.20The optimal number of factors (i.e., LVs) in PLSR models for each element was chosen by evaluating the percent root mean square error (RMSE%) versus the number of factors. RMSE values have the same units as the response variable (i.e., μg mL−1). An example model of the Zr 339.198 nm emission region is provided in Fig. 2a. The last significant decrease in RMSE% occurred at three factors for Zr and U, which suggests that three factors should be included. The PLSR model, with three factors for both Zr and U, was used to predict sample concentrations in a validation set to calculate RMSEP. Predicted versus reference parity plots for Zr and U are shown in Fig. 2b and c. A linear correlation near one for each measurement indicated robust calibration, CV, and prediction performance. Similar RMSEC, RMSECV, and RMSEP values indicated a balanced model for Zr and U. RMSEC and RMSECV statistics differed significantly when fewer training set samples were used. This suggests that the number of samples in the training set was minimized effectively using I-optimal design and approached the optimum (∼12 samples). Future work could assess this in greater detail.21 The number of samples used to train the PLSR model was consistent with the traditional approach that typically requires six trace element standards and six U standards (12 total).
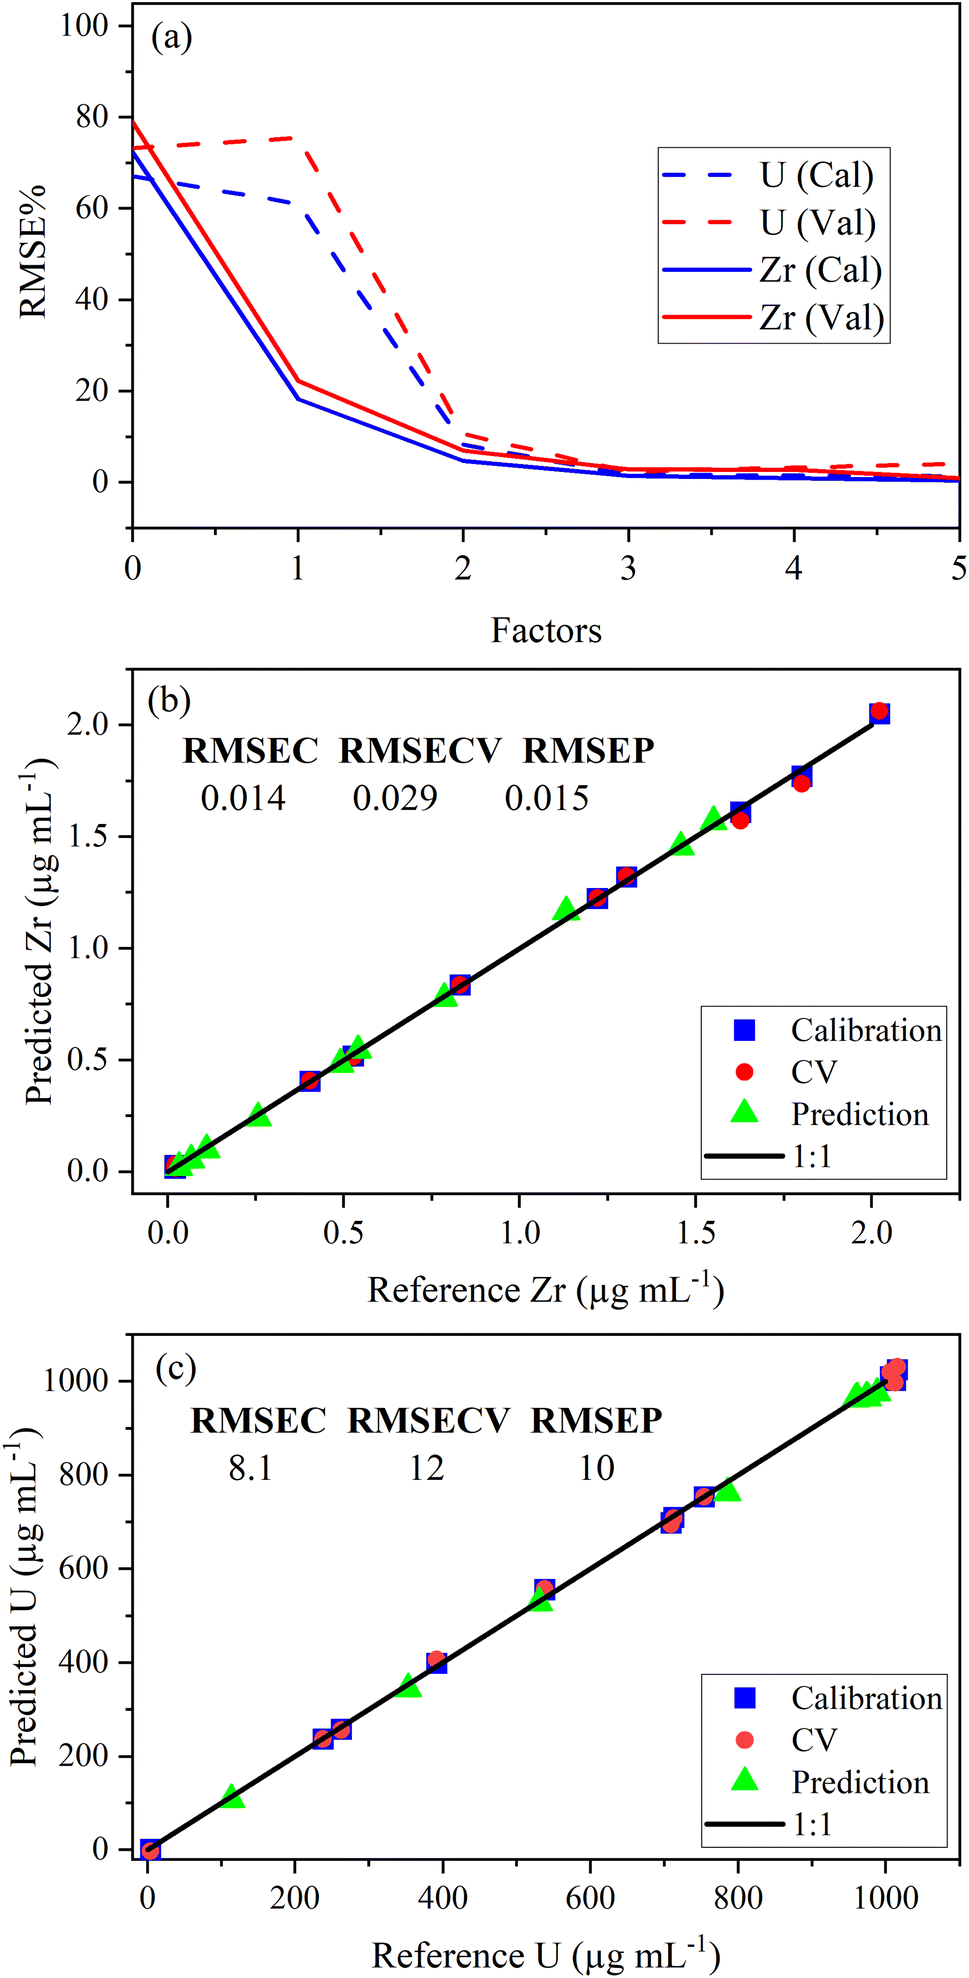 | ||
| Fig. 2 Plot of (a) RMSE% versus the number of factors, (b) Zr parity plot with RMSE values, and (c) U parity plot with RMSE values. RMSE values are in parts per million (μg mL−1). | ||
The RMSEP and RMSEP% values for U and trace elements are reported in Table 3. RMSEP values approximate the ±error associated with predicted values. The number of factors varied between elements. Two or three factors was the most common, although several elements used four or even five factors. Zirconium (Zr) and niobium (Nb) emission spectra are convoluted with low-lying uranium spectra (Fig. 1 and S2†). Zirconium and niobium are difficult to separate from uranium using common methods (e.g., UTEVA).8 The PLSR approach measured both Nb and Zr with high accuracy without separation. This highlights a major benefit of this new approach for modeling emission spectra directly.
| Element (nm) | U (μg mL−1) | RMSEP% | Trace (μg mL−1) | RMSEP% | Factors |
|---|---|---|---|---|---|
| Mn 259.373 | 4.3 | 0.9 | 0.018 | 2.29 | 2 |
| Nb 309.418 | 6.64 | 1.4 | 0.022 | 2.80 | 2 |
| V 310.230 | 7.61 | 1.6 | 0.0085 | 1.08 | 4 |
| Zr 339.198 | 9.95 | 2.0 | 0.015 | 1.91 | 3 |
| Fe 238.204 | 12.67 | 2.6 | 0.012 | 1.53 | 4 |
A different number of factors were used, despite there being two species (Y variables) in each PLSR model. This could be related to the dissimilar intensities of low-lying U peaks relative to trace element peaks. The explained variance plots were compared to X-loadings to better understand differences between models and confirm that the models were describing relevant features in the spectra. Line loadings should have a profile like the original spectra. An example with Zr and Mn models is shown in Fig. 3. The calibration total explained Y-variance for Zr (factors-3) and Mn (factors-2) was 99.95% and 99.94%, which indicated that most of the total variation in Y (i.e., concentration matrix) was accounted for. CV explained variance plots matched the calibration, which suggests that each model can describe new data well, and there is no indication of overfitting (Fig. 3a and c).
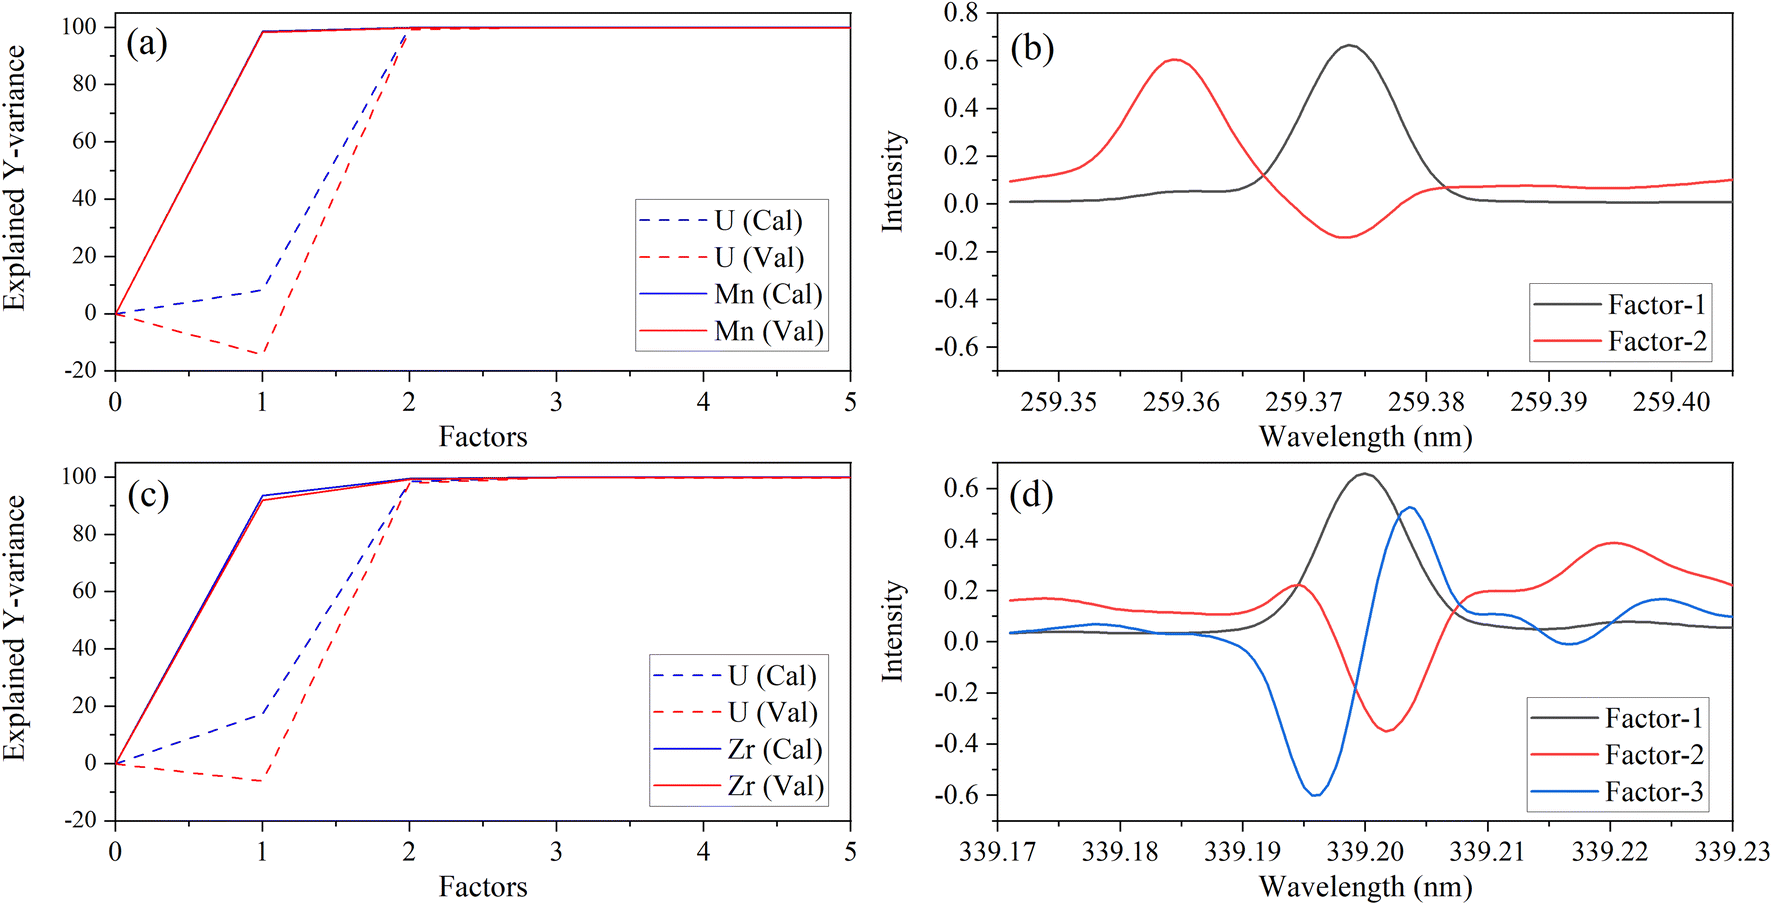 | ||
| Fig. 3 Explained variance and X-variable (nm) loadings plot for Mn 259.373 nm (a, b) and Zr 339.198 nm (c, d). | ||
X-Loading plots show the wavelengths that provide the most important sources of information. They show how the spectral data relates to the variation in Y. Variables with the largest loadings in the earlier components describe the greatest differences between samples. The first loading in each model represents the emission band of the trace species. This was consistent with the explained Y-variance plot, which indicated that the first factor primarily describes the variation in the trace species. This was expected because the trace element emission peak is the greatest source of signal variation for most species. However, for some elements (e.g., V), the low-lying U spectrum is more intense than the trace element (Fig. 1) and the opposite trend in explained variance was observed (data not shown here). This could explain why PLSR models for some elements like V contained greater than three factors.
Manganese X-loadings for factors 1 and 2 are shown in Fig. 3b. These correspond almost entirely to the Mn emission band (X-loading 1) and U low-lying peaks (X-loading 2). Zirconium X-loadings for factors 1, 2, and 3 are shown in Fig. 3d. The first and second loadings look like the optical emission spectra for Zr and U, respectively (Fig. 1). The X-loading for factor 2 looks primarily like the background component from the U low-lying peaks. This is consistent with the explained Y-variance plot, which shows that the second component describes mostly the U portion. The second component describes some information related to the trace species, particularly in the Zr model. The Zr X-loading for factor 3 likely describes a combination of instrument drift and adjusts for the convolution of the Zr and U emission peaks. These results illustrate that the PLSR models are describing the data well and in a way that is consistent with reality.
3.4. Analysis of certified reference materials
The ICP-OES analysis of trace elements in U materials should be accompanied by quality control measurements using certified reference materials. Well-characterized reference materials are available.4–6 Standards may contain as many as 66 well-characterized elemental concentrations ranging from 0.005 to 11000 μg per g U.4 Here, we evaluated how well the PLSR approach predicted impurity levels within the studied concentration range (20–5000 μg per g U) in uranium oxide CRM 124-1 and CUP-2 reference materials.4,6 This concentration range could be expanded in future work by modifying the I-optimal design parameters. Best case scenario detection limits for ICP-OES measurements with some elements are near ∼5 μg per g U when separations are used.2 The limit of detection (LOD) with respect to U for each trace species varied from ∼20 to 200 μg per g U using PLSR. If the concentration range is extended further, more samples in the training set and a stacked regression approach could effectively cover the entire range while accounting for potential nonlinearity in the emission trends.20,21
The percent relative difference (% RD) for 30 elements are reported in Table 4 (CUP-2) and Table 5 (CMR-124-1). Multiple wavelengths for most elements were evaluated. The results in Tables 4 and 5 were reported for the wavelength of each element with the best performance (i.e., lowest % RD). For example, one wavelength for Al (308.215 nm) and Mn (257.61 nm) missed the mark for the lowest or both concentrations while the other wavelength provided highly accurate values (Tables 4 and 5). This shows the need to evaluate each multiple wavelengths for each element to obtain the best results.
| Element (nm) | Reference mean (μg per g U) | % RSD | Predicted (μg per g U) | % RD | LOD (μg per g U) | Zeta | LVs |
|---|---|---|---|---|---|---|---|
| a The asterisk (*) indicates elements below estimated detections limits. The pound (#) indicates elements where the U concentration was measured by PLS1. Abbreviations: limit of detection (LOD), latent variables (LVs), percent relative standard deviation (% RSD), percent relative difference (% RD). Elements in bold were also reported for CRM 124-1 (Table 5). | |||||||
| As 189.04 | 451 ± 62 | 13.7 | 441.5 ± 29 | −2.1 | 51 | −0.14 | 2 |
| Al 396.15 | 3360 ± 390 | 12 | 3097 ± 102 | −7.8 | 72 | −0.65 | 2 |
| Ba 233.53 | 147 ± 11 | 7.5 | 143.4 ± 19 | −2.5 | 88 | −0.16 | 2 |
| B 249.77 | 73 ± 25 | 34.2 | 73.5 ± 11 | 0.68 | 18 | 0.018 | 3 |
| Be 313.04# | — | — | — | — | 18 | — | 5 |
| Ca 339.36# | 8300 ± 1600 | 19 | 7070 ± 280 | −14.8 | 77 | −0.78 | 5 |
| Cr 283.56* | 19.8 ± 2.4 | 12.1 | 24.9 ± 22 | 25.7 | 37 | 0.24 | 3 |
| Co 228.62 | — | — | — | — | 31 | — | 4 |
| Cu 324.75 | 31.6 ± 5.7 | 18.0 | 25.3 ± 16 | −20 | 28 | −0.37 | 4 |
| Ce 535.35 | 53.4 ± 4.6 | 8.6 | 56.4 ± 22 | 5.7 | 39 | 0.20 | 3 |
| Dy 353.17* | 24.8 ± 2 | 8.1 | 17.6 ± 13 | −28.9 | 38 | −0.53 | 2 |
| Fe 238.20 # | 4410 ± 600 | 13.6 | 4251 ± 150 | −3.5 | 35 | −0.25 | 3 |
| K 766.49# | 1480 ± 240 | 16 | 1390 ± 36 | −6.1 | 19 | −0.37 | 4 |
| La 412.32* | 24.3 ± 7.1 | 29.2 | 19.6 ± 20 | −19.4 | 38 | −0.22 | 3 |
| Mo 202.03 | 1042 ± 84 | 8.1 | 1043 ± 16 | 0.0 | 29 | 0.01 | 4 |
| Mn 259.37 | 134 ± 17 | 12.7 | 136 ± 14 | 1.8 | 47 | 0.11 | 2 |
| Mg 279.55# | 3210 ± 500 | 15.6 | 3002 ± 73 | −6.5 | 45 | −0.41 | 3 |
| Na 589.59 # | 6050 ± 870 | 14.4 | 5915 ± 152 | −1.1 | 120 | −0.078 | 2 |
| Ni 231.60* | 34.5 ± 4.7 | 13.6 | 33.0 ± 11 | −4.5 | 45 | −0.13 | 2 |
| Nd 401.23* | 26.3 ± 2.2 | 8.4 | 22.4 ± 18 | −15.0 | 33 | −0.22 | 3 |
| P 177.50 | 380 ± 110 | 28.9 | 386 ± 22 | 1.50 | 54 | 0.051 | 2 |
| Pb 220.35 | 357 ± 35 | 9.8 | 370 ± 67 | 3.53 | 190 | 0.17 | 2 |
| Si 212.41 | 2500 ± 800 | 32.0 | 2113 ± 88 | −16.8 | 220 | −0.48 | 2 |
| Sn 189.99* | 4.72 ± 0.51 | 11 | — | — | 210 | — | 2 |
| Th 283.72 | 2170 ± 240 | 11.1 | 2229 ± 126 | 2.7 | 200 | 0.22 | 3 |
| Ti 323.45 | 225 ± 20 | 8.9 | 224 ± 12 | −0.55 | 22 | −0.053 | 3 |
| V 310.23 | 890 ± 81 | 9.1 | 944 ± 90 | 6.0 | 58 | 0.45 | 4 |
| W 239.71* | 18.4 ± 2.9 | 15.8 | 20 ± 30 | 8.7 | 74 | 0.052 | 3 |
| Zr 339.20 | 560 ± 61 | 10.9 | 542 ± 12 | −3.2 | 37 | −0.29 | 3 |
| Zn 202.55 | 45 ± 15 | 33.3 | 37.0 ± 10 | −18.6 | 37 | −0.44 | 5 |
| Element (nm) | Reference mean (μg per g U) | % RSD | Predicted (μg per g U) | % RD | Zeta | LOD (μg per g U) |
|---|---|---|---|---|---|---|
| a The asterisk (*) indicates elements below estimated detections limits. The pound (#) indicates elements where the U concentration was measured by PLS1. Abbreviations: limit of detection (LOD), latent variables (LVs), percent relative standard deviation (% RSD), percent relative difference (% RD). Elements in bold were also reported for CUP-2 (Table 4). The LVs reported in Table 1 were also used here. | ||||||
| As 189.04 | — | — | — | — | — | 51 |
| Al 396.15 | 217 ± 37 | 17 | 219 ± 51 | 0.83 | 0.029 | 72 |
| Ba 233.53 | — | — | — | — | — | 88 |
| B 249.77* | 5.5 ± 1 | 18.2 | 9.7 ± 7 | 75.8 | 0.58 | 18 |
| Be 313.04# | 22.7 ± 7.3 | 32.2 | 27 ± 19 | 17.8 | 0.20 | 18 |
| Ca 339.36 | — | — | — | — | — | 77 |
| Cr 283.56 | 107 ± 14 | 13.1 | 107 ± 21 | 0.0 | 0.00 | 37 |
| Co 228.62* | 23.3 ± 6.1 | 26.2 | 17 ± 16 | −28.2 | −0.39 | 31 |
| Cu 324.75 | 46.3 ± 9.4 | 20.3 | 38.8 ± 13 | −16.3 | −0.46 | 28 |
| Ce 535.35 | — | — | — | — | — | 39 |
| Dy 353.17 | — | — | — | — | — | 38 |
| Fe 238.20 # | 196 ± 24 | 12.2 | 213 ± 23 | 8.9 | 0.53 | 35 |
| K 766.49 | — | — | — | — | — | 19 |
| La 412.32 | — | — | — | — | — | 38 |
| Mo 202.03 | 100.5 ± 5.5 | 5.5 | 95 ± 14 | −5.2 | −0.34 | 29 |
| Mn 259.37 | 50.2 ± 7.6 | 15.1 | 47 ± 14 | −6.1 | −0.19 | 47 |
| Mg 279.55 # | 104 ± 13 | 12.5 | 103 ± 24 | −1.0 | −0.038 | 45 |
| Na 589.59 # | 364 ± 127 | 34.9 | 340 ± 30 | −6.6 | −0.19 | 120 |
| Ni 231.60 | 208 ± 17 | 8.2 | 195 ± 11 | −6.1 | −0.63 | 45 |
| Nd 401.23 | — | — | — | — | — | 33 |
| P 177.50 | — | — | — | — | — | 54 |
| Pb 220.35* | 46 ± 15 | 32.6 | 65.5 ± 67 | 42.3 | 0.282 | 190 |
| Si 212.41 | 221 ± 58 | 26.2 | 198 ± 75 | −11 | −0.24 | 220 |
| Sn 189.99* | 45 ± 6.9 | 15.3 | 51.9 ± 63 | 16.1 | −0.11 | 210 |
| Th 283.72 | — | — | — | — | — | 200 |
| Ti 323.45 | 44 ± 14 | 31.8 | 47.9 ± 13 | 8.8 | 0.21 | 22 |
| V 310.23* | 49.9 ± 7.2 | 14.4 | 67 ± 33 | 33.7 | 0.49 | 58 |
| W 239.71 | 195 ± 22 | 11.3 | 182 ± 42 | −6.6 | −0.27 | 74 |
| Zr 339.20 | 228 ± 61 | 26.8 | 227 ± 12 | 0.36 | 0.01 | 37 |
| Zn 202.55 | 203 ± 57 | 28.1 | 227 ± 14 | 12.8 | 0.41 | 37 |
We also employed a pseudounivariate approach to calculate the method LOD based on how well the model predicts the samples in the calibration set (see Section 2.5). The LOD approximation was generally consistent with the measured reference material concentration results. For example, the LOD for Co was calculated as 38 μg per g U. We tested the model on CRM 124-1 with a reported mean value of 23.3 ± 6.1 μg per g U, and the results fell outside the range at Co 17 ± 16 μg per g U or −28.2% RD. The large uncertainty associated with the measurement also suggests that we were operating below the LOD. The reported mean values for B in CRM 124-1 and CUP-2 were 5.5 ± 1 and 73 ± 25 μg per g U, respectively. The PLSR model predicted 9.7 ± 7 and 73.5 ± 11 μg per g U B for CRM 124-1 and CUP-2, respectively. The only example that slightly missed the mark was the Cu 324.75 nm peak. With an estimated LOD of 28 μg per g U, the % RD for both CRM 124-1 (46.3 ± 9.4 μg per g U) and CUP-2 (31.6 ± 5.7 μg per g U) standards were expected to be in range. However, the predicted CUP-2 sample concentration was not within the expected % RSD bounds. This stresses the point that reference materials and quality controls must accompany each measurement to ensure accurate results.
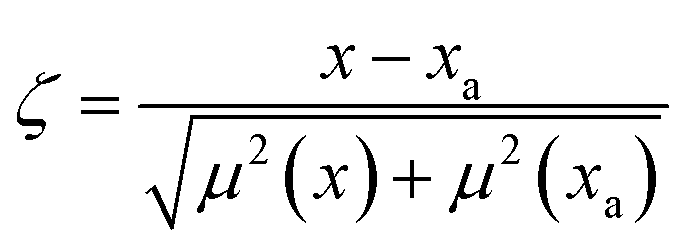
Ultimately, zeta scores and % RD values were used to compare PLSR model concentration values and reported reference values. Overall, the zeta scores for every element were within the ±1 range indicating highly acceptable results. The prediction matched the reference mean only when the % RD was lower than the reported % RSD values. Although some elements such as La, Nd, and Dy were below the estimated detection limits, we still included % RD values. Most of the reported trace and U concentrations were predicted simultaneously using PLS2 regression models. For CUP-2 and CRM 124-1 the U concentration of the measured solutions was 1223 ± 19 and 1167 ± 16 μg mL−1, respectively. Several elements (Ca, Fe, Mg, Na, Be) with minimal U overlap and relatively strong emission intensities fared slightly better using U concentrations provided by a PLS1 model built using U 385.96 nm emission spectra. Many alkali/alkaline elements (e.g., Li and Ca) had emission peaks with much greater intensity than the low-lying U background, such that the quantification of U with low-lying peaks was compromised in the range studied. Calcium and sodium concentrations in CUP-2 were modeled to determine how well PLSR can predict sample concentrations outside of the modeled range (20–5000 μg per g U). The Ca and Na zeta scores of −0.76 and −0.078 and % RD values indicated highly acceptable values.
4. Conclusions
For the first time, PLSR models were developed to quantify trace element concentrations in U (20–5000 μg per g U) based solely on spectral variations in ICP-OES spectra, without prior chemical separations. The reduction in RMSEP compared to standard software protocols shows how multivariate analysis can be used to account for convoluted spectral features. This method improves the timeliness of ICP-OES measurements that traditionally rely on chemical separations,2 and this multivariate approach can be used to measure trace species that are difficult to separate from U (e.g., Zr, Nb, Th).25 The analysis presented had an overall % RD < 10% for nearly 30 elements of interest compared to two certified reference materials (CMR 124-1 and CUP-2). The zeta score determination further demonstrates the effectiveness of this multivariate approach and that it is ready for the analysis of real process solutions. This methodology can likely be applied to every element with measurable optical emission spectra and can readily adapt to support applications within the nuclear field and beyond. Future work may include further optimizing detection limits and characterizing other systems, such as mixed lanthanides and actinides, and testing this approach on other ICP-OES platforms.Author contributions
The manuscript was written using contributions of all authors. All authors have given approval to the final version of the manuscript.Conflicts of interest
The authors declare no competing financial interest.Acknowledgements
This work was funded by the U.S. Department of Energy, National Nuclear Security Administration, Office of Defense Nuclear Nonproliferation Research and Development. Oak Ridge National Laboratory is managed by UT-Battelle LLC for the U.S. Department of Energy under contract DE-AC05-00OR22725. This manuscript has been authored by UT-Battelle LLC under contract DE-AC05-00OR22725 with the US Department of Energy (DOE). The US government retains and the publisher, by accepting the article for publication, acknowledges that the US government retains a nonexclusive, paid-up, irrevocable, worldwide license to publish or reproduce the published form of this manuscript, or allow others to do so, for US government purposes. DOE will provide public access to these results of federally sponsored research in accordance with the DOE Public Access Plan (https://energy.gov/downloads/doe-public-access-plan).References
- B. T. Manard, S. C. Metzger, K. T. Rogers, B. W. Ticknor, D. A. Bostick, N. A. Zirakparvar and C. R. Hexel, Int. J. Mass Spectrom., 2020, 455, 116378 CrossRef CAS.
- B. T. Manard, D. A. Bostick, S. C. Metzger, B. W. Ticknor, N. A. Zirakparvar, K. T. Rogers and C. R. Hexel, Spectrochim. Acta, Part B, 2021, 179, 106097 CrossRef CAS.
- A. Saha, K. Kumari, S. B. B. Deb and M. K. Saxena, J. Anal. At. Spectrom., 2021, 36, 561–569 RSC.
- J. S. Denton, et al. , J. Radioanal. Nucl. Chem., 2022 DOI:10.1007/s10967-022-08397-9.
- S. Bürger, S. F. Boulyga, M. V. Peńkin, D. Bostick, S. Jovanovic, R. Lindvall, G. Rasmussen and L. Riciputi, J. Radioanal. Nucl. Chem., 2014, 301, 711–729 CrossRef.
- S. Bürger, K. J. Mathew, P. Mason and U. Narayanan, J. Radioanal. Nucl. Chem., 2009, 279, 659–673 CrossRef.
- B. T. Manard, S. C. Metzger, S. Wysor, V. Bradley, N. A. Zirakparvar, K. T. Rogers, D. A. Bostick, B. W. Ticknor and C. R. Hexel, Appl. Spectrosc., 2021, 75, 556–564 CrossRef CAS PubMed.
- B. T. Manard, C. D. Quarles, S. C. Metzger, K. T. Rogers, B. W. Ticknor, D. A. Bostick, E. H. McBay and C. R. Hexel, Appl. Spectrosc., 2019, 73, 927–935 CrossRef CAS PubMed.
- S. C. Metzger, K. T. Rogers, D. A. Bostick, E. H. McBay, B. W. Ticknor, B. T. Manard and C. R. Hexel, Talanta, 2019, 198, 257–262 CrossRef CAS PubMed.
- C. D. Quarles, B. T. Manard, E. M. Wylie and N. Xu, Talanta, 2018, 190, 460–465 CrossRef CAS PubMed.
- E. M. Wylie, B. T. Manard, C. D. Quarles, L. Meyers and N. Xu, Talanta, 2018, 189, 24–30 CrossRef CAS PubMed.
- J. Gao, B. T. Manard, A. Castro, D. Montoya, N. Xu and R. Chamberlin, Talanta, 2017, 167, 8–13 CrossRef CAS PubMed.
- K. Satyanarayana and S. Durani, J. Radioanal. Nucl. Chem., 2010, 285, 659–665 CrossRef CAS.
- M. Gopalkrishnan, K. Radhakrishnan, P. S. Dhami, V. T. Kulkarni, M. V. Joshi, A. B. Patwardhan, A. Ramanujam and J. N. Mathur, Talanta, 1997, 44, 169–176 CrossRef CAS PubMed.
- R. Baghaliannejad, M. Aghahoseini and M. K. Amini, Talanta, 2021, 222, 121509 CrossRef CAS PubMed.
- D. Kirsanov, A. Rudnitskaya, A. Legin and V. Babain, J. Radioanal. Nucl. Chem., 2017, 312, 461–470 CrossRef CAS.
- L. R. Sadergaski, D. W. Depaoli and K. G. Myhre, Appl. Spectrosc., 2020, 74, 1252–1262 CrossRef CAS PubMed.
- P. T. Tse, J. Shafer, S. A. Bryan, G. L. Nelson and A. M. Lines, Appl. Spectrosc., 2021, 76, 173–183 CrossRef PubMed.
- L. R. Sadergaski, K. G. Myhre and L. H. Delmau, Talanta Open, 2022, 5, 100120 CrossRef.
- L. R. Sadergaski and H. B. Andrews, Analyst, 2022, 147, 4014–4025 RSC.
- L. R. Sadergaski, G. K. Toney, L. D. Delmau and K. G. Myhre, Appl. Spectrosc., 2021, 75, 1155–1167 CrossRef CAS PubMed.
- L. R. Sadergaski, T. J. Hagar and H. B. Andrews, ACS Omega, 2022, 7, 7287–7296 CrossRef CAS PubMed.
- C. G. Novaes, M. A. Bezerra, E. G. P. da Silva, A. M. P. dos Santos, I. L. da Silva Romao and J. H. S. Neto, Microchem. J., 2016, 128, 331–345 CrossRef CAS.
- V. Czitrom, Am. Stat., 1999, 53, 126–131 Search PubMed.
- G. L. Donati, R. S. Amais and C. B. Williams, J. Anal. At. Spectrom., 2017, 32, 1283 RSC.
- B. A. Wilson, A. Conant and T. Ulrich, et al. , Front. Nucl. Eng., 2023, 2, 1123134 CrossRef.
- A. Zahran, C. M. Anderson-Cook and R. H. Myers, J. Qual. Technol., 2003, 35, 377–386 CrossRef.
- B. Smucker, M. Krzywinski and N. Altman, Nat. Methods, 2018, 15, 559–560 CrossRef CAS PubMed.
- B. S. Dayal and J. F. MacGregor, J. Chemom., 1997, 11, 73–85 CrossRef CAS.
- H. B. Andrews and K. G. Myhre, Appl. Spectrosc., 2022, 76, 877–886 CrossRef CAS PubMed.
- H. B. Andrews, L. R. Sadergaski and S. K. Cary, ACS Omega, 2022, 8, 1–10 Search PubMed.
- F. Westad and F. Marini, Anal. Chim. Acta, 2015, 893, 14–24 CrossRef CAS PubMed.
- S. D. Vries and C. J. F. Ter Braak, Chemom. Intell. Lab. Syst., 1995, 30, 239–245 CrossRef.
- Compendium of Chemical Terminology, ed. A. D. McNaught and A. Wilkinson, Blackwell Scientific Publications, Oxford, 2nd edn (The “Gold Book”), 1997 Search PubMed.
- M. C. Ortiz, L. A. Sarabia, A. Herrero, M. S. Sánchez, M. B. Sanz, D. Giménez and M. E. Meléndez, Chemom. Intell. Lab. Syst., 2003, 69, 21–33 CrossRef CAS.
- F. Allegrini and A. C. Olivieri, Anal. Chem., 2014, 86, 7858–7866 CrossRef CAS PubMed.
- M. Liu, Y. Zhao, B. Tian, M. Tian, J. Zhang, H. Zhang, H. You, T. Xue and T. Qi, J. Anal. At. Spectrom., 2023 10.1039/d2ja00391k.
Footnote |
| † Electronic supplementary information (ESI) available: Extended discussion on error propagation, statistical comparisons, multielement standard compositions, and training sets. See DOI: https://doi.org/10.1039/d3ja00013c |
| This journal is © The Royal Society of Chemistry 2023 |