
 Open Access Article
 This Open Access Article is licensed under a
 Creative Commons Attribution 3.0 Unported Licence
Investigation of a method for the correction of self-absorption by Planck function in laser induced breakdown spectroscopy
Tobias
Völker
 * and
Igor B.
Gornushkin
* and
Igor B.
Gornushkin
Bundesanstalt für Materialforschung und -prüfung (BAM), Richard-Willstätter-Straße 11, 12489 Berlin, Germany. E-mail: tobias.voelker@bam.de
First published on 2nd March 2023
Abstract
The electron density and temperature of a laser-induced plasma can be determined from the width and intensity of the spectral lines, provided that the corresponding optical transitions are optically thin. However, the lines in laser induced plasma are often self-absorbed. One of the methods of correction of this effect is based on the use of the Planck function and an iterative numerical calculation of the plasma temperature. In this study, the method is further explored and its inherent errors and limitations are evaluated. For this, synthetic spectra are used that fully correspond to the assumed conditions of a homogeneous isothermal plasma at local thermodynamic equilibrium. Based on the error analysis, the advantages and disadvantages of the method are discussed in comparison with other methods of self-absorption correction.
1 Introduction
The radiation of a laser-induced plasma contains information about the chemical composition of the ablated sample, as well as information about the intrinsic properties of the plasma, which can be determined using suitable diagnostic methods. Many of these methods are based on the analysis of the intensities and widths of spectral lines, which in most cases requires optically thin plasma conditions. However, many lines emitted by laser-induced plasma are self-absorbed, either due to the high concentration of emitting atoms or due to the long absorption path length. To use these lines for plasma diagnostics, they must be corrected for self-absorption (SA).Many methods have been proposed for correction of self-absorption in laser induced plasma. Amamou et al.1 analyzed the influence of self-absorption on the line profiles and calculated correction factors for the heights, widths, and areas of Gaussian and Lorentzian line profiles. Bulajic et al.2 presented a recursive algorithm based on the method of curves of growth, which made it possible to extend the calibration-free (CF) LIBS method to the conditions of optically thick plasma. Sherbini et al.3 developed a method to correct self-absorption of lines with a known Stark broadening parameter. The method used the ratio of the intensities of optically thin and optically thick lines. Praher et al.4 extended this method to lines with Lorentzian profiles. They calculated the theoretical dependence of the ratio of the width of an optically thin line to the width of an optically thick line as a function of the ratio of the corresponding integral intensities for different optical densities and used this dependence to obtain the desired integral intensity of the optically thin line. Gornushkin et al.5 extended this approach to more realistic Voigt line profiles. Sun et al.6 proposed a method with a specially chosen optically thin line serving as a reference line; optically thick lines were scaled with respect to this line. Moon et al.7 placed a mirror behind the plasma to double the optical path and thus determine correction factor for self-absorption.
The approach discussed in this paper was described by Lochte-Holtgreven in 1968.8 Like many other self-absorption correction methods, the method exploits two simplest solutions of the radiative transfer equation for optically thick and optically thin plasma layers. It uses an iterative calculation of the plasma temperature and black body function to find the thin line profile expressed in terms of the thick line profile. Recently, Li et al.9 applied this method to calibration-free LIBS of titanium alloys. Unfortunately, the error inherent in the method was not and could not be evaluated because they worked with experimental spectra. In this case, other errors are superimposed on this error, caused, for example, by the deviation of the real plasma from the assumptions of homogeneity and local thermodynamic equilibrium (LTE), the uncertainty in the values of the spectroscopic parameters, the inaccurately measured response function, uncontrolled instrumental noise, etc. Clearly, it is much easier to evaluate the inherent error of the method when working with synthetic spectra that are fully consistent with the assumptions on which this method is based, namely, the assumptions of a homogeneous isothermal plasma and LTE, and this is the purpose of this work.
This work has four objectives: first, to provide an explicit form of the self-absorption correction function; second, to test the method with synthetic spectra that are fully consistent with the mathematical model; third, to perform error analysis to explore the limitations of the method; and fourth, to discuss the advantages and disadvantages of the method for practical applications.
2 Self-absorption correction
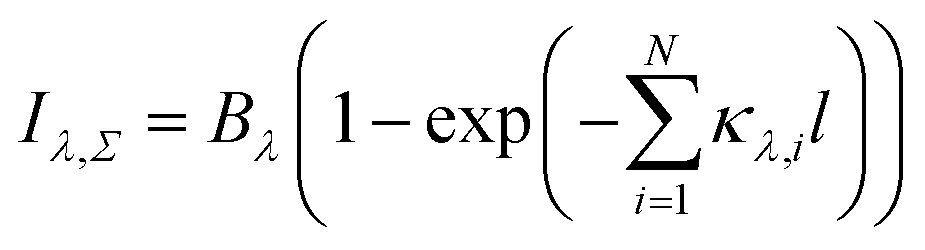
The solution of the radiative transfer equation for a homogeneous, stationary, and isothermal plasma at local thermodynamic equilibrium has the form| Iλ = Bλ(1 − exp(−κλl)) | (1) |
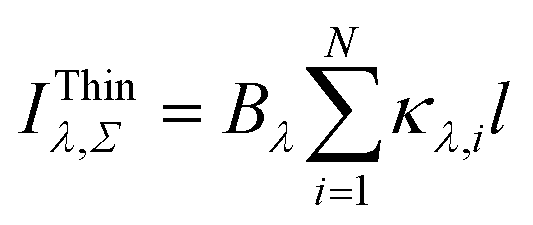
The power of the exponent in eqn (1) denotes optical depth τλ = κλl. For small optical depth τ ≪ 1 (optically thin condition), self-absorption is negligible, and eqn (1) is approximated by
| IThinλ = Bλκλl | (2) |
![[scr O, script letter O]](https://www.rsc.org/images/entities/i_char_e52e.gif) (τ2). Error of this approximation rapidly grows with increasing τ.
(τ2). Error of this approximation rapidly grows with increasing τ.
Eqn (2) is commonly used to construct the Boltzmann plot to determine the plasma temperature; such plots are also used in algorithms for calibration-free LIBS analysis.10 The optical thinness limitation imposed on eqn (2) can be relaxed using the self-absorption correction methods discussed in the introduction.
An approach to self-absorption correction via the Planck function8 is the following: the substitution of κλl from eqn (2) into (1) gives
| Iλ = Bλ(1 − exp(−IThinλ/Bλ)) | (3) |
Solving this equation for IThinλ one obtains
IThinλ = −Bλ![[thin space (1/6-em)]](https://www.rsc.org/images/entities/char_2009.gif) ln(1 − Iλ/Bλ) ln(1 − Iλ/Bλ) | (4) |
This equation shows how the radiation intensity IThinλ emitted by an optically thin plasma can be determined from the radiation intensity emitted by an optically thick plasma. Eqn (4) can also be used when two or more overlapping spectral lines are to be corrected for self-absorption. In this case, the total radiance Iλ,Σ is given by
 | (5) |
 | (6) |
Substituting Σiκλ,il from eqn (6) into (5) leads to an analog of eqn (4).
| IThinλ,Σ = −Bλln(1 − Iλ,Σ/Bλ) | (7) |
To apply the method, the value of the plasma temperature T is required to calculate the Planck function Bλ. In LIBS, it is common to determine the plasma temperature by the Boltzmann plot method; this method assumes optically thin conditions for all atomic and/or ionic transitions used. In reality, however, some or many of the lines used for the Boltzmann plot may be distorted by self-absorption.
To overcome this problem, an iterative algorithm can be used, whose flowchart is shown below. For readability, only variables are shown, while all constants needed to calculate the plasma temperature and electron density are omitted.
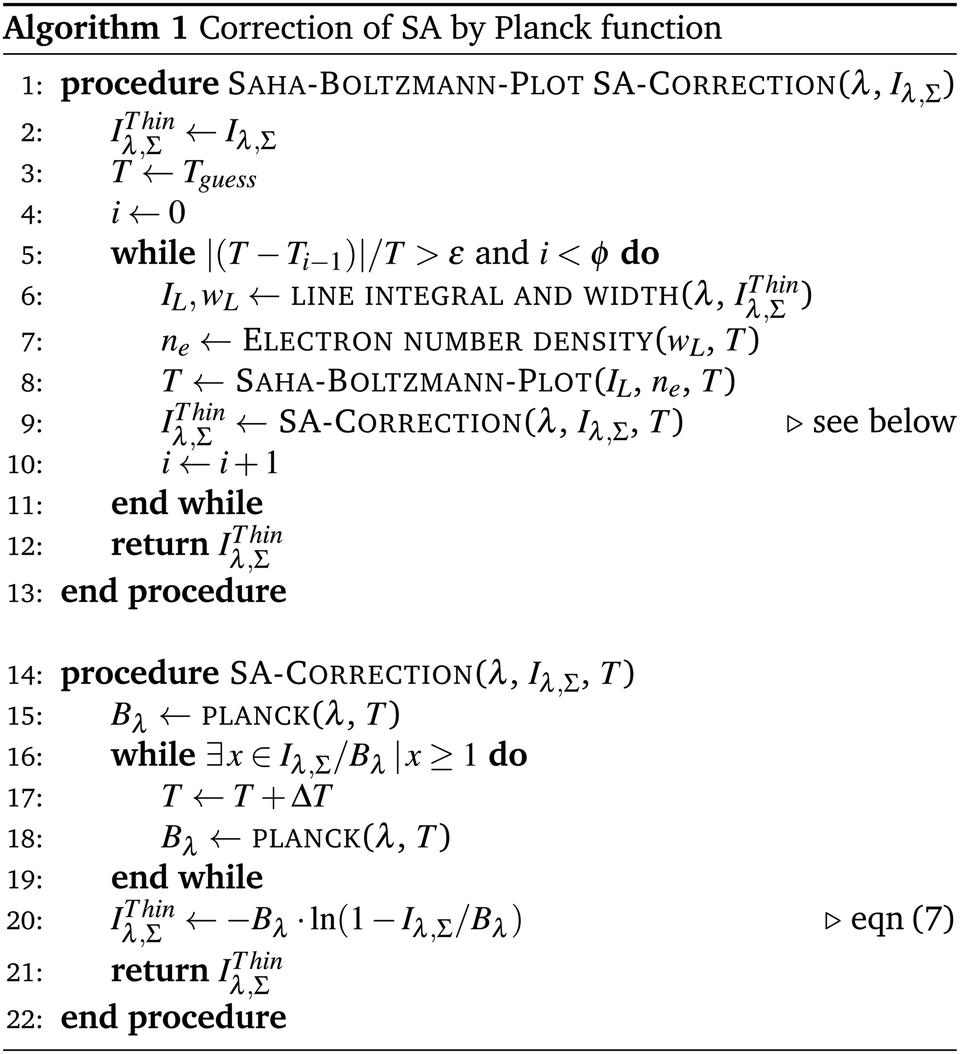
At the first step of the algorithm, the integral line intensities IL and widths wL of the selected emission lines are found, which are necessary for constructing the Boltzmann plot and calculating the electron density. Only stand-alone lines are used to minimize errors on IL and wL due to spectral interference. At the next step, starting from the assumption of the initial temperature, the electron density ne is found from the emission lines with known Stark parameters under the assumption of the Voigt line profile function. Next, the plasma temperature T is determined from the Saha–Boltzmann plot, constructed using both atomic and ionic lines. At the last step, spectrum Iλ,Σ is corrected using the found temperature T and eqn (7). The procedure is repeated until the change in T between successive iterations becomes less than the given epsilon or until the maximum allowable number of iterations is reached. The smaller the optical depth of the plasma, the faster the algorithm converges. In the case of using only the Boltzmann plot instead of the Saha–Boltzmann plot, the calculation of ne can be omitted.
In the first iterations, the initial estimates of T may be unphysical low, so that IThinλ,Σ may exceed the blackbody limit Bλ. Since this is not possible, this situation is avoided by gradually increasing T in small increments ΔT until Bλ becomes greater than IThinλ,Σ at each wavelength.
In contrast to the method presented here, Li et al.9 used a scaling “collection factor” F in eqn (1) and (2), which was assumed to be constant over the wavelength range. The value of the factor was optimized by iteratively adjusting the Boltzmann plot to achieve the best linear fit. The use of such a factor was redundant in the current version of the method, since working with synthetic spectra does not imply a light collection system.
3 Results and discussion
3.1 Efficiency of self-absorption correction
As already mentioned, the self-absorption correction method is applied to synthetic spectra that are fully consistent with the mathematical model. This excludes errors that are undoubtedly present when working with experimental spectra, caused mainly by the inadequacy of the model to real plasma, uncertainties in spectroscopic parameters, and systematic errors. The algorithm for generating synthetic spectra can be found elsewhere.11,12The spectra were generated for a hypothetical aluminum alloy (analog to AlSi10Mg(Cu)) consisting of 87.2% Al, 0.35% Cu, 0.65% Fe, 0.45% Mg, 0.55% Mn, 0.15% Ni, 0.10% Pb, 10.0% Si, 0.2% Ti and 0.35% Zn.13 The emission line data (6195 lines in total) were taken from NIST database.14 The wavelength range was 200–400 nm with the distance between the nodes of the spectral grid Δλ = 5 pm.
A plasma temperature was assumed to be 10000 K, total density 1 × 1017 cm−3, and path length 1 mm. In addition, white noise with an amplitude of 0.1% of the maximum intensity of the spectrum was super-imposed on the spectrum. The simulated spectrum is shown in Fig. 1 before (red) and after (blue) self-absorption correction was applied. Also shown is the spectrum of a blackbody (black) corresponding to a temperature of 10000 K.
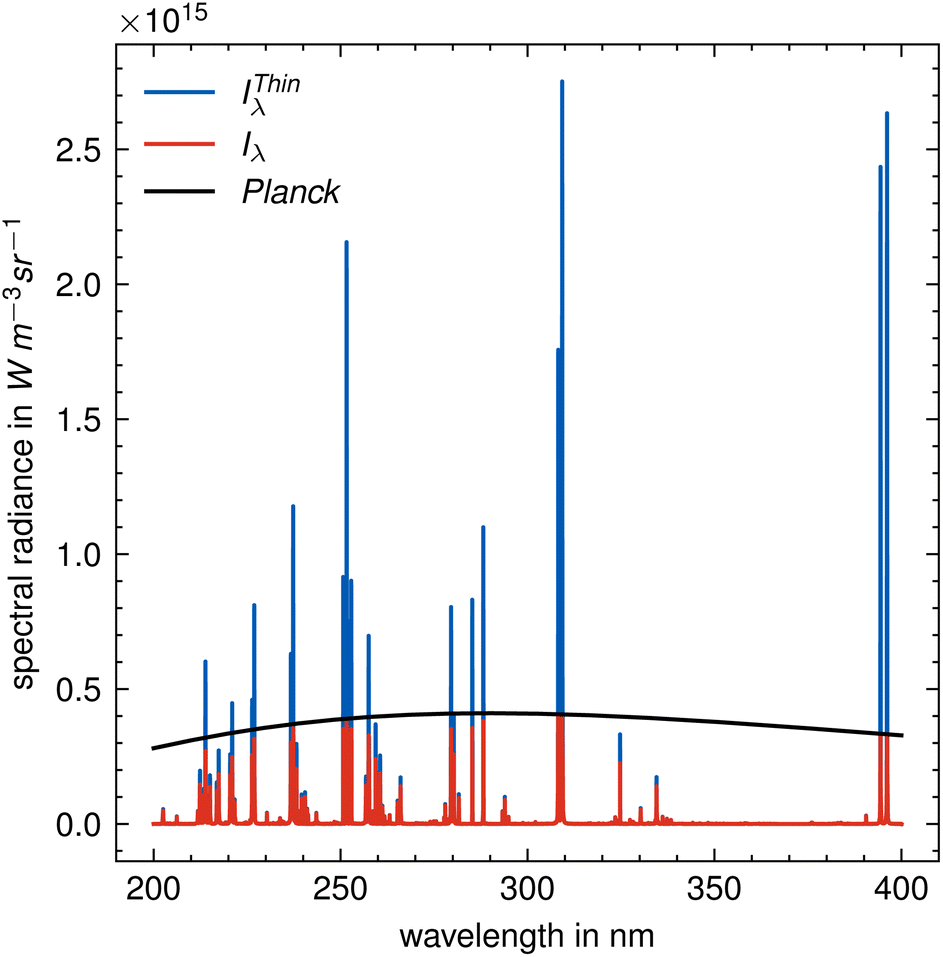 | ||
| Fig. 1 Synthetic spectrum of aluminum alloy before (red) and after (blue) correction for self-absorption. The black solid line is the Planck function at 10000 K. | ||
The emission lines selected for the Saha–Boltzmann plot are listed in Table 1. To obtain the values needed for the Saha–Boltzmann plot (line profiles and their integral intensities), each individual line was fitted with function of eqn (1). For lines with an amplitude close to the noise level, wavelet noise reduction was performed before fitting. The integral intensity of the lines was calculated by the trapezoidal method. The full width at half maximum (FWHM) was found by linear interpolation of the fitted profile over points with half the maximum line intensity.
| Ion | Wavelength in nm |
|---|---|
| a Data are from ref. 14. | |
| Al I | 211.831, 212.966, 214.556, 215.070, 216.881, 217.403, 220.466, 226.346, 226.910, 236.705, 237.312, 256.798, 265.248, 266.039, 308.215, 309.271, 394.401, 396.152 |
| Al II | 281.619 |
| Fe I | 248.814 |
| Fe II | 238.204, 238.863, 239.924, 240.489, 240.666, 241.052, 241.331, 258.588, 259.839, 260.709, 261.382, 261.762, 273.955, 275.574 |
| Mg I | 277.669, 277.827, 278.142, 278.297, 285.213 |
| Mg II | 279.553, 280.270 |
| Mn II | 259.372, 260.568, 293.305, 293.931, 294.921 |
| Si I | 230.306, 243.515, 250.690, 251.432, 251.611, 251.920, 252.411, 252.851, 288.158 |
After calculating the full-widths and areas of the spectral lines, the electron density and plasma temperature were found, and a subsequent correction for self-absorption was carried out.
Fig. 2 shows the Saha–Boltzmann plots before and after self-absorption correction. The effect of self-absorption is clearly seen in Fig. 2(a), represented by a spread of points around the Saha–Boltzmann plot. After several corrective iterations, the relative errors for temperature (found from the Saha–Boltzmann plot for Al) and electron density were 0.4% and 0.7%, respectively. The error is associated with some inaccuracy in determining the line width and integral intensity due to noise super-imposed on the spectrum. The self-absorption correction method required only four iterations; however, the number of iterations may be less or more depending on the optical thickness of the selected emission lines.
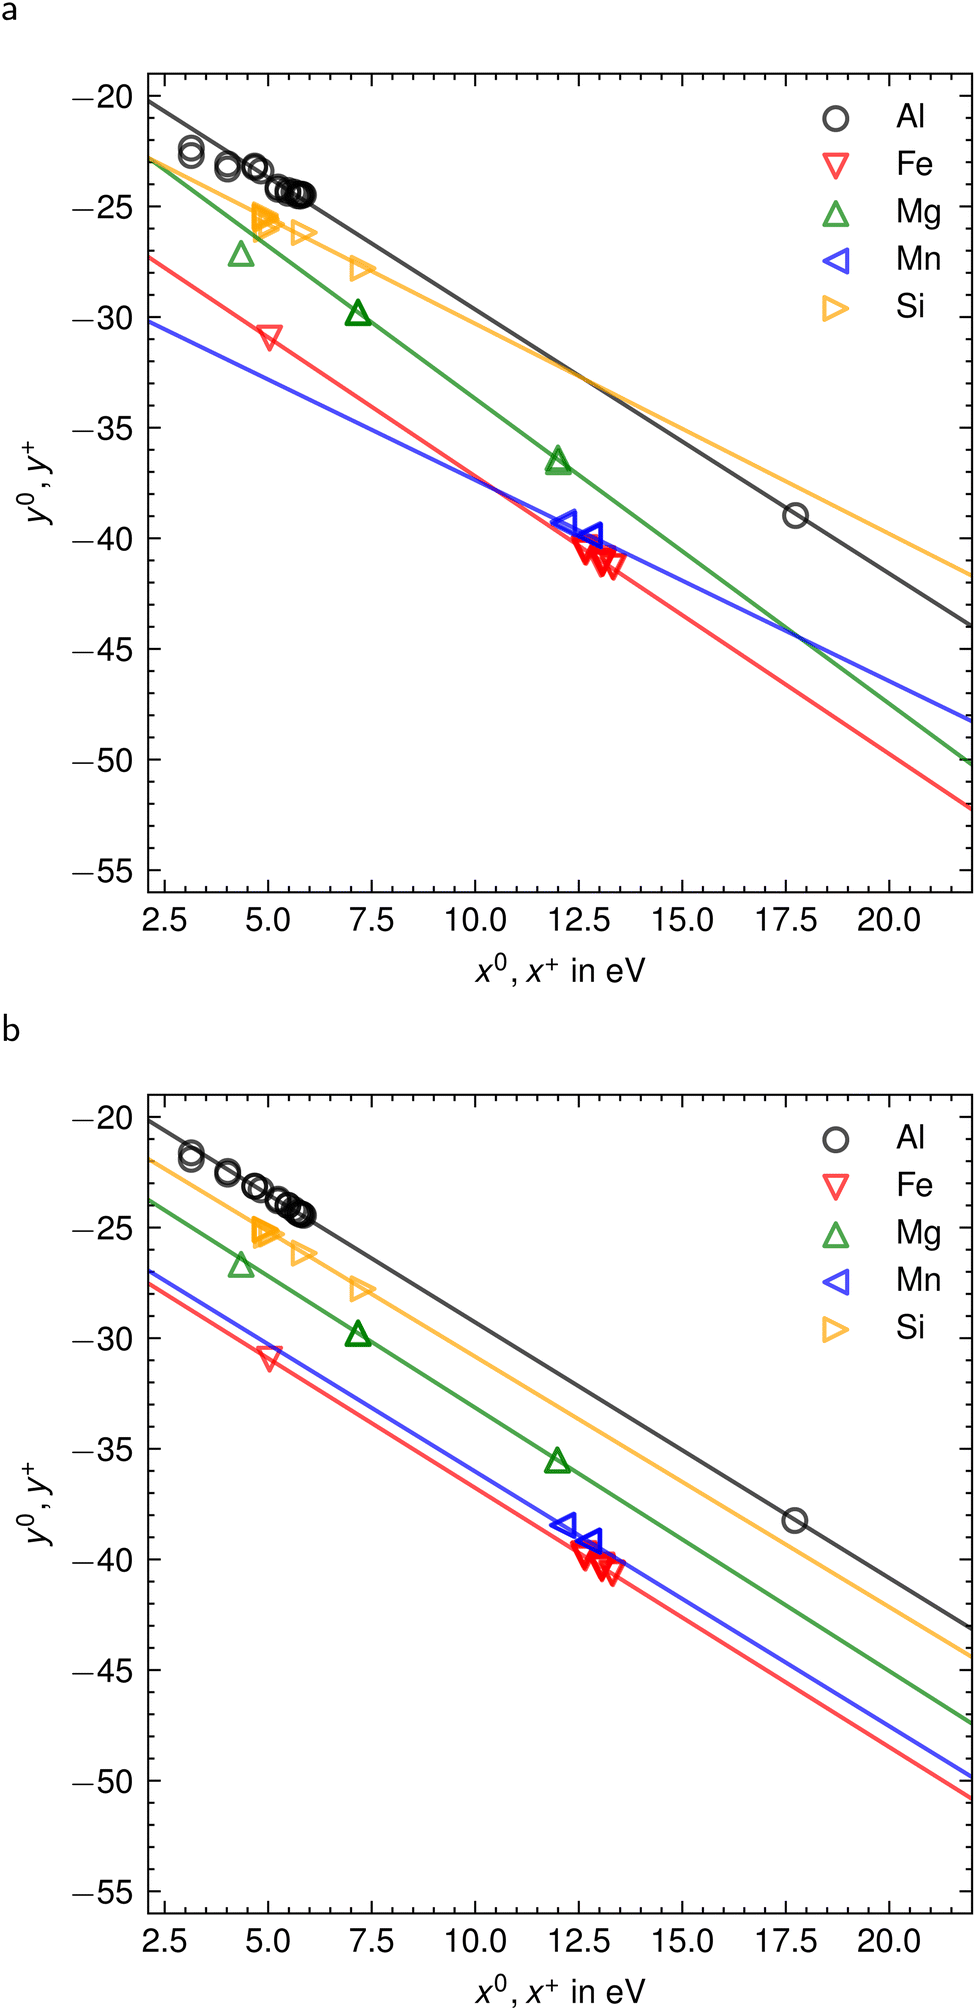 | ||
| Fig. 2 Saha–Boltzmann plots for five elements before (a) and after (b) correction for self-absorption. | ||
The corrected Saha–Boltzmann plot in Fig. 2(b) corresponds to the self-absorption corrected spectrum shown in blue in Fig. 1. Regression lines for all elements in Fig. 2(b) are almost parallel to each other, which means that each of these graphs can be used to accurately determine the plasma temperature.
This example demonstrates that the SA-correction method based on eqn (7) works well for synthetic spectra; factors affecting its accuracy are discussed in the following section.
3.2 Error analysis
The method presented in this study requires knowledge of temperature. The temperature determined experimentally from the Boltzmann plot or by another method can be compromised by inaccuracies in the parameters of the spectroscopic lines or by errors in the calculated integral line intensities. The spectra are also affected by random noise and, after processing, possible inaccuracy in the response function of the optics/detector registration system. In what follows, the errors in temperature and intensity measurements are denoted by σT and σIλ, respectively. The uncertainty σIλThin in the intensity IThinλ of a self-absorption corrected spectral line can be estimated by error propagation. For simplicity, it is assumed that the measured intensity Iλ and the estimated temperature T in terms of the calculated Planck function Bλ(T) are uncorrelated. | (8a) |
 | (8b) |
 | (8c) |
 | (8d) |
Fig. 3 shows the relative standard deviation (RSD) σIλThin/IThinλ as a function of optical depth. As an example, a spectral line with a central wavelength of 300 nm, Stark width of 0.3 nm, Doppler width of 0.03 nm, and plasma temperature of 10000 K is used. The RSD for temperature is assumed to be σT/T = 0.01, 0.1, 1, and 10%, and RSD for intensity σIλ/Iλ = 1% for all cases.
 | ||
| Fig. 3 Uncertainty of a hypothetical optical thin line after correction for self-absorption as a function of optical depth due to uncertainties in the determination of plasma temperature and measured line intensity. | ||
As expected and as seen from Fig. 3, the integral intensity (area) of the line is less error prone than the peak intensity, since the wings of the line are less susceptible to self-absorption than the center of the line, due to the smaller optical thickness in the line wings. Furthermore, it can be concluded that the temperature uncertainty is crucial for the range of optical thicknesses in which a reliable self-absorption correction is possible. The graph in Fig. 3 shows that if, for example, 5% RSD in the corrected integral line intensity at 1% RSD in T is required, then the allowable maximum optical thickness at the center of the line should not exceed about 2. If 10% RSD in the corrected integral line intensity is required, then the allowable maximum optical thickness at the center of the line is increased to about 3.
3.3 Advantages and disadvantages
The reliability and efficiency of self-absorption correction methods depend on the credibility of the mathematical models on which they are based. The general basic idea of these methods is to replace the intensity of an optically thick line with an equivalent intensity of an optically thin line emitted under hypothetical optically thin plasma conditions. Common to these methods is that they use the same eqn (1) and (2) but perform different algebraic operations on them.The effectiveness of the methods can be judged based on the following criteria: (i) the number of parameters required to implement the method, (ii) the adequacy of the underlying assumptions of the model, (iii) the ease of implementation and computation time, and (iv) the correctness of the final result. Let us consider there criteria in more detail.
(i) To correct self-absorption by the method presented in this article, only one parameter is needed – temperature. This is a big advantage over most of the methods presented in the introduction. Other methods require additional parameters such as electron density or optical path length. Some methods also require knowledge of the line profile type (e.g. Lorentz, Voigt) and its FWHM.
(ii) Regardless of which method is used, the assumptions of a homogeneous, isothermal, and stationary plasma in local thermodynamic equilibrium must hold. Since these conditions are rarely realized in a real plasma, the methods are never infallible. Similarly, the methods require deconvolution of the observed spectrum from the instrumental profile. This inverse problem is ill-posed and may be inaccurate unless special deconvolution methods such as regularization are used to obtain reasonable results.15,16 All methods require calibration of the spectrometer with a standard light source to correct the detector response function and obtain the true spectrum emitted by the plasma. Additional inaccuracies arise due to the finite spectral resolution of spectrometers and various types of noise, which introduce errors into the exact determination of linewidths and integral intensities. Software noise reduction can distort the original spectral signal; therefore, it is important to minimize the noise in the initial experimental spectrum. The presented method is particularly sensitive to noise when lines close to the blackbody limit are corrected for self-absorption. This is due to the saturating nature of the function in eqn (4) near this limit.
(iii) The software implementation is simple for all methods. However, it should be noted that the presented method has a drawback compared to methods in which some of the data necessary for self-absorption correction can be calculated in advance and tabulated (see, for example, ref. 5), while other data, such as integral line intensities and widths are calculated from the spectrum only once during the entire procedure. In contrast, in the presented method, the linewidth and integral intensities are re-measured on the corrected spectrum after each iteration; more time is required, which is spent mainly on fitting the line to the function in eqn (1) and adjusting the baseline. When short processing times are important, such as in the case of on-line LIBS without calibration, a method such as ref. 4 should be preferred.
(iv) Unlike the methods mentioned in the introduction, which allow one to correct only the integral line intensity, the presented method allows one to correct also the line profile, which may be important for plasma diagnostics. Correction of spectrally overlapping lines is also possible.
4 Conclusion
In this work, we further investigate a method for correcting line self-absorption based on the use of the Planck function and an iterative numerical calculation of the plasma temperature. Like other methods, it is based on a simple solution of the radiative transfer equation for a homogeneous, stationary, and isothermal plasma at local thermodynamic equilibrium. This method only requires knowledge of the plasma temperature and does not require knowledge of other parameters such as line shape function, linewidth, or electron density (if one prefers to use a Boltzmann plot instead of a Saha–Boltzmann plot to determine the temperature). Like many other methods, it requires deconvolution of the original spectrum from the instrumental function and calibration of the optical system with a standard light source to obtain a true spectrum emitted by the plasma.An analysis of the error revealed a functional dependence of the method error on the optical thickness. For the case under study, the method is applicable for optical thicknesses at the line centers up to τ0 = 3, if 10% RSD is acceptable for the corrected integral intensity, provided that the measurement error of the plasma temperature does not exceed 1% RSD.
As applied to the experimental spectra, further errors can be expected due to the incomplete correspondence of the experimental plasma to the mathematical model. Application of the method to calibration-free LIBS of real samples will be the subject of a subsequent publication.
Author contributions
Tobias Völker: conceptualization, formal analysis, methodology, software, writing – original draft, writing – review & editing, Igor B. Gornushkin: conceptualization, methodology, writing – review & editing. All authors have read and agreed to the published version of the manuscript.Conflicts of interest
The authors declare that they have no known competing financial interests or personal relationships that could have appeared to influence the work reported in this paper.Acknowledgements
The authors are grateful to Dr E. Niederleithinger, G. Wilsch and Dr J. Riedel for their continued support of this collaboration. The authors would like to thank the unknown reviewers for taking the time and effort to review the manuscript and provide valuable comments and suggestions.References
- H. Amamou, A. Bois, B. Ferhat, R. Redon, B. Rossetto and P. Matheron, J. Quant. Spectrosc. Radiat. Transfer, 2002, 75, 747–763 CrossRef CAS.
- D. Bulajic, M. Corsi, G. Cristoforetti, S. Legnaioli, V. Palleschi, A. Salvetti and E. Tognoni, Spectrochim. Acta, Part B, 2002, 57, 339–353 CrossRef.
- A. M. E. Sherbini, T. M. E. Sherbini, H. Hegazy, G. Cristoforetti, S. Legnaioli, V. Palleschi, L. Pardini, A. Salvetti and E. Tognoni, Spectrochim. Acta, Part B, 2005, 60, 1573–1579 CrossRef.
- B. Praher, V. Palleschi, R. Viskup, J. Heitz and J. D. Pedarnig, Spectrochim. Acta, Part B, 2010, 65, 671–679 CrossRef.
- I. B. Gornushkin, T. Völker and A. Y. Kazakov, Spectrochim. Acta, Part B, 2018, 147, 149–163 CrossRef CAS.
- L. Sun and H. Yu, Talanta, 2009, 79, 388–395 CrossRef CAS PubMed.
- H.-Y. Moon, K. K. Herrera, N. Omenetto, B. W. Smith and J. D. Winefordner, Spectrochim. Acta, Part B, 2009, 64, 702–713 CrossRef.
- W. Lochte-Holtgreven, in Plasma Diagnostics, 1968, p. 196 Search PubMed.
- T. Li, Z. Hou, Y. Fu, J. Yu, W. Gu and Z. Wang, Anal. Chim. Acta, 2019, 1058, 39–47 CrossRef CAS PubMed.
- A. Ciucci, M. Corsi, V. Palleschi, S. Rastelli, A. Salvetti and E. Tognoni, Appl. Spectrosc., 1999, 53, 960–964 CrossRef CAS.
- I. B. Gornushkin, A. Y. Kazakov, N. Omenetto, B. W. Smith and J. D. Winefordner, Spectrochim. Acta, Part B, 2004, 59, 401–418 CrossRef.
- S. M. Zaytsev, A. M. Popov and T. A. Labutin, Spectrochim. Acta, Part B, 2019, 158, 105632 CrossRef CAS.
- DIN EN 1706, Aluminium and aluminium alloys – castings – chemical composition and mechanical properties Search PubMed.
- A. Kramida, Y. Ralchenko, J. Reader and NIST ASD Team, NIST Atomic Spectra Database, version 5.9, 2022 Search PubMed.
- M. Morháč and V. Matoušek, Digit. Signal Process., 2009, 19, 372–392 CrossRef.
- N. Zorina, Nucl. Instrum. Methods Phys. Res., Sect. A, 2010, 623, 763–765 CrossRef CAS.
| This journal is © The Royal Society of Chemistry 2023 |