
High resolution energy dispersive spectrometry (HiREDS), a new tool for X-ray emission work
M. A.
Reis
 *a,
P. C.
Chaves
a,
G. R.
Fonseca
a,
M.
Bühler
b,
A.
Fleischmann
c,
M.
Herbst
c,
A. G.
Karydas
e and
K.
Phelan
d
*a,
P. C.
Chaves
a,
G. R.
Fonseca
a,
M.
Bühler
b,
A.
Fleischmann
c,
M.
Herbst
c,
A. G.
Karydas
e and
K.
Phelan
d
aC2TN, Dept. de Eng. e Ciências Nucleares, Instituto Superior Técnico, Universidade de Lisboa, CTN, EN10, km139.7, Bobadela LRS 2695-066, Portugal. E-mail: mareis@ctn.tecnico.ulisboa.pt
bLow Temperature Solutions UG, Bahnhofstrasse 21, Ismaning D-85737, Germany
cKirchhoff Institute for Physics, Heidelberg University, Im Neuenheimer Feld 227, Heidelberg 69120, Germany
dKaon GmbH, Gollierstr. 70 C1, München 80339, Germany
eInst. of Nuc. and Particle Phys., National Centre for Sci. Res., “Demokritos”, Patr. Grigoriou E’ & 27 Neapoleos St, Agia Paraskevi 15310, Greece
First published on 22nd November 2022
Abstract
When considering fine details, X-ray emission spectra present a structure that is quite complex over quite a wide energy window. Its systematic exhaustive study, until recently, has been hindered in many respects, due to limitations of the detector technology available. High Resolution Energy Dispersion Spectrometry (HiREDS), making use of X-ray microcalorimeter spectrometers (XMS) to collect wide energy window spectra with resolving powers at least above 100 and eventually reaching above 1000, allows changing this status quo. Still, new demands emerge upon raw data handling and spectral analysis. Following the pioneer installation in 2008 of the high resolution high energy PIXE (HRHE-PIXE) end station of the CTN 3MV tandetron, making use of a commercial transition edge sensor (TES) based XMS system, several developments were carried out by the “Lisbon team”, to handle the produced raw data and spectra. A dedicated Python code was developed to optimise off-line conversion of pulse raw list mode data files, and the DT2 code was written to solve specific challenges revealed in HRHE-PIXE produced spectra. After 14 years of developments HiREDS can be said to have been established as a new tool in its own. The upgrade of the HRHE-PIXE facility is underway and the X-ray advanced HiREDS Research and Metrology Laboratory (XAHRM-Lab) based on a 3rd generation XMS Heidelberg's University metallic magnetic calorimeter (MMC) is being installed with resolving powers above 500 and a useful energy range of 1 to 20 keV. In the present communication, the various software developments and an HiREDS-PIXE U M-shell spectrum case study are discussed and the new XAHRM-Lab facility capacity, which includes a PIXE induced X-ray fluorescence spectrometry (XRF) unit is presented.
1 Introduction
1.1 General scope
Particle induced X-ray emission (PIXE) analysis, originally proposed in the 1970s,1 and used ever since in many application fields, is presently one of several well established powerful X-ray emission spectrometry (XES) elemental analysis techniques, and as in the case of the similar X-ray fluorescence spectrometry (XRF), it is capable of providing contents for a wide range of elements with high sensitivity.Until recently, proton beams above 2 MeV and Si(Li) detectors accounted for most of the PIXE work, still several recent demands from applications and fundamental work have promoted the use of other proton beam energies, different ion beams, and also other detection systems, bringing forward the exploitation of new frontiers, and setting additional requirements upon PIXE.
PIXE samples may be thin, if the energy loss of incoming particles is negligible while crossing the target, but in most cases, the samples are either half-thick or thick, which means that the beam particles loose a significant fraction of their original energy before emerging from the sample (half-thick), or are completely stopped inside the sample (thick).
In any of these two last cases, matrix corrections2 are required, which even if simple when compared to other techniques (including XRF in some cases), still must be considered, as otherwise quantitative or even qualitative errors may be encountered during the data analysis processes.
The minimum requirement for matrix corrections is the integration of the X-ray yield functions along the path of the exciting radiation. These functions are controlled by parameters that depend on the exciting ion species and energy, on the target’s matrix composition, on the excited atomic species and on the atomic sub-layer vacancy origin and energy of the X-ray being measured.
In order to achieve proper matrix effect correction calculations, the following set of fundamental parameters, FP, are normally required: matrix stopping power, elemental ionisation cross-sections for the ion beam particles at impact energy (all energies between the beam energy and the exit energy or zero), matrix mass attenuation coefficients for each of the X-rays being quantified, and various de-excitation parameters, mainly, transition energies, fluorescence coefficients, branching ratios, transition rates and Coster–Kröning coefficients.
PIXE data analysis codes usually base calculations and fitting models on database values for these, which are used to establish matrix effect corrected ratios between different emission lines of the same element and to determine the expected yields per mass fraction of a given element present in the sample.
Setting the databases requires that these parameters are determined either theoretically or experimentally. Still, even for theoretical approaches, experimental data are required, at least to validate the theoretical models for well controlled conditions, so that their applicability is viewed as correct under conditions for which it is much too difficult or even impossible to obtain pure experimental reference data.
This fact brings us to a major link between HiREDS and fundamental parameter determination and use, namely the dependency of reference data characteristics and the level of their detail required by any given experiment on the characteristics of the experimental facilities used to determine those fundamental parameters.
The frequent need to merge experimental and theoretical reference data, to reach a good final result on application data analysis, makes the situation frequently even more complex that it might seem expectable.
The use of different types of detectors to obtain experimental reference data, may further lead to disparate results, some of which may even raise problems when merging experimental and theoretical reference data.
A critical example of such types of situations takes place when contributions from different physical origins (say, transitions to different sub-shells) add to a single experimental result due to the low resolution of the detectors used, a situation that is particularly frequent when X-ray data below 5 keV are at stake, and in particular when dealing with L-shell and/or M-shell transitions.
Since the 1970s and until recently, essentially two types of spectrometers, having two reasonably different levels of resolution, were available for PIXE work, namely, wavelength dispersive spectrometers, WDS, displaying resolution levels close to 10 eV or even much less (e.g.: the Ljubljana3 and the SLAC4 systems being able to reach resolution levels of 0.55 ± 0.05 eV and 0.32 eV, respectively), and semiconductor inverted diode energy dispersive spectrometers (EDS), providing resolution levels above 100 eV, which have so far been the most commonly used ones, either in PIXE or XRF, due to their high versatility.
The emergence of commercial X-ray microcalorimeter spectrometers, XMS,5 at the turn of the century, raised a whole new context ultimately leading to high resolution energy dispersive spectrometry, or HiREDS for short.
In fact, while being energy dispersive systems effective for a broad range of energies, first generation XMS systems already presented resolving powers starting just below 100 at low X-ray energies (18 eV @ SiKα), and improving to more than 400 for higher energies (24 eV @ PbLα),6,7 while second generation systems, such as the one installed at Jyväskylä University reach resolving powers above 1000, 3 eV @ FeKα.8
In a previous work9 a review was presented on the preliminary HiREDS results achieved using the pioneer HRHE-PIXE system installed in 2008 at Instituto Tecnológico e Nuclear, ITN, which is nowadays the Campus Tecnológico e Nuclear, CTN, of Lisbon University.
In the present work, details are presented on the developments carried out to be able to properly exploit the HRHE-PIXE facility and establish HiREDS10 as a new approach on its own in the frame of X-ray emission spectrometry, XES. Problems and solutions starting at the transition edge sensor (TES) signal handling and HiREDS spectra generation, up to details on the demands imposed on software for spectral treatment, are discussed, and a U M-shell spectrum analysis is presented as an example case study showing the potential of HiREDS in the frame of fundamental parameter research work. Finally, aiming to present the near future of HiREDS at CTN, a short description of the XAHRM-Lab facility as the upgrade of the HRHE-PIXE system being carried out in the frame of the AHEAD2020 project,11 is made.
1.2 FP, high resolution and advancement demands
Where matrix effect corrections for XES are concerned, the subject is presently subject to fast developments, to the point of a Fundamental Parameters Initiative having been launched a few years ago by the European X-ray Spectrometry Association (EXSA).12With respect to stopping power data,13 a lot of information already exists in established literature and the issue will not be addressed in this work.
On the other side, the literature on X-ray fundamental parameters is still sometimes scarce, and sometimes complex and/or difficult to use, and we will show based on the example case study presented, that HiREDS is an important new tool for the improvement of existing databases.
Mass attenuation coefficients, being a very important set of fundamental parameters for proper matrix effect corrections, have seen important developments to become available in literature recently.14,15 In this case, experimental data are essentially independent of the type of detector used, even though small indirect effects may be present due to uncertainties on absorption edge and transition energy values.
Concerning other X-ray linked fundamental parameters, namely ionization cross-sections and de-excitation parameters (fluorescence coefficients, branching ratios, transition rates and Coster–Kröning coefficients), the precision associated with data determination or with its use, is highly dependent on the type of detector used in the experimental work. In fact, as already mentioned above, using different detectors frequently leads to the use of different X-ray transition groupings due to the different energy resolutions, with major consequences upon the sets of fundamental parameter data generated.
A typical extreme case of this is the need to group X-ray line contributions from different sub-shell origins (e.g.: Lβ group) as a single experimental variable, when dealing with standard Si(Li) EDS detector data, something that is clearly far from being the best option to determine (or use) fundamental parameters with good precision.
Still, this is not a rare action and atomic transitions pertaining to different atomic structure levels are frequently assumed in practice as a single experimental line when standard energy resolution Si(Li) detector (or equivalent) systems are used. Erroneous or at least less good experimental values for the atomic parameters, are thus determined when this option is used.
Fundamental and applied high resolution PIXE (HR-PIXE) studies even if in much less numbers than those using Si(Li) detectors, has been performed using standard high resolution WDS systems. Petukhov, Terasawa and Török compiled reviews on the spread of the use of these type of spectrometers on HR-PIXE work until 1996.16–18 On counting at that date there were a total of 22 laboratories using it for: (a) elemental analysis (24 references); (b) chemical state analysis (44 references) and (c) basic research (46 references). WDS systems still keep a standard rate of publication in these same areas and the more recent studies by Kavčič,19–21 Kertész,22 Hasegawa,23 Maeda,24 Tada,25,26 Woo27 and Cureatz,28 to point out just a very few, are good examples.
In spite of a stable rate of use, WDS based HR-PIXE, was never able to grow in the number of groups or in the number of publications. In fact, although capable of providing much more information on each spectrum, overall, much more work is required to extract all data from the spectra and, apart from other issues, specific software was never developed to improve throughput capacity.
X-ray microcalorimeter spectrometer (XMS) based HR-PIXE, or HiREDS-PIXE, is a link between the EDS and WDS worlds, and while its demands regarding software throughput emerge from the EDS nature, the requirements regarding detail, precision and versatility emerge from its high resolution nature. Specific software to exploit this dual nature is thus required.
Furthermore, the demands do not start at the spectrum histogram level because the spectrum production itself is demanding and hardware digital signal processors are yet not available for XMS systems, while spectra are prone to electronic problems as in any other EDS based system.
Once a spectrum histogram has been properly produced, it also turns out that XMS systems greatly expand the amount of information extractable from each spectrum since details at the level of WDS systems now become available in an energy window identical to those of standard Si(Li) systems. The amount of information available is therefore impossible to deal with using general peak fitting software, as frequently made in WDS work.
With respect to software developments made in these contexts, this work presents details of the Python based computational digital signal processor created for off-line generation of spectra from raw pulses, and of specific capacities of the DT2 code specially focused on handling of HiREDS spectra.
2 Case study materials and methods
In the present work as an illustrative case study an HiREDS-PIXE spectrum obtained from a thick sample of UO2 irradiated using the CTN 3.0 MV Tandetron accelerator HRHE-PIXE setup7 is presented. A proton beam of 1.0 MeV collimated to provide a nearly circular spot, 3 mm in diameter, on the target, was used to irradiate the sample at an incident angle of 68°.The HiREDS-PIXE spectrum was obtained using a Polaris TES XMS produced by Vericold Technologies GmbH, placed at 90° to the beam direction and having a 5 × 2502 μm3 gold absorber, which after proper collimation provides a solid angle of 0.55 ms rad. This detector was installed in 2008, at the former ITN (Instituto Tecnológico e Nuclear) in facilities presently included in the University of Lisbon CTN (Campus Tecnológico e Nuclear) of the Instituto Superior Técnico. The upgrade of this system in the frame of the AHEAD2020 (ref. 11) project is planned to be operational before the end of 2022.
Concerning the TES conditions, the Polaris XMS temperature of operation was set to 120 mK. The detector count rate was limited to 50 Hz, above which the spectra became distorted. The present spectrum acquisition time was 1 h 20 min at a count rate between 30 and 40 counts per second. During irradiation no X-ray filter was used in front of the detector and therefore, the X-ray path structure, namely an 0.8 μg cm−2 Mylar® chamber window foil and 5 mm air separating the detector window from the vacuum chamber along the X-ray path, was identical to the one present in the CTN standard PIXE system where a Si(Li) detector was set at 70° to the beam direction.29 More details about the experimental system can be found in ref. 7.
A spectrum of the same target was also obtained at the standard PIXE line, at the end station of the CTN 2MV Van de Graaff accelerator. In this case, a 0.7 mm collimator was used in front of a Gresham Si(Li) detector. As in the case of the XMS-PIXE spectrum, no X-ray filter was used so, once again, only a 0.8 μg cm−2 Mylar® chamber window foil and 5 mm air separating the detector window from the vacuum chamber along the X-ray path are present as X-ray absorbing foils. A beam current of 10 nA was used. Details about this experimental setup can be found in ref. 29.
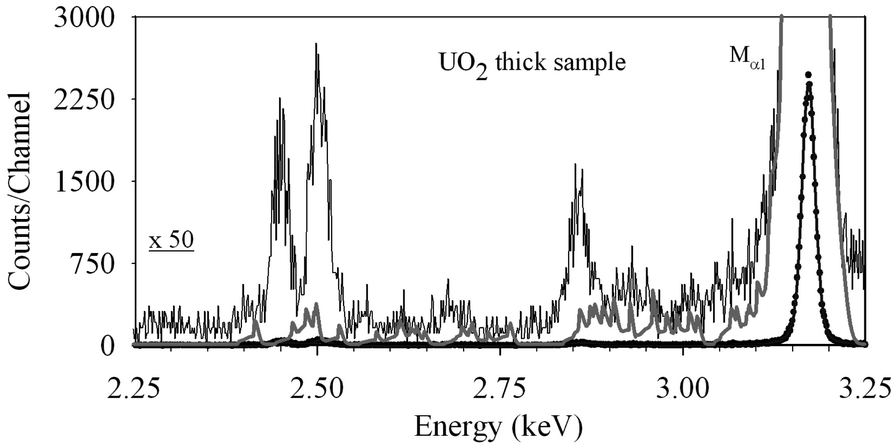
A comparison of the two spectra is presented in Fig. 1, and the difference in informational content between one spectrum and the other are made clear.
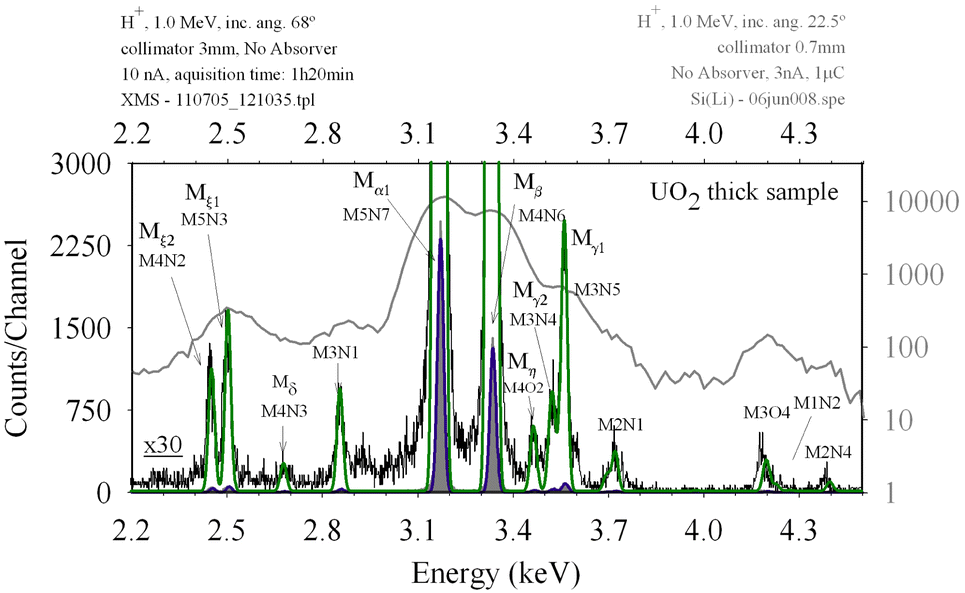 | ||
| Fig. 1 The Si(Li) UO2 M spectrum is presented in grey in the log scale indicated on the right vertical axis. On the left vertical axis, the scale of the shaded grey and blue fit of the HiREDS-PIXE spectrum of the same sample is presented. The green fit to the noisy data is a vertical expansion by a factor of 30 of the XMS data. Centroid locations of the peaks are reproduced in the Si(Li) spectrum but various details are not. The energy calibration was made considering energies reported by Cauchois30 for Mξ1, Mα1 and Mβ. | ||
The left vertical scale line is related to the XMS spectrum presented as a grey area and the right vertical scale corresponds to the Si(Li) spectrum presented as a grey line. Details of the XMS spectrum are presented as a thin black line, which corresponds to a (×30) vertical zoom relative to the left scale.
3 Software DSP and spectral linearity
3.1 TES operation and list mode pulse data
TES based spectrometers are expected to have a small non-linear response in energy, and still, given the small level of non-linearity, the energy window where a linear response may be assumed is not fully well established. One of the problems is that the non-linearity response nature of the spectrometer depends on the parameters used to bias the system prior to a given spectrum collection, which, among other details, controls the shape of the TES superconductor to a normal transition curve around the temperature selected to carry out the detector operation.TES XMS spectra are normally, as is the case of the Polaris XMS, stored as lists of pulse raw data, and not directly as multichannel analyser (MCA) histograms. This allows offline handling and optimisation of the pulse conversion process.31
At CTN, pulse processing and spectrum linearity issues are addressed in two steps.
The first step is related to the operational conditions of the TES. In this respect, prior to spectrum collection, the TES was adjusted to the lowest temperature at which it provided good response, in order to use the largest possible increase in temperature, near linear conditions.
3.2 The P2HA code
The second step pertains to offline processing.Stored pulse binary raw data lists are processed offline using a software Digital Signal Processor written by one of us (M. A. Reis) in Python and named P2HA (short for pulse to height analysis).
The P2HA “software DSP” code reads the binary raw data pulse list and, for each pulse, starts by removing spikes (statistical great outliers present in the pulse 1024 value digital record) and replacing these with the local expected value, and amplifies the pulse data from the 16 bit (65![[thin space (1/6-em)]](https://www.rsc.org/images/entities/char_2009.gif) 536) sampling hardware ADC precision to a 22 bit (4194304) software ADC precision.
536) sampling hardware ADC precision to a 22 bit (4194304) software ADC precision.
After this, it defines the pulse base as the most frequent value (the statistical mode) and the Zero as the “statistical center of mass” (the frequency weighted average of values) of an ad hoc fraction of all values, taken as the set of the most frequent values. Both the base and the Zero are calculated for each pulse, from the list of 1024 values of the amplified pulse digital record. The fraction of the most frequent values used to determine the Zero, is an input parameter for the P2HA code, and therefore optimization is possible. In the case study presented, this fraction was set to be 45% of the most frequent values.
After this, the extra noise is removed by using a digital integration and differentiation process. As shown in Fig. 2, a data pulse prior and after amplification and noise reduction is shown. The much smoother nature of the treated signal is well illustrated in the insets.
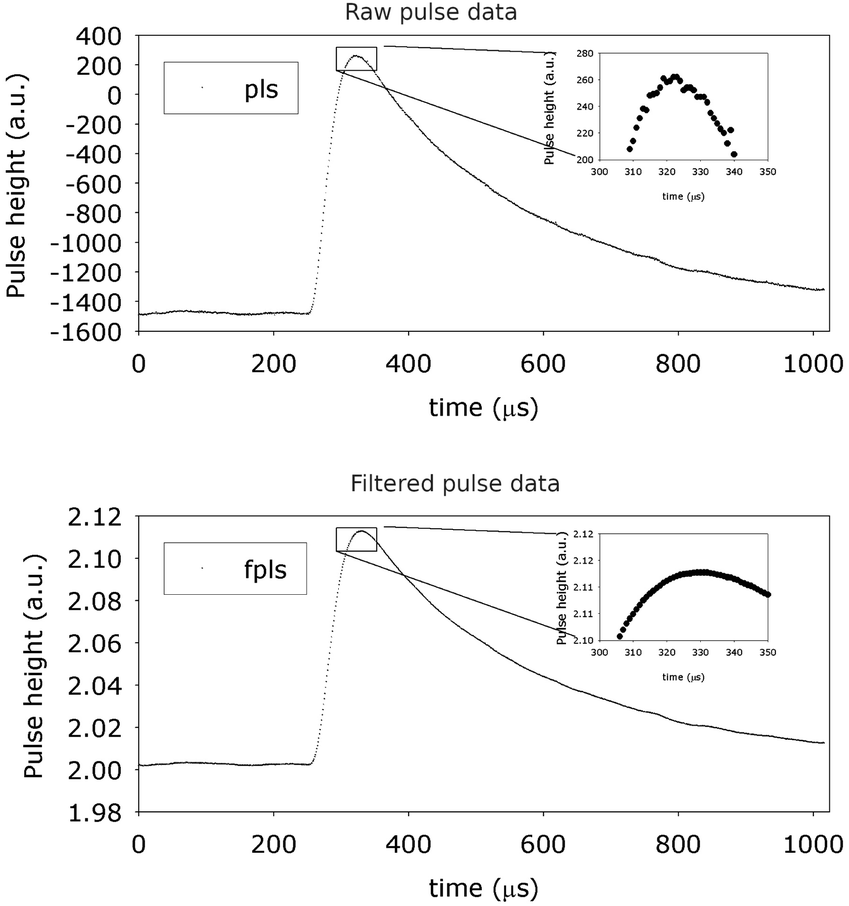 | ||
| Fig. 2 Raw data pulse from the pulse collection corresponding to the UO2 M spectrum in discussion (pls, top), and noise reduced and amplified data pulse (filtered) generated during the offline process (fpls, bottom). In the details of the insets, the influence of the noise in the determination of the peak height becomes clear. The vertical scale is presented in arbitrary units since at this moment although the pulse height is proportional to the energy of the peak, the conversion is not yet available. | ||
After this, the increase time, the maximum value, the base floating and any eventual base tilting are determined. The increase time is set as 1.5 × (maximum instant − maximum pulse derivative instant). The base floating is set as the absolute difference between the pulse base and Zero values. The base tilt is determined from the difference between the average value of the 10 values that precede the start of the increasing signal, and the average of the first 10 values of the pulse list. If a base tilting is found, a correction to the pulse height value determined as the difference between the maximum value and the Zero value, is made.
The precision of the measurement is improved by using as maximum value the weighted average of a small number closest to maximum measurements instead of the single maximum. The number of these values to be used is also a parameter of the P2HA code. In the present case study, the value used for this was 3.
The pulse increase time, the number of repeated measured maxima values and the background fluctuation are used to select and/or reject pulses. Signals having a too long increase time (leading edge pile-up), too short increase time (not X-ray signals), too many repetitions of the maxima value (unresolvable trailing edge pile up), or a too large background fluctuation, are rejected. The values defining in which cases the pulses should be rejected are initial parameters of the P2HA code.
After all these steps are carried out, the set of values for these parameters for each pulse are stored in a comma separated ASCII coded list file (“*.csv” easy to open by using any text editor or spreadsheet application). Prior to this, the 22 bits (4194304) software ADC values are also converted to a more reduced precision (usually 15 bit (32768)) spectrum values using a software amplification gain parameter, in order to be able to produce in the end a compacted human readable spectrum identical to the one presented in Fig. 1.
This done, the list produced is further optimized in a case by case approach using two parameters that correct for the lack of linearity of the detector response. One of these corrects for the differences in gain at the base and at the top of the signal, and the other corrects for differences of general gain that acts on pulses having different base values.
After these optimizations, nearly linear calibrations can be obtained in quite wide energy windows. As shown in ref. 32 using an Y2O3 spectrum, the visual detachment from linearity is only visible for windows larger than 10 keV, and in the range between 5 keV and 11 keV in the Y L spectrum a linear calibration using Bearden's database (see Fig. 3 in ref. 32) provides an R2 = 0.99997.
3.3 Linearity, comparing Si(Li) and HiREDS U M-shell spectra
The fitting of the UO2 sample HiREDS spectrum presented in Fig. 1, was performed using the DT2 code (first introduced in ref. 33 and discussed below in this work), and a linear calibration, Gaussian shaped peaks and X-ray transition energy values reported by Cauchois.30It can be seen that while in the HiREDS-PIXE spectrum most of the lines are clearly separated, this is not at all the case in the Si(Li) spectrum. On the vertically zoomed spectrum, low intensity lines and structures are visible, some of which are not identifiable in the Si(Li) spectrum and in a few cases no correspondence to energy values of diagram transitions is found.
Concerning the channel vs. energy calibration, DT2 is capable of carrying out linear calibration fitting based on two parameters read from the input files, namely, the channels per keV slope and a non-integer channel position of the centroid of a given line, usually taken as the most intense line.
In DT2, these parameters can both be fitted, which was the option used in the Fig. 1 case. As most intense line the Mα1 line was considered, and for diagram line transitions energies only the Cauchois30 database was used. DT2 was thus able to determine a reasonably good linear calibration that allows to establish a one-to-one relation between Gaussian peak centroids and the lists of energies tabulated by Cauchois, an energy misfit being determined only for M3O4 and M2N4 transitions.
It is important to note at this point that, as is the case of any EDS spectra, whatever the precision to which the position of the various peaks is estimated within the peak height histogram, absolute values for the transition energies cannot be determined, because one can always question the linearity of the channel vs. energy relation. Still, it can be stated from the results in Fig. 1 that transition energy values published in the Cauchois database30 are reasonably consistent with a linear response of the Polaris TES spectra generated offline using the P2HA code, in the energy range presented, and assuming that the energy value for the U Mα1 transition is 3.1716 keV.30 All other transition energy values in the database, apart from M3O4 and M2N4 are thus confirmed as consistent with the UO2 spectrum. In the Fig. 1 case, the software ADC gain used was 1.4 eV per channel. Since it can be seen that peaks are fit with a precision of 1 channel even below this value, it can be concluded that, apart from the transition energy data values for the transitions M3O4 and M2N4, all other transitions have, in the Cauchois database, a transition energy value compatible with the linearity response of the optimized Polaris spectrum, with a precision better than 1.4 eV.
4 Fitting HiREDS-PIXE spectra
4.1 The DT2 code history and generalities
Differences between the Si(Li) and HiREDS spectra presented in Fig. 1 lead us to expect that fitting an HiREDS spectrum may be significantly more problematic than fitting most of the Si(Li) spectra.This was promptly understood both from previous work on the line ratio dependence on ion beam energy34 as well as from the first results obtained with the HRHE-PIXE system,9,35,36 and, in fact, the first steps towards the development of the DT2 code started even before the installation of the HRHE-PIXE system.37,38
The DT2 is a Fortran 2003 evolution of the Pascal/Delphi based 1992 DATTPIXE package (Data Analysis of Thick Target PIXE),39 developed as a major tool for computer added handling of PIXE spectra of thick, intermediate or thin targets but without spectral fitting capabilities.
Prior to DT2, DATTPIXE was subjected to an intermediate evolution leading to the development of the C open source routine LibCPIXE,40 capable of dealing with multilayer targets, but still unable to fit spectra. A proprietary version of LibCPIXE which includes a dedicated interface was developed to couple it to the Fortran based Datafurnace code41 for holistic RBS (Rutherford backscattering spectrometry) and PIXE analysis of complex samples,42 presently referred to as Total-IBA.43
The evolution to DT2 introduced the fitting routine, but to impose no a priori knowledge of branching ratios required the use of a Monte Carlo approach to fitting. The initial versions of DT2 included the N. P. Barradas' core code IBIXFIT,38 the very first use of the simulated annealing44 algorithm to fit PIXE spectra.37
When the DT2 code was required to answer to more and more demanding situations, various limitations, in particular a heavy slowdown on execution was observed when constraints were imposed on a large number of relative line intensity ratios.45 This bottleneck lead to the replacement of the calculation core in DT2 (ref. 33) with the introduction of gravitational fitting46 as a replacement for simulated annealing, but also to other important developments, such as the introduction of fully revised and new polynomial calculations of ionization cross-sections47,48 and a detailed description of improved semiconductor detector response function tails capable of handling both Si(Li) as well as CdTe detectors.33,49
DT2 version DT2F_0v9_11 became ready in 2014 and led to a few publications dealing with issues that were not too complex, but important in the context of fundamental parameter work. In particular the study of Kα2/Kα1 ratios of Tm and Yb oxides,50 showing RYIED oscillations51,52 and the analysis of Yb multi-ionization transitions,53 showing different ionization cross-sections for heavy ion beams having the same energy but different charge states. Beyond resolving the bottleneck for the computation time of the simulated annealing algorithm when combining free line ratios with non-free line ratio components, other problems also had to be overcome including the oversize of some data structures and instability conditions in some cases.
The oversize of data structure problem emerged from the double requirement of being able to deal with multilayer targets, while preserving the possibility to select free or fixed line ratio mode for each and every transition line,33 and the capacity to introduce second order correction effects, such as secondary fluorescence processes, including secondary fluorescence induced by electrons in thin targets and/or nano or microparticles.54
The issue was solved by creating a double matrix structure such that a sample X-ray emitter matrix is overlapping the composition, stopping powers and X-ray absorber matrix. After this was achieved, DT2 became capable of fitting up to 1000 independent lines, grouped into 50 different X-ray groups defined by the user as needed and according to the requests of the problem. Usually, these groups are made to correspond to sub-shell grouping, but these can also be subdivided since each group can only hold up to 20 lines. The X-ray groups are associated with chemical elements and up to 50 different elements can be present in the sample, each element being allowed to gather up to 20 different groups of X-ray lines. All of it may be present in a multi-layer structure that can hold up to 50 different layers each with up to 25 different chemical elements, that may be repeated or not in different layers.
DT2 is prepared to calculate emission of K, L and M lines. Fluorescence, Coster–Krönig as well as mass attenuation coefficient data are provided in ASCII standard comma separated text database files. The initial values for each X-ray group total transition rate and individual lines transition energy, transition rate and natural width, are provided as specific input for each simulation or spectral fitting case. The results obtained using different databases can thus be compared in an easy way by running the same model after replacement of one or more ASCII databases.
Within each group, relative intensities between lines are calculated and can be used for simulation purposes or as initial guess for fitting sequences. By default, these relative intensities are disregarded during fitting, but the relative intensity of two lines at emission, can be limited to a specified maximum, minimum or variability from the database stated relative intensities, or even be fixed to the database stated relative intensities.
The stability issue was nevertheless a bit more complex to solve. It was necessary to dig deep into the calculation core of the gravitational fitting algorithm46 and solve intrinsic mathematical problems which became complex on passing from a small number of data points and fitting parameters dealt with in its first use,46 to a large number of data points and a large number of independent fitting parameters. The result of this actions lead to the establishing of a multi-dimensional merit function partial order that allows for the robust solution of the problem. Taking into account the complexity of the mathematical solution, the subject is being published elsewhere55 and apart from a small general description of the logic behind the algorithm, presented at the end of this section, no additional discussion of this is made here.
During the revision that made DT2 fully operational again, quadratic and 3rd order polynomial energy scale calibration fits were also introduced. In Fig. 3, a fit made using a 3rd order polynomial calibration and DT2 version DT2F_0v9_75 is presented. The misfit of M3O4 and M2N4 lines is no longer present and the escape peaks due to the loss of Au-M lines, seen on the left of the spectrum, are also well fitted. Details regarding these results are presented and discussed in the following sections.
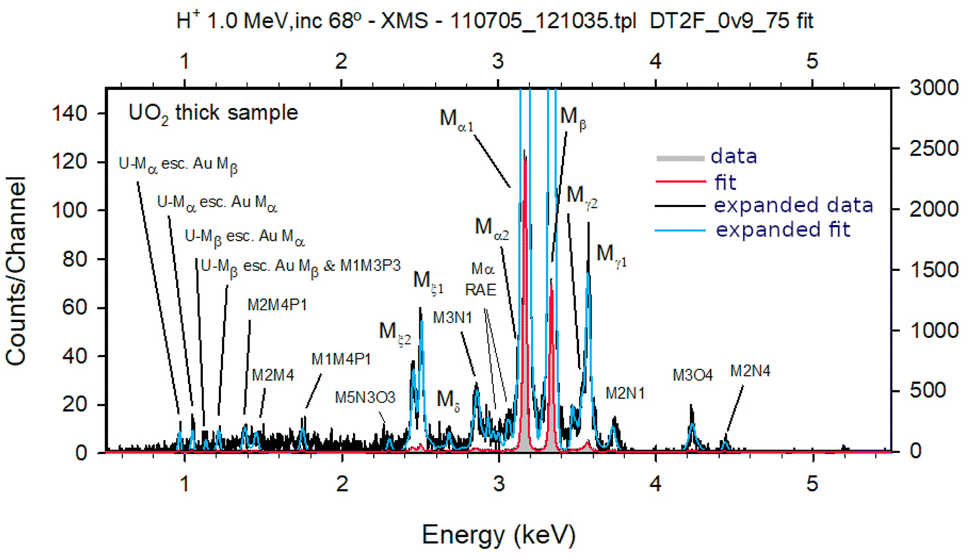 | ||
| Fig. 3 UO2 M spectrum. Based on the Cauchois transition energies database, a fit was made using version DT2F_0v9_75 considering exact Voigt line shapes and 3rd order polynomial calibration for the channel vs. energy relation. The left vertical scale line is related to the black line data and red fit, while the right hand side vertical scale corresponds to the grey area data and blue fit. | ||
4.2 The DT2 code and recent developments
As shown in Fig. 1 a linear energy calibration was used to fit the XMS M spectrum of UO2, emitted when irradiated by an 1.0 MeV H+ beam, considering Gaussian peaks and the X-ray transition energy values reported by Cauchois.30Using the DT2 new version DT2F_0v9_75 a fit to the HiREDS-PIXE spectrum was performed using pure Voigt function line shapes and a 3rd order polynomial for the calibration for the channel vs. energy relation, based on Cauchois database values. The results presented in Fig. 3, show that quite a good channel vs. energy relation could be determined in the energy region presented. At this point it is important to realise that the full width at half maximum, FWHM, of the peaks in Fig. 3 is of the order of or even less than 1% of the line energy, and therefore, for the precision between the location of the fitted peak maximum and the location of the experimental peak maximum to be the same requires that the shift between one and the other is less than 1‰.
This is achieved by not using a straightforward 3rd order function, but a perturbation like function, where Einf is the assumed energy of the calibration curve inflection point, whose channel is also adjusted:
| Ch(E) = a0 + a1E + a2(E − Einf)3 | (1) |
The same approximation is used for quadratic calibrations, in which case the inflection point energy is replaced by the energy of the maximum (only negative quadratic curvatures are accepted), but since this point is usually outside the spectrum region, its value is not so visual.
4.2.1 Line shape
From Fig. 1 it can be seen that the major transition energies are reproduced at the right energy, but the details on tails and other structures are not reproduced. One of the problems that is evident from looking in detail to the fit of the Mα1 line is that the fit does not reach the top of the peak and there are high and low energy tails that are not fitted at all (visible in the green fit in Fig. 1).This shows that the Gaussian description of XMS peaks is not a good model, as expected, and that the line shape is a very important issue in the HiREDS-PIXE spectrum fit, being much more important than what is usually considered in standard PIXE using Si(Li) detectors.
Comparing the spectrum lines FWHM and their natural line width, Γ, it is seen that they are close to the same order of magnitude (e.g.: 3 eV for the Mα1 line width, and 15.7 eV for the total FWHM). A proper model thus requires using an exact Voigt function shape and not simply a pseudo-Voigt one obtained by the simple product of a Gaussian and a Lorentzian function.
In DT2 version DT2F_0v9_75, this is done by numerical integration of the convolution of the natural Lorentzian function with the detector’s Gaussian response function, and as pointed out by some authors (e.g.: Amamou et al.56), this calculation is not always simple. In DT2, two possibilities have been set.
Taking, the Lorentzian, L(E), and Gaussian, G(x), functions as:
 | (2) |
 | (3) |
 | (4) |
Which of the equations is used as the starting point for the exact calculation depends on the ratio between the Lorentzian width and the Gaussian width.
When the ratio Γ/σg is greater than an adjustable value optimized to 2.70, eqn (3) is integrated as an exact improper integral. After changing the variable of integration to  , it becomes:
 | (5) |
When the ratio Γ/σg is smaller, this approach leads to numerical integration problems and a different calculation method is required. Eqn (4) is then used, and an approximation is made which assumes that the integrand function is null for values of the integration variable greater than six times the largest of the widths.
Taking σM = max(Γ, σg), eqn (4) can be assumed to be essentially equal to:
 | (6) |
 | (7) |
In this case, two different methods are implemented and can be selected, namely the Lobatto method with 9 points or the Gaussian method with 21 points.57
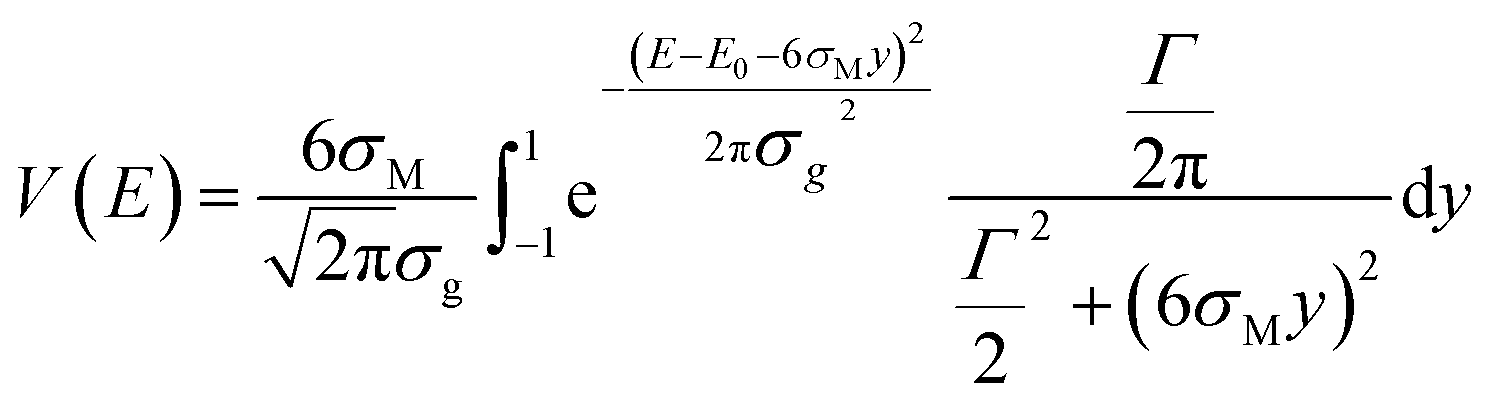
In Fig. 4 the shape of the line corresponding to simulations of transition Mα1 is used to show the differences in the line shape, obtained using each of these methods. It can be seen that the first method (Hermite integration), in this case, is totally inappropriate. As for the methods that make use of an approximation with finite limits, the Gaussian method preserves the Gaussian nature of the line shape more and seems to be less appropriate than the Lobatto method. The fitting presented in Fig. 3 was obtained using the Lobatto method with 9 points, which is faster (less calculations per line) and shows better results than the Gaussian method with 21 points.
 | ||
| Fig. 4 Details on the simulation of Mα1 assuming different methods for calculation of the Voigt response function. No experimental data are presented since the DT2 code is capable of producing pure simulation results, without the need to fit experimental data. | ||
Another reason for the Lobatto method performing better than the Gaussian method, even though it uses more integration points, might be the fact that the Gaussian method is appropriate when the function in the integral is differentiable.57 Since the Lorentzian function is not differentiable at zero, this probably affects the behaviour of the Voigt function at zero and degrades the efficiency of the Gaussian method.
4.2.2 Diagram lines, satellites and instrumental contributions
Beyond the mathematical details of the line shape, lines satellite to the diagram lines also create a conflict between the ideal shape and experimental observation. The fact that the intensity of these satellite lines is not known or is known with a large uncertainty, aggravates the doubts regarding the line shaping algorithm. In fact the resolution of XMS systems makes contributions such as radiative Auger–Meitner emissions (RAE),58,59 on the low energy side, and multiple ionizations on the high energy side,60 to significantly distort the peak shape, and most of the tail shapes, if these are present.Besides satellite lines emerging from the decaying ion species, other small lines emerge in the spectra, which are originated in the detector itself. In fact, and although some authors assume that there is a tail in TES XMS system response,61 there is no real evidence in favour of this artifact, in the same sense as these are known to exist in semiconductor detectors due to charge collection issues.
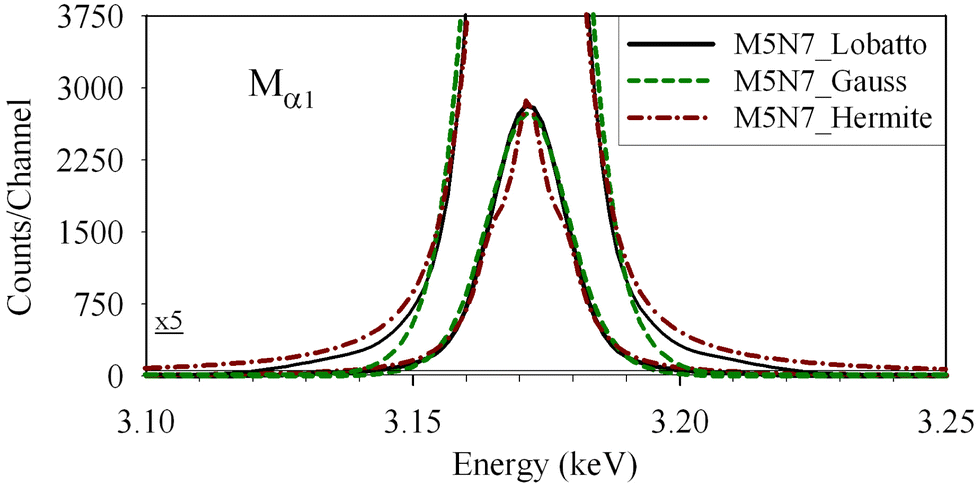
Some of the small structures observed in the spectrum, very close to the major peaks, can be interpreted as escape peaks due to the escape of very low energy X-rays from low energy transitions taking place at the end of the de-excitation decay cascade of ionized Au ions. The enhanced resolution of the system also contributes to an enhanced sensitivity to this type of effect. In Fig. 5 details on the escape peak structure are presented in the grey line that corresponds to the full detailed shape of the M5N7 (Mα1) transition as it is recorded using the Polaris TES system.
 | ||
| Fig. 5 UO2 M spectrum details on the escape peaks. Details on the escape peak structure are presented in the grey line corresponding to the full detailed shape of the M5N7 (Mα1) transition as it is recorded using a Polaris TES system. | ||
The complexity of the structure is due to the high number of possible conditions for loss of energy. In this first approach to include escape peaks in the response function of the Polaris TES, it was decided to include all possible radiative escape conditions. As a result of this decision a set of 48 different energies was determined. In the energy region shown in Fig. 5 all escapes corresponding to Au–N or Au–O shell transitions are presented. Escape peaks corresponding to the loss of Au–M transition X-rays are out of the energy window presented.
Once all these issues are considered, the overall fit is much improved relative to the simple Gaussian shape approach. In Fig. 6 details of the fitting of the major lines are shown, namely the residuals achieved. These are seen to be about 3% of the counts in the maximum of the peak, slightly above the statistical uncertainty of the counts in the central bin of the peak.
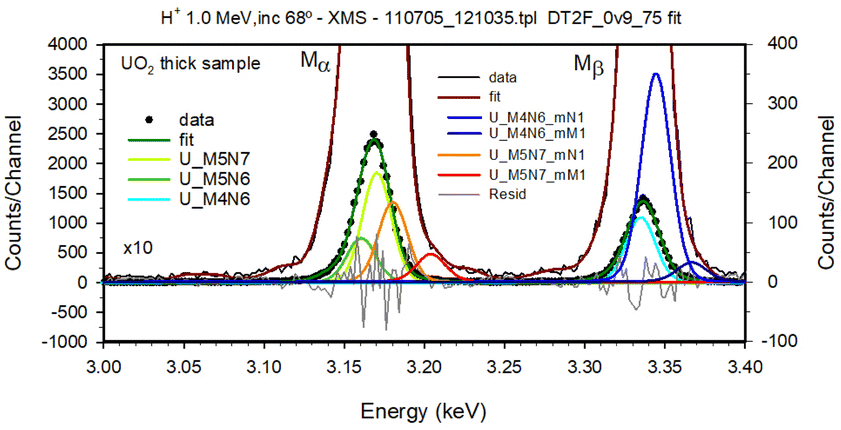 | ||
| Fig. 6 Details on the fit of Mα and Mβ lines in the UO2 M spectrum. The absolute difference between data and fit residuals achieved (shown in grey in the ×10 expanded scale on the right hand side) are seen to be less than 3.5% of the counts in the maximum of the peak, close to the statistical limit, although still larger than this. The deconvolution of the multi-ionization satellite transition M5N7N−1, having the energy as determined from the work of Czarnota et al.60 and automatically coded as M5N7_mN1 in the graph, is also shown. | ||
The deconvolution of the multi-ionization satellite transitions M5N7N−1, M5N7M−1, M5N6N−1 and M5N6M−1, automatically coded as M5N7_mN1, M5N7_mM1, M5N6_mN1 and M5N6_mM1 in the graph, are also shown. The energies found to be appropriate to obtain a good fit are 10 eV below those determined from the shift reported by Czarnota et al.,60 for all of these lines, except for M5N7M−1, where it is seen to be 15 eV below that value. These lines are displayed in the same scale as the residuals, which are expanded ten times relative to the scale presented. It can thus be seen that these multiple ionization satellite transitions represent an important fraction of the whole peaks, and is even more important in the case of the Mβ line.
It is important to emphasise that these final fit was obtained allowing the intensity of the multiple ionizations to be limited by its parent transition intensity in the following way. Satellite transition X_mN1 (having a spectator vacancy in the N-shell) intensity should be less than 50% of the intensity of the diagram transition and that of the hyper-satellites X_mM1 (having a spectator vacancy in the M-shell) should be less than 30% that of the X_mN1 satellite. This level of detail discussion can be compared to the equivalent one presented by Tobin et al.62 based on synchrotron data.
In Table 1 a description of the energies used in the model used for fitting the spectrum are presented along with other parameters and with the results and associated errors. Diagram transition and satellites energies used are presented in keV. Diagram transition wavelength data of Cauchois30 were converted into transition energy values data and RAE energies were calculated by subtracting to parent diagram line transition energy, the ionization energy of the second electron involved in the transition assuming it is bound in a Np (Z = 93) atom. Natural line widths used were essentially those reported by Perkins.63
| M X-ray energies (Cauchois, in keV), widths (Perkins, in eV) and satellites energies (in keV) | |||||||||
|---|---|---|---|---|---|---|---|---|---|
| X-ray transition | Diagram and RAE transition | Multi-ionization satellites | |||||||
| IUPAC | Siegbahn | Cauchois 1978 (ref. 30) | Perkins 1991 (ref. 63) | X yield (ref. 48) | Fitted area | X_mN1 (ref. 60) | Fitted area | X_mM1 (ref. 60) | Fitted area |
| a Transition energies, presented in keV, were converted from wavelength data from Cauchois data.30 RAE energies were calculated by subtracting the ionization energy of Np, for the second electron involved in the transition, from the diagram line transition energy. Line widths are mostly those reported by Perkins,63 and exceptions are indicated as modified ad hoc to obtain a better and consistent fit, (b) reported by Raboud,66 and (c) assumed to be identical to (b). Multi-ionization satellites, labelled X_mN1, and hyper-satellites, labelled X_mM1, were calculated by adding the shift reported by Czarnota et al.60 to the energy value of the associated diagram transition. The values considered for M5N6X_mM1, and M5N7X_mM1 were reduced by 10 eV, after a careful analysis of the initial fit. The M2N4 energy value was replaced by the value reported by Desclaux67 and by Rosen.68 The X-ray yields at 1.0 MeV proton impact are calculated using the model of Taborda et al.48 (X yield), fluorescence and Coster–Krönig coefficients from Chauhan and Puri64 and transition ratios from Chen et al.65 | |||||||||
| M5N7 | Mα1 | 3.1716 | 3.50 | 21923 | 21529 ± 738 | 3.1798 | 1564 ± 438 | 3.2056 | 585 ± 178 |
| M5N7O1 | 2.8318 | 3.50 | 67 ± 8 | ||||||
| M5N7O2 | 2.8882 | 3.50 | 0 ± 0 | ||||||
| M5N7O3 | 2.9655 | 3.50 | 66 ± 8 | ||||||
| M5N7O4 | 3.0623 | 3.50 | 0 ± 0 | ||||||
| M5N7O5 | 3.0703 | 3.50 | 66 ± 12 | ||||||
| M5N7P1 | 3.1216 | 3.50 | 2 ± 6 | ||||||
| M5N7P2 | 3.1423 | 3.50 | 1575 ± 123 | ||||||
| M5N6 | Mα2 | 3.1619 | 3.87 | 11126 |
8827 ± 389 | 3.1701 | 40 ± 25 | Not used | |
| M5N6P1 | 3.1119 | 3.87 | 236 ± 15 | ||||||
| M5N6P2 | 3.1326 | 3.87 | 12 ± 2 | ||||||
| M5N3 | Mξ1 | 2.5066 | 13.01 | 478 | 900 ± 33 | 2.5154 | 2 ± 1 | 2.5545 | 93 ± 27 |
| M5N3O3 | 2.3005 | 13.01 | 96 ± 10 | ||||||
| M4N6 | Mβ | 3.3362 | 3.91 | 10198 |
13010 ± 538 |
3.3444 | 4153 ± 518 | 3.3667 | 415 ± 51 |
| M4N6O1 | 2.9964 | 3.91 | 71 ± 9 | ||||||
| M4N6O2 | 3.0528 | 3.91 | 108 ± 32 | ||||||
| M4N6O3 | 3.1301 | 3.91 | 7 ± 2 | ||||||
| M4N6O4 | 3.2269 | 3.91 | 211 ± 32 | ||||||
| M4N6P2 | 3.3069 | 3.91 | 313 ± 195 | ||||||
| M4N6P3 | 3.3207 | 3.91 | 1260 ± 348 | ||||||
| M4N6N7 | 2.9322 | 3.91 | 116 ± 11 | ||||||
| M4N3 | Mδ | 2.6809 | 13.05 | 38 | 92 ± 10 | Not used | ± | Not used | |
| M4N2 | Mξ2 | 2.4549 | 18.88 | 356 | 690 ± 26 | 2.4637 | 3 ± 1 | 2.5028 | 8 ± 5 |
| M4O2 | Mη | 3.4676 | 13.14 | 104 | 215 ± 15 | 3.4895 | 105 ± 10 | 3.5297 | 19 ± 4 |
| M4O3 | 3.5313 | 10.55 | 100 | 81 ± 19 | |||||
| M4P2,3 | 3.6981 | 10.55 | 133 | — | |||||
| M3N5 | Mγ1 | 3.5641 | 18.31 | 313 | 1188 ± 52 | 3.5733 | 442 ± 21 | 3.6038 | 154 ± 35 |
| M3N1 | 2.8587 | 25.82 | 134 | 593 ± 24 | 2.8676 | 5 ± 1 | 2.8942 | 68 ± 29 | |
| M3N4 | Mγ2 | 3.5224 | 17.97 | 73 | 215 ± 19 | 3.5320 | 6 ± 2 | 3.5681 | 86 ± 33 |
| M3N7 | 3.9203 | 12.06 | 5 | 2 ± 1 | |||||
| M3O1 | 3.9783 | 34.27 | 23 | 24 ± 5 | |||||
| M3O4 | 4.1998 | 8.10(b) | 11 | — | |||||
| M3O5 | 4.2056 | 8.10(c) | 86 | 11 ± 8 | |||||
| M3P1 | 4.2311 | 34.27 | 6 | 392 ± 20 | |||||
| M3N5O2 | 3.2807 | 18.31 | 371 ± 36 | ||||||
| M3N5O3 | 3.3580 | 18.31 | 884 ± 120 | ||||||
| M2N4 | 4.4405(d) | 21.24 | 89 | 110 ± 11 | Not used | — | Not used | — | |
| M2N1 | 3.7244 | 29.09 | 18 | 311 ± 17 | |||||
| M2O1 | 4.8444 | 37.54 | 6 | 17 ± 4 | |||||
| M2O4 | 5.0749 | 18.7 | 27 | 5 ± 2 | |||||
| M2P1 | 5.1190 | 37.54 | 12 | 17 ± 4 | |||||
| M2O1O1 | 4.5046 | 37.54 | 20 ± 8 | ||||||
| M2M4P1 | 1.3820 | 17.50 | 198 ± 14 | ||||||
| M2M4 | 1.4530 | 20.00 | 13 | 167 ± 13 | |||||
| M1N2 | 4.2743 | 34.25 | 14 | 43 ± 9 | Not used | — | Not used | — | |
| M1N3 | 4.5061 | 28.42 | 7 | 6 ± 2 | Not used | — | Not used | — | |
| M1O3 | 5.3817 | 25.92 | 3 | — | |||||
| M1M3P3 | 1.211 | 17.50 | 78 ± 9 | ||||||
| M1M4P1 | 1.749 | 17.50 | 206 ± 14 | ||||||
It is important to note that using the line widths presented in Table 1, the FWHM inferred for the detector response varies from a minimum of 7.671 eV for the M4N2 transition having 2.4945 keV to 8.759 eV for M1O3 at 5.3817 keV. The energies of the multi-ionization satellites XN−1 (labelled X_mN1) and hyper-satellites XM−1 (labelled X_mM1) were determined by adding shifts based on the values proposed by Czarnota et al.60 to the energy value of the associated diagram transition X.
In Table 1, fitted areas are present for all transitions aside from simulated yields for X-ray production by the 1.0 MeV proton beam energy having a charge × solid angle parameter adjusted from the observed area of the Mα1 transition. These values were determined by using the direct ECPSSR calculation of M-shell ionizations by using a proton as used by Taborda et al. in48 combination with fluorescence and Coster–Krönig coefficients from Chauhan and Puri64 and transition ratios from Chen et al.65
Data, essentially from a single database, were used for each type of parameter, for data consistency, and the cases where this was not possible are mentioned in the table caption.
Finally, it is important to mention that DT2 follows the philosophy of IBIXFIT,37,38 namely, the area associated with each X-ray line is determined by modelling a normalized line and calculating a form factor that corresponds to the ratio between the line area and its height. The fitting process acts only upon the line height (this increases the speed of calculation, but leads to fractional values for areas, as in Table 1).
4.2.3 Free line ratios and gravitational fitting
Relative intensities of atomic transitions are among the less well established values used in XES. The use of different detectors does frequently also affect the used values, due to different groupings of transitions in the experimentally determined values. If and when possible, spectral fitting made without imposing relative intensities is the ideal solution. Nevertheless, such a requirement is a major problem for fitting codes due to the additional free parameters involved and potential unsolvable mathematical problems that may emerge.HiREDS-PIXE spectra are a priori better positioned to be fitted without imposing relative intensities because they present less classical overlay cases. In the initial software developments oriented to fitting spectra without imposing emission relative intensity values, namely IBIXFIT37,38 and in an initial version of DT2, Dt2fit0v06,33 the simulated annealing and Bayesian inference algorithms were used for this. Still, as more complex spectra started to be studied, some lines started to require limits on their variability. The attempt to do this led to a significant increase in computing time, the reason being directly linked to the algorithm itself. A decision was thus made to replace this algorithm by a similar one, more efficient in the cases where limits must be imposed to the transition relative intensities.
In the present version of DT2 (DT2F_0v9_75), simulated annealing and Bayesian inference algorithms have been replaced by a similar method, named gravitational fitting, originally developed by Reis in 200146 and very recently improved to assure its stability.
A detail explanation of the method is complex and will be presented elsewhere55 in detail. To present a short description, it can be said that the gravitational fitting algorithm is a random search algorithm whose main difference to simulated annealing is the fact that instead of jumping from a centre of search to another, based on the comparison to a second random variable, it selects a set of best values of the function of merit and successively searches the space of solutions around each of the centres of the set, using for that a random distribution of values of the free parameters, whose shape depends on a parameter, called the gravity parameter. As this parameter grows in value, the distributions become narrower around each of the selected centres. The absolute best should therefore be achieved if the Markov chains used in each iteration are not too large and the increase in the gravity parameter not too big between steps, otherwise the process may fall into a single local deep. In addition, the improved version uses a multi-dimensional merit function, which is applied both locally as well as globally, therefore being capable of following both general trends as well as local ones.
In the end, the error associated with the determination of the adjusted peak areas is determined by using the variability of the fitted area values in the set of the best parameters found.
Taking the present fit as an example, as can be seen in Table 1, the Mα1 line area of 21529 counts was determined with an error of 3.4%. In the case of the satellites, M5N7_mN1 and M5N7_mM1 areas of 1564 and 585 were determined respectively with errors of 28% and 30%.
The final full spectrum fit is that shown in Fig. 3, and the main results are present in Table 1. Most of the line heights were determined just based on the improvement of the fit, and restrictions were imposed only in multi-ionization transitions.
It is important to note that the energy value of transition M1N4 was seen not to agree with the Cauchois value but instead with the values proposed by Desclaux67 and by Rosen.68 The use of the 3rd order polynomial fit where precision can be seen by the fit of the Au-M escape peaks, was essential to reach this result.
5 XAHRM-Lab, a multi-method HiREDS facility
Having used a first generation TES system to introduce, exploit and establish HiREDS as an important new tool with new capacities that add to the already large scope of other XES methods, a major upgrade of the HRHE-PIXE system was due as the proper next step following the development of P2HA and DT2. This upgrade is being made in the framework of the Integrated Activities for the High Energy Astrophysics Domain UE funded project AHAED2020.11In this upgrade, the old Vericold Tech. POLARIS TES XMS system will be replaced by the new PhoeniX XMS based on a 3rd generation metallic magnetic calorimeter (MMC).69 After two years of facilities and detector design and adjustments, a new Au:Er metallic magnetic calorimeter (MMC) having a 5 × 2502 μm3 Au absorber, developed at the Kirchhoff Institute for Physics of Heidelberg University (see Fig. 7) will replace the old TES sensor. The new PhoeniX XMS will have a resolution level better than 10 eV @ Mn Kα1 while operating the refurbished Vericold GmbH Polaris ADR cryostat9 at 85 mK. The quantum efficiency is set to be above 75% over the whole useful energy range from 1.0 keV to above 15 keV.
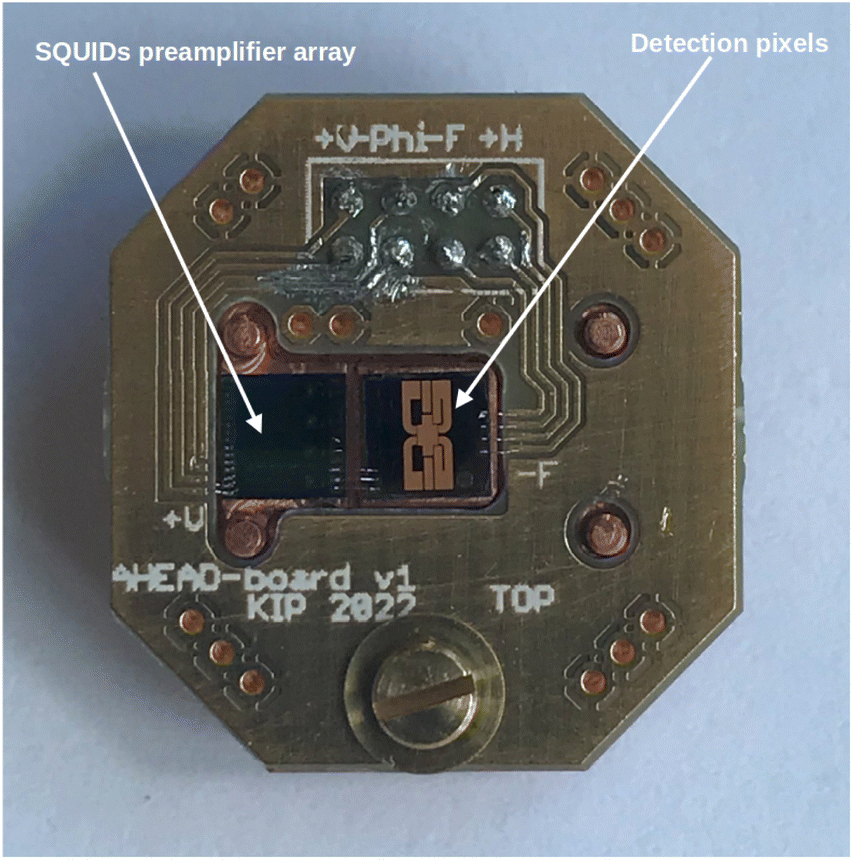 | ||
| Fig. 7 Detection unit of the new PhoeniX detector. The SQUID preamplifier array chip (left) and the detection pixel MMC chip (center) connected to a custom circuit board are visible. The central gold structure on the MMC chip consists of the absorbers, which obscure the magnetically active Au:Er layer beneath. | ||
The PhoeniX XMS will integrate the X-ray Advanced HiREDS Research and Metrology Laboratory (XAHRM-Lab) facility, which will be a multi-geometry and multi-technique end-station of the CTN 3 MV Tandetron, able to carry on experiments of PIXE and PIXE induced X-ray fluorescence (PI-XRF),70 both in a vacuum and in air.
Besides the PhoeniX XMS, a CdTe detector to collect up to 120 keV radiation and a particle detector are present. In this way, fundamental and applied HiREDS-PIXE work will be possible, as well as Total-IBA43 experiments and absolute referenced PIXE induced XRF experiments (PI-XRF).
In vacuum experiments and in air PIXE will be available using an X-ray lens to increase the effective solid angle, mainly for applied work. Vacuum experiments can also be performed without the X-ray lens unit, to reduce the number of uncertainty variables in fundamental work experiments.
In Fig. 8 a 3D CAD image of the system shows a PIXE with X-ray lens geometry. The ion beam in blue hits the green target. The PI-XRF unit is retracted aside of the beam, on the right. On the left, there is a structure holding the X-ray lens and allowing perfect alignment with PhoeniX XMS (its snout is also visible on the left). On the bottom right side, the snout of the CdTe detector is visible.
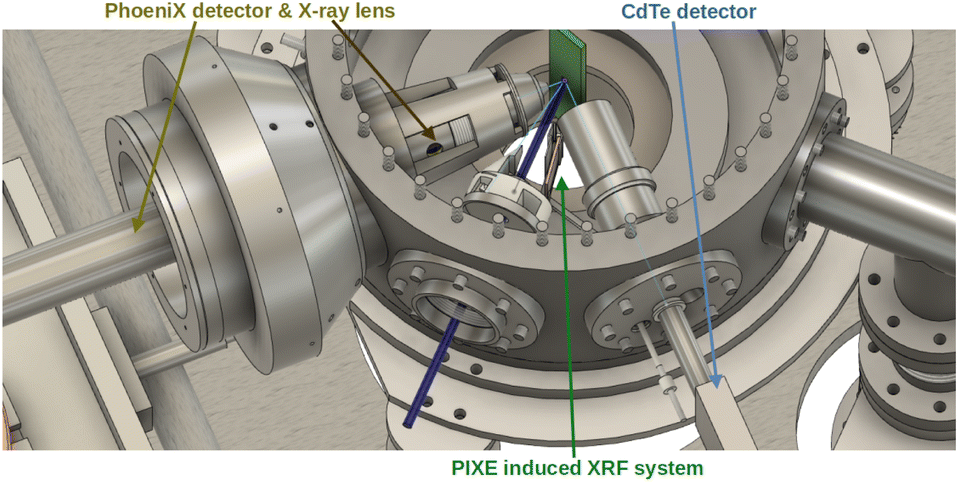 | ||
| Fig. 8 XAHRM-Lab chamber in geometry with an X-ray lens. The connection to the CdTe detector is seen on the bottom and the PIXE induced XRF unit is seen in the middle, away from the beam. The PhoeniX detector connection with the X-ray lens mounted is seen on the left. | ||
XAHRM-Lab is designed to allow many types of experiments, both for fundamental work, as well as applied work.
Where fundamental work is concerned, a major advantage is the fact that the exciting radiation can be a proton beam of energy adjustable from less than 1.0 MeV up to less than 4.0 MeV, an oxygen beam from 3.0 to 6.0 MeV or X-rays from a primary target irradiated by a proton beam. In any of these cases, the quantification of the ionizing radiation is absolute, either by measuring the charge in the case of the ion beams, or by measuring protons backscattered in the particle filter used to prevent the primary beam of the PIXE induced XRF hitting the target. Since the ionizing radiation can be changed without changing the target, interesting experiments may be devised to compare intensity ratios and/or differences in intensity of various satellite transitions, in the face of different ionization processes.
The availability of the PhoeniX XMS for low energy measurements and the simultaneous availability of the CdTe detector, will also allow precise comparison of M and L shell production, and L and K shell production, or even in well adjusted experiments, the simultaneous measurement of K, L and M shell transitions.
XAHRM-LAb will thus be a major tool for applied work, but also for fundamental parameter research, using HiREDS methods. The whole facility is presently being mounted and it is planned to be fully operational before the end of 2022.
6 Conclusions
The experimental determination of various fundamental atomic parameters used in PIXE has a non-neglectable dependence on the type of detector used to determine it. XMS systems therefore have an important role to play as an additional tool capable of making the bridge between WDS systems and semiconductor based spectrometers. First installed in 2008 the CTN HRHE-PIXE facility led to the establishment of HiREDS-PIXE, described in detail in previous studies9,10 and to the development and optimization of the P2HA software DSP code and the DT2 spectral fitting software that avoids the need to know all line ratios a priori in a group of transitions to the same subshell. Both are important tools for the production and handling of HiREDS spectra.In the present work, the characteristics and capabilities of the P2HA and the DT2 codes were further illustrated by use in a case study analysis of a U M-shell spectrum obtained from an ultrapure UO2 pellet irradiated by protons of 1.0 MeV. The transition energy values from Cauchois30 and satellite transition energies obtained from this by adding shifts determined by Czarnota et al.60 and radiative Auger–Meisner emission satellites6 calculated by using Np levels as a proxy to the Auger–Meisner electron binding energy in the de-exciting U ion, allowed a nearly perfect channel vs. energy calibration of the spectrum constructed offline using a fitted 3rd order polynomial and pure Voigt shaped lines.
This case study allowed the determination of values for the expected intensity of RAE transitions associated with several M-shell transitions and the proposal of adjustments to the energy of some multi-ionization satellites. Although this is just an example, and more work is needed to produce validated reference data from these types of methodologies, the essential lack of data in the literature for this type of variable, makes the data presented here an important reference. In the future, similar data will allow either their validation or the identification of still unsolved problems associated with HiREDS-PIXE data determination.
The launching of the XAHRM-Lab facility in the second half of 2022 will hopefully promote both the use of HiREDS, as well as the improvement of fundamental parameter databases. The XAHRM-Lab facility will be fully open to collaboration with other teams.
Author contributions
M. Bühler, resources; A. Fleischmann, resources; G. R. Fonseca, methodology, writing – review & editing; A. G. Karydas, methodology, writing – review & editing; M. Herbst, resources, writing – review & editing; K. Phelan, resources, writing – review & editing; P. C. Chaves, data curation, investigation, writing – original draft, writing – review & editing; M. A. Reis, conceptualization, formal analysis, investigation, methodology, software, writing – original draft, writing – review & editing.Conflicts of interest
The authors declare that they have no known competing financial interests or personal relationships that could have appeared to influence the work reported in this paper.Acknowledgements
Experimental and data analysis work carried out before 2017, mentioned and used as the base for the present work was partially supported by FCT, fellowship SFRH/BPD/76733/2011. HRHE-PIXE CTN facilities upgrade to XAHRM-Lab was partially funded by AHEAD2020, EU Horizon 2020 Framework Programme GA number 871158, and by the FCT UID/Multi/04349/2020 project.Notes and references
- T. B. Johansson, A. Akselsson and S. A. E. Johansson, Nucl. Instrum. Methods, 1970, 84, 141–143 CrossRef CAS.
- M. A. Reis, L. C. Alves and A. P. Jesus, Nucl. Instrum. Methods Phys. Res., Sect. B, 1996, 109/110, 134–136 CrossRef CAS.
- M. Petric and M. Kavčič, J. Anal. At. Spectrom., 2016, 31, 450–457 RSC.
- S. H. Nowak, et al. , Rev. Sci. Instrum., 2020, 91, 033101 CrossRef CAS PubMed.
- J. Höhne, M. Bühler, R. von Hentig end Theo Hertrich, U. Hess, K. Phelan, D. Wernicke, D. Redfern and J. Nicolosi, Mikrochim. Acta, 2002, 138, 259–264 CrossRef.
- M. A. Reis, P. C. Chaves and A. Taborda, X-Ray Spectrom., 2011, 40, 141–146 CrossRef CAS.
- P. C. Chaves, A. Taborda, J. Marques and M. A. Reis, Nucl. Instrum. Methods Phys. Res., Sect. B, 2014, 318, 60–64 CrossRef CAS.
- M. R. J. Palosaari, K. M. Kinnunen, J. Julin, M. Laitinen, M. Napari, T. Sajavaara, W. B. Doriese, J. Fowler, C. Reintsema, D. Swetz, D. Schmidt, J. Ullom and I. J. Maasilta, J. Low Temp. Phys., 2014, 176, 285–290 CrossRef CAS.
- M. A. Reis, P. C. Chaves and A. Taborda, Appl. Spectrosc. Rev., 2017, 52, 231–248 CrossRef.
- M. A. Reis, A. Carvalho, P. C. Chaves, A. Taborda, P. Conceição and P. Madureira, Nucl. Instrum. Methods Phys. Res., Sect. B, 2020, 479, 187–193 CrossRef CAS.
- Integrated Activities for the High Energy Astrophysics Domain – AHEAD2020, EU Horizon 2020 Framework Programme GA number 871158, https://ahead.iaps.inaf.it/ Search PubMed.
- EXSA Fundamental Parameters Initiative, https://www.exsa.hu/?inh=635 Search PubMed.
- H. Anderson and J. Ziegler, Hydrogen, Stopping Powers and Ranges in All Elements 3, Pergamon Press, 1977 Search PubMed.
- R. Siegele and D. Cohen, X-Ray Spectrom., 2013, 42, 541–545 CrossRef CAS.
- C. Heirwegh, I. Pradler and J. Campbell, J. Phys. B: At., Mol. Opt. Phys., 2013, 46, 185602 CrossRef.
- M. Terasawa, I. Török and V. Petukhov, Nucl. Instrum. Methods Phys. Res., Sect. B, 1993, 75, 105–108 CrossRef.
- V. Petukhov, I. Török and M. Terasawa, Nucl. Instrum. Methods Phys. Res., Sect. B, 1996, 109/110, 105–108 CrossRef CAS.
- V. Petukhov, M. Terasawa and I. Török, Nucl. Instrum. Methods Phys. Res., Sect. B, 1999, 150, 103–108 CrossRef CAS.
- M. Kavčič, M. Budnar, A. Mühleisen and I. Török, Nucl. Instrum. Methods Phys. Res., Sect. B, 1998, 136–138, 173–178 CrossRef.
- M. Kavčič, A. G. Karydas and C. Zarkadas, X-Ray Spectrom., 2005, 34, 310–314 CrossRef.
- M. Kavčič, Nucl. Instrum. Methods Phys. Res., Sect. B, 2010, 268, 3438–3442 CrossRef.
- Z. Kertész, E. Furu and M. Kavčič, Spectrochim. Acta, Part B, 2013, 79–80, 58–62 CrossRef.
- J. Hasegawa, T. Tada, Y. Oguri, M. Hayashi, T. Toriyama, T. Kawabata and K. Masai, Rev. Sci. Instrum., 2007, 78, 073105 CrossRef CAS PubMed.
- K. Maeda, K. Hasegawa, M. Maeda, K. Ogiwara and H. Hamanaka, X-Ray Spectrom., 2005, 34, 389–392 CrossRef CAS.
- T. Tada, H. Fukuda, J. Hasegawa and Y. Oguri, AIP Conf. Proc., 2010, 18, 1221 Search PubMed.
- T. Tada, H. Fukuda, J. Hasegawa and Y. Oguri, Spectrochim. Acta, Part B, 2010, 65, 46–50 CrossRef.
- H.-J. Woo, H.-W. Choi, G.-D. Kim and J.-K. Kim, J. Korean Phys. Soc., 2012, 61, 243–247 CrossRef CAS.
- D. Cureatz, M. Kavčič, M. Petric, K. Isaković, I. B. Mihalić, M. R. Ramos, S. Fazinić and J. L. Campbell, Spectrochim. Acta, Part B, 2022, 194, 106483 CrossRef CAS.
- M. A. Reis, P. C. Chaves, V. Corregidor, N. P. Barradas, E. Alves, F. Dimroth and A. W. Bett, X-Ray Spectrom., 2005, 34, 372 CrossRef CAS.
- Y. Cauchois and C. Senemaud, Wavelengths of X-ray Emission Lines and Absorption Edges, 1978 Search PubMed.
- S. Thurgate and T. Jach, Nucl. Instrum. Methods Phys. Res., Sect. A, 2021, 1014, 165707 CrossRef CAS.
- M. A. Reis and P. C. Chaves, X-Ray Spectrom., 2017, 46, 88–92 CrossRef CAS.
- M. A. Reis, P. C. Chaves, A. Taborda, J. Marques and N. P. Barradas, Nucl. Instrum. Methods Phys. Res., Sect. B, 2014, 3189, 65–69 CrossRef.
- P. C. Chaves, M. A. Reis, N. Barradas and M. Kavčič, Nucl. Instrum. Methods Phys. Res., Sect. B, 2007, 261, 121–124 CrossRef CAS.
- P. C. Chaves, A. Taborda, N. P. Barradas and M. A. Reis, Nucl. Instrum. Methods Phys. Res., Sect. B, 2010, 268, 2010–2014 CrossRef CAS.
- M. A. Reis, et al. , Nucl. Instrum. Methods Phys. Res., Sect. B, 2010, 268, 1980–1985 CrossRef CAS.
- M. A. Reis, P. C. Chaves, L. C. Alves and N. P. Barradas, X-Ray Spectrom., 2008, 37, 100–102 CrossRef CAS.
- A. Taborda, L. C. Alves, P. C. Chaves, N. P. Barradas and M. A. Reis, Application of Accelerators in Research and Industry, AIP Conf. Proc., 2011, 1336, 276–280 CrossRef CAS.
- M. A. Reis and L. C. Alves, Nucl. Instrum. Methods Phys. Res., Sect. B, 1992, 68, 300–304 CrossRef.
- C. Pascual-Izarra, N. P. Barradas and M. A. Reis, Nucl. Instrum. Methods Phys. Res., Sect. B, 2006, 249, 820–822 CrossRef CAS.
- N. P. Barradas and C. Jeynes, Nucl. Instrum. Methods Phys. Res., Sect. B, 2008, 266, 1875–1879 CrossRef CAS.
- C. Pascual-Izarra, M. A. Reis and N. P. Barradas, Nucl. Instrum. Methods Phys. Res., Sect. B, 2006, 249, 780–783 CrossRef CAS.
- C. Jeynes, V. Palitsin, G. Grime, C. Pascual-Izarra, A. Taborda, M. Reis and N. Barradas, Nucl. Instrum. Methods Phys. Res., Sect. B, 2020, 481, 47–61 CrossRef CAS.
- N. P. Barradas, C. Jeynes and R. P. Webb, Appl. Phys. Lett., 1997, 71, 291 CrossRef CAS.
- M. A. Reis, N. P. Barradas, P. C. Chaves and A. Taborda, X-Ray Spectrom., 2011, 40, 153–156 CrossRef CAS.
- M. A. Reis, Biomonitoring and Assessment of Atmospheric Trace Elements in Portugal – methods, response modelling and nuclear analytical techniques, Delft University Press, Delft, The Netherlands, 2001 Search PubMed.
- A. Taborda, P. C. Chaves and M. A. Reis, X-Ray Spectrom., 2011, 40, 127–134 CrossRef CAS.
- A. Taborda, P. C. Chaves, M. L. Carvalho and M. A. Reis, X-Ray Spectrom., 2013, 42, 177–182 CrossRef CAS.
- A. P. L. Bertol, P. C. Chaves, R. Hinrichs, M. A. Z. Vasconcellos and M. A. Reis, Nucl. Instrum. Methods Phys. Res., Sect. A, 2018, 908, 394–400 CrossRef CAS.
- P. C. Chaves, A. Tribolet and M. A. Reis, Nucl. Instrum. Methods Phys. Res., Sect. B, 2016, 366, 184–187 CrossRef CAS.
- M. A. Reis, P. C. Chaves and J. C. Soares, Nucl. Instrum. Methods Phys. Res., Sect. B, 2005, 229, 413–424 CrossRef CAS.
- A. Taborda, M. A. Reis, P. C. Chaves and A. Carvalho, Phys. Res. Int., 2011, 8 DOI:10.1155/2011/705686.
- P. C. Chaves and M. A. Reis, Nucl. Instrum. Methods Phys. Res., Sect. B, 2017, 410, 193–199 CrossRef CAS.
- A. Taborda, A. Desbrée, A. Carvalho, P. C. Chaves and M. A. Reis, Nucl. Instrum. Methods Phys. Res., Sect. B, 2016, 381, 122–131 CrossRef CAS.
- M. A. Reis, G. R. Fonseca, P. C. Chaves, A. A. Reis and A. Carvalho, Phys. Scr., 2023 Search PubMed , to be submitted..
- H. Amamou, B. Ferhat and A. Bois, Am. J. Anal. Chem., 2013, 4, 725–731 CrossRef.
- Handbook of Mathematical Functions, ed. M. Abramowicz and I. Stegun, Dover Inc. Press, 1st edn, 1965 Search PubMed.
- F. Block and P. Ross, Phys. Rev., 1935, 47, 884 CrossRef.
- M. Ahlberg, Nucl. Instrum. Methods, 1975, 131, 381–384 CrossRef CAS.
- M. Czarnota, D. Banas, J. Braziewicz, J. Semaniak, M. Pajek, M. Jaskóła, A. Korman, D. Trautmann, W. Kretschmer, G. Lapicki and T. Mukoyama, Phys. Rev. A: At., Mol., Opt. Phys., 2009, 79, 032710 CrossRef.
- J. N. Ullom and D. A. Bennett, Supercond. Sci. Technol., 2015, 28, 084003 CrossRef.
- J. Tobin, S. Nowak, R. Alonso-Mori, T. Kroll, D. Nordlund, T.-C. Weng and D. Sokaras, MRS Adv., 2021, 6, 209–212 CrossRef CAS.
- S. Perkins, D. Cullen, M. C. andJ. H. Hubbell, J. Rathkopf and J. Scofield, Tables and Graphs of Atomic Subshell Relaxation Data Derived from the LLNL Evaluated Atomic Data Library Z = 1–100, Lawrence, Livermore National Laboratory Report, UCRL 50400, 1991, vol. 30 Search PubMed.
- Y. Chauhan and S. Puri, At. Data Nucl. Data Tables, 2008, 94, 38–49 CrossRef CAS.
- M.-H. Chen and B. Crasemann, Phys. Rev. A: At., Mol., Opt. Phys., 1984, 30, 170–176 CrossRef CAS.
- P.-A. Raboud, J.-C. Dousse, J. Hoszowska and I. Savoy, Phys. Rev. A: At., Mol., Opt. Phys., 1999, 61, 012507 CrossRef.
- J. Desclaux, At. Data Nucl. Data Tables, 1973, 12, 311–406 CrossRef CAS.
- A. Rosen and I. Lindgren, Phys. Rev., 1968, 176, 176 CrossRef.
- S. Kempf, A. Fleischmann, L. Gastaldo and C. Enss, J. Low Temp. Phys., 2018, 193, 365–379 CrossRef CAS.
- D. Sokaras, C. Zarkadas, R. Fliegauf, B. Beckhoff and A. G. Karydas, Rev. Sci. Instrum., 2012, 83, 123102 CrossRef CAS PubMed.
| This journal is © The Royal Society of Chemistry 2023 |