
 Open Access Article
 This Open Access Article is licensed under a Creative Commons Attribution-Non Commercial 3.0 Unported Licence
High-useful yield and new autoionizing state of resonantly ionized tungsten
Danielle Ziva
Shulaker
 *a,
Reto
Trappitsch
b,
Michael R.
Savina
a and
Brett
Isselhardt
a
*a,
Reto
Trappitsch
b,
Michael R.
Savina
a and
Brett
Isselhardt
a
aLawrence Livermore National Laboratory, Nuclear and Chemical Sciences Division, 7000 East Ave, L-231, Livermore, CA 94551, USA. E-mail: shulaker1@llnl.gov
bEcole Polytechnique Fédérale de Lausanne, Architecture, Civil and Environmental Engineering (ENAC), Laboratory for Biological Geochemistry, GR C2 515 (Bâtiment GR), Station 2, 1015 Lausanne, Switzerland
First published on 30th December 2022
Abstract
In order to measure tungsten isotopic composition in presolar stardust grains that contain a limited number of atoms, we developed a new three-photon three-color resonance ionization scheme using titanium:sapphire lasers and the Laser Ionization of Neutrals (LION) instrument at Lawrence Livermore National Laboratory. The first two transitions can be easily saturated, while approximately 84% of available atoms can be ionized in the third transition with our current laser irradiance. When ionizing from the ground state, measurements demonstrate a W useful yield of 14.4% ± 1.6%. Experiments that intentionally cover a range of laser power and wavelength to simulate potential variations during analysis show that laser-induced W isotopic fractionation, if it occurs, is within measurement error. Overall, this new W resonance ionization scheme can be employed in future studies of atom limited samples to obtain W isotopic measurements.
1. Introduction
Heavy element isotopic analyses of stardust grains are vital to understanding heavy element nucleosynthesis in stars. Presolar stardust grains are micrometer-sized grains that condense from stellar gaseous ejecta.1–3 Therefore, the isotopic compositions of stardust record a snapshot of nucleosynthesis in a star at a specific moment in its evolution. Isotopic compositions of heavy elements (e.g., Sr, Zr, Mo, Ba) in stardust grains have elucidated s-process (slow rate of neutron capture relative to β-decay) nucleosynthesis.4–8 For example, obtaining isotopic compositions of Zr in stardust is important for constraining the stellar conditions that favor neutron capture or β-decay at 95Zr, a branching point in the s-process as it lies between two stable isotopes (94Zr and 96Zr) and has a relatively long half-life of 64 d.9 Similar to 95Zr, 185W is a branching point in heavy element s-process nucleosynthesis with a half-life of 59 d,10 under typical s-process conditions of 3 × 10⁸ K and an electron number density of 3 × 1026 cm−3.Obtaining W isotopic data from stardust grains presents many challenges. Because the vast majority of the larger-sized stardust grains are only a few μm in diameter, micro-analytical tools are required for analyses. These techniques must have high useful yield (ions detected per atom consumed) because W is present in extremely low concentrations in stardust grains. Tungsten enrichment in SiC stardust grains is approximately a factor of 10 relative to CI chondrite composition, or ∼1 ppm.11,12 Tungsten measurements in stardust grains are inherently more difficult than Zr because the abundance of W in the universe is two orders of magnitude lower than Zr.13
In fact, the one study that has investigated W in stardust grains11 used secondary ionization mass spectrometry (SIMS). However, these analyses were largely performed on grain aggregates instead of single grains due to spot-size limitations of SIMS; only five exceptionally large individual stardust grains that had at least one dimension ranging between 7 and 26 μm were analyzed as single grains.
Fortunately, resonant ionization mass spectrometry (RIMS) is an analytical technique that has been utilized to analyze heavy element (e.g., Sr, Zr, Mo, Ba) isotopic compositions in stardust grains due to its high spatial resolution, sensitivity, and useful yield.4–8 Previous theoretical and experimental studies have established resonant ionization wavelengths for W;14–17 our aim in this work is to develop a practical resonance ionization scheme (RIS) scheme for the demanding micro-analytical study of W isotope ratios within individual stardust grains. We present a new three-photon three-color W RIS scheme and demonstrate its useful yield and isotopic accuracy for this application.
2. Methods
2.1. Samples
Tungsten metal foil and W cast metal (assumed to be terrestrial isotopic composition) were used to develop the RIS and to evaluate useful yield. Both samples were polished with 2000 grit sandpaper to ensure a flat surface and cleaned in isopropanol before being mounted on sample stubs with carbon tape.2.2. RIMS
All RIMS measurements were conducted on the LION instrument at Lawrence Livermore National Laboratory. Details on RIMS, the LION instrument, and data evaluation have been previously published.18–21 For all analyses, an IonOptika liquid metal ion gun with a 15 keV Ga+ ion beam focused to ∼1 μm and oriented at an incident angle of 60° from the surface normal was used to sputter material with either a 10 or 20 μm square raster. After the primary ion pulse, secondary ions were ejected from the system by applying a 5000 V pulse to the sample. Then, three tunable titanium:sapphire (Ti:Sa) lasers tuned to W resonance ionization wavelengths and collimated at ∼1.5 mm full-width half mass (FWHM) were pulsed through the sputtered neutrals to ionize W atoms. These photoions were then extracted into the time-of-flight mass spectrometer and separated by their mass-to-charge ratios, before being detected in ion counting mode on a MagneTOF™ (ETP ion detect®) discrete dynode detector. The repetition rate of the mass spectrometer was 1 kHz.2.3. Wavelength scans
Initially, one Ti:Sa laser was tuned to the published first transition wavelength that has been shown experimentally and theoretically to excite neutral W atoms (Fig. 1).14,22 The first transition and ionization potential (25![[thin space (1/6-em)]](https://www.rsc.org/images/entities/char_2009.gif) 983.61 cm−1 and 63427.7 cm−1, respectively) were previously published in ref. 14. However, these published transitions were established using dye lasers and the short wavelength of the second transition has a relatively high energy per photon, which could result in high backgrounds in RIMS analyses of solids.
983.61 cm−1 and 63427.7 cm−1, respectively) were previously published in ref. 14. However, these published transitions were established using dye lasers and the short wavelength of the second transition has a relatively high energy per photon, which could result in high backgrounds in RIMS analyses of solids.
 | ||
| Fig. 1 Tungsten resonance ionization scheme presented in this work. First and ionizing transition (IP) wavelengths are after ref. 14. The second and autoionizing (AI) transition wavelengths are from this study. | ||
Therefore, we selected a second excited state and autoionizing (AI) state suited for the Ti:Sa lasers in the LION instrument. To determine the second excited state, the longest accessible wavelength (to avoid noise) with a ΔJ = +1 transition was obtained from the NIST Atomic Spectra Database.22 To investigate transitions to AI or Rydberg states, we performed coarse wavelength scans around the ionization potential determined by ref. 14. Then, fine wavelength scans were conducted around the wavelengths, at which 63480.27 cm−1 yielded the highest ionization efficiency.
We performed high resolution scans around the second transition and AI state wavelengths to confirm the optimal wavelengths for Ti:Sa lasers to 1 pm resolution. We systematically scanned the wavelength of the transition of interest while fixing the laser wavelengths for the other two transitions. These scans were performed at 195 mW, 150 mW, and 1200 mW for the first, second, and third transitions, respectively. Every two or three wavelength scans were bracketed by repeating the measurement at a given wavelength. We collected the total number of W atoms ionized for each isotope (180, 182, 183, 184, and 186) for a fixed number of laser pulses (5000 laser pulses for the first and second transitions; 2000 laser pulses for the third transition). To negate any systematic variation during the run that may affect the ionization, we normalized the sum of W ions for each scanned wavelength by the average number of W ions from the bracketing measurements. Optimal wavelengths for each transition were chosen based on ionization efficiency and the sensitivity of the ion yield to changes in wavelength.
2.4. Saturation curves
Saturation curves (observed ion signal as a function of irradiance) were constructed to determine the optimal laser power for each transition. The power of two of the lasers were fixed at their maxima while the third was varied randomly. As in the wavelength scans, bracketing was used to avoid drift in the number of atoms sputtered over time.2.5. Useful yield
To calculate the useful yield, the W sputter yield was measured. First, the sample surface was cleaned using a 20 μm × 20 μm raster of a continuous 15 keV Ga+ beam at 8 nA for one minute to remove the top WOx layer. Then, a 20 μm × 20 μm pit was sputtered into the sample (Fig. 2). This was repeated for a total of five pits. The Ga+ ion current was measured using a Faraday cup and picoammeter. A ZeGage optical interferometer (Zygo Corp.) was used to determine the volume of each pit. Useful yield measurements were then made by collecting 5000 mass spectra in pulsed mode using a 300 ns Ga+ pulse for each spectrum (Table 1). | ||
| Fig. 2 Representative images of pits sputtered into (A) W metal foil and (B) W cast metal. The depth (μm) is color-coded according to the depth of the pit relative to the sample surface. Square edges around the pits are a remnant of the step-size used by the ZeGage optical interferometer to image the pit. | ||
| Crater number | Sputtering yielda | Useful yieldb,c | |
|---|---|---|---|
| a W atoms sputtered per incident Ga+ ion. b Number of W ions detected per W atom consumed. c See Table 2 for laser parameters. | |||
| Polished W metal foil | 1 | 3.6 | 12.8% |
| 2 | 3.4 | 13.4% | |
| 3 | 3.2 | 14.8% | |
| 4 | 3.3 | 14.3% | |
| 5 | 2.9 | 16.4% | |
| Average | 3.3 | 14.3% | |
| Standard deviation | 0.2 | 1.2% | |
| Polished W cast metal | 1 | 2.9 | 16.3% |
| 2 | 4.0 | 11.2% | |
| 3 | 3.0 | 15.8% | |
| 4 | 3.2 | 14.6% | |
| Average | 3.3 | 14.5% | |
| Standard deviation | 0.4 | 2.0% | |
| All W metal data | Average | 3.3 | 14.4% |
| Standard deviation | 0.3 | 1.6% | |
3. Results
3.1. Transition wavelengths
Wavelength scans for each transition are shown in Fig. 3. The optimal wavelengths for the first through third transitions are 384.858 nm (5D0 → 5F1), 407.469 nm (5F1 → 5D2), and 771.908 nm (5D2 → AI), respectively (Fig. 1). Peaks centered around each optical wavelength are quite broad. The first and second transitions have symmetrical peaks ∼19 and ∼36 pm FWHM, respectively. The third transition has a FWHM ∼34 pm, and a distinguishable adjacent peak at longer wavelength. | ||
| Fig. 3 Wavelength scans for all three transitions. The laser bandwidths were ∼10 nm (FWHM) for the first and second transitions and ∼20 nm for the third transition. Normalized W counts refers to the sum of W ions for each scanned wavelength normalized by the average number of W ions from the bracketing measurements. Data collected are shown as circles and solid lines are super Gaussian least-squares fit through the data which we used to estimate FWHM. For the third transition, data points associated with the adjacent second peak were not incorporated in the model fit. Dashed lines represent the wavelengths chosen for the resonance ionization scheme. | ||
3.2. Saturation parameters
To determine the optimal laser irradiance for each transition, the normalized ion signals were fit to a first-order rate model:23 | (1) |
The saturation data and first-order rate model fits for all three transitions are shown in Fig. 4. Optimal irradiances for each transition are summarized in Table 2.
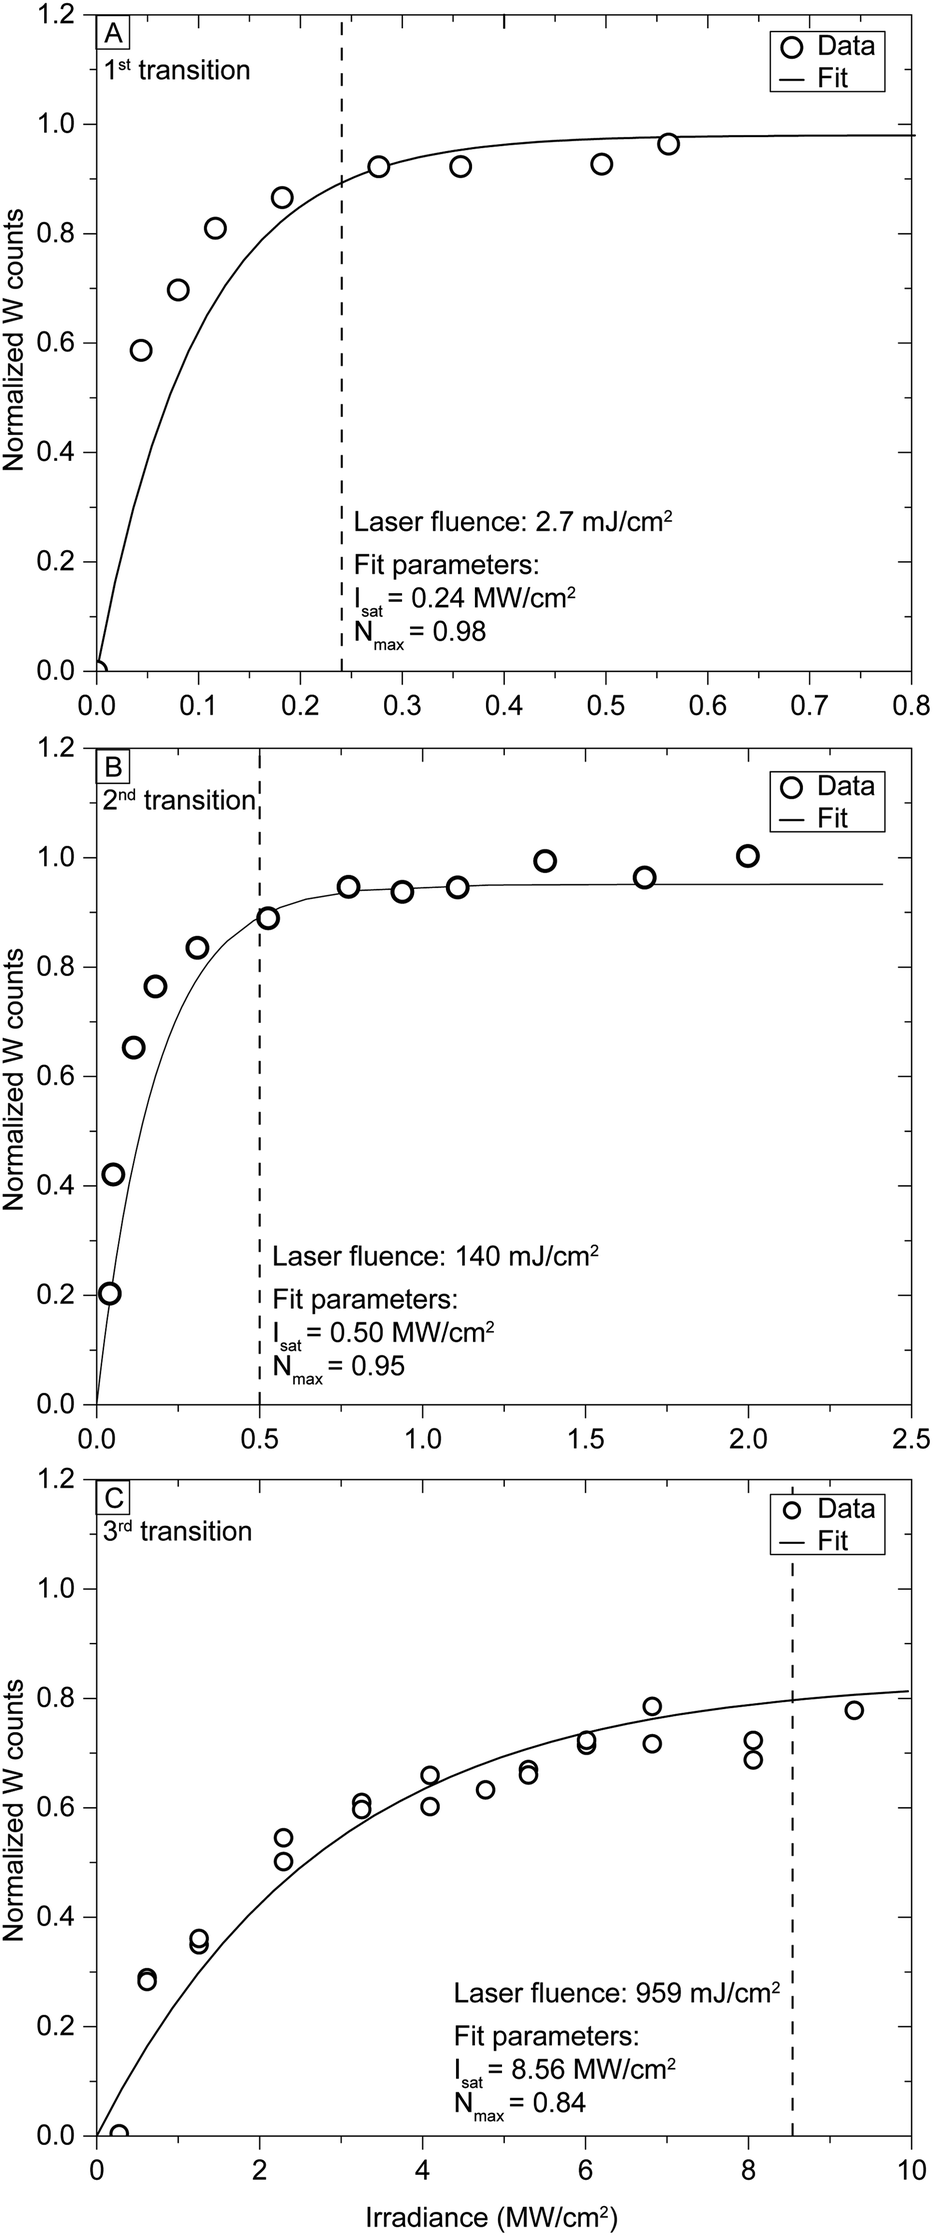 | ||
| Fig. 4 Saturation curves for the three transitions at the wavelengths shown in Fig. 1. Normalized W counts refers to the sum of W ions for each scanned wavelength normalized by the average number of W ions from the bracketing measurements. Dashed lines show irradiance calculated at 95% or 84% of the maximum signal for each transition calculated using eqn (1). The corresponding fluences are 2.7, 140, and 959 mJ cm−2, respectively. Fit parameters given are Isat (saturation irradiance) and Nmax (the maximum signal). For all saturation curves, the normalized W counts are zero at zero irradiance. | ||
| Lasera | Wavelength (nm) | Power (W) | Diameterb,c (mm) | Pulse widthb (ns) | Irradianced (MW cm−2) |
|---|---|---|---|---|---|
| a The pulse repetition rate for all lasers was 1 kHz. Roman numerals refer to the step in the ionization process (see Fig. 1). b The full width half maximum. c Average of major and minor axes; ellipticities ranged from 0.83 to 0.90. d Irradiance calculated at 95% of the maximum signal for each transition. | |||||
| W(I) | 384.858 | 0.033 | 1.24 | 11.4 | 0.24 |
| W(II) | 407.469 | 0.135 | 1.09 | 29.0 | 0.50 |
| W(III) | 771.908 | 1.373 | 1.35 | 11.2 | 8.56 |
3.3. Useful yield
The sputtering yield for both the W metal foil and cast metal samples is 3.3 (Table 1). The calculated useful yield ranges from 12.8–16.4% for the W metal foil and 11.2–16.3% for the W cast metal. Overall, the sputtering and useful yields of W metal foil and cast metal are nearly identical. The average useful yield calculated from both the W metal foil and cast metal is 14.4% ± 1.6% (1 standard deviation). Implantation of Ga+ ions during sputtering was not taken into account when calculating the useful yield.4. Discussion
Wavelength scans at each transition confirm the optimal wavelength for the first transition14 and second and AI transitions (Fig. 1). The wavelength scans show broad peaks centered around the optimal wavelengths (Fig. 3). Therefore, the wavelengths of the lasers could be allowed to vary over the course of an analysis by several picometers without a significant loss of signal. The peaks are broad because the wavelength scans were conducted using the maximum laser irradiance available. Broad peaks are beneficial during analyses because laser wavelengths can vary slightly as a function of time. At lower power, such as those determined to be optimal (approximately three times the saturation power) the peak widths would be expected to be narrower.4.1. Isotope ratio accuracy and precision
It is important to establish whether the W RIS scheme results in laser induced isotopic fractionation. Fig. 5 shows W isotope ratios as functions of power and wavelength (Table 3). It is unsurprising that the 180W/184W ratios are the least precise given that 180W is the least abundant W isotope (the five isotopes of W have solar abundances of 0.12% 180W, 26.5% 182W, 14.31% 183W, 30.64% 184W, and 28.43% 186W; Table 3);12 however, the slopes of the lines fit to the data are close to zero, showing minimal W isotopic fractionation with varying power or wavelength (Fig. 5). | ||
| Fig. 5 Plots comparing measured W isotopes varying wavelength and 95% maximum laser power (saturation irradiance) associated with power for the first transition, which are representative of scans performed for all three transitions. Graphs compare the W isotope ratio normalized to 184W with varying (A) wavelength and (B) laser power. Plots (C) and (D) show 182, 183, 186W normalized to 184W, denoted as δxW‰. The δxW‰ are the permil deviations from solar W isotopic abundance, which is the assumed composition of the W samples. These plots compare the δ184W‰ with varying wavelength and laser power, respectively. Squares are the W isotopic data with one sigma errors. The dashed lines show either the optimal wavelength (384.858 nm) in the first transition or the saturation irradiance. The colored horizontal lines show the linear fit to the data with a 95% confidence band. Because 180W is present in such low abundance (0.12% solar abundance), the δ180W‰ data are not presented due to the high scatter and large uncertainties. Graphs (A) and (C) were conducted using lasers powers of 185 mW, 605 mW, and 1.2 W for the first through third transitions, respectively. Graphs (B) and (D) were conducted using laser parameters listed in Table 2 but varying the laser power for the first transition. | ||
| First transition | Second transition | Autoionizing state | ||
|---|---|---|---|---|
| Isotope ratio | Number of analyses | 13 | 17 | 2 |
| Power scanned (mW) | 109 | 557 | 1500 | |
| 180W/184W | Average | 0.004 | 0.004 | 0.005 |
| 1 SD | 0.001 | 0.001 | 0.002 | |
| Uncertainty | 25% | 25% | 40% | |
| MSWD | 1.4 | 0.55 | 0.68 | |
| 182W/184W | Average | 0.85 | 0.85 | 0.82 |
| 1 SD | 0.020 | 0.017 | 0.12 | |
| Uncertainty | 2.4% | 2.0% | 15% | |
| MSWD | 1.2 | 1.2 | 1.3 | |
| 183W/184W | Average | 0.48 | 0.50 | 0.51 |
| 1 SD | 0.012 | 0.025 | 0.054 | |
| Uncertainty | 2.5% | 5.0% | 11% | |
| MSWD | 0.84 | 3 | 0.5 | |
| 186W/184W | Average | 0.89 | 0.91 | 0.90 |
| 1 SD | 0.023 | 0.029 | 0.11 | |
| Uncertainty | 2.6% | 3.2% | 12% | |
| MSWD | 1.3 | 1.9 | 0.98 |
The W isotope ratios are normalized to 184W and presented as δ-values (permil deviations from the solar isotopic composition). The δ183W‰ value shows a slight enrichment relative to solar (e.g., greater than one) while the even isotope ratios (δ182W‰ and δ186W‰) show a slight depletion (Fig. 5d). The relative enrichment of odd isotopes in RIMS analyses is a phenomenon known as the “odd-even” effect.21,24,25 Owing to hyperfine splitting, odd isotopes have more paths to ionization than even isotopes and ionize at a faster rate. This can favor the ionization of odd isotopes relative to even isotopes even in nominally saturated transitions, since atoms in the wings of the laser power distribution will not experience saturation irradiance. This can cause small odd-even fractionation during RIMS analyses. The enhancement seen in 183W is significantly less than the well-documented enhancement of odd isotopes for resonance ionization of Gd, Ti, and Os.20,25,26 When analyzing samples of unknown composition small isotopic fractionations such as these are easily corrected by normalization with standard materials. The important point here is that, as shown in Fig. 5, the small changes in δxW‰ occur over very large laser power and wavelength variations. Over the course of an analysis, the Ti:Sa lasers are stable within a few mW in power and ≤2 pm in wavelength. Therefore, the measured isotopic ratios will not drift and standard normalization will correct for the small isotopic fractionation inherent in the resonance ionization process.
5. Conclusions
This work presents a new RIS scheme for W using three tunable Ti:Sa lasers as determined by conducting spectroscopic surveys and saturation measurements. The first two transitions can be easily saturated, while approximately 84% of the maximum expected signal can be saturated in the third transition. Tungsten isotopic measurements show that small variations in laser power or wavelength do not result in variations in measured isotope ratios. The same W sputtering and useful yields (3.3 atoms sputtered per Ga+ ion and 14.4%, respectively) calculated from sputtering two different W samples show that the removal and ionization of W is consistent between different materials.Though previous studies determined wavelength transitions experimentally (e.g., spectroscopic surveys) or computationally, this work fills the void of a W RIS scheme necessary for investigating W isotopic compositions preserved in material. For instance, this new high-efficiency W RIS scheme will be implemented to measure W isotopic measurements of presolar stardust grains to provide information on heavy element nucleosynthesis.
Conflicts of interest
There are no conflicts to declare.Acknowledgements
We thank editor Gabriel Clarke and two anonymous referees for their comments. This work was performed under the auspices of the U.S. Department of Energy by Lawrence Livermore National Laboratory under Contract DE-DEAC52-07NA27344 and was supported by the Laboratory Directed Research and Development Program at LLNL under project 20-ERD-030, LLNL-JRNL-840483.References
- M. Lugaro, Stardust from Meteorites: An Introduction to Presolar Grains, World Scientific, 2005, p. 224 Search PubMed.
- L. Nittler and F. Ciesla, Annu. Rev. Astron. Astrophys., 2016, 54, 53–93 CrossRef.
- A. M. Davis, Proc. Natl. Acad. Sci. U. S. A., 2011, 108, 19142–19146 CrossRef.
- G. K. Nicolussi, M. J. Pellin, R. S. Lewis, A. M. Davis, R. N. Clayton and S. Amari, Phys. Rev. Lett., 1998, 81, 3583 CrossRef CAS.
- M. R. Savina, A. M. Davis, C. E. Tripa, M. J. Pellin, R. N. Clayton, R. S. Lewis, S. Amari, R. Gallino and M. Lugaro, Geochim. Cosmochim. Acta, 2003, 67, 3201–3214 CrossRef CAS.
- J. G. Barzyk, M. R. Savina, A. M. Davis, R. Gallino, M. J. Pellin, R. S. Lewis, S. Amari and R. N. Clayton, New Astron. Rev., 2006, 50, 587–590 CrossRef CAS.
- T. Stephan, R. Trappitsch, A. M. Davis, M. J. Pellin, D. Rost, M. R. Savina, M. Jadhav, C. H. Kelly, F. Gyngard, P. Hoppe and N. Dauphas, Geochim. Cosmochim. Acta, 2018, 221, 109–126 CrossRef CAS.
- T. Stephan, R. Trappitsch, P. Hoppe, A. M. Davis, M. J. Pellin and O. S. Pardo, Astrophys. J., 2019, 877, 101 CrossRef CAS.
- M. Lugaro, G. Tagliente, A. I. Karakas, P. M. Milazzo, F. Käppeler, A. M. Davis and M. R. Savina, Astrophys. J., 2014, 780, 95–109 CrossRef.
- K. Takahashi and K. Yokoi, At. Data Nucl. Data Tables, 1987, 36, 375–409 CrossRef CAS.
- J. N. Ávila, M. Lugaro, T. R. Ireland, F. Gyngard, E. Zinner, S. Cristallo, P. Holden, J. Buntain, S. Amari and A. Karakas, Astrophys. J., 2012, 744, 49 CrossRef.
- N. Braükmuller, F. Wombacher, D. C. Hezel, R. Escoube and C. Münker, Geochim. Cosmochim. Acta, 2018, 239, 17–48 CrossRef.
- K. Lodders, Astrophys. J., 2003, 591, 1220–1247 CrossRef CAS.
- M. D. Campbell-Miller and B. Simard, J. Opt. Soc. Am. B, 1996, 13, 2115–2120 CrossRef CAS.
- P. Quinet, P. Palmeri and É. Biémont, J. Phys. B: At., Mol. Opt. Phys., 2011, 44, 145005 CrossRef.
- Y. Hirayama, M. Mukai, Y. X. Watanabe, M. Oyaizu, S. C. Jeong, Y. Kakiguchi, P. Schury, M. Wada and H. Miyatake, Rev. Sci. Instrum., 2019, 90, 115104 CrossRef CAS PubMed.
- C. A. Johnson, D. A. Ennis, S. D. Loch, G. J. Hartwell, D. A. Maurer, S. L. Allen, B. S. Victor, C. M. Samuell, T. Abrams, E. A. Unterberg and R. T. Smyth, Plasma Phys. Controlled Fusion, 2019, 61, 095006 CrossRef CAS.
- T. Stephan, R. Trappitsch, A. M. Davis, M. J. Pellin, D. Rost, M. R. Savina, R. Yokochi and N. Liu, Int. J. Mass Spectrom., 2016, 407, 1–15 CrossRef CAS.
- M. R. Savina, B. H. Isselhardt, A. Kucher, R. Trappitsch, B. V. King, D. Ruddle, R. Gopal and I. Hutcheon, Anal. Chem., 2017, 89, 6224–6231 CrossRef CAS.
- R. Trappitsch, M. R. Savina and B. Isselhardt, J. Anal. At. Spectrom., 2018, 33, 1962–1969 RSC.
- M. R. Savina and R. Trappitsch, Photoionization and Photo-Induced Processes in Mass Spectrometry: Fundamentals and Applications, John Wiley & Sons, 2021 Search PubMed.
- NIST, Atomic Spectra Database, 2022, from https://physics.nist.gov/PhysRefData/ASD/levels_form.html Search PubMed.
- V. S. Letokhov in Laser Photoionization Spectroscopy, Academic Press Inc., Orlando FL, 1987 Search PubMed.
- I. Sokolov, D. J. Blagburn and J. D. Gilmour, Opt. Commun., 2009, 282, 3487–3492 CrossRef.
- R. K. Wunderlich, G. J. Wasserberg, I. D. Hutcheon and G. A. Blake, lnst. Phys. Conf. Ser. No. 128: Section 3, RIS, Santa Fe, NM, USA, 1992, pp. 127–130 Search PubMed.
- H. Niki, K. Motoki, M. Yasui, Y. Horiuchi, S. Tokita and Y. Izawa, J. Nucl. Sci. Technol., 2006, 43, 427–431 CrossRef CAS.
| This journal is © The Royal Society of Chemistry 2023 |