 Open Access Article
Quantitative, non-destructive elemental composition analysis of 3D-structured samples
László
Szentmiklósi
 *,
Boglárka
Maróti
 and
Zoltán
Kis

Nuclear Analysis and Radiography Department, Centre for Energy Research, 29-33 Konkoly-Thege Miklós Street, 1121 Budapest, Hungary. E-mail: szentmiklosi.laszlo@ek-cer.hu
First published on 20th December 2022
Abstract
Prompt-gamma activation analysis (PGAA) is a non-destructive nuclear analytical method to determine the bulk elemental composition of samples with very good metrological quality. We have developed an experimental procedure to collect position-sensitive PGAA spectra, and a generally-applicable matrix-effect correction method based on Monte Carlo simulations. This latter eliminates the bias between measurement points of a pencil-beam raster scan, caused by the geometry-dependent neutron self-shielding and gamma-ray self-absorption effects. The procedure has been validated here to perform non-invasive, spatially-resolved, non-destructive bulk analysis of voluminous, inhomogeneous, and/or spatially structured samples.
Introduction
Most mainstream element-analytical techniques1 require destructive sampling, such as powdering, homogenization, or dissolution of the specimen, while laser-ablation, X-ray or particle-induced techniques have limited penetration depth, and consequently, the volume-representativity of the results is rather limited. However, neutron-based techniques (Instrumental Neutron Activation Analysis (INAA), Prompt-gamma Activation Analysis (PGAA),2,3 and Neutron Resonance Capture/Transmission Analysis (NRT, NRCA)4–7) are well-suited for the direct and bulk-representative analysis of solid samples, even in cases such as surface coating, corrosion, and decoration,8 as well as when the sample is inhomogeneous on the macroscale. Thanks to their fundamentally different methodologies, i.e., the Poisson counting statistics and comprehensive uncertainty budget, they provide results of high metrological quality.9PGAA is a powerful, in situ, and non-invasive elemental analysis technique based on the nuclear reaction of radiative neutron capture.10 During irradiation with a well-collimated beam of slow neutrons, characteristic gamma rays of up to 11 MeV energy are emitted. They are detected during the irradiation with a perpendicularly placed HPGe gamma ray detector, facilitating the qualitative and quantitative elemental composition determination of the irradiated volume. Once the elements are identified based on their gamma-ray energies and a spectroscopic library,11 the elemental masses within the irradiated volume are derived from the areas of the analytical gamma-ray peaks using eqn (1):
 | (1) |
![[m with combining macron]](https://www.rsc.org/images/entities/i_char_006d_0304.gif) k) as the weighted average of those determined from n individual analytical lines12 (eqn (2)):
k) as the weighted average of those determined from n individual analytical lines12 (eqn (2)): | (2) |
 | (3) |
During this step, the uncertainties related to many factors, e.g., properties of the neutron flux, and absolute detector efficiency are canceled for homogeneous samples, making the analysis procedure robust.
Both neutrons and energetic gamma rays penetrate deep into the studied object, up to a few mm or even cm, so the probed volume can be as large as a few cm3. This makes them appropriate to measure the bulk-representative composition of voluminous and homogeneous solid samples.13 However, both types of radiation are attenuated by condensed matter during the penetration. The interaction of neutrons and gamma rays with the sample material is energy-dependent, resulting in shifts in their energy distributions during the propagation within the sample. This negative matrix effect is corrected via the fn neutron self-shielding and fγ gamma-ray self-absorption factors of eqn (1). In chemical, environmental, and materials science applications one can optimize the amount and the shape of the analyte. For miniature and homogeneous samples measured at a high-flux facility,14fn and fγ are practically unity. At medium-flux facilities, larger, but still homogeneous and regularly shaped samples are measured15,16 to compensate for the lower neutron intensity.
However, when many other types of objects, e.g., bulky geological, industrial, or valuable art objects are to be analysed non-destructively, the size and shape of the analyte are inherently given and out of the analyst's control. As long as the homogeneity holds, the fn is still a common mass scaling factor for all gamma lines emitted from a gauge volume and cancels from eqn (3). In contrast, the fγ differs considerably for low-and high energy gammas of the same element. Only an accurate fγ(Eγ) curve makes the element masses from all n analytical lines of eqn (2) self-consistent.
The next level of complexity arises when position-sensitive PGAA measurements are performed. In the case of objects made of few distinct materials but still homogeneous at the mm scale, both fn and fγ factors are position-dependent, since geometry, composition, and material thicknesses impact the propagation of radiation differently at each measurement spot. To achieve consistent results in this analytical task, the determination of both fn and fγ is of great importance.
When the compositions of irregularly-shaped17 and/or non-homogeneous solid samples18 are to be determined, in combination with neutron imaging,19 the correction formulae for regularly-shaped homogeneous samples are no longer applicable. These challenges could be addressed only by employing Monte Carlo computer simulations.20,21 Therefore, we used as input to the simulation the structure of the measurement facility, as well as a detailed structure and orientation of the analyte.22 The geometries of the objects are either a priory known, or captured using 3D structured-light optical scanning8 or via X-ray/neutron tomography.23 The position-dependent fn and fγ correction factors are obtained from these simulation calculations and are used to correct the masses of eqn (1). This paper presents and validates this procedure using 2D and 3D structured test samples. Unlike the previous attempts,24,25 where the samples were only qualitatively or semi-quantitatively characterized, we aim here at providing a general and quantitative correction of the matrix effect in non-homogeneous analytes.
Experimental
The PGAI-NT setup
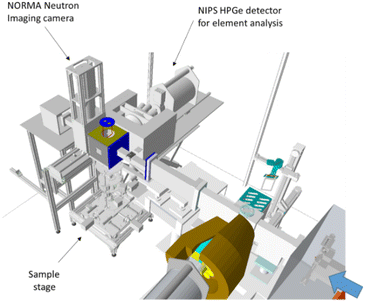
The NIPS-NORMA station of the Budapest Neutron Centre (BNC) is the first permanent and the most productive experimental station worldwide for the position-sensitive prompt-gamma measurements,26,27 and at the same time, it provides the opportunity for 2D and 3D cold-neutron imaging. This dual-purpose facility consists of a downstream-placed neutron imaging system (a green-light-emitting 6LiF/ZnS:Cu scintillator coupled to an Andor iKon-M CCD camera28), a detector assembly for element analysis (Compton-suppressed Canberra GR 2318/S n-type coaxial HPGe gamma-detector placed within a 10–15 cm thick lead shielding29), a computer-controlled xyzω sample stage and a sample chamber of 200 × 200 × 200 mm3. All of these components are aligned to the isocenter, that is the geometrical intersection of the neutron beam's axis and the midline of the gamma detector's field of view.30 The setup is visualized in Fig. 1.When switching between imaging and element analysis modes, the object is not touched, only the beam collimation is modified. This fact allows the use of a common coordinate framework for imaging, element analysis, and sample positioning, and facilitates the direct merging and the joint evaluation of the position-dependent results.
The element-analysis mode of the setup has been calibrated for point-source gamma-ray detection efficiency31 and non-linearity32 of the energy measurement. The prompt-gamma spectra were evaluated with the gamma spectrometry software Hypermet-PC33 and Hyperlab,34 while the elemental concentrations were calculated with the Excel macro ProSpeRo.12,35
Structured benchmark samples
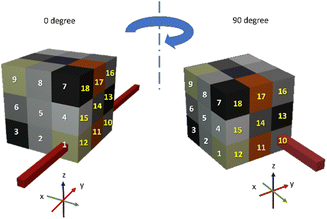
Our PGAA facility is mostly utilized in the elemental analyses of geological (whole-rock geological samples, meteorites, paleontological samples) and heritage science samples (prehistoric stone tools, obsidian cores, ceramics, bronzes, iron artifacts, as well as complex objects made of a combination of the above materials), as well as in the quality assurance of technological materials used by the industry. We have therefore chosen materials in this validation exercise to represent those relevant to the aforementioned applications, as well as the structural materials of the measurement facility, or the sample environment (e.g.: Al, Pb, PTFE).We assembled a 1 × 8 tower (2D structured) and a 3 × 3 × 3 cube (3D structured) from 7 × 7 × 7 mm3 unit cubes made of limestone (CaCO3), tile, graphite, iron, lead, tin, copper, aluminum, and PTFE. They were either pure materials or were previously analyzed by our validated PGAA analysis procedure. Each assembly was finally wrapped in Al foil and placed in the NIPS-NORMA sample chamber for analysis (Fig. 2).
In situ visualization by neutron imaging
If we do not use an a priori knowledge of the object's structure and consider it as an unknown information, neutron imaging is the first step of the analysis workflow. As the object contains several millimeters of Cu, Fe, Sn, and Pb, the conventional X-ray Computed Tomography (XT) would be unsuitable for transilluminating such objects without severe imaging artifacts. By taking advantage of the NORMA part of the setup, in situ neutron radiograms can be used to align the object relative to the impinging beam. Furthermore, the 3D mapping of the object, i.e., the neutron tomogram after noise filtering,36 contains fewer imaging artifacts than XT, and therefore it is a more suitable dataset for grayscale-based segmentation.The tomogram is a 3D matrix of attenuation coefficients, where each data point is related to the local composition, i.e., atomic density, as well as the absorption and scattering cross-sections. The tomogram is digitally represented in so-called grayscale units, ranging from 0 to 65![[thin space (1/6-em)]](https://www.rsc.org/images/entities/char_2009.gif) 565 in case of a camera with 16-bit pixel depth. In a grayscale histogram, the frequency of occurrence of each gray-level value is shown integrated over the entire dataset. The intervals around the peaks in this intensity histogram can be assigned to different materials. The data points whose grayscale values fall into one of these intervals can be selectively plotted in the 3D space. This process is called image segmentation. Based on this information, the analyst can visually distinguish and locate the different materials, and program an appropriate batch run for element analysis to obtain their compositions.
565 in case of a camera with 16-bit pixel depth. In a grayscale histogram, the frequency of occurrence of each gray-level value is shown integrated over the entire dataset. The intervals around the peaks in this intensity histogram can be assigned to different materials. The data points whose grayscale values fall into one of these intervals can be selectively plotted in the 3D space. This process is called image segmentation. Based on this information, the analyst can visually distinguish and locate the different materials, and program an appropriate batch run for element analysis to obtain their compositions.
Position-sensitive prompt-gamma activation analysis experiment
A 2.5 × 2.5 mm2 rectangular pencil beam of slow neutrons was shaped with computer-controlled slits and the object was measured in a chord geometry, where the gamma detector's field of view is larger than the object and it therefore observed all gamma rays induced along the beam path.In the case of the tower, a stepwise translation along the Z-axis was made, while an X–Z raster scan was programmed for the cube with nine measurement points (labeled as 1–9), as illustrated in Fig. 3. To generate more combinations, a second run was made where the cube object was turned 90° clockwise; these are labeled from position 10 to 18.
Monte Carlo simulations
The interactions of ionizing radiation with the matter in the above-depicted cases were modeled by the MCNP 6.2 (ref. 37) software installed on an Intel i9-7940X 3.1 GHz workstation. This Monte Carlo calculation makes use of semi-empirical physical models that describe the neutron, photon, or electron transport at the event level and a large number of computer-generated random numbers to model the interactions. The geometry of the NIPS-NORMA setup was implemented using simple CGS solids,18 whereas the sample was constructed in one case analytically using rectangular parallelepipeds, in the other case from 3D voxels, where each unit voxel was filled up with a material inferred from the 3D image segmentation.A two-step process was used17 to model the radiative neutron capture reaction by the Monte Carlo technique. At first, the 3D spatial distribution of the neutron field and the radiative neutron capture rate (i.e., the (n, γ) reaction) of the relevant isotopes were mapped, while in a second step, prompt gammas of all relevant energies were generated according to the intensity distributions of element-specific reaction capture and propagated through both the sample and the geometry of the experimental apparatus. The energy deposition in the HPGe detector crystal was recorded with an F8-type pulse-height tally (an advanced event counter of MCNP to accumulate energy-resolved histograms), resulting in the simulated PGAA spectrum.
To arrive at quantitative, energy- and position-dependent correction factors, parallel calculations on a set of “diluted samples” were also executed,17 where the macroscopic material density was reduced by a factor of 1000. These served as reference values since the modification of the transmitted neutron beam as well as the absorption of gamma rays are in this case negligible.
Results and discussion
Segmentation of the neutron tomogram and material assignment
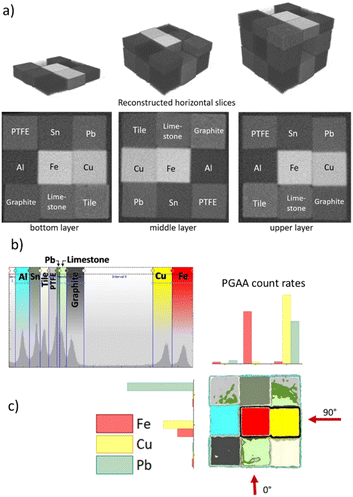
The neutron attenuation coefficients of the tomogram and three horizontal slices at the centers of each layer are visualized in the top panel of Fig. 4, where darker gray implies a smaller attenuation coefficient. Based on ranges defined in the grayscale histogram (Fig. 4b), where each interval belongs to one material, one can turn the attenuation-coefficient map into a corresponding material distribution map. This material assignment can be made based on earlier measured attenuation values of known materials18 or by correlating element analysis data taken at more than one irradiation angle. In a chord geometry, all elements that fall into the beam path (i.e., one row or one column in Fig. 4c) will produce some analytical signal. The count rates of selected peaks for elements Fe, Cu, and Pb are depicted as red, yellow, and green bars, respectively, when the object is measured with a pencil beam in its original, as well as in the 90-degree-rotated placement. The material of a unit cube that falls at the intersection of two perpendicular irradiation geometries can be recognized based on its prompt-gamma peaks present in both spectra. This position can then be linked to the tomogram based on the known offsets and rotation angles of the sample stage.The segmentation based on the grayscale intervals works perfectly for elements where the neutron capture is high and neutron scattering is small relative to the capture, while PTFE, lead, and limestone had not only low capture cross sections but also their values are by chance very similar. That makes their spatial discrimination based on the segmentation less sharp but still results in a good approximation of the true object. The resulting neutron flux distributions, the analytic and segmented-voxelized geometries, and material definitions are shown in Fig. 5, where the neutron beam enters from the right. In the future, we plan to use bimodal segmentation based on neutron and X-ray tomograms and artificial intelligence-based classification to enhance the quality of the material assignment.
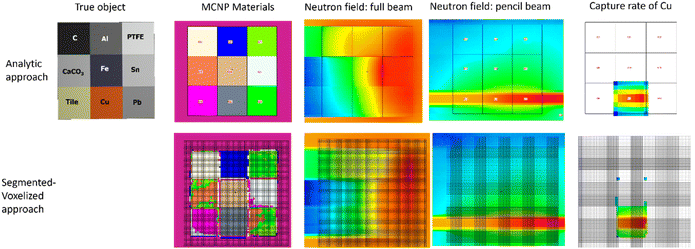 | ||
| Fig. 5 The comparison of the neutron field and the calculated elemental neutron capture reaction rates for the analytic (top row) and the segmented-voxelized (bottom row) geometry specifications within the Monte Carlo simulation software MCNP 6.2. The depicted geometry corresponds to position 6 according to the ID labels in Fig. 3. The neutrons propagate from right to left. The intensity of the neutron beam is color-coded from red (high) to blue (low). | ||
The capture rate is known to decrease exponentially with depth even within a homogeneous 7 mm unit cube, as tested in the tower arrangement. This means the uncorrected signal does not scale linearly with the material thickness.18 In the case of the cube, the capture rate of the same unit cube depends on its placement, as it is strongly influenced by the neutron absorption of all the upstream-placed material layers. Not only the absolute number of neutrons reaching the front face of that volume of interest is reduced, but also the energy distribution of the beam is shifted.38 This effect is called beam hardening and can modify the expected exponential flux profile. Our calculation does account for that also.
The gamma propagation is simulated in a subsequent step of the calculation. The correction curves for the Si, Cu, and Pb elements, representing the tile, the Cu, and the Pb unit cubes, are plotted for the segmented-voxelized (open symbols) and analytic (full symbols) geometry definitions in Fig. 6. They correspond to the pencil beam irradiation geometry of position 1 (see the top-left plot of Fig. 7a). For the tile, the potential bias has minimal impact on the result, as the major analytical lines of Si are found at high enough energies where the two curves already overlap, and the imprecision at a few hundred keV has no impact at all. For Cu, where the segmentation was perfect, the two curves agree throughout the entire energy range, so both approaches correct the intense low and high-energy lines equally well. In the case of Pb, where the largest problem was observed during the segmentation (see the orange-green-colored lower-right unit cube of Fig. 5), an overall difference of 5% was found, even at high energies. This is still far better than leaving the data uncorrected (ignoring about 20% negative bias) or using one of the inappropriate analytical correction methods suited only for homogeneous samples.
Although the unit cubes were intended to be placed randomly when assembling the test object, in fact this didn't happen. Consequently, several interesting comparisons could be made during the analysis. We present here two illustrative cases in detail which help to prove the general consistency of the results from our approach. One concerns the lead unit cube which was placed at multiple corner positions. This makes us able to validate mostly the correction of the neutron self-shielding, since the only gamma-ray of Pb is at high energy, 7368 keV, and thus less influenced by the gamma self-shielding. The other case is the iron that has always been placed in the central position, surrounded by various materials. As Fe has many analytical lines ranging from low to high gamma energies, not only the neutron correction but also the gamma-ray correction could be verified.
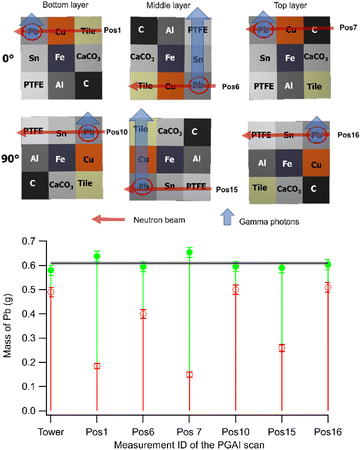
Masses of the Pb unit cubes
The relevant measurement positions for Pb are illustrated in Fig. 7a. Masses corresponding to positions where Pb is exposed to the undisturbed pencil neutron beam (positions 6, 10, and 16) yielded raw mass values close to the reference tower measurement, while in positions 1, 7, and 15, where two other unit cubes already attenuated the neutron beam before reaching the Pb unit cube, gave only about 25–33% of the raw signal intensity compared to the tower geometry.These uncorrected masses are shown in Fig. 7b with red bars. The MCNP-based correction successfully restored the coherence of the absolute masses, shown in green. The values agreed with the grand average (gray horizontal line) within one standard deviation in 5 of the 7 cases, while the two others were also just slightly overcorrected. This can be due to the beam hardening effect of the Cu or the imperfect background correction for the 800 kg of Pb making up the gamma ray shielding of the spectrometer, since in these positions the Pb cubes were closest to the lead gamma shielding.
Masses of the central Fe unit cubes
The scrutinization of the spectra corresponding to the Fe unit cube placed at the center of each layer (Fig. 8) allowed us to validate both neutron and gamma corrections in detail. There has been some inherent redundancy in the collected data (positions 2 and 8, as well as positions 11 and 17, are identical in placement, but differ in layer number).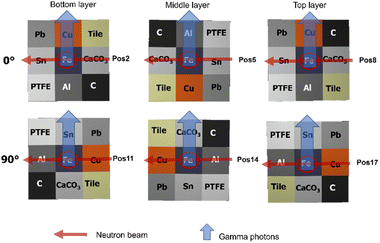 | ||
| Fig. 8 Arrangement of unit cubes for the analysis of iron. The materials exhibit different combinations of weak/strong neutron and gamma absorption properties. | ||
The corrections were again simulated using MCNP for all the relevant cases. In Fig. 9 we show separately the gamma-energy dependent raw masses (red symbols), the effect of neutron self-shielding (blue symbols), and the combined neutron and gamma corrections to the final masses (green symbols, using eqn (1) with simulated fn and fγ), for the element iron present in the tower and three cube geometries. The weighted average of the elemental mass, calculated according to eqn (2), is shown as a gray horizontal line. It is seen that although corrections up to a factor of 4–5 were required in some extreme cases, self-consistency was not only achieved within the various analytical lines of iron in one measurement position but also between the different irradiation spots of the raster scan.
The attenuation within the Fe unit cube is represented by the tower geometry. This is well-approximated when a weak neutron absorber material, i.e., the tin, was in front of the central iron cube (position 5). In positions 2 and 17, the gamma absorption was more severe due to the presence of high-Z elements (Cu and Sn) towards the direction of the detector.
General considerations
Table 1 contains the raw and corrected masses of all relevant elements, from multiple analytical lines and at different measurement positions. It is clear to see that the corrected results are in good agreement, mostly within the error margin, even if the uncorrected masses largely deviate. This is strong proof of the method's applicability.| Element | Gamma energy (keV) | Position ID | Uncorrected mass (g) | Uncertainty (±1 sigma) | f n | f γ | Corrected mass (g) | Uncertainty (±1 sigma) |
|---|---|---|---|---|---|---|---|---|
| Si (tile) | 1273 | 1 | 0.0460 | 0.0015 | 1.02 | 0.96 | 0.048 | 0.003 |
| 6 | 0.014 | 0.006 | 0.34 | 0.78 | 0.051 | 0.022 | ||
| 9 | 0.0390 | 0.0013 | 1.01 | 0.77 | 0.050 | 0.003 | ||
| 3539 | 1 | 0.0460 | 0.0013 | 1.02 | 0.97 | 0.046 | 0.003 | |
| 6 | 0.0150 | 0.0008 | 0.34 | 0.85 | 0.051 | 0.004 | ||
| 9 | 0.0410 | 0.0012 | 1.01 | 0.84 | 0.049 | 0.003 | ||
| Ca (CaCO3) (limestone) | 519 | 2 | 0.0400 | 0.0036 | 1.04 | 0.79 | 0.048 | 0.005 |
| 5 | 0.0160 | 0.0014 | 0.38 | 0.80 | 0.053 | 0.005 | ||
| 6419 | 2 | 0.048 | 0.002 | 1.04 | 0.92 | 0.050 | 0.003 | |
| 5 | 0.019 | 0.001 | 0.38 | 0.92 | 0.055 | 0.004 | ||
| Cu | 203 | 1 | 0.203 | 0.004 | 0.68 | 0.66 | 0.451 | 0.024 |
| 6 | 0.0740 | 0.0013 | 0.63 | 0.25 | 0.469 | 0.025 | ||
| 17 | 0.00300 | 0.00011 | 0.82 | 0.01 | 0.447 | 0.028 | ||
| 7915 | 1 | 0.303 | 0.007 | 0.68 | 0.91 | 0.490 | 0.027 | |
| 6 | 0.227 | 0.005 | 0.63 | 0.73 | 0.491 | 0.027 | ||
| 17 | 0.232 | 0.006 | 0.82 | 0.62 | 0.454 | 0.026 | ||
| Fe | 352 | 2 | 0.130 | 0.002 | 0.68 | 0.43 | 0.446 | 0.023 |
| 5 | 0.220 | 0.003 | 0.79 | 0.62 | 0.444 | 0.023 | ||
| 17 | 0.072 | 0.001 | 0.38 | 0.41 | 0.466 | 0.024 | ||
| 7645 | 2 | 0.227 | 0.006 | 0.68 | 0.77 | 0.434 | 0.025 | |
| 5 | 0.285 | 0.007 | 0.79 | 0.87 | 0.412 | 0.023 | ||
| 17 | 0.123 | 0.003 | 0.38 | 0.77 | 0.424 | 0.024 | ||
| Al | 1779 | 9 | 0.0890 | 0.0014 | 0.86 | 0.59 | 0.174 | 0.009 |
| 17 | 0.0360 | 0.0006 | 0.19 | 0.87 | 0.217 | 0.011 | ||
| 7723 | 9 | 0.0940 | 0.0035 | 0.86 | 0.70 | 0.155 | 0.010 | |
| 17 | 0.0350 | 0.0025 | 0.19 | 0.92 | 0.204 | 0.018 | ||
| Pb | 7368 | 1 | 0.185 | 0.011 | 0.35 | 0.83 | 0.638 | 0.050 |
| 6 | 0.400 | 0.016 | 1.04 | 0.65 | 0.595 | 0.038 | ||
| 7 | 0.150 | 0.009 | 0.28 | 0.81 | 0.654 | 0.051 | ||
| 10 | 0.500 | 0.020 | 1.03 | 0.82 | 0.596 | 0.038 | ||
| 15 | 0.260 | 0.013 | 0.68 | 0.65 | 0.590 | 0.042 | ||
| 16 | 0.510 | 0.020 | 1.03 | 0.82 | 0.604 | 0.038 | ||
| F (Teflon) | 1633 | 9 | 0.036 | 0.003 | 0.76 | 0.52 | 0.092 | 0.009 |
| 10 | 0.067 | 0.004 | 0.66 | 0.95 | 0.106 | 0.008 | ||
| 15 | 0.077 | 0.005 | 1.01 | 0.80 | 0.095 | 0.008 |
Conclusions
We established and validated a correction method for the matrix effect of PGAA caused by the neutron self-shielding and gamma self-absorption, applicable to samples made of several distinct materials. The MCNP6 simulation model of the Budapest NIPS-NORMA facility, including the characteristics of the sample and the properties of the neutron beam, was used to simulate the propagation of neutrons and neutron-induced capture gamma rays through the experimental geometry. Spatially resolved and element-specific neutron capture rates were obtained, and gamma rays were generated according to these abundances. The signals were detected with a pulse-height detector output of MCNP and were compared to a fictional non-absorbing scenario using a diluted sample to arrive at the matrix correction factors. These are finally applied to the concentration calculation procedure.To validate the calculations, we assembled a test object comprised of 3 × 3 × 3 unit cubes and nine different materials representative of the typical matrices we analyze at our PGAA lab. A raster scan with a pencil beam of neutrons was completed to collect position-dependent prompt-gamma spectra. For this benchmark sample, both the analytic and the voxelized approaches of the simulation could be tested. We concluded that for a non-homogeneous sample, the segmentation quality strongly determines the accuracy of the voxelized correction. In the case of the cube, the major difference between the voxelized and analytic approaches has been found in the localization of Pb, PTFE, and limestone, containing mainly low-cross section elements like Pb, C, F, Ca, and O, and at the same time, their grayscale values were coincidently similar. For other cases, where the contrast was high enough for a sharp segmentation, such as Cu, Fe, and Sn, they performed equally well.
This general and quantitative correction methodology broadens the scope of the PGAA technique and offers a unique way to perform non-destructive composition analysis of complex, non-homogeneous real-world samples, mostly in the fields of archaeometry, circular economy, and operando measurements of industrial devices, such as fuel cells.
Author contributions
Conceptualization, methodology, writing – original draft preparation, visualization, supervision, project administration, funding acquisition: L. Sz.; formal analysis, visualization, investigation, data curation, writing – review and editing: B. M.; software, formal analysis, investigation, data curation, writing – review and editing: Z. K.Conflicts of interest
There are no conflicts to declare.Acknowledgements
We gratefully acknowledge the financial support of the János Bolyai Research Fellowship of the Hungarian Academy of Sciences for L. S., and the Project K124068 of the National Research, Development and Innovation Fund of Hungary. We are thankful to Gábor Benyács for machining the unit cubes for the experiment. The authors thank Jesse L. Weil for his careful proofreading.References
- S. Carter, R. Clough, A. Fisher, B. Gibson and B. Russell, Atomic Spectrometry Update: Review of Advances in the Analysis of Metals, Chemicals and Materials, J. Anal. At. Spectrom., 2021, 36, 2241–2305 RSC.
- R. L. Paul and R. M. Lindstrom, Prompt gamma-ray activation analysis: Fundamentals and applications, J. Radioanal. Nucl. Chem., 2000, 243, 181–189 CrossRef CAS.
- Handbook of Prompt Gamma Activation Analysis, ed., G. L. Molnár, Kluwer Academic Publishers, Dordrecht, Boston, London, 2004 Search PubMed.
- H. Postma, R. C. Perego, P. Schillebeeckx, P. Siegler and A. Borella, Neutron resonance capture analysis and applications, J. Radioanal. Nucl. Chem., 2007, 271, 95–99 CrossRef CAS.
- P. Schillebeeckx and H. Postma, Neutron Resonance Analysis Methods for Archaeological and Cultural Heritage Applications, Handbook of Cultural Heritage Analysis, 2022, pp. 145–187 Search PubMed.
- H. Postma and P. Schillebeeckx, Non-destructive analysis of objects using neutron resonance capture, J. Radioanal. Nucl. Chem., 2005, 265, 297–302 CrossRef CAS.
- H. Postma and P. Schillebeeckx, in Encyclopedia of Analytical Chemistry, John Wiley & Sons, Ltd, Chichester, UK, 2009 Search PubMed.
- L. Szentmiklósi, B. Maróti, Sz. Csákvári and T. Calligaro, Position-Sensitive Bulk and Surface Element Analysis of Decorated Porcelain Artifacts, Materials, 2022, 15, 5106 CrossRef PubMed.
- R. R. Greenberg, P. Bode and E. A. De Nadai Fernandes, Neutron activation analysis: A primary method of measurement, Spectrochim. Acta, Part B, 2011, 66, 193–241 CrossRef CAS.
- N. Bohr, Neutron Capture and Nuclear Constitution, Nature, 1936, 137, 344–348 CrossRef CAS.
- Z. Révay, R. B. Firestone, T. Belgya and G. L. Molnár, in Handbook of Prompt Gamma Activation Analysis, ed. G. L. Molnár, Kluwer Academic Publishers, Dordrecht, Boston, London, 2004, pp. 173–364 Search PubMed.
- Z. Révay, Calculation of uncertainties in prompt gamma activation analysis, Nucl. Instrum. Methods Phys. Res., Sect. A, 2006, 564, 688–697 CrossRef.
- P. Bode, Kilogram Sample Analysis by Nuclear Analytical Techniques: Complementary Opportunities for the Mineral and Geosciences, Minerals, 2021, 11, 443 CrossRef CAS.
- P. Kudejova, Z. Révay, K. Kleszcz, C. Genreith and M. Rossbach, High-flux PGAA for milligram-weight samples, EPJ Web Conf., 2015, 93, 08001–08002 CrossRef.
- M. Blaauw, I. H. Degenaar, C. Yonezawa, H. Matsue and J. J. M. de Goeij, Validation experiment for large-sample prompt-gamma neutron activation analysis, J. Radioanal. Nucl. Chem., 2007, 271, 745–750 CrossRef CAS.
- E. A. Mackey, G. E. Gordon, R. M. Lindstrom and D. L. Anderson, Effects of target shape and neutron scattering on element sensitivities for neutron-capture prompt .gamma.-ray activation analysis, Anal. Chem., 1991, 63, 288–292 CrossRef CAS PubMed.
- L. Szentmiklósi, Z. Kis, B. Maróti and L. Z. Horváth, Correction for neutron self-shielding and gamma-ray self-absorption in prompt-gamma activation analysis for large and irregularly shaped samples, J. Anal. At. Spectrom., 2021, 36, 103–110 RSC.
- L. Szentmiklósi, B. Maróti and Z. Kis, Prompt-gamma activation analysis and neutron imaging of layered metal structures, Nucl. Instrum. Methods Phys. Res., Sect. A, 2021, 1011, 165589 CrossRef.
- L. Szentmiklósi, Z. Kis and B. Maróti, in Handbook of Cultural Heritage Analysis, ed. S. D'Amico and V. Venuti, Springer, 2022, vol. 1, pp. 239–272 Search PubMed.
- I. Lux and L. Koblinger, Monte Carlo Particle Transport Methods, CRC Press, 1991 Search PubMed.
- T. Nicol, C. Carasco, B. Perot, J. L. Ma, E. Payan, E. Mauerhofer, A. Havenith and J. Collot, Quantitative comparison between PGNAA measurements and MCNPX simulations, J. Radioanal. Nucl. Chem., 2016, 308, 671–677 CrossRef CAS.
- T. Goorley, M. James, T. Booth, F. Brown, J. Bull, L. J. Cox, J. Durkee, J. Elson, M. Fensin, R. A. Forster, J. Hendricks, H. G. Hughes, R. Johns, B. Kiedrowski, R. Martz, S. Mashnik, G. McKinney, D. Pelowitz, R. Prael, J. Sweezy, L. Waters, T. Wilcox and T. Zukaitis, Features of MCNP6, Ann. Nucl. Energy, 2016, 87, 772–783 CrossRef CAS.
- L. Szentmiklósi, Z. Kis, M. Tanaka, B. Maróti, M. Hoshino and K. Bajnok, Revealing hidden features of a Japanese articulated iron lobster via non-destructive local elemental analysis and 3D imaging, J. Anal. At. Spectrom., 2021, 36, 2439–2443 RSC.
- Z. Kis, T. Belgya, L. Szentmiklósi, Zs. Kasztovszky, P. Kudejová and R. Schulze, Prompt gamma activation imaging on ‘black boxes’ in the ’Ancient Charm’project, Archeometriai Műhely, 2008, 1, 41–60 Search PubMed.
- D. Hei, W. Jia, C. Cheng, Z. Yao, Q. Shan, Y. Ling and Y. Gao, Feasibility study of fast neutron-induced gamma ray imaging of large sample based on D-T neutron generator, Nucl. Instrum. Methods Phys. Res., Sect. B, 2021, 492, 7–14 CrossRef CAS.
- T. Belgya, Z. Kis, L. Szentmiklósi, Z. Kasztovszky, P. Kudejova, R. Schulze, T. Materna, G. Festa and P. A. Caroppi, First elemental imaging experiments on a combined PGAI and NT setup at the Budapest Research Reactor, J. Radioanal. Nucl. Chem., 2008, 278, 751–754 CrossRef CAS.
- T. Belgya, Z. Kis, L. Szentmiklósi, Z. Kasztovszky, G. Festa, L. Andreanelli, M. P. De Pascale, A. Pietropaolo, P. Kudejova, R. Schulze and T. Materna, A new PGAI-NT setup at the NIPS facility of the Budapest Research Reactor, J. Radioanal. Nucl. Chem., 2008, 278, 713–718 CrossRef CAS.
- Z. Kis, L. Szentmiklósi and T. Belgya, NIPS–NORMA station—A combined facility for neutron-based nondestructive element analysis and imaging at the Budapest Neutron Centre, Nucl. Instrum. Methods Phys. Res., Sect. A, 2015, 779, 116–123 CrossRef CAS.
- L. Szentmiklósi, Z. Kis, T. Belgya and A. N. Berlizov, On the design and installation of a Compton–suppressed HPGe spectrometer at the Budapest neutron-induced prompt gamma spectroscopy (NIPS) facility, J. Radioanal. Nucl. Chem., 2013, 298, 1605–1611 CrossRef.
- R. Schulze, L. Szentmiklósi, P. Kudejova, L. Canella, Z. Kis, T. Belgya, J. Jolie, M. Ebert, T. Materna, K. T. Biró and Z. Hajnal, The ANCIENT CHARM project at FRM II: Three-dimensional elemental mapping by prompt gamma activation imaging and neutron tomography, J. Anal. At. Spectrom., 2013, 28, 1508–1512 RSC.
- G. L. Molnár, Z. Révay and T. Belgya, Wide energy range efficiency calibration method for Ge detectors, Nucl. Instrum. Methods Phys. Res., Sect. A, 2002, 489, 140–159 CrossRef.
- B. Fazekas, Zs. Révay, J. Östör, T. Belgya, G. Molnár and A. Simonits, A new method for determination of gamma-ray spectrometer non- linearity, Nucl. Instrum. Methods Phys. Res., Sect. A, 1999, 422, 469–473 CrossRef CAS.
- Z. Révay, T. Belgya and G. L. Molnár, Application of Hypermet-PC in PGAA, J. Radioanal. Nucl. Chem., 2005, 265, 261–265 CrossRef.
- A. Simonits, J. Östör, S. Kálvin and B. Fazekas, HyperLab: A new concept in gamma-ray spectrum analysis, J. Radioanal. Nucl. Chem., 2003, 257, 589–595 CrossRef CAS.
- Z. Révay, Determining Elemental Composition Using Prompt γ Activation Analysis, Anal. Chem., 2009, 81, 6851–6859 CrossRef PubMed.
- C. Carminati, M. Strobl and A. Kaestner, KipTool, a general purpose processing tool for neutron imaging data, SoftwareX, 2019, 10, 100279 CrossRef.
- C. J. Werner, J. Armstrong, F. B. Brown, J. S. Bull, L. Casswell, L. J. Cox, D. Dixon, R. A. Forster, J. T. Goorley, H. G. Hughes, J. Favorite, R. Martz, S. G. Mashnik, M. E. Rising, C. Solomon, A. Sood, J. E. Sweezy, C. J. Werner, A. Zukaitis, C. Anderson, J. S. Elson, J. W. Durkee, R. C. Johns, G. W. McKinney, G. E. McMath, J. S. Hendricks, D. B. Pelowitz, R. E. Prael, T. E. Booth, M. R. James, M. L. Fensin, T. A. Wilcox and B. C. Kiedrowski, MCNP User's Manual Code Version 6.2, LA-UR-17-29981, LosAlamos National Laboratory, 2017, p. 746 Search PubMed.
- M. Maeda, M. Segawa, Y. Toh, S. Endo, S. Nakamura and A. Kimura, Effect of sample density in prompt γ-ray analysis, Sci. Rep., 2022, 12, 6287 CrossRef PubMed.
| This journal is © The Royal Society of Chemistry 2023 |

