 Open Access Article
Sequential speciation analysis of heavy metals on suspended particulate matter in water using electrochemical mass spectrometry†
Xinglei
Zhang
,
Yuan
Xu
,
Ting
Li
 ,
Hui
Li
,
Zhendong
Yu
,
Lili
Song
* and
Jiaquan
Xu
,
Hui
Li
,
Zhendong
Yu
,
Lili
Song
* and
Jiaquan
Xu
 *
*
Jiangxi Key Laboratory for Mass Spectrometry and Instrumentation, East China University of Technology, Nanchang 330013, P. R. China. E-mail: jiaquan_xu@foxmail.com; lilisong_1981@foxmail.com
First published on 10th February 2023
Abstract
Speciation analysis of heavy metals in suspended particulate matter (SPM) in water helps evaluate health risks, understand pollution status, trace pollution sources, and select a remediation approach. In this study, electrochemical mass spectrometry (EC-MS), which combines extraction, reaction and electrolysis with in situ electrospray ionization mass spectrometry (ESI-MS), is established to directly analyze heavy metal speciations in SPM. The samples were first collected in a homemade electrolytic cell by filtration, followed by sequential extraction. Water and methanol were first used to extract water-soluble and organic metal speciations, respectively. EDTA-2Na was used to react with the insoluble metal to form a soluble EDTA-metal chelate. For elemental speciation, electrolysis was used to convert them into metal ions. The extracted speciations were online and transferred to ESI for ionization. Four kinds of speciations, including water-soluble, organic, insoluble, and elemental could be detected in 1 hour with high sensitivity. A proof-of-concept application was carried out to sequentially analyze metal speciation in the SPM in a lake. The experimental results indicated that the SPM from the lake water contained Zn, Cu, Mn, Pb, and Fe in a water-soluble state, Pb, Zn, Cu, and Ni were in an insoluble state, and no heavy metals in organic and elemental states were found. Compared with the traditional methods, this method featured no complex matrix separation process, less sample consumption, and high analysis throughput, offering unique possibilities for advanced applications in environmental monitoring and risk assessment.
1 Introduction
Heavy metal is a kind of typical pollutant in water that can cause serious health risks.1–3 Suspended particulate matter (SPM) in water is an important carrier for heavy metals,4 such as microplastics,5,6 ferrihydrites,7,8etc. The metals on the SPM can exist in different species forms, such as water-soluble, organic, insoluble, and elemental forms. Information on speciation can reveal toxicity, mobility, bioavailability, and transformation of heavy metals.9 For example, water-soluble and organic Pb are more toxic than the insoluble Pb. Moreover, when environmental conditions change, specific speciation can desorb and suspend sediments and cause secondary pollution.10 Therefore, speciation analysis of heavy metals on SPM helps evaluate health risks, understand pollution status, trace pollution sources, and develop processes to mitigate the effects of pollution.Generally, speciation analysis involves sample pretreatment and instrumental analysis. Metal compounds were first extracted from the SPM using various chemical reagents to form analytes. Then, chromatography techniques, including gas chromatography (GC),11 high-performance liquid chromatography (HPLC),12 supercritical fluid chromatography (SFC),13 capillary electrophoresis (CE)14,15 and size exclusion chromatography (SEC),16 were used to identify speciation using retention time, followed by coupling to ICP-MS17,18 for quantitative analysis and ESI-MS19 for structural analysis, which required expensive instruments and complex operation. On the other hand, offline separation techniques have also been widely used in metal speciation analysis, such as multi-stage continuous extraction methods (Tessier,20 BCR21) and solid phase extraction methods.22,23 Based on different chemical activities of heavy metals, through a series of reagents with different chemical reactivities, heavy metals of different speciations in the SPM were extracted step by step based on the order of the reaction strength between metals and reagents. However, these multi-stage extraction methods were coupled with ICP-MS, which could not obtain the molecular structure of organic metal compounds. Each method has unique advantages, but it is noteworthy that most of the aforementioned methods require complicated sample preparation and separation processes, which increase analytical errors and lengthen analysis time. Moreover, these methods cannot be used for analyzing inorganic and organic metal compounds simultaneously.
Herein, an electrochemical mass spectrometry (EC-MS) method was developed for the sequential analysis of metal speciation on SPM by combining online sequential extraction and ESI-MS analysis. Water-soluble, organic, insoluble, and elemental species were sequentially extracted by H2O, CH3OH, EDTA-2Na, and electrolysis, followed by online transfer to ESI for ionization. The most prominent feature of the present method was that no sample pre-treatment was required, and only simple instrumentation was needed, resulting in a fast and low analysis cost.
2 Experimental section
2.1 Chemicals and measurements
Lead nitrate (Pb(NO3)2), trimethyllead chloride ((CH3)3PbCl, TML), potassium carbonate (K2CO3), and EDTA-2Na are all analytically pure and purchased from Sinopharm (China). Both acetonitrile and methanol were of HLPC grade and were purchased from Fisher Scientific and Merck (America), respectively. Poly(3,4-ethylenedioxythiophene)-poly(styrene sulfonate) (PEDOT:PSS) with a conductivity of 200 s cm−1 was purchased from Cool Chemistry Technology Co., Ltd (Beijing). A polytetrafluoroethylene filter membrane with a 13 mm diameter and 0.22 μm aperture was purchased from Tianjin Jinteng Co., Ltd Deionized water used for the experiments was produced using a Millipore ultrapure water system.The experiments were performed on an LTQ-MS instrument (Thermo Scientific). The flow rate of the standard solution was 4.0 μL min−1 supplied by a syringe pump. The same flow rate was used elsewhere in this study. The mass spectrometry conditions when detecting inorganic metal ions in negative ion mode: ion source voltage/−3 kV, capillary temperature/250 °C, capillary voltage/−30 V, and lens voltage/−100 V. Mass spectrometry conditions for detecting organic lead in positive ion mode: ion source voltage/3 kV, capillary temperature/250 °C, capillary voltage/20 V, and lens voltage/90 V. CHI 660E electrochemical workstation (Shanghai Chenhua Instrument Co., Ltd).
2.2 Preparation of the calibration curve for TML and Pb2+
Standard solution: Pb(NO3)2 was used as the source of Pb2+. A series of working solutions of Pb2+ with different concentrations (1 ppb, 10 ppb, 20 ppb, 50 ppb, 100 ppb, 200 ppb, 500 ppb) was prepared in 0.05 mM EDTA of H2O/CH3CN (v/v = 1/1) solution. A series of working solutions of TML with various concentrations (1 ppb, 10 ppb, 20 ppb, 50 ppb, 100 ppb, 200 ppb, 500 ppb) was prepared in CH3OH/H2O (v/v = 1/1).2.3 Preparation of the artificial miscellaneous Pb compound
An artificial sample containing different speciations of lead components (water-soluble (Pb(NO3)2), organic (TML), insoluble (PbCO3), and elemental (Pb)) was prepared on a conductive film. The conductive film was prepared by coating the PTFE filter member with 5% PEDOT:PSS via filtering. The sheet resistance of the conductive film was 1000 Ω. Elemental Pb was first prepared by the electrochemical deposition method using Pb(NO3)2 solution as the electrolyte, and the mass of the elemental Pb was calculated to be 0.6 ng based on the quantity of electricity m = M × I × t/e, where M is the molar mass of Pb, I is the faradaic current of electrochemical deposition, t is the duration of electrochemical deposition, and e is the electricity quantity of electron (1.602 × 10⁻¹⁹). Add excess Pb(NO3)2 solution to the quantitative K2CO3 solution to make K2CO3 react with Pb(NO3)2 to obtain insoluble PbCO3; excess Pb(NO3)2 is reserved as soluble Pb(NO3)2. Simultaneously, the solution was mixed with an appropriate amount of TML solution, and the mixed droplets were naturally dried on the conducted film to obtain mixed samples of insoluble (0.3 ng), water-soluble (0.2 ng) and organic lead (0.2 ng) components. Then, conductive film loaded with artificial standard mixtures was assembled in a homemade electrolytic cell for analysis.2.4 Lake water sample collection
The study was conducted between February and May 2022. Water containing suspended particulates came from an artificial lake on the campus of the East China University of Technology. The sampling site was near the shore of the lake. A 500 mL water sample was collected at a depth of about 0.5 m and then left to stand for 24 h before analysis.2.5 Sequential speciation analysis
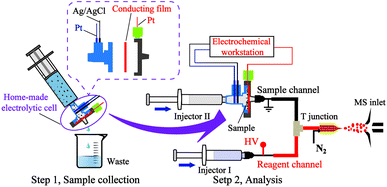
Fig. 1 depicts the experimental protocol for the sequential analysis of metal speciation in SPM in water. An electrolytic cell was designed for particulate sampling and analysis, as shown in Fig. 1, and marked with a purple solid line ellipse. An explosive view of the homemade electrolytic cell is shown in the inset of the figure. It comprises 3 key components. (1) A shell could be attached between the syringe and the needle. The shell was made of Teflon to resist oxidation and chemical corrosion. (2) A conductive film has the functions of filtering and conducting electricity. (3) Three electrodes, one Ag/AgCl and two Pt were employed as reference, counter, and working electrodes, respectively. Among them, the working electrode was connected to the conductive film. The EC-MS device used in this experiment mainly included three parts: sample channel, reagent channel, and electrospray ion source. The sample channel comprised injection needle II, the electrolytic cell and the electrochemical workstation. To avoid the interference of electrolysis from the ion source voltage, the sample channel was grounded. The reagent channel comprised injection needle I and a capillary tube (100 μm inner diameter). The sample channel and reagent channel were connected to the electrospray ionization (ESI) using a “T” junction.The electrolytic cell was first connected to a syringe containing a water sample (volume of 5 mL). The particulates suspended in the water sample were gathered on the conductive film of the electrolytic cell by filtration. The water waste was discharged into a glass beaker. After the collection of the SPM, the electrolytic cell was assembled in the EC-MS device.
The sequential speciation analysis was carried out as follows: (1) water-soluble speciation analysis: H2O was used as an extraction solvent in the sample channel to extract the water-soluble speciation, followed by reacting with EDTA-2Na from the reagent channel in the “T” junction to form EDTA-metal chelate. The chelate was transferred online to the ESI-MS. (2) Organic speciation analysis: CH3OH was used as an extraction solvent in the sample channel to extract the organic speciation, followed by mixing with charged CH3OH from the reagent channel in the “T” junction. The mixture was then transferred online to the ESI-MS. (3) Insoluble speciation analysis: EDTA-2Na was used as a reactant to react with insoluble speciation by chelation, followed by mixing with charged EDTA-2Na from the reagent channel in the “T” junction. The mixture was then transferred online to the ESI-MS. (4) Elemental speciation analysis: +0.8 V voltage was applied to the conductive membrane to transform the elements into ions using EDTA-2Na as an electrolyte. The produced metal ions reacted in situ with EDTA-2Na to form EDTA-metal chelate, followed by mixing with charged EDTA-2Na from the reagent channel in the “T” junction. The mixture was transferred online to ESI-MS.
3 Results and discussion
3.1 Qualitative detection of Pb components in different speciations by EC-MS
To characterize the analytical performance of this method for different speciations of heavy metals, Pb components were first selected as probe substances. Pb(NO3)2, TML, PbCO3, and Pb were used as water-soluble, organic, insoluble, and elemental speciations, respectively. Four kinds of Pb speciations were deposited on the conductive membrane. The analytical procedure is detailed in the experimental section.Fig. 2a shows the analytical results of the water-soluble speciation (Pb(NO3)2). Obvious signals of m/z 145 [EDTA-2H]2−, m/z 248 [Pb208 + EDTA-4H]2− and m/z 291 [EDTA-H]− were observed. A collision-induced dissociation (CID) experiment was performed on m/z 248 to confirm the signal of the EDTA-Pb compound. The MS/MS results are shown in the inset of Fig. 2a, which yielded characteristic fragments of m/z 452 [Pb208 + EDTA-4H–CO2]− by the loss of CO2 and m/z 408 [Pb208 + EDTA-4H–2CO2]− by the loss of two CO2 molecules. Similar results were also obtained for water-soluble Mn, Ni, Cu, and Zn compound (Fig. S1†). Characteristic fragments of m/z 299 [Mn55 + EDTA-4H–CO2]−, m/z 302 [Ni58 + EDTA-4H–CO2]−, m/z 307 [Cu63 + EDTA-4H–CO2]−, m/z 308 [Zn64 + EDTA-4H–CO2]− by a loss of CO2 and m/z 255 [Mn55 + EDTA-4H–2CO2]−, m/z 258 [Ni58 + EDTA-4H–2CO2]−, m/z 263 [Cu63 + EDTA-4H–2CO2]−m/z 264 [Zn64 + EDTA-4H–2CO2]− by loss of two CO2 were obtained (Fig. S1†). This agrees with the literature, which reported a sequential loss of CO2 from EDTA-metal with MS/MS experiments.24,25Fig. 2b shows the analytical results for organic Pb (TML). Obvious signals of m/z 251 [Pb206(CH3)3]+ and m/z 253 [Pb208(CH3)3]+ were observed in the spectrum. The MS/MS result of the ion m/z 253 is shown in the inset of Fig. 2b. The resulting fragment ion was m/z 223 [Pb208CH3]+via a neutral loss of two CH3. Insoluble metal compounds, such as PbCO3, were insoluble in water and organic solvents. In this study, taking advantage of the high stability of the metal–organic complexes formed by the chelation of EDTA and Pb, EDTA-2Na was used to dissolve PbCO3 by forming an EDTA-Pb chelate. Obvious m/z 145 [EDTA-2H]2−, m/z 248 [Pb208 + EDTA-4H]2− and m/z 291 [EDTA-H]− are shown in Fig. 2c, indicating that the insoluble speciation PbCO3 was successfully detected. For metal elements, electrolysis was used to transform the elemental metals into metal ions because H2O, CH3OH, and EDTA-2Na could not dissolve the elemental speciation. The produced metal ion reacted with EDTA-2Na in the electrolyte in situ to form the EDTA-metal compound. Fig. 3d depicts the analytical results of elemental Pb. Obvious m/z 145 [EDTA-2H]2−, m/z 248 [Pb208 + EDTA-4H]2− and m/z 291 [EDTA-H]− were observed, indicating that the elemental speciation Pb was successfully detected. In summary, the experimental results showed that the present device and method could be used for the analysis of water-soluble, organic, insoluble, and elemental metals.
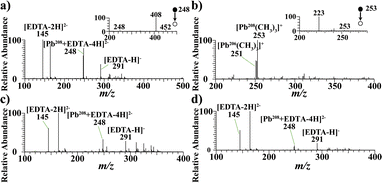 | ||
| Fig. 2 Mass spectra of Pb components in different speciations analyzed by EC-MS. (a) (Pb(NO3)2), (b) TML, (c) PbCO3 and (d) Pb. The insets were the MS/MS spectrum of the isolated ions. | ||
3.2 Quantitative detection of Pb components in different speciations by EC-MS
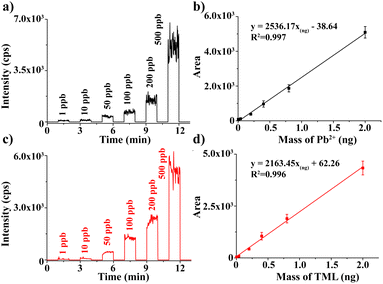
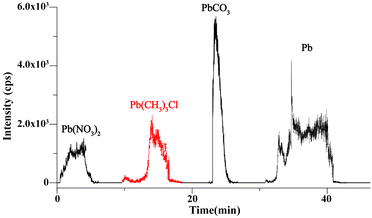
The quantitative performance of the present method was investigated by preparing calibration curves for Pb2+ and TML. A series of Pb(NO3)2 and TML solutions with different concentrations were prepared, and then the characteristic peaks of [Pb208 + EDTA-4H]2− and [Pb208CH3]+ were used as the quantitative ions for Pb2+ and TML, respectively. The EIC of m/z 408 [Pb208 + EDTA-4H–2CO2]− and m/z 223 [Pb208CH3]+ with different concentrations are shown in Fig. 3a and c, respectively. The mass of ions in the standard solution was calculated using the formula m = c × v × t × M, where “c” is the concentration of the ions, “v” is the injection flow rate (4 μL min−1), “t” is the injection duration (about 1 min), and “M” is the molar mass of Pb2+ or TML. The EIC areas of different concentrations of [Pb208 + EDTA-4H–2CO2]− and [Pb208CH3]+ were calculated by applying the integration method in Origin 9.0 software. Then, two calibration curves (EIC area vs. mass) of Pb2+ and TML are plotted in Fig. 3b and d with the calibration equations, respectively. A wide linear response range of 4.0 pg to 2.0 ng with R2 > 0.99 was obtained for Pb2+ and TML. The LODs of metal ions obtained by this method were calculated using the following equation: LOD = 3σ/a, where the “σ” is the standard deviation of the blank solution (n = 3) and “a” is the slope of the standard curve. Therefore, the LODs were calculated to be 0.215 ppb for Pb2+ and 0.048 ppb for TML. A remarkable sensitivity of Pb ion detection was provided by the proposed method, showing its potential application in the analysis of trace levels of Pb in different speciations.Furthermore, the recovery of the present method in the analysis of different Pb speciations was experimentally evaluated. An artificial miscellaneous sample containing water-soluble (Pb(NO3)2, 0.2 ng), organic (TML, 0.2 ng), insoluble (PbCO3, 0.3 ng), and elemental (Pb, 0.6 ng) speciations, was prepared and analyzed sequentially (as detailed in the Experimental section). The experimental results are shown in Fig. 4. In the range of 0–5 min, deionized water was added to the sample channel, and the EIC of m/z 408 [Pb208 + EDTA-4H–2CO2]− was selected, which reflected the soluble Pb(NO3)2 dissolution. When the signal dropped to the baseline, CH3OH was used as an eluent, and the EIC of m/z 223 [Pb208CH3]+ was selected to monitor the TML in the period of 10–17 min. Similarly, when the organic component signal disappeared, 0.05 mM EDTA-2Na (H2O/CH3CN (v/v = 1/1) was used as the eluent, and m/z 408 [Pb208 + EDTA-4H–2CO2]− ion was chosen to monitor the signal of PbCO3 (23–26 min). Finally, EDTA-2Na in the sample channel was employed as an electrolyte. The electrodes in the electrolytic cell were connected to the electrochemical workstation, and +0.8 V was applied to transform Pb into Pb2+. The EIC of m/z 408 [Pb208 + EDTA-4H–2CO2]− was observed in 30–41 min. Based on the EIC (Fig. 4) area and calibration curves (Fig. 3), the recoveries of Pb(NO3)2), TML, PbCO3, and Pb were calculated to be 96.2%, 97.1%, 85.3%, and 86.7%, respectively. The results demonstrated that four kinds of Pb speciations in a miscellaneous sample could be detected sequentially with high accuracy and high analysis speed.
3.3 EC-MS analysis of the practical sample
In this study, SPM gathered from lake water was selected to estimate water pollution. As shown in Fig. 5a, when water was used as the extractant, signals of m/z 171.5 [Mn + EDTA-4H]2−, m/z 175.5 [Cu + EDTA-4H]2−, m/z 176 [Zn + EDTA-4H]2−, m/z 248 [Pb + EDTA-4H]2− and m/z 344 [Fe + EDTA-4H]− were obtained. This implies that there was soluble Mn, Cu, Zn, Pb, and Fe in the suspended particles. Fig. 5b illustrates the EIC of the metals. After the water-soluble substances were completely dissolved, the extraction agent was replaced with methanol. The organic metal compound was extracted and detected in positive ion mode. No obvious signal of organic heavy metals was found. After the extractant was replaced with a 0.05 mM EDTA-2Na (H2O/CH3CN (v/v = 1/1)) solution, the insoluble metal compounds were dissociated. Signals of m/z 175.5 [Cu + EDTA-4H]2−, m/z 176 [Zn + EDTA-4H]2−, m/z 173 [Ni + EDTA-4H]2− and m/z 248 [Pb + EDTA-4H]2− were obtained (Fig. 5c and d), implying that the existence of insoluble Cu, Zn, Ni, Pb ions appeared in the sample. The speciation of metals in an aqueous environment strongly depends on the composition of the water.26 Inorganic species, such as CO32−, SO42−, Cl−, NO3−, or PO43−, can easily interact with metals.27 Finally, when the sample was treated with electrolysis, no obvious metal signal was found (Fig. S2†).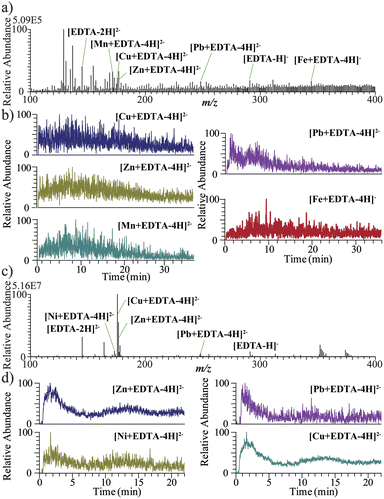 | ||
| Fig. 5 EC-MS analysis of the suspended particulate matter in the lake water sample. Mass spectra of the metals and the corresponding EIC when H2O (a, b) and EDTA-2Na (c, d) were used as solvents. | ||
To validate the analytical ability of EC-MS, a national standard method for offline ICP-MS (Table S1†) was performed to detect the water-soluble and insoluble metal mass of the particulate suspended samples. The preparation of the sample for ICP-MS analysis is provided in the ESI.† For comparison, the EIC area of the metals in suspended particulate matter obtained by EC-MS analysis was calculated using OriginLab software, as shown in Table S2.† This demonstrated that the presented EC-MS method basically agreed with the standard method.
4 Conclusions
In summary, we reported an EC-MS for the sequential analysis of metal speciation in SPM in water. This method features high sensitivity (LOD of 0.048 ppb for TML), online separation of metal components in different speciations with excellent recoveries (>85%), high throughput, and low sample consumption (water sample of 5 mL). By utilizing this method, Mn, Cu, Zn, Pb, Ni, and Fe compounds in the particulates were detected successfully. Our results demonstrate that the present method is a promising method for the speciation analysis of heavy metals in particulates with regard to the occurrence of metal pollution in environmental monitoring and other areas.Conflicts of interest
There are no conflicts to declare.Acknowledgements
This work was financially supported by the National Natural Science Foundation of China (No. 21727812, 21864001, 21705016 and 22264001).References
- R. L. Ma, M. Jin and Y. Tian, J. Anal. Test., 2017, 1, 11 CrossRef.
- A. Rolisola, C. A. Suarez and A. A. Menegario, et al. , Analyst, 2014, 139, 4373–4380 RSC.
- T. Sahraeian, H. Sereshti and A. Rohanifar, J. Anal. Test., 2018, 2, 98–105 CrossRef.
- A. Gogoi, G. G. Tushara Chaminda, A. K. J. An, D. D. Snow, Y. Li and M. Kumar, Chemosphere, 2016, 163, 322–333 CrossRef CAS PubMed.
- X. Chen, S. Ali, L. Yuan, F. Guo, G. Huang and W. Shi, Chemosphere, 2022, 287, 132172 CrossRef CAS PubMed.
- H. Richard, E. J. Carpenter, T. Komada, P. T. Palmer and C. M. Rochman, Sci. Total Environ., 2019, 683, 600–608 CrossRef CAS PubMed.
- Z. Liu, Y. Lu and X. Duan, Int. J. Environ. Anal. Chem., 2020, 3, 1–15 Search PubMed.
- G. Sun, F. Fu and B. Tang, Chemosphere, 2022, 291, 132791 CrossRef CAS PubMed.
- A. J. Borrill, N. E. Reily and J. V. Macpherson, Analyst, 2019, 144(23), 6834–6849 RSC.
- C. Feng, X. Guo, S. Yin, C. Tian, Y. Li and Z. Shen, Chemosphere, 2017, 185, 717–725 CrossRef CAS PubMed.
- Z. F. Wang and Z. J. Cui, Chin. Chem. Lett., 2016, 27(2), 241–246 CrossRef CAS.
- H. Rekhi, S. Rani, N. Sharma and A. K. Malik, Crit. Rev. Anal. Chem., 2017, 47(6), 524–537 CrossRef CAS PubMed.
- V. Garcia-Montoto, P. Denti, L. Malmquist, S. Verdier, B. Bouyssiere and J. H. Christensen, J. Anal. At. Spectrom., 2020, 35(12), 2852–2858 RSC.
- L. Liu, Z. Yun, B. He and G. Jiang, Anal. Chem., 2014, 86(16), 8167–8175 CrossRef CAS PubMed.
- D. D. Cao, Y. G. Yin and B. He, Chin. Chem. Lett., 2019, 30(3), 650–652 CrossRef CAS.
- L. Dong, Y. Lai, S. Yu and J. F. Liu, Anal. Chem., 2019, 91(19), 12525–12530 CrossRef CAS PubMed.
- M. Monika and B. Danuta, Talanta, 2016, 161, 177–204 CrossRef PubMed.
- J. Q. Yang, Y. W. Chen, K. L. Shi, K. S. Hu, R. Li, X. Q. Gao, Q. Wang, W. B. Zhang, Y. Zhou, Y. Y. Wang, J. G. He, T. H. Liu and X. L. Hou, Chin. Chem. Lett., 2022, 33(7), 3444–3450 CrossRef CAS.
- M. S. Espinosa, R. Servant and P. A. Babay, Microchem. J., 2018, 142, 352–358 CrossRef CAS.
- J. Burlakovs, W. Hogland, Y. Jani, M. Klavins and L. Ferrans, Chemosphere, 2021, 263, 128105 CrossRef PubMed.
- W. Bao, B. Huang and B. Q. Yan, et al. , Chin. Chem. Lett., 2012, 11, 1287–1290 Search PubMed.
- A. Ricardo, F. Abujaber and F. Bernardo, et al. , Trends Environ. Anal. Chem., 2020, 27, e00097 CrossRef.
- C. Herrero-Latorre, J. Barciela-García, S. García-Martín and R. M. Pea-Crecente, Anal. Chim. Acta, 2018, 1002, 1–17 CrossRef CAS PubMed.
- H. Zhang, N. Li, Y. Y. Wang, D. D. Zhao, J. He, H. You and J. Jiang, Chemosphere, 2017, 184, 932–938 CrossRef CAS PubMed.
- L. Zheng, D. G. Watson, J. N. A. Tettey and C. A. Clements, Talanta, 2008, 76, 1165–1169 CrossRef CAS PubMed.
- G. G. Tushara Chaminda, F. Nakajima, H. Furumai and I. Kasuga, Water Sci. Technol., 2010, 62(9), 2044–2050 CrossRef CAS PubMed.
- Å. R. Almås, P. Lombnæs, T. A. Sogn and J. Mulder, Chemosphere, 2006, 62(10), 1647–1655 CrossRef PubMed.
Footnote |
| † Electronic supplementary information (ESI) available. See DOI: https://doi.org/10.1039/d2ja00314g |
| This journal is © The Royal Society of Chemistry 2023 |

