High-sensitivity analysis of mercury in medicinal herbs using nanoparticle-enhanced laser-induced breakdown spectroscopy combined with argon purging†
Received
10th August 2022
, Accepted 28th October 2022
First published on 1st November 2022
Abstract
Laser-induced breakdown spectroscopy (LIBS) is an atomic spectrum analysis method with the advantage of simple, rapid, and multi-element analysis. It has great application potential for the analysis of heavy metal elements in medicinal herbs. However, when LIBS is used to analyze mercury (Hg) in medicinal herbs, the high recombination rate of mercury plasma and the selective quenching of mercury atomic emission lines by oxygen will reduce the analytical sensitivity. In this work, nanoparticle-enhanced LIBS (NE-LIBS) combined with argon (Ar) purging was used to improve the analytical sensitivity of Hg in the medicinal herb dried tangerine peel. The deposition of nanoparticles (NPs) was optimized by surface superhydrophobic treatment of the sample. The effects of the size, shape, and surface concentration of the NPs on the LIBS signal intensity were analyzed. The flow rate of the Ar jet was optimized. The results showed that detection stability was improved by surface superhydrophobic treatment. The spectral intensity of Hg I 253.65 nm was increased 6.19 times under the optimized parameters of 40 nm diameter nanocages with a surface concentration of 1.77 × 10⁻³ mg cm−2 and an Ar jet flow rate of 15 L min−1. The calibration curves of Hg I 253.65 nm were constructed under the optimized parameters. According to the calibration curves, the coefficient of determination (R2), root mean square error of cross validation (RMSECV), and limit of detection (LoD) of NE-LIBS combined with Ar purging were 0.9954, 3.47 mg kg−1, and 2.46 mg kg−1, respectively. Compared with traditional LIBS methods, NE-LIBS combined Ar purging improved the analytical sensitivity of Hg in medicinal herbs, with the LoD improved by 9.73 times. The practicability of the method was demonstrated by analyzing dried tangerine peels from other regions and the relative errors were in the range of 0.52–2.70%.
1. Introduction
Medicinal herbs have been widely used for health care and disease treatment around the world, especially in developing countries. According to a report by the World Health Organization (WHO), 80% of the population in developing countries relies on medicinal herbs for primary health care.1 The market value of herbal medicine has been constantly increasing in the last decade and is expected to reach a global value of $129.68 billion by 2023.2 China is one of the largest producers of medicinal herbs, with about 5.88 million hectares of medicinal herbs and still growing.3 In recent decades, urbanization and industrialization have increased the emissions of heavy metals into the environment.4 In China, about 15.99% of agricultural soils contain heavy metals and metalloids that exceed the environmental quality standard set by the Ministry of Environmental Protection (MEP).5 Heavy metals are not biodegradable; they can be absorbed by medicinal herbs and accumulate in the human body along the food chain.6,7 The accumulation of heavy metals in the human body causes harm to the nervous system, digestive system, respiratory system, and urinary system, leading to severe diseases such as cancer, renal failure, neurological diseases, and cardiovascular diseases.8 Mercury (Hg) is one of the most toxic and hazardous heavy metal elements.9 Mercury accumulated in the human body causes serious harm to the digestive system and nervous system and can even breach the blood–brain barrier and directly damage the cerebellum.10 The WHO advocates that medicinal herbs should not be used without the analysis of their heavy metal contamination.11 The analytical methods used to detect heavy metals in medicinal herbs include inductively coupled plasma optical emission spectroscopy (ICP-OES),12,13 inductively coupled plasma mass spectrometry (ICP-MS),14 atomic absorption spectroscopy (AAS),15 and instrumental neutron activation analysis (INAA).16 Although these methods have high analytical sensitivity and accuracy, their sample preparation processes are complicated and require the digestion of medicinal herbs before elemental analysis, thus taking a long analysis time and generating chemical wastes.
Compared with these methods, laser-induced breakdown spectroscopy (LIBS) is simpler and faster. LIBS is an atomic spectrum analysis method that uses a high-energy laser as an excitation source. The laser vaporizes the sample and produces plasma. The elemental information of the sample can be obtained by analyzing the plasma radiation spectrum.17 LIBS requires almost no sample preparation and is suitable for in situ, on-line, and multi-element analysis.18 In the past few decades, LIBS was developed rapidly and widely used in space exploration,19 steel industry,20,21 environmental protection,22–24 food safety,25 and medical herbs.26–28 Wang et al. quantitatively analyzed Pb and Cu in Ligusticum wallichii by LIBS, and the limits of detection for Pb and Cu were 15.7 and 6.3 mg kg−1, respectively.26 Zheng et al. quantitatively analyzed Cu and Pb in coptidis by reheated double pulse LIBS (RDP-LIBS), and the detection limit of Cu and Pb was 1.91 and 3.03 mg kg−1, respectively.27 Liu et al. qualitatively analyzed As and Hg in Chinese Materia Medica An-Gong-Niu-Huang Wan during the blending process.28 Senesi et al. reviewed the application of LIBS in plants from 2010 to 2019 and found that LIBS was widely used in the analysis of heavy metals in medical herbs, but there are few reports on the analysis of Hg in medical herbs.29
The LIBS analytical sensitivity of Hg is much lower than that of other heavy metals due to the high recombination rate of mercury plasma and the selective quenching of mercury atomic emission lines by oxygen species.30–32 In the past decade, many methods have been proposed to improve the analytical sensitivity of LIBS, such as spatial confinement,33 double-pulse excitation,34,35 and nanoparticle enhancement.36 Among these methods, nanoparticle-enhanced LIBS (NE-LIBS) is simple to operate and requires no additional equipment. In this method, metallic nanoparticles (NPs) were deposited on the sample surface before laser irradiation. The laser pulse irradiating the NPs can induce the oscillation of the conduction electrons in the NPs, resulting in an enhancement of the local electric field near the NPs that increases the incident laser pulse energy. Furthermore, the resonance between the laser pulse and the surface plasmon of the NPs causes the NPs to absorb most of the laser energy and efficiently heat the surrounding area.37 This increases the LIBS signal intensity.
In this work, the NE-LIBS method was used for the quantitative analysis of Hg in dried tangerine peels, and the effects of the nanoparticle size, shape, and surface concentration on the LIBS signal were analyzed. In order to attenuate the quenching effect of oxygen, an argon (Ar) gas jet was used to purge the sample surface during the detection process. The flow rate of the Ar jet was optimized. Then, the quantitative analytical capability and practicability of NE-LIBS combined with Ar purging were evaluated under the optimized parameters.
2. Experimental
2.1 Experimental setup
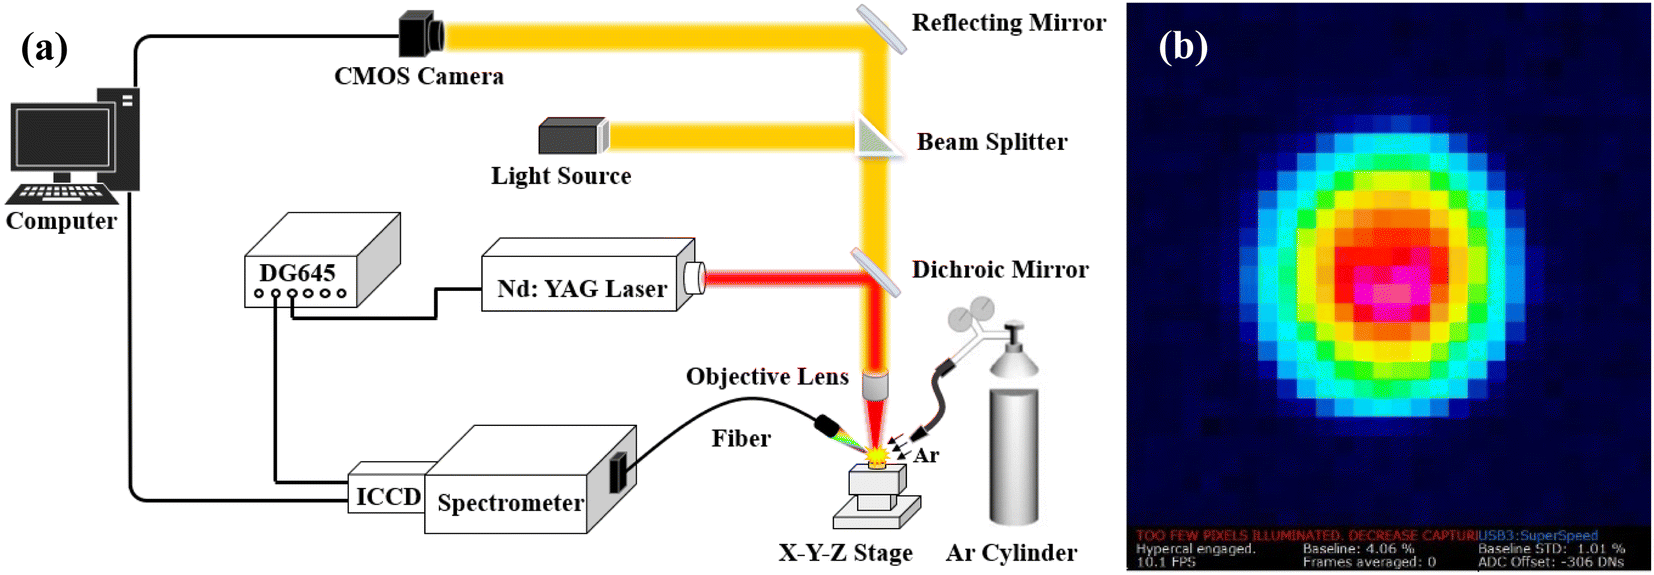
The experimental setup of the LIBS system is shown in Fig. 1. A Q-switch Nd:YAG laser (Q-Smart 450, Quantel) was used as the excitation source. The laser has a wavelength of 1064 nm, a pulse duration of 6 ns, an adjustable pulse energy from 0 to 450 mJ, and a repetition rate from 0 to 20 Hz. The laser beam was reflected by a mirror and focused on the sample surface by a microscopic objective lens (20×, Mitutoyo). The laser spot on the sample surface was analyzed by using a beam profiler (WinCamD-LCM, DataRay). As shown in Fig. 1(b), the laser spot was approximately 100 μm in diameter. The medicinal herb samples were placed on a high-precision XYZ-translation stage (M-686, M-664, PI) with a movement precision of 0.3 μm. The plasma emission was collected at 45° to the laser beam axis by a collimating lens, and then coupled into a fiber and delivered into a Czerny–Turner (C–T) spectrograph (Shamrock 750-D2, Andor) with a slit width of 50 μm and a grating of 1800 grooves per mm and 500 nm blaze. An intensified charged coupled device (ICCD) (iStar DH334T-18F-E3, Andor) was equipped with a C-T spectrograph to record the spectra. The resolution of the C-T spectrometer was 0.03 nm at 1800 grooves per mm of grating. The spectral collection range of the LIBS system was 200–850 nm, which was determined by the wavelength range of the collimating lens (190–1250 nm), fiber (190–1200 nm), spectrograph (200–950 nm), and ICCD (180–850 nm). The delay time between spectrum acquisition and laser pulse emission was controlled by a digital delay generator (DG645, Stanford). During the LIBS detection process, an Ar jet was used to purge the sample surface through a nozzle at 30° to the sample surface. The nozzle has an inner diameter of 4 mm, and the distance from the nozzle tip to the laser spot was 6 mm. The Ar was stored in a cylinder (50L, Air Liquide Co., Ltd.) and has a purity of 99.9995%. In this work, the laser operation mode, energy, and repetition rate were set to continuous mode, 190 mJ, and 10 Hz. The delay time and ICCD gate width were set to 0.5 μs and 5 μs, which were optimized at the beginning of this work (Fig. S1†). Ten spectra were collected per sample, and each spectrum was acquired with one laser shot at different positions of the sample. The stability of the laser energy was measured, and the relative standard deviation (RSD) of 100 laser shots was 0.898% (Fig. S2†).
 |
| | Fig. 1 (a) Schematic diagram of the LIBS experimental setup, and (b) laser spot on the sample surface. | |
The LIBS system also had an imaging module to get the surface image of the sample. The imaging module was composed of a light source (White LED, OLYMPUS), a microscopic objective lens, and a complementary metal oxide semiconductor (CMOS) camera (130E, SunTime). The sample surface was illuminated with a white LED, and the image of the sample surface was collected with a CMOS camera. Together with the XYZ-translation stage, the laser ablation position on the sample surface can be controlled.
2.2 Sample preparation
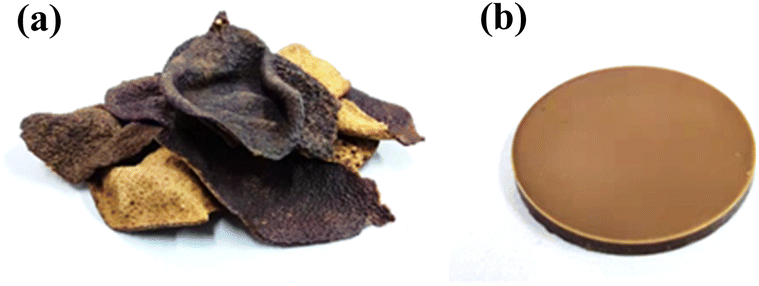
The medicinal herbs used in this work were dried tangerine peels produced in Guangdong Province, China. Dried tangerine peel has been widely used in health care, medical treatment, culinary seasoning, and food additives for wines and candies.38 In order to evaluate the quantitative analytical capability of the proposed method, the dried tangerine peels were prepared as standard samples for detection.
The standard samples were prepared according to the following steps: the dried tangerine peel samples were soaked into the Hg standard solutions (No. GBW(E)083186, Tan-Mo Technology Co., Ltd.) for 1 hour, and then the samples were put into an electric thermostatic drying oven (DHG9030A, Biaocheng Instrument Co., Ltd.) dried at 100 °C for 1 hour. After drying, the samples were pulverized to powder by using a ball mill (DZQ-D2L, Xinxie Instrument Co., Ltd.) at 450 rpm for 30 minutes, and passed through a 300 mesh screen, and then pressed into pellets using a tableting machine (SYP-15A, Xinnuo Instrument Co., Ltd.) at 200 MPa for 30 seconds. Each pellet has a diameter of 30 mm, a thickness of 2.5 mm, and a weight of 2 g. The pictures of the dried tangerine peels and pressed pellet are shown in Fig. 2. The concentration of mercury in each standard sample was determined by the atomic fluorescence spectrometry (AFS) method according to the national standards of the People's Republic of China (GB 5009.17-2014). The concentrations of Hg in standard solutions and standard samples are given in Table 1.
 |
| | Fig. 2 The pictures of (a) dried tangerine peel and (b) the pressed pellet. | |
Table 1 Hg concentrations in standard solutions and dried tangerine peel (DTP) standard samples
| Sample no. |
Standard solution (mg L−1) |
DTP sample (mg kg−1) |
Sample no. |
Standard solution (mg L−1) |
DTP sample (mg kg−1) |
| 1 |
0.10 |
0.05 |
7 |
10.00 |
4.34 |
| 2 |
0.30 |
0.18 |
8 |
30.00 |
16.85 |
| 3 |
0.50 |
0.35 |
9 |
100.00 |
55.97 |
| 4 |
1.00 |
0.62 |
10 |
200.00 |
106.56 |
| 5 |
3.00 |
0.88 |
11 |
300.00 |
148.23 |
| 6 |
5.00 |
2.46 |
12 |
500.00 |
196.58 |
2.3 Nanoparticle deposition
The gold nanoparticles (AuNPs) with different sizes (10 nm, 20 nm, 40 nm, and 60 nm in diameter) and different shapes (nanospheres, nanorods, nanocages, nanostars, and nanocubes) were used in this work. The AuNP solutions were provided by Leiming Technology Co., Ltd, China, and the concentrations were both 0.1 mg ml−1. The AuNPs were deposited on the sample surface through the following process: 5 μL of AuNP solution was extracted with a micropipette (2–20 μL range, Dragon Lab) and dropped onto the sample surface. Then, the sample was put into an electric thermostatic drying oven and dried at 60 °C for 20 minutes.
3. Results and discussion
3.1 Selection of analytical lines
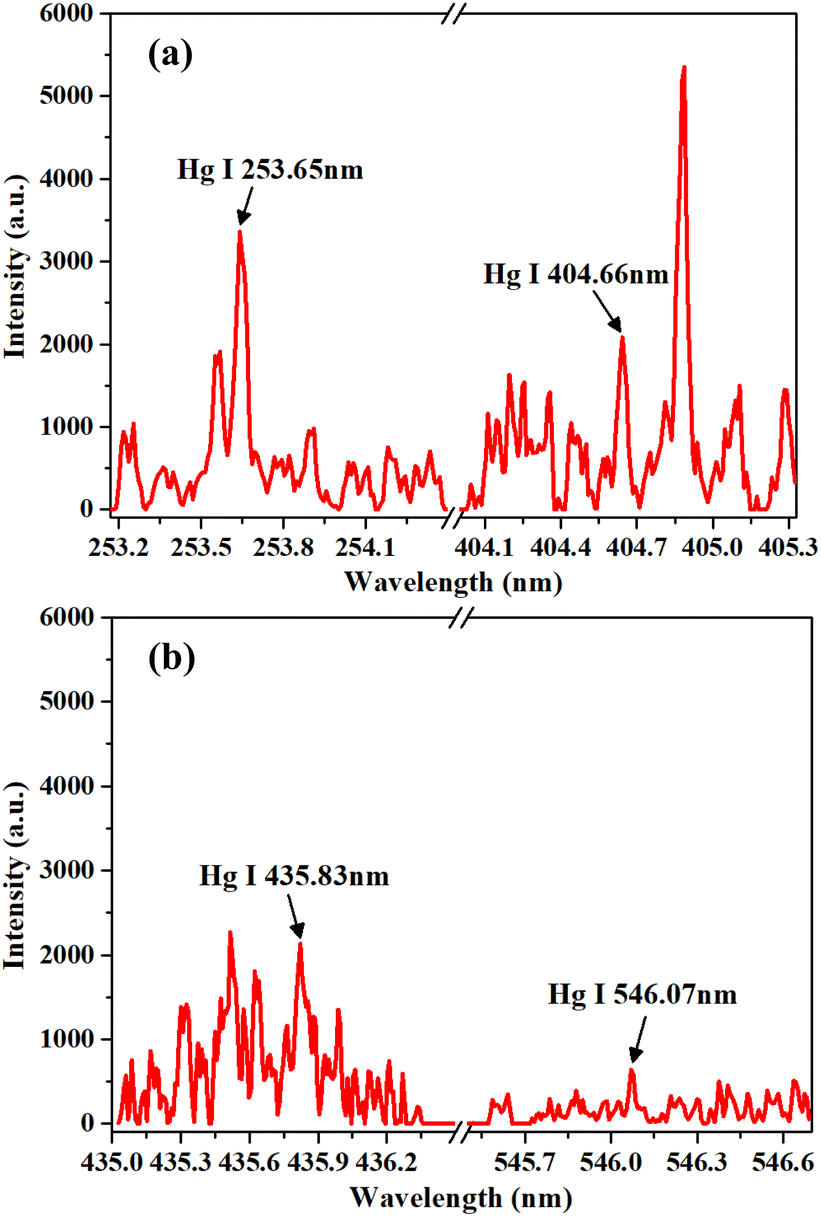
Analytical lines play a crucial role in LIBS analysis. The spectral intensity and signal-to-background ratio (SBR) of the analytical lines directly affect the analytical sensitivity.39Table 2 shows the LIBS spectral lines of Hg, which were selected from the National Institute of Standards and Technology (NIST) atomic spectra database.40 These spectral lines have high theoretical intensities according to the NIST. The LIBS spectra of the dried tangerine peel with a Hg concentration of 196.58 mg kg−1 (sample no. 12) are shown in Fig. 3. The spectral intensities and SBRs of the Hg spectral lines are listed in Table 2. Each intensity and SBR in Table 2 were obtained by averaging ten measured intensities and SBRs. As shown in Table 2 and Fig. 3, the Hg I 253.65 nm spectral line had high intensity and SBR compared with other spectral lines. Therefore, Hg I 253.65 nm was selected as the analytical line in this work.
Table 2 Parameters of the Hg spectral linesa
| Element |
λ
ki
(nm) |
E
i
(cm−1) |
E
k
(cm−1) |
A
ki
(s−1) |
Intensity (a.u.) |
SBR |
|
λ
ki
is the transition wavelength, Aki is the transition probability, and Ek and Ei are the energies of the upper and lower levels, respectively.
|
| Hg I |
253.65 |
0 |
39![[thin space (1/6-em)]](https://www.rsc.org/images/entities/char_2009.gif) 412.24 412.24 |
8.40 × 10⁶ |
3103.44 ± 128.15 |
1.94 ± 0.27 |
| Hg I |
404.66 |
37644.98 |
62350.33 |
2.07 × 10⁷ |
2019.38 ± 239.65 |
0.82 ± 0.14 |
| Hg I |
435.83 |
39412.24 |
62350.33 |
5.60 × 10⁷ |
2013.90 ± 274.59 |
0.53 ± 0.09 |
| Hg I |
546.07 |
44042.91 |
62350.33 |
4.90 × 10⁷ |
663.62 ± 147.93 |
0.66 ± 0.17 |
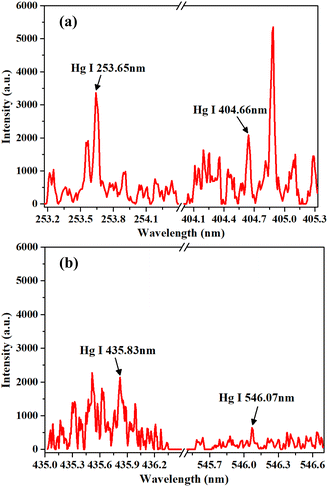 |
| | Fig. 3 LIBS spectra of dried tangerine peel in the wavelength of (a) 253.20–254.40 nm and 404.00–405.30 nm, and (b) 435.00–436.50 nm and 545.50–546.70 nm, with the background spectra removed. | |
3.2 Optimization of nanoparticle deposition
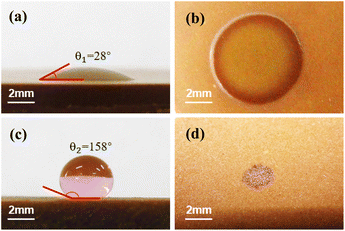
During the AuNP solution drying process, the hydrophilicity of the sample surface affects the deposition of gold nanoparticles, resulting in uneven deposition of gold nanoparticles after drying.41Fig. 4(a) and (b) show the AuNP (10 nm, nanospheres) droplets on the sample surface (sample no. 14) before and after drying. As shown in Fig. 4(a), the contact angle of the droplet on the sample surface is 28°, which means that the sample surface is hydrophilic.42 Under these conditions, the evaporation speed of the droplet is non-uniform and increases from the droplet surface center to the edge. The difference in the evaporation speed results in a capillary flow from the droplet center to the edges, which promotes the movement of the AuNPs from the droplet center to the edge.43 After the droplet dries, the AuNPs are unevenly distributed on the sample surface and concentrated along the droplet edge. This phenomenon is known as the “coffee ring effect”.44 As shown in Fig. 4(b), the AuNPs are dispersed in a circle with a diameter of 7 mm and are mainly concentrated at the edge.
 |
| | Fig. 4 The AuNP droplets on the untreated sample surface (a) before and (b) after drying. The AuNP droplets on the superhydrophobic treated sample surface (c) before and (d) after drying. | |
The “coffee ring effect” would reduce the detection stability of LIBS. Therefore, superhydrophobic materials were used to treat the sample surface. The superhydrophobic materials (4000, 4001, Ultra-Ever Dry) were sprayed on the sample surface with an electric spray gun and dried in an electric thermostatic drying oven at 40 °C for 20 minutes. Fig. 4(c) shows the AuNP (10 nm, nanospheres) droplet on the sample surface after spraying the superhydrophobic materials. As shown in Fig. 4(c), the contact angle of the droplet on the surface is 158°, indicating that the surface is superhydrophobic.45Fig. 4(d) shows the AuNP droplet on the superhydrophobic surface after drying. The AuNPs are concentrated in a circle with a diameter of 2 mm, and the surface concentration is 1.59 × 10⁻² mg cm−2.
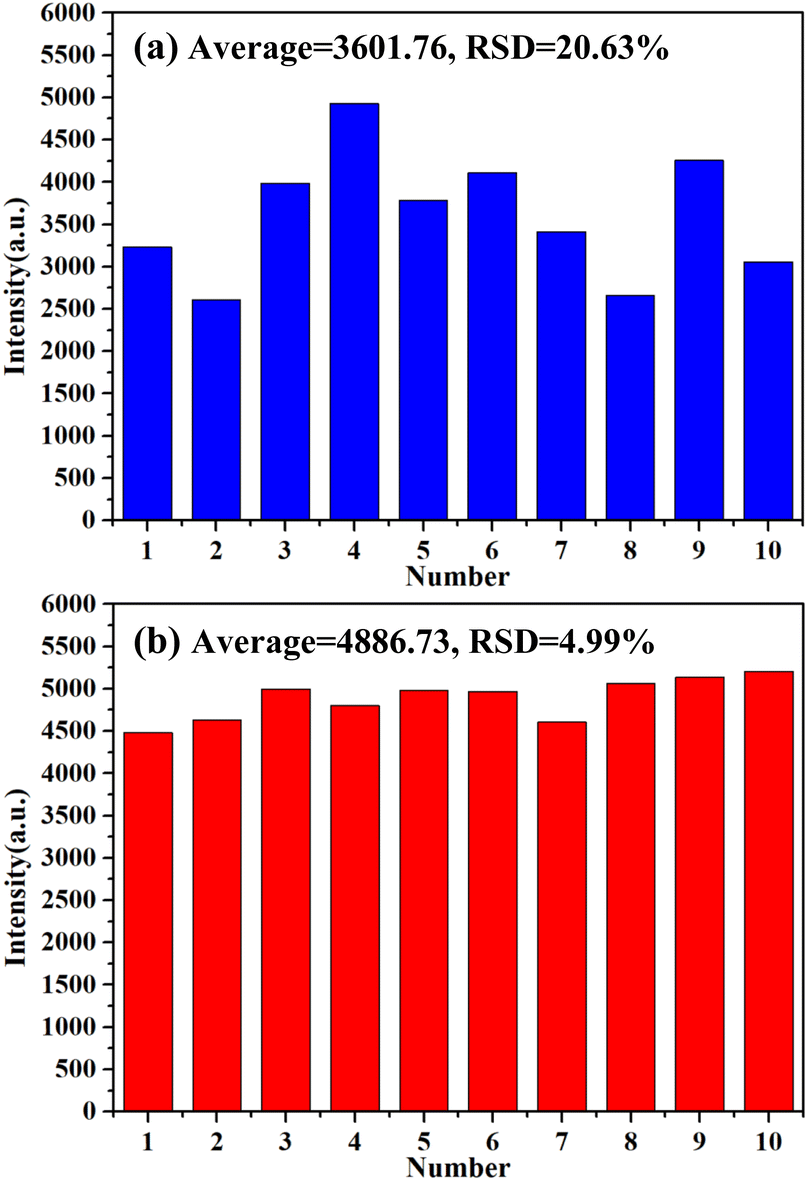
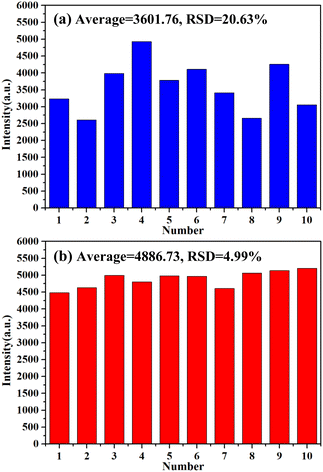
In order to evaluate the detection stability after superhydrophobic treatment of the sample surface, ten LIBS spectra were collected at different locations on the AuNP circle of each sample. Fig. 5 shows the spectral intensities of Hg I 253.65 nm collected from (a) the untreated sample surface and (b) the superhydrophobic treated sample surface. As shown in Fig. 5(a), the average and relative standard deviation (RSD) of the ten spectral intensities collected from the untreated sample were 3601.76 and 20.63%, respectively. As shown in Fig. 5(b), the average and RSD of the ten spectral intensities collected from the superhydrophobic treated sample were 4886.73 and 4.99%, respectively. The spectral intensity was increased by 1.36 times, and the RSD was decreased from 20.63% to 4.99%. The results show that the coffee ring effect was suppressed by surface superhydrophobic treatment, and the detection stability was improved.
 |
| | Fig. 5 Histogram of Hg I 253.65 nm spectral intensities collected from (a) the untreated sample surface and (b) the superhydrophobic treated sample surface. | |
3.3 Effect of the size, shape, and surface concentration of AuNPs on the LIBS signal intensity
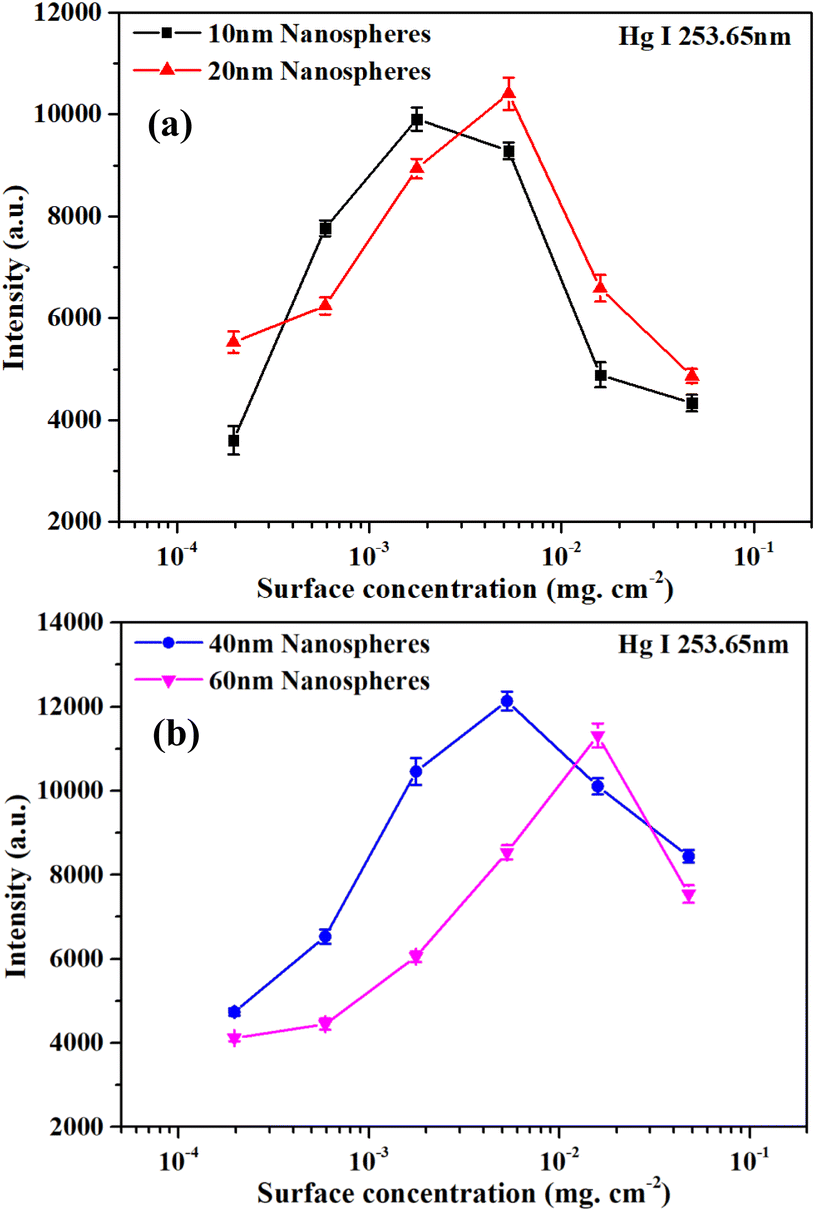
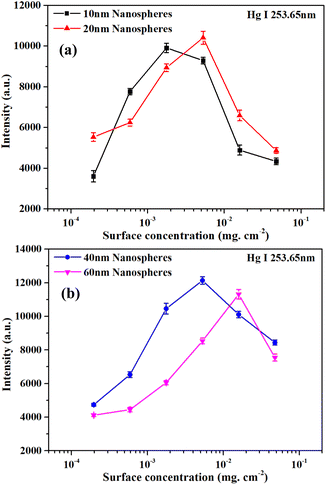
The AuNPs can enhance the LIBS signal intensity through the modulation of the incident electric field and create Localized Surface Plasmon Resonance (LSPR) on the sample surface. The size, shape, and surface concentration of the AuNPs can affect the LSPR, and thus affect the LIBS signal intensity.46,47 The microstructures of the AuNPs were characterized by transmission electron microscopy (TEM) (JEM-200CX, JEOL). Fig. 6 shows the TEM images of Au nanospheres with different sizes. The Au nanospheres have four sizes: 10 ± 1 nm, 20 ± 3 nm, 40 ± 6 nm, and 60 ± 11 nm. To evaluate the effect of AuNP surface concentration on the LIBS signal, AuNPs with surface concentrations from 1.96 × 10⁻⁴ mg cm−2 to 4.77 × 10⁻² mg cm−2 were prepared. A surface concentration of 1.59 × 10⁻² mg cm−2 can be obtained by using the mother solution (0.1 mg ml−1). A surface concentration of 5.30 × 10⁻³ mg cm−2, 1.77 × 10⁻³ mg cm−2, 5.89 × 10⁻⁴ mg cm−2, and 1.96 × 10⁻⁴ mg cm−2 can be obtained by diluting the mother solution 3, 9, 27, and 81 times. And a surface concentration of 4.77 × 10⁻² mg cm−2 can be obtained by repeating the deposition process three times using the mother solution. Fig. 7(a) and (b) show the effect of surface concentration on the Hg I 253.65 nm spectral intensity for Au nanospheres with different sizes. Each intensity in Fig. 7 was obtained by averaging ten measured intensities, and the error bars are the standard deviations. As shown in Fig. 7(a) and (b), the intensities increased first and reached a maximum, and then decreased with increasing surface concentration. And the maximum spectral intensities were obtained at different surface concentrations for Au nanospheres with different sizes. This is because the maximum LIBS signal enhancement can be obtained at the optimal inter-particle distance, and the optimal inter-particle distance is different for different sizes of AuNPs.35 In this experiment, the Au nanospheres with a 40 nm diameter have higher maximum spectral intensity than those with 10 nm, 20 nm, and 60 nm diameters, and the optimal surface concentration for 40 nm Au nanospheres was 5.30 × 10⁻³ mg cm−2.
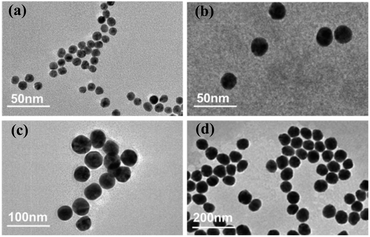 |
| | Fig. 6 TEM characterization of Au nanospheres with different sizes. (a) 10 nm, (b) 20 nm, (c) 40 nm, and (d) 60 nm. | |
 |
| | Fig. 7 (a) The effect of AuNP surface concentration on the Hg I 253.65 nm spectral intensity for Au nanospheres with 10 nm and 20 nm diameters. (b) The effect of AuNP surface concentration on the Hg I 253.65 nm spectral intensity for Au nanospheres with 40 nm and 60 nm diameters. | |
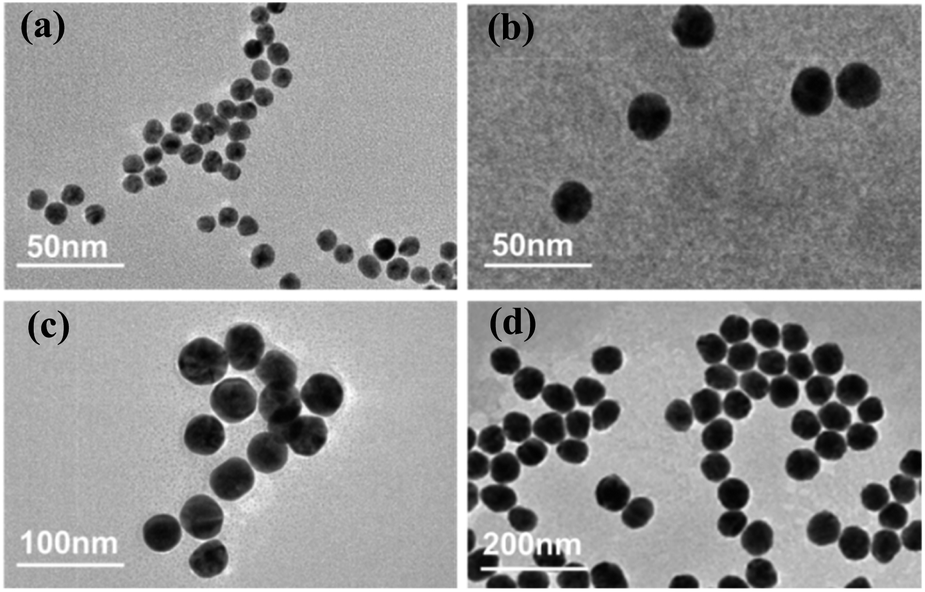
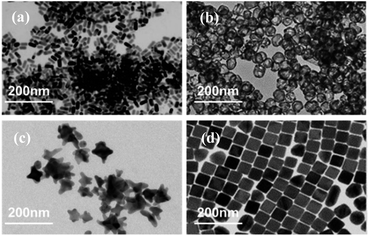
The TEM images of AuNPs with different shapes are shown in Fig. 8. The nanorods were 40 ± 5 nm in length and 20 ± 3 nm in diameter, the nanocubes were 50 ± 6 nm in side length, the nanocages were 40 ± 7 nm in diameter, and the nanostars were 40 ± 5 nm in diameter.
 |
| | Fig. 8 TEM characterization of AuNPs with different shapes. (a) Nanorods, (b) nanocages, (c) nanostars and (d) nanocubes. | |
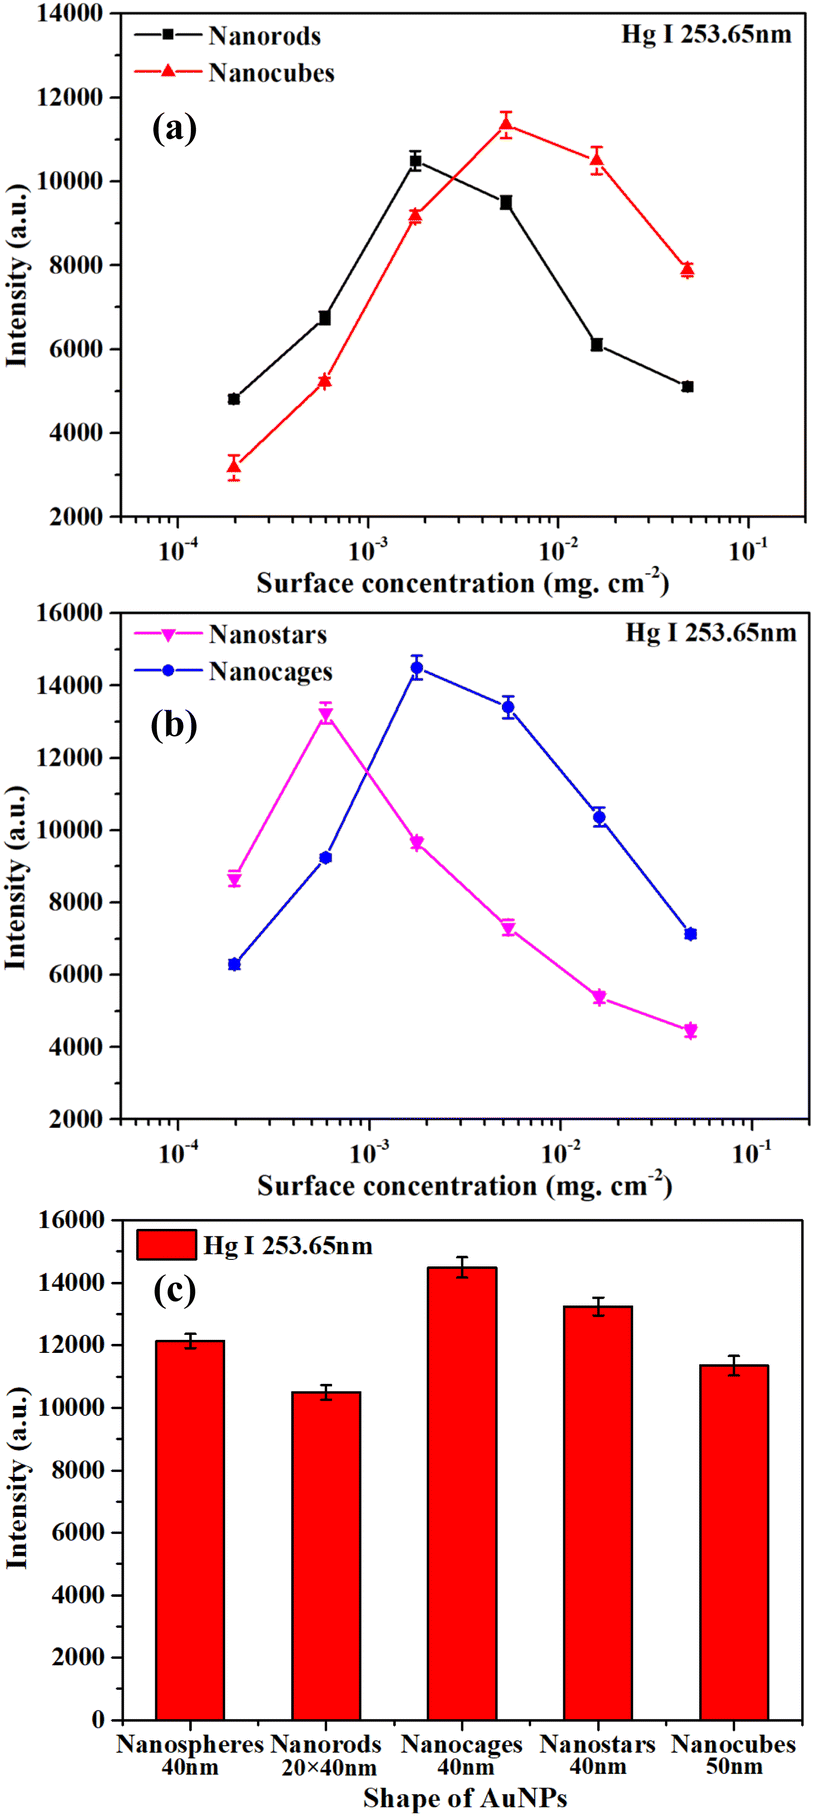
Fig. 9(a) and (b) show the effect of surface concentration on the Hg I 253.65 nm spectral intensity for Au nanospheres with different shapes. The spectral intensity has the same general trend as those in Fig. 7. Fig. 9(c) shows the comparison of maximum spectral intensities for Au nanospheres with different shapes. As shown in Fig. 9(c), the nanocages have higher spectral intensities than nanospheres, nanorods, nanostars, and nanospheres. The optimal surface concentration for nanocages was 1.77 × 10⁻³ mg cm−2. This is because the nanocages are hollow and porous and have a large specific surface area. The porous morphology could enhance the LIBS signal, and the large specific surface area could improve the laser coupling efficiency with the NPs, thus resulting in higher LIBS signal intensity.46 In this work, 40 nm Au nanocages with a surface concentration of 1.77 × 10⁻³ mg cm−2 were used to improve the LIBS signal intensity.
 |
| | Fig. 9 (a) The effect of AuNP surface concentration on the Hg I 253.65 nm spectral intensity for nanorods and nanocubes. (b) The effect of AuNP surface concentration on the Hg I 253.65 nm spectral intensity for nanostars and nanocages. (c) Comparison of maximum spectral intensities for Au nanospheres with different shapes. | |
3.4 Optimization of the Ar flow rate
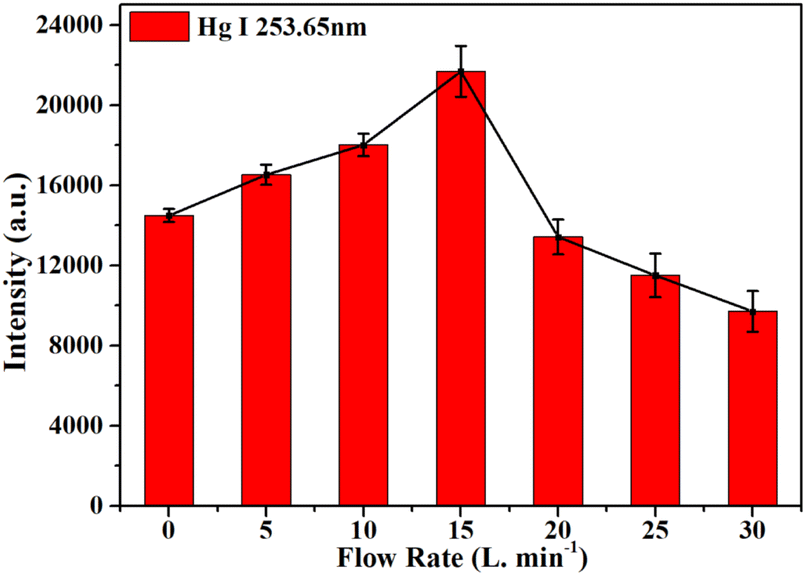
Ar is a chemically inert gas that is widely used as a protective gas in LIBS.48,49 In order to attenuate the effect of selective quenching of mercury atomic emission lines by oxygen, an Ar gas jet was used to purge the sample surface in this work. The flow rate of the Ar jet directly affects the plasma emission intensity. When the Ar jet has a low flow rate, the oxygen cannot be completely removed. When the Ar jet has a high flow rate, the airflow will affect the plasma emission stability and cools the plasma. Fig. 10 shows the effect of the Ar flow rate on the Hg I 253.65 nm spectral intensities. As shown in Fig. 10, the intensities of Hg I 253.65 nm were increased from 0 to 15 L min−1 and reached a maximum at 15 L min−1, and then decreased from 15 to 30 L min−1. In this work, an Ar flow rate of 15 L min−1 was used to purge the sample surface.
 |
| | Fig. 10 The effect of the Ar flow rate on the Hg I 253.65 nm spectral intensities, and the error bars represent the standard deviations. | |
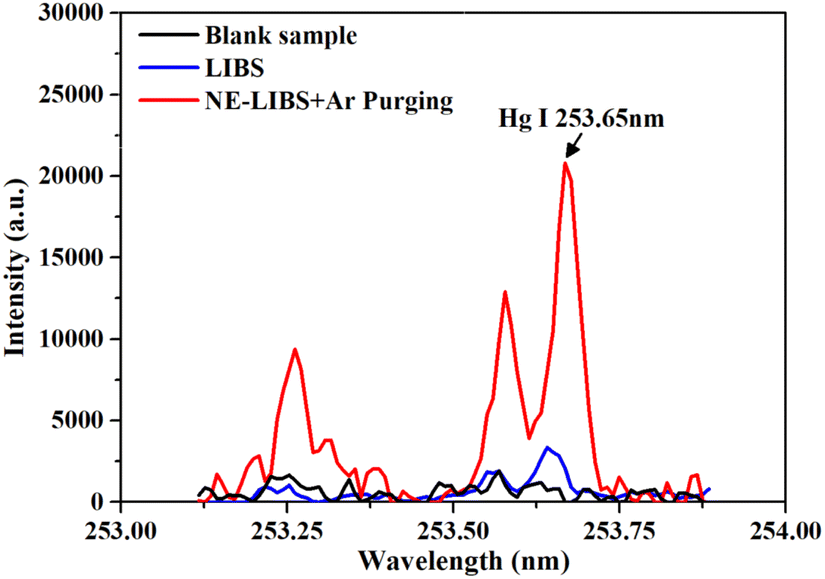
The emission spectra of traditional LIBS and NE-LIBS combined with Ar jet purging are shown in Fig. 11, and the background spectra were removed. As shown in Fig. 11, the spectral intensity of Hg I 253.65 nm was increased 6.19 times under the optimized parameters (40 nm Au nanocages, 1.77 × 10⁻³ mg cm−2 surface concentration, and 15 L min−1 Ar purging).
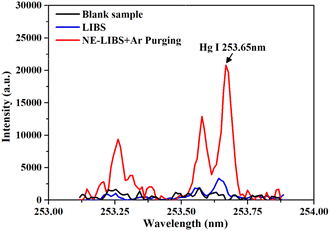 |
| | Fig. 11 The emission spectra of LIBS (blue) and NE-LIBS combined with Ar jet purging (rad). | |
3.5 Calibration curves and evaluation parameters
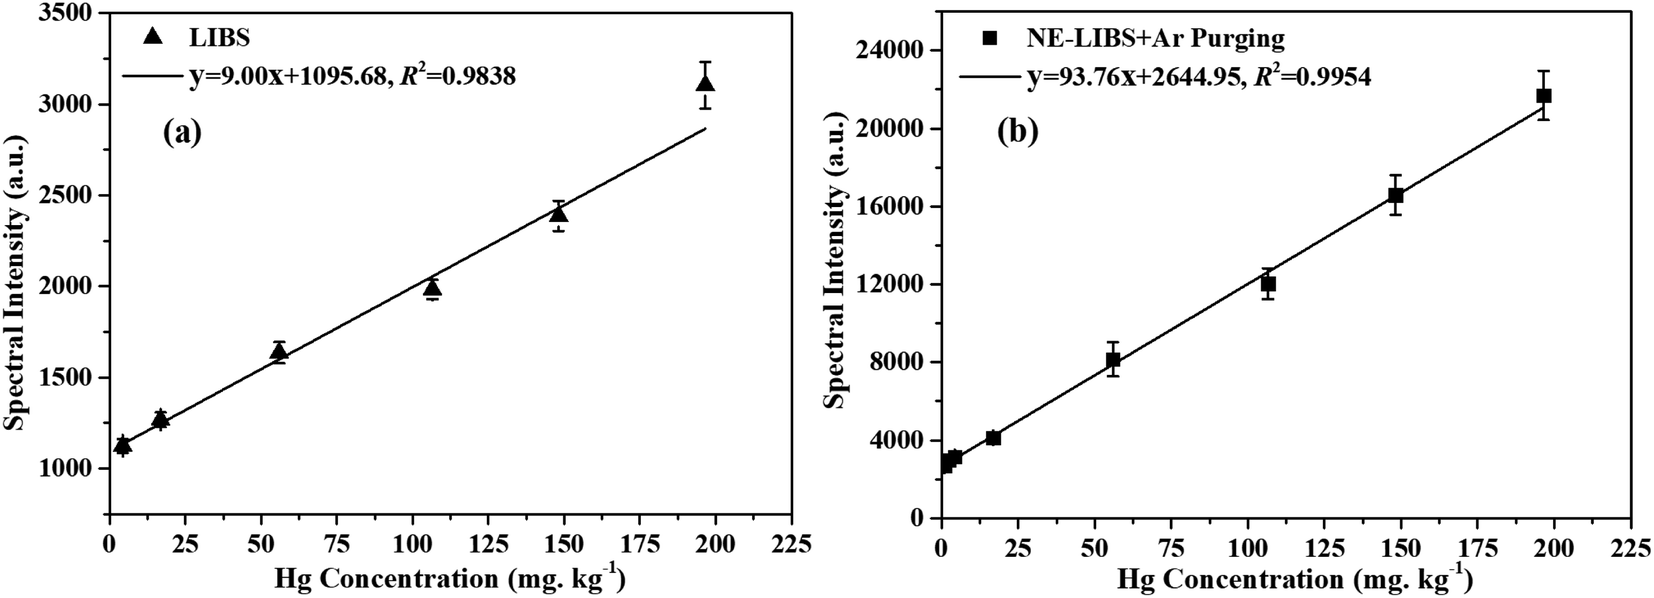
In order to evaluate the quantitative analytical capability of the proposed method, calibration curves between Hg I 253.65 nm spectral intensities and Hg concentrations were constructed using the dried tangerine peel standard samples as shown in Table 1. The experiments were performed under the optimized parameters as above. In the experiments, the detection range of LIBS was 4.34 to 196.58 mg kg−1, and the detection range of NE-LIBS combined with Ar purging was 0.88 to 196.58 mg kg−1 according to the standard samples in Table 1. Fig. 12 shows the calibration curves of (a) LIBS and (b) NE-LIBS combined with Ar purging. Fig. 13 shows the comparison of the predicted concentrations with the certified concentration. The dashed line in Fig. 13 represents the ideal correspondence between certified concentration and predicted concentration. Each point in Fig. 12 and 13 corresponds to an average of ten measurements, and the error bars are the standard deviations.
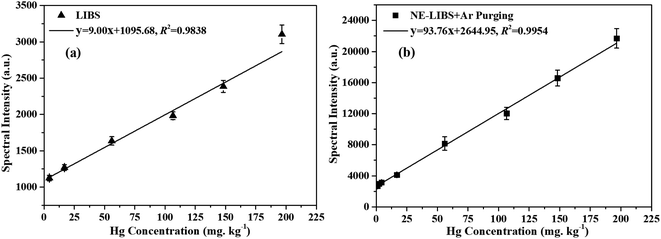 |
| | Fig. 12 The calibration curves of (a) LIBS, and (b) NE-LIBS combined with Ar purging. The error bars represent the standard deviations. | |
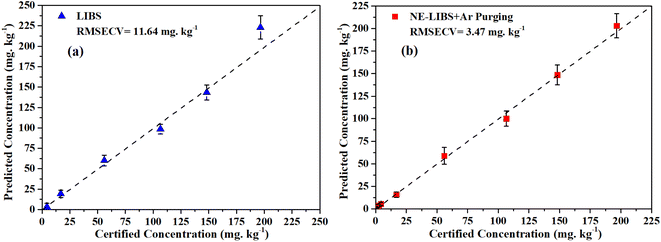 |
| | Fig. 13 Comparison of the predicted concentrations calculated by (a) LIBS and (b) NE-LIBS + Ar purging with the certified concentration. The error bars represent the standard deviations. | |
The slopes of the calibration curves, coefficient of determination (R2), limit of detection (LoD), and root mean square error of cross validation (RMSECV) are listed in Table 3. The slope and LoD were used to evaluate the analytical sensitivity; the R2 and RMSECV were used to evaluate the analytical accuracy. The LoD refers to the lowest concentration that can be detected and was calculated by using 3σ criteria:
where
σ represents the standard deviation of background emission measured from blank samples, and
s represents the slope of the calibration curve.
Table 3 The evaluation parameters of calibration curves
| Method |
Slope |
R
2
|
LoD (mg kg−1) |
RMSECV (mg kg−1) |
| LIBS |
9.00 |
0.9838 |
23.94 |
11.64 |
| NELIBS + Ar purging |
93.76 |
0.9954 |
2.46 |
3.47 |
R
2 represents the degree of correlation between element concentration and spectral intensity, expressed as:
| | 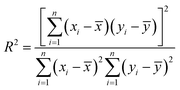 | (2) |
where
xi and
yi represent the value of the concentration and signal intensity for the sample
i, respectively;
![[x with combining macron]](https://www.rsc.org/images/entities/i_char_0078_0304.gif)
and
ȳ represent the average value of
xi and
yi over
n samples, respectively. RMSECV represents the difference between the predicted value and the certificated value, mathematically expressed as:
| | 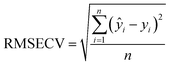 | (3) |
where
yi and
ŷi represent the value of the certificated and predicted concentrations of sample
i, and
n represents the number of samples.
As shown in Table 3, the LIBS analytical sensitivity and accuracy of Hg in medicinal herbs were both improved after using nanoparticle-enhancement combined with Ar purging, with the LoD improved by 9.73 times, R2 increased by 0.0116, and RMSECV improved by 3.35 times.
To evaluate the practicability of the proposed method, dried tangerine peels from other regions (Zhejiang Province, China) were used. The dried tangerine peel samples were prepared by the method in Section 2.2. The Hg concentrations of the samples were certified at a quality detection center (United Nations Quality Detection Group Co., Ltd, China) by the AFS method according to the National Standards of People's Republic of China (GB 5009.17-2014). Table 4 shows the analytical results of Hg in the dried tangerine peels by NE-LIBS combined with Ar Purging. As shown in Table 4, the relative errors of NE-LIBS combined with Ar purging were in the range of 0.52–2.70%.
Table 4 Analytical results of Hg in dried tangerine peels by NE-LIBS combined with Ar purging
| Sample no. |
Certified value (mg kg−1) |
Found value (mg kg−1) |
Relative error |
| a |
36.62 |
35.63 ± 5.72 |
2.7% |
| b |
173.53 |
174.44 ± 8.50 |
0.52% |
4. Conclusions
In this work, NE-LIBS combined with Ar purging was used to improve the analytical sensitivity of Hg in medicinal herbs. To reduce the influence of the uneven distribution of nanoparticles on the LIBS signal stability, the sample surface was treated with superhydrophobic materials. After superhydrophobic treatment, the coffee ring effect was suppressed, the LIBS signal intensity was increased by 1.36 times and the signal stability was improved with the RSD decreased from 20.63% to 4.99%. The effects of the AuNP size, shape and surface concentration on the LIBS signal were analyzed. Experimental results show that the LIBS signal has a highest intensity when using 40 nm Au nanocages with a surface concentration of 1.77 × 10⁻³ mg cm−2. The reason is that the 40 nm Au nanocages have an optimal inter-particle distance under 1.77 × 10⁻³ mg cm−2 surface concentration, and the nanocages are hollow and porous and have a large specific surface area that can further enhance the LIBS signal. In order to attenuate the quenching effect of oxygen, an Ar gas jet was used to purge the sample surface. The flow rate of the Ar jet was optimized, and an Ar flow rate of 15 L min−1 was used in this work. The spectral intensity of Hg I 253.65 nm was increased 6.19 times by using 40 nm Au nanocages with 1.77 × 10⁻³ mg cm−2 surface concentration and 15 L min−1 Ar purging. The calibration curves between Hg I 253.65 nm spectral intensities and Hg concentrations were constructed under the optimized parameters. The LoD, R2, and RMSECV of NE-LIBS combined with Ar purging were 2.46 mg kg−1, 0.9954, and 3.47 mg kg−1 respectively. Compared with the traditional LIBS method, the LoD was improved by 10.19 times, the R2 was increased by 0.0116, and the RMSECV was improved by 3.35 times. The result showed that NE-LIBS combined with Ar purging has a high analytical sensitivity for the analysis of Hg in medicinal herbs. The practicability of the method was demonstrated by analyzing dried tangerine peels from other regions, and the relative errors were in the range of 0.52–2.70%.
In this work, the Hg in dried tangerine peel samples was obtained by soaked the dried tangerine peels into Hg standard solutions. Compared with the Hg enriched in naturally grown samples, the Hg obtained by soaking is loosely bound to the samples. This may affect the detection accuracy. In our future work, the naturally Hg enriched samples will be prepared and analyzed.
Author contributions
Yuanhang Wang: investigation, conceptualization, methodology, data curation, software, formal analysis, and writing–original draft. Yang Bu: investigation, conceptualization, methodology, project administration, formal analysis, writing–review & editing, resources, and supervision. Yachao Cai: data curation and formal analysis. Xiangzhao Wang: project administration and resources.
Conflicts of interest
There are no conflicts of interest to declare.
Acknowledgements
This work was supported by the Science and Technology Commission of Shanghai Municipality (No. 18511104500).
References
- V. Tripathy, B. B. Basak, T. S. Varghese and A. Saha, Phytochem. Lett., 2015, 14, 67–78, DOI:10.1016/j.phytol.2015.09.003.
- S. H. Oh, Y. D. Kim and C. S. Jang, Food Sci. Biotechnol., 2022, 31, 89–100, DOI:10.1007/s10068-021-01008-5.
- X. Wan, S. Wang, C. Kang, C. Lyu, L. Guo and L. Huang, China J. Chin. Mater. Med., 2022, 47, 1144–1152, DOI:10.19540/j.cnki.cjcmm.20211224.101.
- J. Zhao, E. Wu, B. Zhang, X. Bai, P. Lei, X. Qiao, Y. Li, B. Li, G. Wu and Y. Gao, Environ. Pollut., 2021, 281, 116994, DOI:10.1016/j.envpol.2021.116994.
- F. J. Zhao, Y. Ma, Y. G. Zhu, Z. Tang and S. P. McGrath, Environ. Sci. Technol., 2015, 49, 750–759, DOI:10.1021/es5047099.
- Y. G. Chen, X. L. S. He, J. H. Huang, R. Luo, H. Z. Ge, A. Wolowicz, M. Wawrzkiewicz, A. Gładysz-Płaska, B. Li, Q. X. Yu, D. Kołodýnska, G. Y. Lv and S. H. Chen, Ecotoxicol. Environ. Saf., 2021, 219, 112336, DOI:10.1016/j.ecoenv.2021.112336.
- S. Thakur, L. Singh, Z. A. Wahid, M. F. Siddiqui, S. M. Atnaw and M. F. Din, Environ. Monit. Assess., 2016, 188, 206, DOI:10.1007/s10661-016-5211-9.
- C. M. Yang, M. Y. Chien, P. C. Chao, C. M. Huang and C. H. Chen, J. Hazard. Mater., 2021, 412, 125142, DOI:10.1016/j.jhazmat.2021.125142.
- A. Filipiak-Szok, M. Kurzawa and E. Szlyk, J. Trace Elem. Med. Biol., 2015, 30, 54–58, DOI:10.1016/j.jtemb.2014.10.008.
- K. Johnson-Arbor, E. Tefera and J. Farrell Jr, Health Sci. Rep., 2021, 4, e293, DOI:10.1002/hsr2.293.
- B. Behera and S. Bhattacharya, Tang [Humanitas Medicine], 2016, 6, e3, DOI:10.5667/tang.2015.0029.
- M. Senila, A. Drolc, A. Pintar, L. Senila and E. Levei, J. Anal. Sci. Technol., 2014, 5, 37, DOI:10.1186/s40543-014-0037-y.
- M. Zhou, Y. Zhi, Y. Dai, J. Lv, Y. Li and Z. Wu, RSC Adv., 2020, 10, 43882–43893, 10.1039/d0ra08254f.
- F. L. Rasdi, N. K. Bakar and S. Mohamad, Int. J. Mol. Sci., 2013, 14, 3078–3093, DOI:10.3390/ijms14023078.
- X. Yuan, H. L. Koh and W. K. Chui, Phytochem. Anal., 2009, 20, 293–297, DOI:10.1002/pca.1126.
- P. S. C. Silva, L. S. Francisconi and R. D. M. R. Gonçalves, J. Braz. Chem. Soc., 2016, 27, 2273–2289, DOI:10.5935/0103-5053.20160123.
-
R. Noll, Laser-Induced Breakdown Spectroscopy, Springer, Berlin, Heidelberg, 1 edn, 2012 Search PubMed.
- D. W. Hahn and N. Omenetto, Appl. Spectrosc., 2012, 66, 347–419, DOI:10.1366/11-06574.
- P. Sobron, A. Wang and F. Sobron, Spectrochim. Acta, Part B, 2012, 68, 1–16, DOI:10.1016/j.sab.2012.01.002.
- J. Ruiz, T. Delgado, L. M. Cabalín and J. J. Laserna, J. Anal. At. Spectrom., 2017, 32(6), 1119–1128, 10.1039/c7ja00093f.
- R. Noll, C. Fricke-Begemann, S. Connemann, C. Meinhardt and V. Sturm, J. Anal. At. Spectrom., 2018, 33, 945–956, 10.1039/c8ja00076j.
- P. Zheng, H. Liu, J. Wang, M. Shi, X. Wang, B. Zhang and R. Yang, J. Anal. At. Spectrom., 2015, 30, 867–874, 10.1039/C4JA00350K.
- X. Zhang, N. Li, C. Yan, J. Zeng, T. Zhang and H. Li, J. Anal. At. Spectrom., 2020, 35, 403–413, 10.1039/c9ja00360f.
- Y. Wang, Y. Bu, Y. Cai and X. Wang, J. Anal. At. Spectrom., 2022, 37, 1023–1031, 10.1039/d1ja00431j.
- B. Sezer, G. Bilge and I. H. Boyaci, TrAC, Trends Anal. Chem., 2017, 97, 345–353, DOI:10.1016/j.trac.2017.10.003.
- J. Wang, S. Xue, P. Zheng, Y. Chen and R. Peng, Anal. Lett., 2017, 50, 2000–2011, DOI:10.1080/00032719.2016.1254223.
- P. Zheng, X. Li, J. Wang, S. Zheng and H. Zhao, Acta Phys. Sin., 2019, 68, 125202, DOI:10.7498/aps.68.20190148.
- X. Liu, Q. Ma, S. Liu, X. Shi, Q. Zhang, Z. Wu and Y. Qiao, Spectrochim. Acta, Part A, 2015, 151, 547–552, DOI:10.1016/j.saa.2015.07.002.
- G. S. Senesi, J. Cabral, C. R. Menegatti, B. Marangoni and G. Nicolodelli, TrAC, Trends Anal. Chem., 2019, 118, 453–469, DOI:10.1016/j.trac.2019.05.052.
- R. Knopp, F. J. Scherbaum and J. I. Kim, Fresenius. J. Anal. Chem., 1996, 355, 16–20, DOI:10.1007/s0021663550016.
- R. L. Gleason and D. W. Hahn, Spectrochim. Acta, Part B, 2001, 56, 419–430, DOI:10.1016/S0584-8547(01)00169-0.
-
N. M. Shaikh, S. Hafeez and M. A. Baig, 2009 IEEE International Conference on Plasma Science, San Diego, 2009. DOI: DOI:10.1109/PLASMA.2009.5227667.
- C. Li, L. Guo, X. He, Z. Hao, X. Li, M. Shen, X. Zeng and Y. Lu, J. Anal. At. Spectrom., 2014, 29, 638–643, 10.1039/c3ja50368b.
- E. Tognoni and G. Cristoforetti, J. Anal. At. Spectrom., 2014, 29, 1318–1338, 10.1039/c4ja00033a.
- Y. Ma, W. Zhang, Z. Xiong, H. Cui, Q. Li, R. Zhou, Y. Zhang, X. Li, X. Zeng and Q. Li, J. Anal. At. Spectrom., 2020, 35, 1458–1463, 10.1039/c9ja00448c.
- M. Dell'Aglio, Z. Salajkova, A. Mallardi, M. C. Sportelli, J. Kaiser, N. Cioffi and A. D. Giacomo, Talanta, 2021, 235, 122741, DOI:10.1016/j.talanta.2021.122741.
- M. Dell'Aglio, R. Alrifai and A. De Giacomo, Spectrochim. Acta, Part B, 2018, 148, 105–112, DOI:10.1016/j.sab.2018.06.008.
- H. Zhang, J. Cui, G. Tian, C. DiMarco-Crook, W. Gao, C. Zhao, G. Li, Y. Lian, H. Xiao and J. Zheng, Food Chem., 2019, 289, 340–350, DOI:10.1016/j.foodchem.2019.03.063.
- J. Yan, S. Li, K. Liu, R. Zhou, W. Zhang, Z. Hao, X. Li, D. Wang, Q. Li and X. Zeng, Anal. Chim. Acta, 2020, 1111, 139–146, DOI:10.1016/j.aca.2020.03.030.
-
https://www.nist.gov/pml/atomic-spectra-database
.
- B. Ji, L. Zhang, M. Li, S. Wang, M. K. Law, Y. Huang, W. Wen and B. Zhou, Nanoscale, 2019, 11, 20534–20545, 10.1039/c9nr06989e.
- T. Gischkat, M. Döbeli, A. Bächli, R. Botha and Z. Balogh-Michels, Appl. Surf. Sci., 2021, 568, 150880, DOI:10.1016/j.apsusc.2021.150880.
- R. D. Deegan, O. Bakajin, T. F. Dupont, G. Huber, S. R. Nagel and T. A. Witten, Nature, 1997, 389, 827–829, DOI:10.1038/39827.
- D. Mampallil and H. B. Eral, Adv. Colloid Interface Sci., 2018, 252, 38–54, DOI:10.1016/j.cis.2017.12.008.
- L. Feng, S. Li, Y. Li, H. Li, L. Zhang, J. Zhai, Y. Song, B. Liu, L. Jiang and D. Zhu, Adv. Mater., 2016, 14, 1857–1860, DOI:10.1002/adma.200290020.
- M. Abdelhamid, Y. A. Attia and M. Abdel-Harith, J. Anal. At. Spectrom., 2020, 35, 2982–2989, 10.1039/d0ja00329h.
- A. De Giacomo, M. Dell'Aglio, R. Gaudiuso, C. Koral and G. Valenza, J. Anal. At. Spectrom., 2016, 31, 1566–1573, 10.1039/c6ja00189k.
- C. K. Kim, J. H. In, S. H. Lee and S. Jeong, J. Anal. At. Spectrom., 2013, 28, 460–467, 10.1039/c2ja30297g.
- X. Liu, F. Liu, W. Huang, J. Peng, T. Shen and Y. He, Molecules, 2018, 23, 2492, DOI:10.3390/molecules23102492.
|
| This journal is © The Royal Society of Chemistry 2023 |
Click here to see how this site uses Cookies. View our privacy policy here. 
 ab,
Yang
Bu
ab,
Yang
Bu