 Open Access Article
Maleic anhydride from bio-based 1-butanol and furfural: a life cycle assessment at the pilot scale†
Raffaele
Cucciniello‡
 a,
Daniele
Cespi‡
 *bc,
Matteo
Riccardi
de,
Elena
Neri
df,
Fabrizio
Passarini
 bc and
Federico Maria
Pulselli
df
aDepartment of Chemistry and Biology “Adolfo Zambelli”, University of Salerno, Via Giovanni Paolo II 132, 84084, Fisciano (SA), SA, Italy
bDepartment of Industrial Chemistry “Toso Montanari”, University of Bologna, Viale Del Risorgimento 4, 40136, Bologna, BO, Italy. E-mail: daniele.cespi2@unibo.it
cCenter for Chemical Catalysis – C3, Alma Mater Studiorum Università di Bologna, Viale del Risorgimento 4, Bologna, BO, Italy
dEcodynamics Group, Department of Physical, Earth and Environmental Sciences, University of Siena, Pian dei Mantellini 44, Siena, SI, Italy
eNIER INGEGNERIA S.p.A, Via C. Bonazzi 2, 40013, Castel Maggiore, BO, Italy
fINDACO2 Srl, Colle di Val d'Elsa, Siena, SI, Italy
First published on 7th June 2023
Abstract
The necessity to feed the chemical industry with bio-based platform chemicals encourages the usage of a life cycle perspective in order to evaluate potentialities and drawbacks, before launching them at the industrial scale. In this study, we proposed a life cycle assessment of two bio-based routes for the production of maleic anhydride (1000 kg as the functional unit, FU): from butanol (bio-ButOH MA) and furfural (bio-Furf MA). In both cases, dedicated biomasses were used to feed the pilot plants, since it represents a more realistic scenario. The study considers two levels of analysis. The first one takes into account the simplest situation, in which no energy recovery is considered within the system boundaries. In the second assessment level it is assumed that 100% of the heat released by the reaction is recovered to feed the plant and co-produce steam (available for other commodities). In both scenarios, the production of MA from bio-Furf results in being more competitive. Models were evaluated in terms of carbon footprint (IPCC), cumulative energy demand (CED) and following a multi-impact approach (ReCiPe method). The life cycle impact assessment phase confirms the scores achieved from the application of the E-factor (green metric). In fact, the higher selectivity of the catalytic system used to convert bio-Furf into MA implies a lower amount of raw materials per FU with consequent minor potential impacts on the several impact categories considered. Results, also confirmed by Monte Carlo analysis, could be used to attain future improvements and support the design or the retrofit of innovative industrial plants able to enhance the whole efficiency.
Introduction
The proliferation of plastic material production and the consequent release of litter and residues into the environment seem unstoppable. The world production of synthetic macromolecules reached more than 360 million metric tonnes in 2020![[thin space (1/6-em)]](https://www.rsc.org/images/entities/char_2009.gif) 1 following a continuous growth pattern only slowed by the COVID-19 pandemic. In addition, the fossil-based production of this impressive flow of materials imposes several threats such as climate change, pollution, resource exhaustion, ecosystem damage, as well as consequences for human health. The economy of plastics is supported by a plentiful number of stakeholders2 who are involved in different ways, along the cycle of raw materials, products, and wastes. This means that the dynamics of this sector (among others) and the related concerns are not easily manageable. In fact, solutions to some of the abovementioned dilemmas can only emerge as a combination of contributions coming from several subjects, at different levels and scales: legislative, economic, industrial, and planning(macro); design, processing, technological, and chemical (micro). Companies, factories, and enterprises are progressively embodying this approach among their strategies especially because paying attention to problem prevention and innovation towards more sustainable production processes is increasing their competitiveness. In particular, much effort is currently made to detect and better understand the characteristics of the production processes and products, even among actors all over the entire value chain, including industrial technicians and engineers, entrepreneurs and managers. By virtue of increasing awareness of these questions, recycling and use of plastic waste are progressively increasing, whereas landfilling these substances without processing is decreasing.
1 following a continuous growth pattern only slowed by the COVID-19 pandemic. In addition, the fossil-based production of this impressive flow of materials imposes several threats such as climate change, pollution, resource exhaustion, ecosystem damage, as well as consequences for human health. The economy of plastics is supported by a plentiful number of stakeholders2 who are involved in different ways, along the cycle of raw materials, products, and wastes. This means that the dynamics of this sector (among others) and the related concerns are not easily manageable. In fact, solutions to some of the abovementioned dilemmas can only emerge as a combination of contributions coming from several subjects, at different levels and scales: legislative, economic, industrial, and planning(macro); design, processing, technological, and chemical (micro). Companies, factories, and enterprises are progressively embodying this approach among their strategies especially because paying attention to problem prevention and innovation towards more sustainable production processes is increasing their competitiveness. In particular, much effort is currently made to detect and better understand the characteristics of the production processes and products, even among actors all over the entire value chain, including industrial technicians and engineers, entrepreneurs and managers. By virtue of increasing awareness of these questions, recycling and use of plastic waste are progressively increasing, whereas landfilling these substances without processing is decreasing.
Many investigation tools and indicators exist that enable studying in depth any component of an industrial synthesis pathway, facilitating problem identification and possible improvement. The life cycle assessment (LCA), in particular, is a standardized investigation tool, disciplined by the International Standard Organization,3,4 that is able to contextualize punctual chemical/technological data within the wider view of the entire life cycle of a product, from the extraction of raw materials to the end of life and consequent disposal of it (and its components) as a waste. The application of this method enables the acquisition of important information on all the process steps related to the entire life of an object and stimulates the identification and assignment of responsibility to all the actors/stakeholders directly and indirectly involved in these dynamics – from raw material providers to final consumers. This approach provides a link between the chemical essence of a project/process and the system-level optimization of all the components in all the phases of the production-consumption-disposal of a product, also in order to facilitate the transformation from a linear to a circular configuration of its production.
In recent years, the adoption of a life cycle thinking approach to the chemical sector was used as a basic concept to develop a new framework to support the release on the market of Safe and Sustainable-by-Design (SSbD) molecules. Several efforts were made by the EU institutions on SSbD molecules. Cefic (The European Chemical Industry Council) and JRC (Joint Research Center)5,6 have worked on the standardization of an innovative assessment scheme that takes into consideration safety aspects, environmental sustainability, and social and economic sustainability when designing new chemicals. It is expected that an SSbD approach will be more followed by researchers and companies, also in combination with a traditional LCA. After all, it represents the starting point for the development of a benign-by-design society.7
Background of the maleic anhydride production
Maleic anhydride (MA, C4H2O3) represents a polyfunctional platform molecule with several uses (e.g., polymers, alkyd resins and intermediates in the fine chemical industry).8 MA is the anhydride of maleic acid and within the category of bulk chemicals, it represents one of the most important building blocks since it is used in the synthesis of several compounds, such as phthalic-type alkyd and unsaturated polyester resins (used in the production of fiberglass reinforced plastics, in the construction and electrical industries, and in pipeline and marine construction), surface coatings, lubricants, additives, plasticizers, copolymers (e.g. MA – styrene and MA – acrylic acid), and agricultural chemicals (e.g. pesticides and growth inhibitors).9,10 As reported in Fig. 1, theMA market volume experienced an exponential increase since 1984, achieving an annual world production of 2.88 Mt in 2019. After a slight decrease in 2020–2021 (around 2.76–2.79 Mt), probably due to the effects of the COVID-19 pandemic, the overall amount is expected to reach 3.40 Mt in 2029.11 The industrial production of MA is historically based on the partial oxidation of two alternative precursors: benzene and n-butane.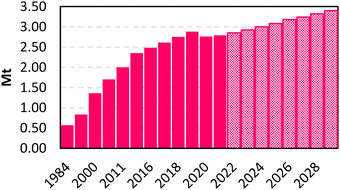 | ||
| Fig. 1 MA market volume in Mt. Dashed fill: forecast based on a CAGR (Compound Annual Growth Rate) of 2.5 percent from 2022–2029. | ||
Introduced in 1933, the benzene-based MA synthesis is the oldest industrial production method. The synthesis of MA involves the selective oxidation of benzene in the gas phase, at a temperature between 350–450 °C.12 The reaction is catalysed by mixed oxides of vanadium and molybdenum (V2O5 and MoO3) supported by inert materials. It allows obtaining a selectivity of MA equal to 74% with a conversion of benzene estimated at around 96–98%.13 However, due to its toxicity, the usage of benzene has been gradually abandoned in Europe (except for some plants) and in the United States, whereas it is still in force in some parts of Asia.14
Nowadays, MA is mainly synthesized through the n-butane route. Since the 1970s, the butane-based route has afforded 80% of the worldwide production of MA.14 It involves the selective oxidation of the C4 alkane in the presence of vanadyl pyrophosphate as the catalyst (VO2P2O7). It consists of mixed oxides of phosphorus and vanadium(IV). Depending on the type of technology used for the synthesis, the selectivity of MA reaches 53–65% and the conversion of n-butane does not exceed 90%.13 The usage of n-butane, as previously mentioned, can reduce the intrinsic toxicity of the process and its environmental impacts as already reported in the literature.14–18
Bio-based routes to MA: an overview
Recently, to overcome the fossil-based production of MA, following the 7th principle of green chemistry,19 new synthetic routes have been investigated. In detail, great relevance in this scenario is attributed to the MA preparation from two bio-based molecules: 1-butanol (bio-ButOH) and furfural (bio-Furf). Both represent viable and alternative substrates, currently used at the pilot scale. However, thanks to the sensible increase in the market of bio-based building blocks,20 it is conceivable to expect that both may support the traditional routes from petroleum.As reported by Pavarelli et al.,21 bio-ButOH can play a significant role in the bio-based chemical industry. It is mainly obtained from biomass fermentation through the ABE (acetone–butanol–ethanol) process, in particular, corn and sugarcane are the most used. Literature reports on the yield values of the ABE process starting from these precursors, estimated at around 4.54 kg of corn per liter of ButOH (corn worldwide production of 1.2 billion Mt in 2021)22 and on 25 kg of sugarcane per L ButOH (sugarcane worldwide production of 181 Mt in 2021).23,24 Alternatively, it can be obtained from propylene (hydroformylation to butyraldehyde and hydrogenation to 1-butanol), ethanol (dehydrogenation to acetaldehyde, aldol condensation, dehydration and hydrogenation of crotonaldehyde) or the catalytic hydrogenation of CO.21 Bio-ButOH world production ranges from 3.0 Mt to 3.6 Mt.25,26 In 2022 the US production was estimated to be around to 1.7 Mt, with a global market volume of 17.8 billion USD.27 The production of ButOH from biomass seems to be a consolidated process on the pilot scale.
In this scenario, the usage of bio-Furf has also been widely investigated by researchers, in particular on the pilot scale.18 Bio-Furf derives from the hemicellulose transformation that could be extracted from dedicated biomass (e.g. switchgrass) or in part from agricultural by-products (e.g., sawdust and corncobs).28 This aspect makes furfural a good candidate also toward 5-hydroxymethylfurfural (HMF) which has been used with good results for MA synthesis.29,30 However, on the global scale the production of Bio-Furf is far from that of bio-ButOH. In 2016, it was estimated to be around 370 kt (ref. 31) with a market value of 551 million USD in 2019 and a projection to achieve 700 million USD by 2024.31
In the last years, some researchers have investigated the environmental impacts related to fossil-based MA preparations through an LCA perspective.14,15–17 In 2022, Blanco et al.18 reported the characterization of novel technologies for MA production based on the use of furfural as a feedstock. Data for bio-Furf synthesis and its conversion to MA, both in the liquid and gas phase, were modeled considering the results of previous experiments.32,33 In their work, Blanco et al. highlighted the room for the future development of an alternative synthetic route toMA, by highlighting that the fossil-based syntheses are still competitive from an environmental point of view.
Therefore, to extend the scope of the proposed reaction pathways for MA synthesis from bio-based feedstocks, we reported the usage of the E-factor (Ef)34–36 and the LCA methodology3,4 to assess the potential burdens of the MA synthesis using bio-ButOH and bio-Furf as starting materials.
E f is well-known among chemists and easily applicable to each synthetic step.37,38 It is also a useful tool for companies,39–41 which have used it alone or together with other metrics.42 The importance of a combined usage of Ef and LCA, already largely discussed in the literature,43 depends on the possibility of extending the simple analysis conducted on waste production to other aspects (such as resources) and the possibility to translate all the inefficiencies in terms of potential impacts through the life cycle.
The LCA methodology is currently a consolidated approach for assessing the benefits behind the adoption of the green chemistry principles at different scales. In order to help synthetic chemists understand the importance and limitation of such tools, as well as their mechanism the journal published a tutorial review44 that can be used by readers to follow each step of our manuscript.
In the present study, the reactions were considered in the gas phase on a pilot scale. They were compared to allow the identification of the main weaknesses in terms of environmental sustainability and support future scale-up procedures.
Materials and methods
As mentioned above, the methodological approach followed in this research combined Ef and LCA to evaluate the potentialities of renewable feedstocks in the synthesis of MA. Ef is one of the most recognized green metrics, focused on a single problem (waste generation). On the other hand, LCA represents one of the most widespread methodologies used to address potential environmental impacts arising from production processes. Both are very well-known tools for chemists, who are familiar with the application at each stage (e.g., laboratory, scaling-up and industry) and sector (e.g., oil and gas, bio-based, nanoparticles, etc.). The combined use was adopted in order to cover more impact categories and achieve in-depth knowledge of the potential impacts at the environmental level. Despite the Ef value and the other green metrics being faster and simpler than a complete life cycle they are not able to inform on the burdens on ecosystems and human health. For instance, Ef does not discriminate against the dangerousness of the waste generated.43 In addition, they take into consideration just one category at a time. On the other hand, LCA is more time-consuming and expensive since an extensive knowledge of the software and database is needed. However, it can orient better the decision-making processes thanks to its structure and standardization according to the ISO 14040 series3,4 that identifies it as a key methodology to support ecolabelling45 and within the environmental management systems.46In this study, Ef was applied to both reactions to address the importance of including co-products in the case of multi-output systems like biorefineries. In fact, during the first level of analysis (level I Ef) the metric was calculated considering MA as the only product (since the target molecule). In this case, all the other streams were labelled as wastes. During the second level of analysis (level II Ef) the boundaries were extended to co-products (phthalic anhydride, acetic acid, acrylic acid and formaldehyde in the case of bio-ButOH MA; 2-furoic acid in the case of bio-Furf MA). Calculation steps and results are collected in the ESI (Table S1†).
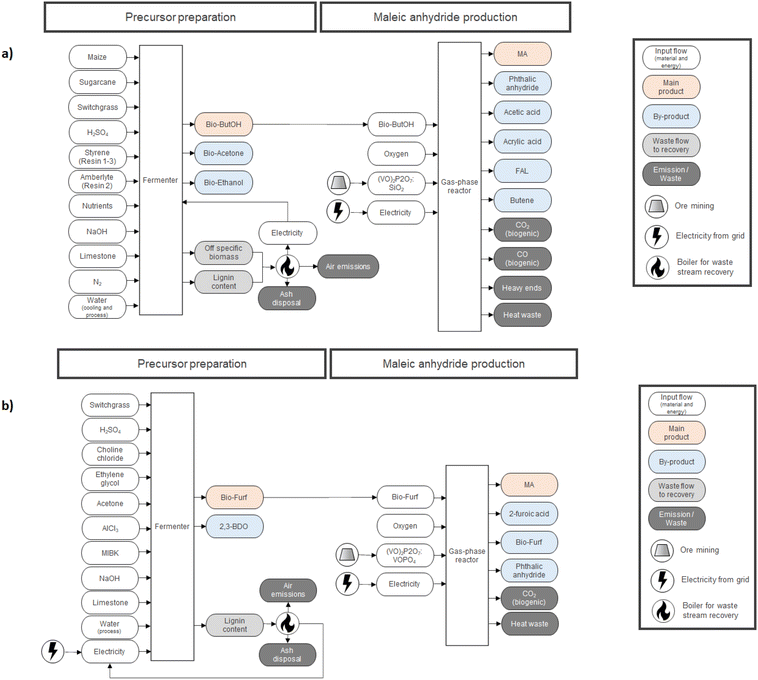
In the case of LCA, a cradle-to-gate approach was applied by selecting 1000 kg of MA as the functional unit (FU) for the study. Downstream stages (MA usage and its EoL – End of Life) were not included since they are equivalent for both routes and out of the scope of the study. Fig. 2 describes the entire supply chain and its boundaries, including each mass and energy flow necessary to synthesize MA on a pilot scale (e.g., reagents, catalysts, electricity, average transportation within the entire supply chain, waste treatment processes, etc.). Co-products were considered for mass allocation, as already done previously for other bio-based building blocks.47 Mass balances for MA were compiled starting from the reaction efficiencies (Y, C and S) reported in the literature for lab-scale routes. Values from the work of Pavarelli et al.21 were used in the case of bio-ButOH MA. On the other hand, bio-Furf MA was simulated using data from Li et al.48 Unfortunately, no data regarding the efficiency of the catalyst during the upscaling were available due to the corporate know-how. However, since lab tests were conducted using the circulating-fluid-bed reactor and the fixed-bed reactor, we assumed that the catalyst efficiency remained constant (to allow a complete evaluation of the mass balances). Catalytic systems were modelled through a peer-reviewed procedure.49,50 Since no data were available (due to the corporate know-how), the catalyst amount was assumed to be 1% (in mass) of the inlet organic stream. None of the energetic flow was included for re-generation and re-circulation (since it is considered negligible within the system boundaries). Energy consumption for the MA synthesis has been obtained from thermodynamic evaluations, according to the methodology described in the literature by Andraos.51 MA syntheses are extremely exothermic. In the ESI†, the enthalpy values of the reaction calculated by considering stoichiometry  has been reported.
In order to evaluate how results are influenced by energy flows, two different levels of analysis were considered. In the first level (level IEN), non-optimization was assumed: the energy released by the reaction was lost in the vessel as heat waste (already described by the system boundaries depicted in Fig. 2). The second level (level IIEN) represents an optimised model since it takes into account that 100% of the ΔrH° is recovered to pre-heat reagents, without further transformation. Updated system boundaries are reported in Fig. S1.† In both cases, the net energy inputs were calculated as a difference (q tot reaction – ΔrH°). Full energy balances are reported in the ESI (Tables S8–S11†). Since energy from the reaction is higher than the input request for the heat reagent, a negative energy balance was obtained for both the optimised cases. In these cases, a further recovery is introduced to simulate the recovery of heat in the form of steam (steam, in the chemical industry {RER}| production | APOS, U) that can be used for other processes on a pilot scale.
Upstream processes for the production of the main precursors, bio-ButOH and bio-Furf, were simulated using values extrapolated from TEA (Techno-Economic Analysis) studies.52–54 The main infrastructures (i.e. reactors and fermenters) were neglected since not being relevant to the study.
All models were created using SimaPro software (v.9.2).55 Ecoinvent database (v.3.8) was used for simulating all the background information,56 by selecting the market scenarios (to include impacts from average transportation distances) and the allocation at the point of substitution (APOS) unit models. The APOS model was selected in line with the attributional approach adopted in the study and considered more conservative rather than the other common approaches available on the ecoinvent database (cut-off and consequential). A consequential approach could be used, for example, in case the model includes bio-based sources from wastes. However, since no primary data were available and the world production of MA needs a constant feed (as far as possible) we did not simulate this scenario.
Pilot plants were settled in Europe, dedicated energy mix was simulated by the use of the process “Electricity, medium voltage {Europe without Switzerland}| market group for | APOS, U”. Where available, the same rule was applied for chemicals and auxiliaries (dedicated database processes were selected accordingly, mostly RER and European without Switzerland). Where not available, GLO and RoW scenarios were used. In the case of sugarcane, it was decided to adopt the most predominant market (Sugarcane {BR}| market for | APOS, U). Data used, for modelling the production of bio-precursors and MA syntheses, range from 2014–2020. These aspects were taken into consideration during the uncertainty analysis (see Table S20†). LCIs were modelled using the most recent ecoinvent unit processes, by avoiding obsolete and superseded ones.
Full LCI is described in the ESI (Tables S2–S7†). Fig. 2 reports a detailed description of each route.
Potential environmental burdens were evaluated using both the single-issue and multi-impact approach. The method developed by the Intergovernmental Panel of Climate Change, GWP100 (incl. CO2 uptake), v.1.01,57 and the CED (Cumulative Energy Demand, v.1.11)58 were used to address the single issue.
The IPCC 2021 method is specific for estimating impacts on the climate change by expressing results in terms of carbon footprint (e.g., kg CO2 eq.) in a 100-year time horizon. For this reason, it is suggested as a reference method by the related international standard.59 This method, differently from others, is able to split the carbon footprint into the main components: fossils, biogenic, land transformation and CO2 uptake. The latter one represents the contribution of the system in terms of carbon dioxide sequestration during the life cycle. We included this aspect, especially relevant for bio-based products, in order to identify the potential uptake of the starting biomasses.
CED represents “the entire demand, valued as primary energy, which arises in connection with the production, use and disposal of an economic good”,60 since it “quantifies the energy content of all different energy resources when they actually cross the boundary between the biosphere and the technosphere”.61 In other words, it addresses renewable and non-renewable resource consumption (expressed in terms of GJeq.).
In order to check a wider spectrum of the impacts, the ReCiPe 2016 methodology62 was also adopted (v.1.07). It represents a method of so-called multiple issues, able to classify and characterize the full LCI into 18 midpoint impact categories (problem-oriented) and aggregate them within 3 endpoint receptors (damage-oriented). In line with the aim of the study, all the methods selected have global relevance.
Bio-ButOH MA
Recently, the possibility of transforming bio-ButOH into MA through a gas-phase oxidation has been successfully explored using a bifunctional catalyst which can both dehydrate alcohols and oxidise the butenes (reaction intermediates) into MA.21 In particular, the catalyst used for this purpose is vanadyl pyrophosphate (VPP) which was used before for the preparation of MA through 1-butene oxidation.The reaction mechanism (Fig. 3) involves the preliminary dehydration of ButOH to 1-butene and then through isomerization its conversion to 2-butenes. The latter is further oxidized to crotonaldehyde. Crotonaldehyde is as a key reaction intermediate which, in turn, forms maleic acid and furan in two parallel reactions. Maleic acid and furan reacted to form MA through dehydration and oxidation, respectively. The process was optimized at feeding 1% mol ButOH in air and 340 °C with a 40% of selectivity toward MA (the conversion of the alcohol was completed). The reaction produces butenes, light acids (acrylic and acetic acid), carbon oxides, phthalic anhydride, and minor amounts of other oxygenated compounds (furan and formaldehyde).
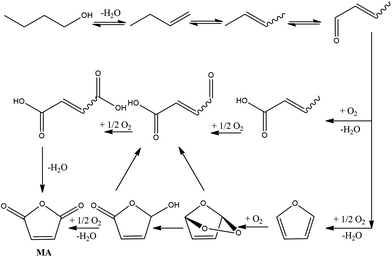 | ||
| Fig. 3 MA synthesis from bio-ButOH. Adapted from Pavarelli et al.21 | ||
In the LCI the scenario starts with the production of the bio-ButOH from three main sources of dedicated biomass in equal amounts, such as maize, sugarcane and switchgrass (Panicum virgatum), the latter being one of the most promising and economically important herbaceous crops.63 The choice of using three different feedstocks is in line with what has been suggested in the literature,52 because the pilot plant was designed to operate with various kinds of lignocellulosic biomass materials to satisfy the biofuel requests. Full LCI for the alcohol synthesis was obtained by re-scaling the values from literature52 on the basis of the mass allocation with respect to the main product (bio-ButOH 79.3%; bio-Acetone 10.3% and bio-EtOH 10.3%). The system was modelled assuming that biomass residues (lignin and off-specific) are burned in a boiler to produce steam, then transformed into electricity and used on-site to feed the fermenter. Combustion produces also ash (assumed to be disposed of) and air emissions (amount and type derived from the ecoinvent process “Heat, district or industrial, other than natural gas {ASCC}| heat and power co-generation, wood chips, 6667 kW, state-of-the-art 2014 | APOS, U”).
Bio-ButOH was then combined with oxygen (from air) within the gas-phase reactor, using the (VO)2P2O7![[thin space (1/6-em)]](https://www.rsc.org/images/entities/char_2009.gif) :
:![[thin space (1/6-em)]](https://www.rsc.org/images/entities/char_2009.gif) SiO2 (90
SiO2 (90![[thin space (1/6-em)]](https://www.rsc.org/images/entities/char_2009.gif) :
:![[thin space (1/6-em)]](https://www.rsc.org/images/entities/char_2009.gif) 10) catalyst to obtain MA assuming a quantitative conversion and selectivity affording MA in 39% yield.21 The reaction proceeds with the co-production of phthalic anhydride (PA, Y = 12.0%), acetic acid (AcA, Y = 8.0%), acrylic acid (AA, Y = 8.0%), formaldehyde (FAL, Y = 1.0%) and butene (BUT, Y = 1.0%). A mass allocation with respect to MA (56.7%) was considered. The catalyst system was modelled assuming stoichiometric elements enter the system as primary resources since they are directly extracted from mineral ores (except SiO2 which was simulated using the process: Silica sand {GLO}| market for | APOS, U) following a peer-reviewed procedure.49,50 Full LCI is reported in Tables S2, S3 and S6 in the ESI.†
10) catalyst to obtain MA assuming a quantitative conversion and selectivity affording MA in 39% yield.21 The reaction proceeds with the co-production of phthalic anhydride (PA, Y = 12.0%), acetic acid (AcA, Y = 8.0%), acrylic acid (AA, Y = 8.0%), formaldehyde (FAL, Y = 1.0%) and butene (BUT, Y = 1.0%). A mass allocation with respect to MA (56.7%) was considered. The catalyst system was modelled assuming stoichiometric elements enter the system as primary resources since they are directly extracted from mineral ores (except SiO2 which was simulated using the process: Silica sand {GLO}| market for | APOS, U) following a peer-reviewed procedure.49,50 Full LCI is reported in Tables S2, S3 and S6 in the ESI.†
Energy input was evaluated following the procedure already described and discussed in detail in the ESI (Tables S8 and S10†). In the level IEN, which considers not to recover the heat released from the reaction, an energy input of 1.2 × 10² kW h per ton of MA was imputed using the following process: Electricity, medium voltage {RER}| market group for | APOS, U. Full inventory of the scenario with 100% energy recovery from the reaction vessel to produce steam is reported in Table S12.† Steam amount was derived from energy balance considering an LHV of 2.75 MJ kg−1, as suggested by the reference process: Steam, in the chemical industry {RER}| production | APOS, U.
Bio-Furf MA
One of the first examples reported in the literature showed that bio-Furf is converted into MA (70% yield) in the continuous gas phase reaction at a furfural concentration of 1.6% in the feed and 54% yield in the batch reaction in the presence of H5PMo10V2O40 heteropolyacid in combination with Cu(CF3SO3)2 as the catalytic system and acetonitrile/acetic acid mixture as the solvent.64Recently, Li described the MA synthesis from bio-Furf in the presence of Mo4VO14 mixed metal oxides (reaction conditions: furfural 2 mmol, catalyst 30 mg, acetic acid, 10 ml, O2 20 bar, 120 °C, 16 h) with a 62% MA isolated yield.65 In 2018, Li reported improved results using a vanadium phosphorus oxide (VPO) catalyst plate synthesized by a hydrothermal method. In this case, MA was obtained (90% yield, 90.8% selectivity to MA) at 360 °C using air as the oxidant and 10 vol% of bio-Furf in the feed. Herein, the reaction involves the bio-Furf oxidation to furoic acid (rate determining step) and then the consequential oxidation to furan and then MA (see Fig. 4). The VPO catalyst was synthesized by a hydrothermal method which shows high activity also after 25 h. The reaction proceeds into a fixed bed micro-reactor operating in a downflow mode with an air-flow rate of 20 mL min−1 with a contact time of 1.5 seconds. The main by-products are CO (7%), 2-furoic acid (1.5), non-identified products and water (<1%).48
In order to fill the LCI for the upstream process, the production of the bio-Furf was simulated using the results from TEA reported by Zang et al.,53,54 which used switchgrass as the main precursor. The usage of a dedicated biomass is in line with the work of Blanco et al.18 2,3-BDO (57.8%) was co-produced through fermentation. Input and output flows were allocatedwith respect to bio-Furf (42.2%). In line with the previous scenario, the lignin content is assumed to be burned in a boiler to produce steam, then transformed into electricity and used on-site to feed the fermenter. Combustion also produced ash (assumed to be disposed of) and air emissions (amount and type derived from the ecoinvent process: “Heat, district or industrial, other than natural gas {ASCC}| heat and power co-generation, wood chips, 6667 kW, state-of-the-art 2014 | APOS, U”). In this case, the amount of electricity auto-produced (4.1 kW FU−U) is not enough for feeding the entire system. Therefore, an electricity input from the grid is necessary (322.4kW h FU−1).
Bio-Furf was then sent to a gas-phase reactor to be partially oxidised to MA in the presence of the (VO)2P2O7:VOPO4 – VPO catalyst. Almost complete conversion was obtained (99.2%) with a selectivity of 97.9% to MA. 2-Furoic acid and PA were co-generated during the reaction. Mass balance was re-built on the basis of the data from Li et al. by considering a mass allocation with respect to MA (92.9%).48 The catalyst system was modelled following a peer-reviewed procedure.49,50 Full LCI is reported in Tables S4, S5 and S7 in the ESI.†
In the case in which no energetic recovery was included in the boundaries (level IEN), an energy input of 1.3 × 10² kW h per FU was evaluated following the procedure already described and discussed in detail in the ESI (Tables S9 and S11†). This flow was simulated using the following : process Electricity, medium voltage {RER}| market group for | APOS, U. Full inventory of the scenario with 100% energy recovery from the reaction vessel to produce steam is reported in Table S13.† The steam amount was derived from the energy balance by considering an LHV of 2.75 MJ kg−1, as suggested by the reference process: Steam, in chemical the industry {RER}| production | APOS, U.
Results and discussion
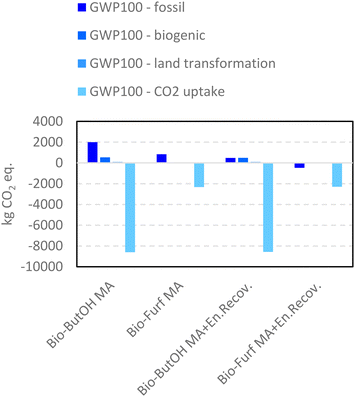
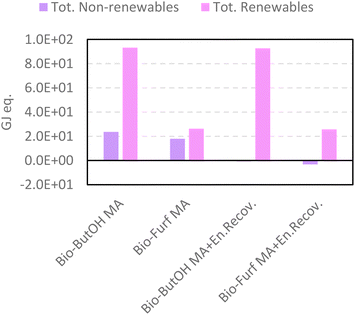
LCIs were first investigated using the Ef values. The green metric was used as a screening tool to support the choice to consider MA as the sole valuable output (level I Ef) or to include co-products within the mass allocation (Level II Ef). In fact, switching from a one-product system (MA) to a multi-output process the decrease in the E-factor values is relevant: −79% in the case of bio-ButOH MA (1.22 vs. 0.26) and −96% for the bio-Furf MA pathway (0.08 vs. 0.003). This is quite common in bio-based routes, where co-productions allow an overall impact reduction. Results from Ef also reflect a greater competitiveness of the bio-Furf MA than the alternative. These scores clearly demonstrate a major reaction selectivity (97.9%) to MA in this case, with an almost complete conversion of the precursor (99.2%). On the other hand, the reaction selectivity of bio-ButOH to MA is lower (39%), with a sensible co-production of non-valuable substances (e.g., CO2 (18%), CO (12%) and uncharacterized heavy compounds (1%)). However, the Ef value is limited to the amount of waste generated per product, by reflecting a common gate-to-gate boundaries approach.Therefore, the LCA methodology was also applied to investigate other environmental issues and to include the potential burdens of upstream stages in the study. As outlined before, the LCIA (life cycle impact assessment) phase was performed by the application of a single-impact and a multiple-impacts approach, in order to obtain a wider spectrum and R&D support. The first one can be used to identify where the main hotspots are located. Fig. 5 and 6 show the results expressed in terms of carbon footprint and resource consumption respectively (see also Tables S14 and S15†). Graphs depict the scores achieved by the simplified scenarios, without the (w/o) the energy recovery (level IEN), and those obtained for the level IIEN.
In the case of level IEN the bio-ButOH MA pathway achieves a greater impact for the carbon footprint in terms of fossil (−1.2 tCO2eq. per FU) and biogenic (−0.8 tCO2eq. per FU) flows, and for the land transformation index (−0.01 tCO2eq. per FU). On the other hand, the indicator CO2 uptake results are more competitive in the case of bio-ButOH MA. The trends achieved for the biogenic, land transformation and CO2 uptake are similar and all related to the same reason. In fact, all these tree sub-indicators reflect the intensity of the resources and energies requested within the supply chain of the dedicated biomasses used as precursors. In the ESI a contribution analysis run on both bio-based building blocks (see Tables S16 and S17†) has been reported. It has been confirmed that the mixed usage of biomasses (bio-ButOH) leads to a higher CO2 subtraction during growth rather than the single use of Panicum virgatum (bio-Furf), despite greater impacts on fossil, biogenic and land transformation indicators related to maize and sugarcane cultivation (that require intensive resources for exploitation, such as water and fertilizers). On the other hand, the GWP100 – fossil represents all fossil-based resources consumed for materials (e.g., chemicals) and energy vectors (e.g., fuel and electricity).
The results obtained for the optimised cases (level IIEN), in which a boundary extension occurred (Fig. S1†), are flagged as “+ En.Recov”. In this case, the energy recovery and its usage within the plant increase the competitiveness of each route compared to the former (the non-optimised model, level IEN). Despite the fact that bio-ButOH MA + En.Recov. contributes to mitigating the fossil indicator with −1.5 tCO2eq. per FU (with respect to bio-ButOH MA w/o the energy recovery) bio-Furf MA + En.Recov. still remains the more sustainable case in terms of fossil carbon footprint. With respect to the counterpart from bio-ButOH (i.e., bio-ButOH MA + En.Recov.) a potential reduction of −0.9 tCO2eq./FU was detected. The same trends were achieved for the biogenic and land transformation components.
On the other hand, bio-ButOH MA cases (with and w/o the energy recovery) remained those with better trends for the CO2 uptake (due to the extended usage of sugarcane and corn, Tables S16 and S17†). A network analysis carried out on the bio-ButOH supply chain for the fossil CO2 eq. indicator, shown in the ESI in the form of a Sankey-based diagram (Fig. S3†), confirms that despite the high contribution of the maize to the carbon uptake, its supply chain presents sensible impacts due to the exploitation of the resource during drying activities. In addition, the results from the network depict a significant burden connected to the glucose chain, the nutrient used within the fermentation to activate the process. Also in this case the leading cause is the maize supply chain, the main source used in the production of the carbohydrate.
Similar achievements were attained using CED (Fig. 6), which reflects the consumption and exploitation of resources (renewable and non-renewable) expressed as the energy equivalent (GJeq.). Among those studied, bio-Furf MA + En.Recov. achieves the best results in terms of the total amount of resources (see pairwise comparison in Table S18†). Negative results for the non-renewable, fossil are due to the avoided production of the steam generated from the energy recovery. Even though bio-ButOH MA + En.Recov. can recover a higher amount of heat per FU respect to bio-Furf MA + En.Recov. (9.4 tsteamvs. 4.9 tsteam), the lower selectivity (also detected by the usage of the Ef) affects negatively the overall results, by involving the necessity of using a greater quantity of the precursor (bio-ButOH) in the synthesis. As expected, the contribution of the bio-based starting chemicals on the consumption of whole resources is significant, and also has been depicted by the renewables share as shown in Fig. S2.†
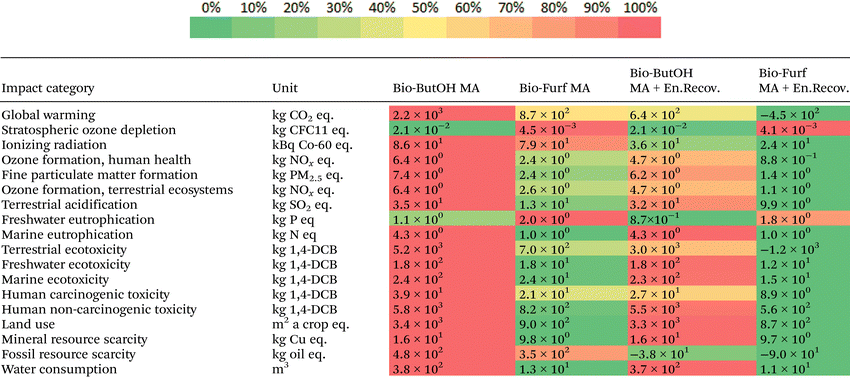
Cases were then assessed using the ReCiPe 2016 method, in order to evaluate the better solution from an environmental point of view through the use of a wider spectrum of potential impacts and confirm scores previously achieved. In Table 1 the results at the midpoint level have been collected. It consists of 18 categories that reflect problem-oriented impacts (e.g., terrestrial acidification potential, freshwater ecotoxicity, etc.). Colour shades highlight the cases with the higher (red) and lower (green) burden within each category. bio-Furf MA + En.Recov. achieved the best results for almost the totality of the categories studied (16 on 18). The bio-Furf MA process w/o the energy recovery is still competitive for 14 categories. On the other hand, the bio-ButOH MA cases seem to have lower impacts for SOD and FWEu. In addition, bio-ButOH MA + En.Recov. denotes good results also in the case of FRS, thanks to the steam recovered. Results for GW and FRS confirm the scores previously shown through IPCC and CED.
In accordance with the scores previously discussed, a contribution analysis was carried out only focusing the attention on the optimised cases. This assessment allows the identification of the main environmental hotspots, settling thus the basis for improvement. Scores are shown in Fig. 7 and presented in Table S19.† The production of bio-based precursors are the most influencing stages for the majority of the impact categories in both cases. This trend confirms the results discussed previously for CED and IPCC. As expected, in both cases the resource consumption for the catalyst production only presents a notable impact in the MRS category, with 86% contribution in A and 97% in B. In case A, the bio-ButOH chain noticeably affects some categories with a greater contribution for SOD, MEu, FWEc, MEc, HNCT, LU and WC. Differently, the preparation of bio-Furf shows a greater effect on SOD, FWEu, MEu, LU and WC. According to the network analysis (Fig. S4–S8†), higher scores on SOD, MEu and, LU are mostly related to the chain of switchgrass (Grass, Swiss integrated production {GLO}| market for | APOS, U). On the other hand, results obtained for FWEu and WC are due to the consumption of auxiliaries, in particular 4 methyl-2-pentanone (MIBK) and acetone.
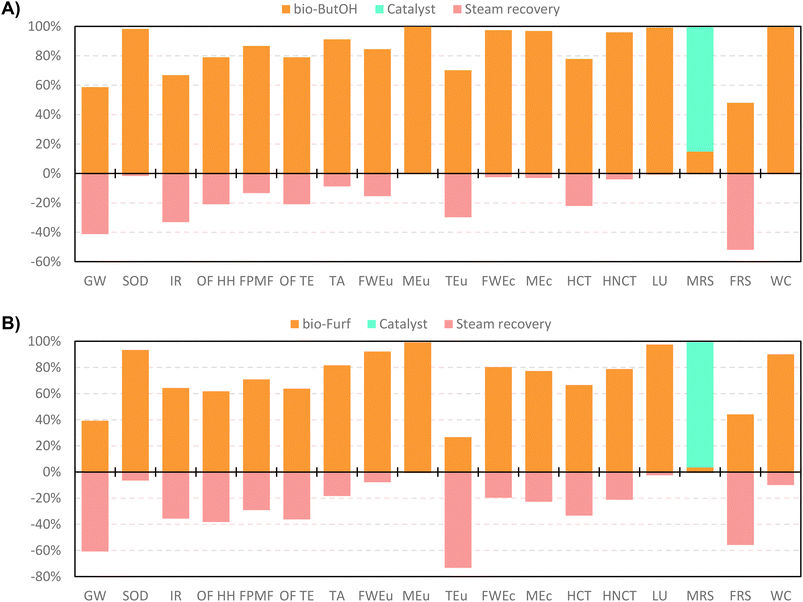 | ||
| Fig. 7 Contribution analysis ofbio-ButOH MA + En.Recov. (A) and bio-Furf MA + En.Recov. (B) using the ReCiPe 2016 method (v.1.07). | ||
In order to verify where the impacts are concentrated within the precursors, a list of procedures was then set to guide future improvements, and a further contribution analysis was run. Results, collected in Tables S20–S21,† are shown in Fig. 8 using a colour shade matrix.
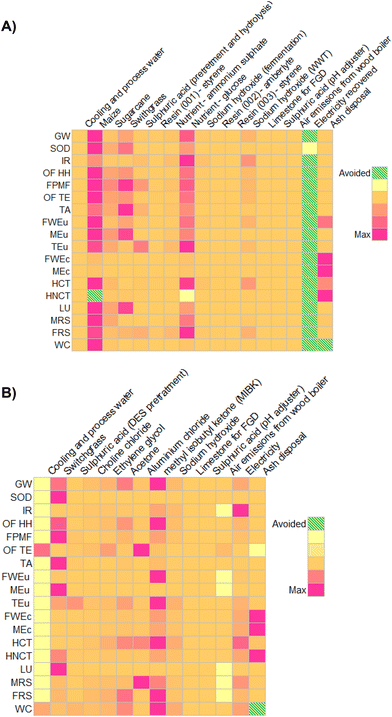 | ||
| Fig. 8 Contribution analysis forbio-ButOH (A) and bio-Furf (B) production chains, using the ReCiPe 2016 method (v.1.07). | ||
Moving from yellow to purpura squares the contribution of the LCI flows (mass or energy) per category increase drastically. Dashed green cells represent avoided impacts. In the case of the bio- Furf MA + En.Recov. the energy recovery column has not been reported since the model just considers the net consumption (equal to energy input minus that recovered from lignin combustion). It has also been depicted that, the cultivation and the market distribution of the maize (Maize grain {GLO}| market for | APOS, U), switchgrass (Grass, Swiss integrated production {GLO}| market for | APOS, U) and sugarcane (Sugarcane {BR}| market for | APOS, U) lead to the main impacts on different categories in both precursors. Those reflect the potential effects related to the cultivation of a dedicated biomass. For example, corn requires an adequate amount of water (0.169 m3 per kg of maize, considering direct and embodied consumption) and fertilizers. Also, the processes that simulate the other dedicated feedstocks achieved high burdens in the majority of the 18 categories. In particular the switchgrass contribution was not negligible as depicted in the ESI (see the Sankey-based diagram, Fig. S3†). The results here depicted are in line with those already reported in recent works concerning the sector of bio-based chemicals,18,38,47,66,67 which confirm that the competitiveness of a biorefinery process is in its possibility of using a combination of dedicated and marginal crops (or waste), and in the co-production of mass and energy flows. Otherwise, the overall efficiency decreases drastically (as seen for Ef).
In conclusion we can affirm that LCA has shown some preliminary results using three analysis methods that confirm the synthesis from bio-Furf to be more competitive. Despite the fact that the production of bio-ButOH is largely diffused (production of fuel), the efficiency of the catalyst used to convert the alcohol into MA should to be increased. The lower selectivity to MA, despite the co-production of some valuable chemicals, lead to a lower Ef value that reflects a higher quantity of reactants used per FU. This is converted into potential higher impacts on the selected categories. As expected, the results are affected by the catalyst efficiencies assumed constant to those conducted at the laboratory scale due to the absence of further details. This assumption, despite being considered a valuable approximation of pilot scale reactors, could represent a limitation of the study.
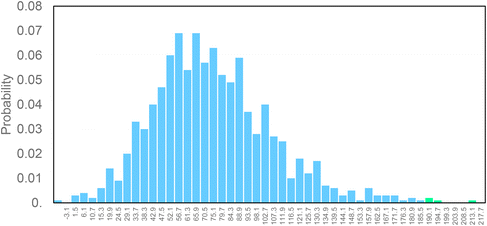
Finally, in order to verify the robustness of the LCA models a Monte Carlo analysis was performed. A data pedigree matrix68 was used to calculate uncertainty ranges for the LCI data concerning reagents, catalyst, energy input, emissions and waste streams. The lognormal statistical distribution, with a 95% confidence interval and an iterative calculation number of 1000 simulations, was applied. This approach is consolidated within the LCA practitioners. Early works were related to building and construction materials.69–71 Now it is also used to support the assessment of some fundamental environmental issues, as done by Poncelet et al.72 in the case of minerals criticality. The results are collected in Fig. 9, by considering problem oriented ReCiPe 2016 (endpoint – characterization). The impact categories are shown on the y-axis, while the x-axis shows the percentage values achieved by the scenarios at the end of the simulations (after 1000 runs). Light blue bars depict the number of times the bio-ButOH MA process achieved a greater impact than the bio-Furf MA process. Conversely, the light green bars represent the opposite situation. The sensitivity analysis has confirmed that the bio-Furf MA process reaches lower impacts for the majority of the categories assessed (except for FWEu). In order to assess the overall robustness, the trend was also verified at the single score level (Fig. 10). Light blue bars represent the frequency of the runs (99.8%) for which bio-ButOH MA achieved a higher cumulative impact than bio-Furf MA. Green bars confirm that only in 0.2% of the runs the bio-Furf MA is more impacting from an environmental point of view.
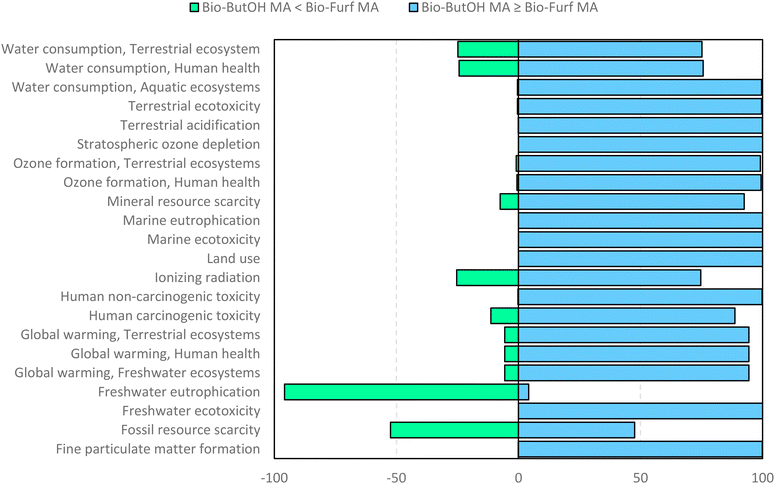 | ||
| Fig. 9 Uncertainty analysis of bio-based MA routes: the single score impact of each impact category using the ReCiPe 2016 method (v.1.1). Monte Carlo simulation (1000 runs). | ||
Conclusions
We presented a LCA of two alternative MA production processes, by selecting bio-ButOH and bio-Furf as precursors. In both cases, dedicated biomasses were used, in order to simulate the more conservative scenarios from an environmental and technological point of view. In fact, the usage of crops represents a more consolidated alternative to petroleum-based precursors (e.g., butane, benzene) on a pilot scale. The bio-based routes studied here are not intended to replace large-scale plants, but to support them and lead to the start-up of the bio-MA market, as already proposed to promote the development of a sustainable bioeconomy.45The scores presented above have classified bio-Furf MA as more suitable for upscaling, compared to the counterpart from bio-ButOH. However, the results of the study should be intended as a screening benchmark to set future scale-up strategies and not to give MA from bio-ButOH a bad name. As largely discussed, both bio-based pathways are far from being considered net zero (in particular regarding the climate change impacts). First of all, the results discussed are valid within the boundaries considered. A different geographic scope (e.g., lower carbon energy, more local sources, etc.) may affect drastically the final results. In addition, as said, further mitigation can be achieved by focusing the efforts on reducing the energy input for the syntheses by recovery enthalpy of the reaction and used the surplus to generate steam. This assessment could be also useful to support new plant design and set better synergies to recover and valorise such energy stream (e.g., in combination with energy intensive processes).
Then, as outlined for both, one of the main criticalities is the catalysts activity (that reflects the inefficiencies detected by the LCA models). R&D efforts on developing new catalytic systems will have a prominent effect on mass balances, by also affecting LCI and LCIA. Further improvements within the catalytic systems yield are those set of data that are expected to promote better environmental results.
Additional studies may be also addressed to the exploitation of marginal or waste vegetable biomasses in combination with the dedicated ones. Balat and Ayar73 estimated an annual world biomass production of around 146 billion metric tons. Concentrating the efforts on the residual part only, it is possible to co-feed bio-based chemical reactors. However, given its high volumes worldwide the possibility of producing 100% waste-based MA (like the other main building blocks) seems to remain limited to the pilot scale only.
Abbreviations
| AA | Acrylic acid |
| ABE | Acetone–butanol–ethanol |
| AcA | Acetic acid |
| APOS | Allocation at the point of substitution |
| bio-ButOH | Bio-based 1-butanol |
| bio-Furf | Bio-based furfural |
| BUT | Butene |
| E f | E-Factor |
| EoL | End of life |
| FAL | Formaldehyde |
| FPMF | Fine particulate matter formation |
| FRS | Fossil resource scarcity |
| FWEc | Freshwater ecotoxicity |
| FWEu | Freshwater eutrophication |
| GW | Global warming |
| HCT | Human carcinogenic toxicity |
| HMF | 5-Hydroxymethylfurfural |
| HNCT | Human non-carcinogenic toxicity |
| IR | Ionizing radiation |
| LCA | Life cycle assessment |
| LCI | Life cycle inventory |
| LCIA | Life cycle impact assessment |
| LU | Land use |
| MA | Maleic anhydride |
| MEc | Marine ecotoxicity |
| MEu | Marine eutrophication |
| MRS | Mineral resource scarcity |
| OFHH | Ozone formation, human health |
| OFTE | Ozone formation, terrestrial ecosystems |
| PA | Phthalic anhydride |
| Pt | Point |
| SOD | Stratospheric ozone depletion |
| TA | Terrestrial acidification |
| TEA | Techno-economic analysis |
| TEu | Terrestrial ecotoxicity |
| VPP | Vanadyl pyrophosphate |
| w/o | Without |
| WC | Water consumption |
Author contributions
R. C.:writing – original draft. D. C.: conceptualization; writing – original draft. M. R.: formal analysis; investigation. E. N.: writing – review & editing. F. P.: supervision. F. M. P.: writing – review & editing.Conflicts of interest
There are no conflicts to declare.Acknowledgements
R. C. is grateful to Italian Ministero dell'Istruzione dell'Università e della Ricerca for the financial support provided through the LEVANTE project PRIN-Bando 2020, Prot. 2020CZCJN7. D. C. and F. P. are grateful for the support received from “Ecosystem for Sustainable Transition in Emilia-Romagna, project funded by European Union under the National Recovery and Resilience Plan (NRRP), Mission 04 Component 2 Investment 1.5—NextGenerationEU, Call for tender n. 3277 dated 30/12/2021, Award Number: 0001052 dated 23/06/2022” and from “Agritech National Research Center and received funding from the European Union Next-Generation EU (PIANO NAZIONALE DI RIPRESA E RESILIENZA (PNRR) – MISSIONE 4 COMPONENTE 2, INVESTIMENTO 1.4 – D.D. 1032 17/06/2022, CN00000022)”.References
- Plastics Europe (2021) Plastics – The Facts, 2021. Available at: https://plasticseurope.org/knowledge-hub/plastics-the-facts-2021/(accessed 7 June 2023).
- W. d'Ambrières, “Plastics recycling worldwide: current overview and desirable changes”, Field Actions Science Reports, 2019. Available at: https://journals.openedition.org/factsreports/5102#abstract (accessed 7 June 2023) Search PubMed.
- International Organization for Standardization (ISO) (2006a) 14040:2006, Environmental Management—Life Cycle Assessment—Principles and Framework. Geneva, Switzerland: ISO.
- International Organization for Standardization (ISO) (2006b) 14044:2006, Environmental Management—Life Cycle Assessment—Requirements and Guidelines. Geneva, Switzerland: ISO.
- The European Chemical Industry Council (Cefic), Safe and Sustainable by-Design: A transformative Power, 2022. Available at: https://cefic.org/app/uploads/2022/04/Safe-and-Sustainable-by-Design-Guidance-A-transformative-power.pdf (accessed 07 June 2023).
- C. Caldeira, R. Farcal, I. Garmendia Aguirre, L. Mancini, D. Tosches, A. Amelio, K. Rasmussen, H. Rauscher, J. Riego Sintes and S. Sala, Safe and Sustainable by Design chemicals and materials - Framework for the definition of criteria and evaluation procedure for chemicals and materials. EUR 31100 EN, Publications Office of the European Union, Luxembourg, 2022, ISBN 978-92-76-53264-4, p. JRC128591, DOI:10.2760/487955.
- D. Cespi, I. Esposito, R. Cucciniello and P. T. Anastas, Curr. Res. Green Sustain. Chem., 2020, 3, 100028 CrossRef.
- B. M. Culbertson and B. C. Trivedi, Maleic Anhydride, Springer, New York, 1982. DOI:10.1007/978-1-4757-0940-7.
- K. Lohbeck, H. Haferkorn, N. Fuhrmann and N. Fedtke, Maleic and Fumaric Acids. Ullmann's Encyclopedia of Industrial Chemistry, Wiley–VCH Verlag GmbH & Co. KGaA., 2000 Search PubMed.
- T. R. Felthouse, J. C. Burnett, S. F. Mitchell and M. J. Mummey, Maleic Anhydride, Maleic Acid, and Fumaric Acid. Kirk-Othmer Encyclopedia of Chemical Technology, John Wiley & Sons, Inc., 2000 Search PubMed.
- statista.com, Market volume of maleic anhydride worldwide from 2015 to 2021, with a forecast for 2022 to 2029. Available at: https://www.statista.com/statistics/1245233/maleic-anhydride-market-volume-worldwide/#:~:text=In%202021%2C%20the%20global%20market,worldwide%20in%20the%20year%202029 (accessed 7 June 2023).
- A. Chauvel and G. Lefebvre, Petrochemical processes: Technical and economic characteristics, Gulf Pub. Co., Éditions Technip., 1989 Search PubMed.
- M. Novelli, M. Leonardi and C. Cortelli, Selective Oxidation Reactions in Polynt: An Overview of Processes and Catalysts for Maleic Anhydride | Handbook of Advanced Methods and Processes in Oxidation Catalysis (world), 2014. DOI:10.1142/9781848167513_0014.
- P. V. Mangili, P. G. Junqueira, L. S. Santos and D. M. Prata, Clean Technologies and Environmental Policy, 2019, vol. 21, pp. 1073–1090 Search PubMed.
- X. Domènech, J. A. Ayllón, J. Peral and J. Rieradevall, Environ. Sci. Technol., 2002, 36, 5517–5520 CrossRef PubMed.
- S. Salciccia, F. Passarini, F. Cavani, E. Neri and D. Cespi, Analisi del ciclo di vita applicato alla produzione di anidride maleica mediante vie alternative di sintesi industriale, Mater Thesis, 2014 Search PubMed.
- P. V. Mangili and D. M. Prata, Chem. Eng. Sci., 2020, 212, 115313–115329 CrossRef.
- J. Blanco, M. Linares, M. López Granados, I. Agirre, I. Gandarias, P. L. Arias, J. Iglesias, J. Moreno and A. García, Adv. Sustainable Syst., 2022, 2200121–2200136 CrossRef CAS.
- P. T. Anastas and J. Warner, Green chemistry: theory and practice, Oxford University Press, 1998 Search PubMed.
- D. Saviello, D. Cespi, V. Sharma, S. Miao and R. Cucciniello, The frontier of biobased polymers: synthesis, characterization, application, and sustainability assessment, Int. J. Polym. Sci., 2017, 1–2 Search PubMed.
- G. Pavarelli, J. Velasquez Ochoa, A. Caldarelli, F. Puzzo, F. Cavani and J.-L. Dubois, ChemSusChem, 2015, 8, 2250–2259 CrossRef CAS.
- statista.com, Corn production worldwide 2014/15-2021/22. Available at: https://www.statista.com/statistics/1156213/global-corn-production/(accessed 7 June 2023).
- statista.com, Global sugar production by leading country. Available at: https://www.statista.com/statistics/495973/sugar-production-worldwide/(accessed 7 June 2023).
- S. Väisänen, J. Havukainen, V. Uusitalo, M. Havukainen, R. Soukka and M. Luoranen, Renewable Energy, 2016, 89, 401–410 CrossRef.
- H.-D. Hahn, G. Dämbkes, N. Rupprich, H. Bahl and G. D. Frey, Butanols, Ullmann'sEncyclopedia of Industrial Chemistry, Wiley, 2013 Search PubMed.
- L. G. Pereira, M. F. Chagas, M. O. S. Dias, O. Cavalett and A. Bonomi, J. Cleaner Prod., 2015, 96, 557–568 CrossRef CAS.
- . Grand View Research, Inc. 2022, Bio-butanol Market Size, Share & Trends Analysis Report By Application, By Region (North America, Europe, Asia Pacific, RoW), And Segment Forecasts, 2016–2022. Available at: https://www.grandviewresearch.com/industry-analysis/bio-butanol-industry (accessed 7 June 2023).
- S. Peleteiro, S. Rivas, J. Luis Alonso, V. Santos and J. Parajó, Bioresour. Technol., 2016, 202, 181–191 CrossRef CAS PubMed.
- Z. Du, J. Ma, F. Wang, J. Liu and J. Xu, Green Chem., 2011, 13, 554–557 RSC.
- J. Lan, J. Lin, Z. Chen and G. Yin, ACS Catal., 2015, 5, 2035–2041 CrossRef CAS.
- K. J. Yong, T. Y. Wu, C. B. T. L. Lee, Z. J. Lee, Q. Liu, J. Md Jahim, Q. Zhou and L. Zhang, Biomass Bioenergy, 2022, 161, 106458–106475 CrossRef CAS.
- I. Agirre, I. Gandarias, M. L. Granados and P. L. Arias, Biomass Convers. Biorefin., 2020, 10, 1021–1033 CrossRef CAS.
- H. Schöppe, P. Kleine-Möllhoff and R. Epple, Processes, 2020, 8, 119–130 CrossRef.
- R. A. Sheldon, Chem. Ind., 1992, 23, 903–906 Search PubMed.
- R. A. Sheldon, Chem. Ind., 1997, 1, 12–15 Search PubMed.
- F. Roschangar, R. A. Sheldon and C. H. Senanayake, Green Chem., 2015, 17, 752–768 RSC.
- R. A. Sheldon, ACS Sustainable Chem. Eng., 2018, 6, 32–48 CrossRef CAS.
- D. Cespi, R. Cucciniello, M. Ricciardi, C. Capacchione, I. Vassura, F. Passarini and A. Proto, Green Chem., 2016, 18, 4559–4570 RSC.
- P. J. Dunn, S. Galvin and K. Hettenbach, Green Chem., 2004, 6, 43–48 RSC.
- D. Cespi, E. S. Beach, T. E. Swarr, F. Passarini, I. Vassura, P. J. Dunn and P. T. Anastas, Green Chem., 2015, 17, 3390–3400 RSC.
- P. J. Dunn, A. S. Wells and M. T. Williams, Green Chemistry in the Pharmaceutical Industry, Wiley-VCH Verlag GmbH & Co. KGaA, Weinheim, Germany, 2010 Search PubMed.
- D. J. C. Constable, A. D. Curzons and V. L. Cunningham, Green Chem., 2002, 4, 521–527 RSC.
- D. Cespi, F. Passarini, E. Neri, R. Cucciniello and F. Cavani, LCA integration within sustainability metrics for chemical companies, in Life Cycle Assessment in the Chemical Product Chain: Challenges, Methodological Approaches and Applications ed. S. Maranghi and C. Brondi, 2020, pp. 53–73 Search PubMed.
- D. Kralisch, D. Ott and D. Gericke, Green Chem., 2015, 17, 123–145 RSC.
- T. E. Swarr, R. Cucciniello and D. Cespi, Green Chem., 2019, 21, 375–380 RSC.
- International Organization for Standardization (ISO) (2015) 14001:2015, Environmental Management Systems—Requirements With Guidance for Use. Geneva, Switzerland: ISO.
- D. Cespi, F. Passarini, I. Vassura and F. Cavani, Green Chem., 2016, 18, 1625–1638 RSC.
- X. Li, J. Ko and Y. Zhang, ChemSusChem, 2018, 11, 612–618 CrossRef CAS.
- D. Cespi, F. Passarini, E. Neri, I. Vassura, L. Ciacci and F. Cavani, J. Cleaner Prod., 2014, 69, 17–25 CrossRef CAS.
- D. Cespi, F. Passarini, F. Cavani, E. Neri and I. Vassura, Chem. Eng. Trans., 2014, 36, 169–174 Search PubMed.
- J. Andraos, ACS Sustainable Chem. Eng., 2016, 4, 312–323 CrossRef CAS.
- M.-O. Jang and G. Choi, Biochem. Eng. J., 2018, 134, 30–43 CrossRef CAS.
- G. Zang, A. Shah and C. Wan, J. Cleaner Prod., 2020, 260, 120837–120847 CrossRef CAS.
- G. Zang, A. Shah and C. Wan, Biofuels, Bioprod. Biorefin., 2020, 14, 326–343 CrossRef CAS.
- PRé Consultants, SimaPro v.9.2, Amersfoort, Netherland, 2021 Search PubMed.
- Ecoinvent Centre (formerly Swiss Centre for Life Cycle Inventories), Ecoinvent v.3.8 Database, 2021 Search PubMed.
- Intergovernmental Panel on Climate Change (IPCC), Climate Change 2021. The Physical Science Basis, Sixth Assessment Report, Cambridge University Press, UK, 2021. Available at: https://www.ipcc.ch/report/ar6/wg1/(accessed 7 June 2023) Search PubMed.
- R. Frischknecht, N. Jungbluth, H.-J. Althaus, C. Bauer, G. Doka, R. Dones, R. Hischier, S. Hellweg, S. Humbert, T. Köllner, Y. Loerincik, M. Margni and T. Nemecek, Implementation of Life Cycle Impact Assessment Methods, ecoinvent report No. 3, v2.0, Swiss Centre for Life Cycle Inventories, Dübendorf, 2007 Search PubMed.
- International Organization for Standardization (ISO) (2018) 14067:2018, Greenhouse gases—Carbon footprint of products—Requirements and guidelines for quantification. Geneva, Switzerland: ISO.
- VDI – Verein Deutscher Ingenieure, VDI-richtlinie 4600: Cumulative energy demand, terms, definitions, methods of calculation, Düsseldorf, Germany, 1997 Search PubMed.
- R. Frischknecht, F. Wyss, S. Büsser Knöpfel, T. Lützkendorf and M. Balouktsi, Cumulative energy demand in LCA: the energy harvested approach, Int. J. Life Cycle Assess., 2015, 20, 957–969 CrossRef CAS.
- M. A. J. Huijbregts, Z. J. N. Steinmann, P. M. F. Elshout, G. Stam, F. Verones, M. D. M. Vieira, A. Hollander, M. Zijp and R. van Zelm, ReCiPe 2016 – A harmonized life cycle impact assessment method at midpoint and endpoint level, National Institute for Public Health and the Environment (RIVM), Netherlands, 2017 Search PubMed.
- W. Li, P. Ciais, D. Makowski and S. Peng, Sci. Data, 2018, 5, 180169–180178 CrossRef PubMed.
- J. Lan, Z. Chen, J. Lin and G. Yin, Green Chem., 2014, 16, 4351–4358 RSC.
- X. Li, B. Ho and Y. Zhang, Green Chem., 2016, 18, 2976–2980 RSC.
- A. Tripodi, E. Bahadori, D. Cespi, F. Passarini, F. Cavani, T. Tabanelli and I. Rossetti, ACS Sustainable Chem. Eng., 2018, 6(4), 5441–5451 CrossRef CAS.
- M. Volanti, D. Cespi, F. Passarini, E. Neri and F. Cavani, et al. , Green Chem., 2019, 21, 885–896 RSC.
- B. P. Weidema and M. Wesnaes, Data quality management for life cycle inventories e an example for using data quality indicators, J. Cleaner Prod., 1996, 4, 167–174 CrossRef.
- M. A. J. Huijbregts, Int. J. LCA, 1998, 3, 273–280 CrossRef.
- M. A. J. Huijbregts, Int. J. LCA, 1998, 3, 343–351 CrossRef CAS.
- M. A. J. Huijbregts, W. Gilijamse, A. D. M. J. Ragas and L. Reijnders, Environ. Sci. Technol., 2003, 37, 2600–2608 CrossRef CAS PubMed.
- A. C. Poncelet, P. Loubet, C. Helbig, A. Beylot, S. Muller, J. Villeneuve, B. Laratte, A. Thorenz, A. Tuma and G. Sonnemann, Int. J. LCA, 2022, 27, 1180–1198 CrossRef.
- M. Balat and G. Ayar, Biomass Energy in the World, Use of Biomass and Potential Trends, Energy Sources, 2005, 27, 931–940 CrossRef.
Footnotes |
| † Electronic supplementary information (ESI) available. See DOI: https://doi.org/10.1039/d2gc03707f |
| ‡ These authors contributed equally to the manuscript. |
| This journal is © The Royal Society of Chemistry 2023 |

