
 Open Access Article
 This Open Access Article is licensed under a
 Creative Commons Attribution 3.0 Unported Licence
Ethylcoprostanol modulates colorectal cancer cell proliferation and mitigates cytotoxicity of cholesterol metabolites in non-tumor colon cells†
Mussa
Makran
 ,
Guadalupe
Garcia-Llatas
*,
Amparo
Alegría
and
Antonio
Cilla
,
Guadalupe
Garcia-Llatas
*,
Amparo
Alegría
and
Antonio
Cilla
Nutrition and Food Science Area, Faculty of Pharmacy and Food Sciences, University of Valencia, Av. Vicent Andrés Estellés s/n, 46100 Burjassot, Valencia, Spain. E-mail: guadalupe.garcia@uv.es
First published on 15th November 2023
Abstract
Sterols can be metabolized by gut microbiota. The cholesterol metabolites have been proposed as promoters of colorectal cancer (CRC), while the effect of plant sterol metabolites is unknown. This study aimed to evaluate the cytotoxicity of metabolites from cholesterol (coprostanol, cholestanol, coprostanone and cholestenone) and β-sitosterol (ethylcoprostanol) on human colon tumor (Caco-2) and non-tumor (CCD-18Co) cells at physiological concentrations (9–300 μM) and exposure time (24 h). Ethylcoprostanol reduced the tumor cell proliferation (MTT), showing in flow cytometry assays induction of apoptosis via production of reactive oxygen species (ROS) and ceramide. Transcriptomic analysis (qPCR) showed activation of the intrinsic apoptosis pathway (BAX/BCL2 ratio and CASP9 increased), accompanied by downregulation of the p21 gene. Cholesterol metabolites, mainly the most hydrophobic, induced apoptosis and G0/G1 phase arrest in non-tumor cells through overproduction of ROS. Both the intrinsic and extrinsic (CASP8 increased) apoptosis pathways occurred. In turn, a reduction in the expression of the cyclin E1 gene confirmed the cell cycle arrest. In addition, ethylcoprostanol protected non-tumor cells from the most cytotoxic cholesterol metabolite (cholestenone). In conclusion, ethylcoprostanol is a promising candidate as a therapeutic adjuvant in CRC, while cholesterol metabolites could act as CRC promoters through their cytotoxicity.
1. Introduction
With 1![[thin space (1/6-em)]](https://www.rsc.org/images/entities/char_2009.gif) 931590 new cases in 2020, colorectal cancer (CRC) ranks as the third most common and second deadliest cancer, leading to significant comorbidities in patients and high costs to healthcare systems.1 Genetic and environmental factors are involved in the complex etiology of CRC, among those gut microbiota stands out.2 In this regard, cholesterol can be metabolized by the colonic microbiota (mainly bacteria of the Eubacterium and Bacteroides genera) to coprostanol, through direct reduction or by the formation of intermediates (cholesterone, cholestenone, coprostanone or coprostanol).3 To a lesser extent, cholestenone can be reduced to cholestanol, and coprostanol isomerized to epicoprostanol. In this way, epidemiological,4,5 animal6,7 and in vitro8 studies point out that cholesterol-derived metabolites produced by the intestinal microbiota could play a relevant role in colorectal carcinogenesis. Although numerous biological effects of cholesterol metabolites (mainly cholestenone) have been studied,9–11 their implication in the etiology of CRC is still not fully elucidated.
931590 new cases in 2020, colorectal cancer (CRC) ranks as the third most common and second deadliest cancer, leading to significant comorbidities in patients and high costs to healthcare systems.1 Genetic and environmental factors are involved in the complex etiology of CRC, among those gut microbiota stands out.2 In this regard, cholesterol can be metabolized by the colonic microbiota (mainly bacteria of the Eubacterium and Bacteroides genera) to coprostanol, through direct reduction or by the formation of intermediates (cholesterone, cholestenone, coprostanone or coprostanol).3 To a lesser extent, cholestenone can be reduced to cholestanol, and coprostanol isomerized to epicoprostanol. In this way, epidemiological,4,5 animal6,7 and in vitro8 studies point out that cholesterol-derived metabolites produced by the intestinal microbiota could play a relevant role in colorectal carcinogenesis. Although numerous biological effects of cholesterol metabolites (mainly cholestenone) have been studied,9–11 their implication in the etiology of CRC is still not fully elucidated.
On other hand, the occurrence of side effects and the emergence of drug resistance, prompts for an urgent need to find new and more effective drugs for CRC treatment.12 In this sense, several studies have demonstrated that many natural products possess effective anti-CRC activity and may serve as adjuvant chemotherapy agents for CRC treatment.13 In this regard, plant sterols (PS) have shown to be promising anticancer agents, showing antiproliferative activity against colon cancer cells.14,15 In addition, the rate of intestinal absorption of PS is low (2–3%), which means that non-absorbed PS reach the colon and can biotransformed by gut microbiota.3 In this sense, it has been reported that β-sitosterol and campesterol are mainly transformed into ethyl- and methyl-coprostanol, and then ethyl- and methyl-coprostanone, respectively, while the microbial degradation pathway of stigmasterol has not been fully elucidated. Although different biological effects have been attributed to metabolites derived from cholesterol, PS metabolites have not yet been studied.
Considering the previous knowledge, the aim of the present study was to evaluate the cytotoxic activity and mechanism of action of the main commercially available metabolites from cholesterol (coprostanol, cholestanol, coprostanone and cholestenone) and β-sitosterol (ethylcoprostanol) at physiologically relevant concentrations on undifferentiated human colonic epithelial adenocarcinoma cells (Caco-2) and non-tumor human colon fibroblasts (CCD-18Co).
2. Materials and methods
2.1 Reagents
Bovine serum albumin (BSA), coprostanol (5β-cholestan-3β-ol) (96%, w/w), cholestanol (5α-cholestan-3β-ol) (98%, w/w), coprostanone (5β-cholestan-3-ol) (96%, w/w), cholestenone (4-cholesten-3-one) (98%, w/w), 2′,7′-dichlorofluorescein diacetate (DCFDA), dimethyl sulfoxide (DMSO), 3-(4,5-dimethylthiazol-2-yl)-2,5-diphenyl-tetrazolium bromide (MTT), 5-fluorouracile (5-FU), monoclonal anti-ceramide antibody produced in mouse (primary antibody), goat anti-mouse IgM + IgG + IgA anti-body, F(ab′)2, FITC conjugate (secondary antibody), propidium iodide (PI) and ribonuclease A (RNase A) were from Merck LifeScience S.L.U. (Madrid, Spain). Ethylcoprostanol (24-ethyl-5β-cholestan-3β-ol) (99.3%, w/w) was purchased from Cromlab (Barcelona, Spain). FITC Annexin V apoptosis detection kit I was from BD Biosciences (San Jose, CA, USA). For RNA extraction, TRIzol™ reagent was purchased from Invitrogen™ (Carlsbad, CA, USA) and the ReliaPrep™ RNA Miniprep System kit from Promega (Madison, WI, USA). TaqMan™ Reverse Transcription kit and PowerUp™ SYBR™ Green Master Mix for quantitative real-time PCR (qPCR) analysis were purchased from Applied Biosystems™ (Foster City, CA, USA). D-MEM + GlutaMAX™ (4.5 g L−1 glucose), MEM Non-Essential Amino Acids (MEM NEAA) solution (100×), HEPES buffer solution (1 M), antibiotic solution (10000 U mL−1 penicillin and 10000 μg mL−1 streptomycin), antimycotic solution (250 μg mL−1 amphotericin B), fetal bovine serum (FBS), PBS pH 7.4 (1×) and trypsin–EDTA solution (2.5 g L−1 trypsin and 0.2 g L−1 EDTA) were from Gibco™ (Scotland, UK). Absolute ethanol was obtained from Panreac (Barcelona, Spain). 2-Propanol and chloroform were supplied by Scharlau (Barcelona, Spain). Deionized water (resistivity 18.2 MΩ cm) was obtained using a Milli-Q water purification system (Millipore™, Bedford, MA, USA).
2.2 In vitro study design
Caco-2 and CCD-18Co cells come from American Type Culture Collection (HTB-37 and CRL-1459, respectively) (Rockville, MD, USA). For the cell growth, they were cultured in 75 cm2 flasks (Corning™ Falcon™) in D-MEM supplemented with 10% (v/v) FBS, 1% (v/v) MEM NEAA, 1% (v/v) antibiotic solution, 1% (v/v) antimycotic solution and 1% (v/v) HEPES. Cells were incubated at 37 °C in a humidified atmosphere (95% relative humidity, RH) with 5% (v/v) CO2.Regarding samples, stock solution of metabolites was prepared in ethanol while the 5-FU was dissolved in DMSO. For the assays, the physiological concentration of metabolites in feces was estimated based on data from studies in humans3 considering an average water content in feces of 75% and a density of 1.06 g mL−1.16 Based on this, it was estimated that the fecal concentration of metabolites can range between 70 and 14000 μM. However, the maximum soluble concentration of metabolites in the culture medium was 300 μM. As screening, the treatments in the MTT assay were performed at different concentrations (9, 18, 37, 75, 150 and 300 μM) to determine the half-maximal inhibitory concentration (IC50). For mechanistic evaluations, 75 μM was selected since it is the closest to the intermediate IC50 obtained in MTT assay.
For experimental studies, Caco-2 (passages 10–37) and CCD-18Co (passages 3–30) cells were dissociated from the flask with trypsin–EDTA reagent. Subsequently, cells were plated at 5 × 10⁴ cells per cm2 onto 96-well (cytotoxicity assay), 24-well (cytofluorometric analysis) or 6-well plates (qPCR assays) (Costar Corp., Cambridge, MA, USA) and incubated (37 °C, 95% RH, 5% (v/v) CO2) during 24 h with culture medium. At 24 h post-seeding, the cells were treated with the metabolites in culture medium. Regarding exposure time, 24 h was chosen since it reflects a realistic estimate of human intestinal exposure to dietary compounds.17 However, gene expression assays were performed at 6 h since transcriptional modifications are initiated at early exposure to treatment.18 On the other hand, vehicle-treated cells were the negative control (1.2% ethanol), and as positive control 5-FU (25 μM) was used (except in the PCR experiments) due to its well-known cytotoxic effect on human colon cancer cells.19 It has been corroborated that the final concentrations of ethanol (1.2%) and DMSO (0.3%) in culture medium did not induce cytotoxicity in any of the cell lines (data not shown).
2.3 Cytotoxicity assay
The cytotoxic activity of metabolites was evaluated by the MTT assay, a method used to measure cellular metabolic activity as an indicator of cell viability.20 This colorimetric method is based on the reduction of a yellow tetrazolium salt (MTT) to purple formazan crystals by metabolically active cells. Briefly, after treatment, the culture medium was removed and 100 μL of MTT solution (0.5 mg mL−1 in PBS) was added. After 4 h of incubation (37 °C, 95% RH, 5% (v/v) CO2), the MTT solution was removed, and the formazan salts were solubilized with 100 μL of DMSO. The resulting coloured solution was quantified by measuring absorbance with a multi-well spectrophotometer (Victor3 multi-label counter, PerkinElmer) at 570 nm with background subtraction at 690 nm. Results were expressed as percentage of viable cells vs. control. The IC50 value were obtained by plotting the mean of cell viability against the log concentration to distribute the data on a sigmoid curve.2.4 Cell death
Cell death after treatments was detected using the FITC-Annexin V apoptosis detection kit I. The method is based on the detection of phosphatidylserine molecules translocated outside the cell membrane (Annexin V-FITC) and the presence of nuclear membrane damage (PI).21 Briefly, cells were harvested with trypsin–EDTA (400 μL). Then, the cells were transferred to a 5 mL round-bottom flow cytometry tube (Corning™ Falcon™) and centrifuged (23 °C, 450g, 5 min) (Eppendorf® centrifuge 5810R). After removing supernatant, 100 μL of binding buffer, 5 μL of Annexin and 5 μL of PI solutions were added. The tubes were kept in darkness for 15 min at room temperature. Finally, 400 μL of binding buffer were added and the samples were analysed by flow cytometry (FACS Verse, BD Biosciences) (λexc = 488 nm and λem = 527/32 nm for FITC-Annexin V and λexc = 488 nm and λem = 586/42 nm for PI), at least 10000 events. Prior to analysis, cell suspensions were filtered (50 μm) (CellTrics®) to remove aggregates and debris. An aliquot of unstained cells was analysed to delimit the background fluorescence emitted by cells (autofluorescence). In addition, cells stained individually with FITC-Annexin V and PI were analysed to compensate for spectral overlap between both fluorochromes.
2.5 Analysis of cell cycle progression
Cell cycle analysis was performed by flow cytometric evaluation of cellular DNA content using PI.21 PI binds to DNA stoichiometrically, which makes it possible to quantify cellular DNA and thus the proportion of cells within each stage of the cell cycle. Briefly, cells were harvested and fixed with 1 mL of cold ethanol:PBS 70:30 (v/v) (30 min, 4 °C). After centrifuging and suspending the pellet with 400 μL of PBS, 50 μL of RNase A and PI solutions (40 and 100 μg mL−1 in PBS, respectively) were added. Then, the tubes were incubated (37 °C, 95% RH, 5% (v/v) CO2) for 30 min. Finally, cell suspension was filtered, and fluorescent intensity was analysed (λexc = 488 nm and λem = 586/42 nm) in at least 10000 events for each sample.
2.6 Cellular levels of reactive oxygen species
Cellular levels of reactive oxygen species (ROS) were measured to assess their mediation in the cytotoxic activity of the metabolites. In the presence of ROS, the DCFDA reagent is oxidized to fluorescent dichlorofluorescein, which is measured by flow cytometry.22 Briefly, after harvesting cells, they were suspended with 1 mL of 1 μM DCFDA in a cytometry tube and incubated in darkness for 30 min (37 °C, 95% RH, 5% (v/v) CO2). Over time, the tubes were centrifuged, and the pellet was suspended in 300 μL of PBS. Finally, fluorescent intensity was analysed (λexc = 488 nm and λem = 527/32 nm) in at least 10000 events for each sample, after subtracting for cellular autofluorescence.
2.7 Cellular levels of ceramide
Cellular levels of ceramide were measured by flow cytometry to assess its involvement in metabolite-induced apoptosis.23 Prior to assay, primary and secondary antibody were diluted 1/1000 or 1/20 (v/v), respectively, with 0.1% (w/v) BSA solution. Briefly, cells were harvested and suspended in 200 μL of primary antibody solution in a cytometry tube. After incubation (60 min, 37 °C, 95% RH, 5% (v/v) CO2), the tubes were centrifuged (4 °C, 450g, 5 min) and the cells were washed with BSA solution. Then, cells were incubated with 100 μL of secondary antibody solution during 30 min (37 °C, 95% RH, 5% (v/v) CO2). Subsequently, it was washed and suspended with 400 μL of BSA solution. Finally, the fluorescence intensity (λexc = 488 nm and λem = 527/32 nm) was measured in at least 10000 events for each sample after subtracting for cellular autofluorescence.
2.8 Transcriptional evaluation
To evaluate the expression of the regulatory genes of the apoptosis and the cell cycle, a relative quantification of its messenger RNA (mRNA) levels was performed using qPCR prior retrotranscription (RT) to complementary DNA (cDNA).000g (Sigma® 3K15). Then, the supernatant was transferred to a new tube and 170 μL of isopropanol was added. Finally, the extracted RNA was purified using the ReliaPrep™ RNA Miniprep System kit according to the technical manual provided by the manufacturers (prolonging centrifugation times to 2 min). The concentration of total RNA was determined spectrophotometrically (Thermo Scientific™ NanoDrop Lite). The purity was also estimated by spectrophotometry from the relative absorbances at 230, 260 and 280 nm. In all samples, adequate values were obtained of ratio A260/A280 (1.8–2.0) and A260/A230 (≥2.0). The purified RNA extract was stored at −80 °C until analysis.
2.9 Statistic analysis
All assays were carried out in two independent assays (at least n = 3). Data normality was checked by Shapiro–Wilk. Homoscedasticity assumptions were evaluated by the Levene test. One-way analysis of variance (ANOVA), followed by LSD post hoc test, was applied to determine statistically significant differences (p < 0.05). GraphPad Prism 8.0.2 (GraphPad Software Inc., San Diego, CA, USA) was used for statistical analysis.3. Results
3.1 Cytotoxic effect
The first step to assess the antiproliferative activity of a bioactive compound is to determine its cytotoxicity in tumor cells and the selectivity of this effect using a non-tumoral line. Regarding to the tumor cell line (Caco-2), a statistically significant reduction (p < 0.05) in cell viability (vs. control) was observed after treatment with cholestanol (by 20–24%), cholestenone (by 17–71%) and ethylcoprostanol (by 22–43%) (Fig. 1). Only cholestenone exhibited a statistically significant (p < 0.05) dose-dependent effect on cell viability under the tested concentrations. Despite antiproliferative activity observed by the cholesterol metabolites in the tumor cell line, their effect was greater in CCD-18Co cells. In this sense, the IC50 of cholestenone was significantly lower (p < 0.05) in the non-tumor cell line (35.4 ± 0.4 vs. 106.5 ± 1.4 μM). In the same way, the reduction of the viability of CCD18-Co cells by cholestanol (>150 μM) was greater (p < 0.05) compared to Caco-2 cells (by 39–41 vs. 21–23%). In addition, coprostanone (IC50, 72.1 ± 1.4 μM) and coprostanol showed a cytotoxic effect only in non-tumor cells. These data reflect that cholesterol metabolites, mainly the hydrophobic (cholestenone and coprostanone), have statistically significant (p < 0.05) dose-dependent cytotoxic activity predominantly on non-tumor cells. However, ethylcoprostanol reduced the viability of CCD-18Co cells (by 29–44%) an equivalent way to Caco-2 cells. | ||
| Fig. 1 Viability of Caco-2 and CCD-18Co cells after 24 h exposure to sterol metabolites at different concentrations (9–300 μM). Concentrations were expressed on a logarithmic scale to distribute the data so that the shape of the curve and the quality of the fit are easily visible. Data are shown as mean ± standard deviation (n = 3). The asterisk (*) indicates statistically significant differences (p < 0.05) between treatment and control (vehicle-treated cells). Different letters (a–c) indicate statistically significant differences (p < 0.05) between concentrations in the same treatment. | ||
On the other hand, the impact of ethylcoprostanol on the damage to colonic cells induced by the most toxic cholesterol metabolite (cholestenone) was evaluated. For this, both types of cells were combined treated with cholestenone and ethylcoprostanol (75 μM each metabolite for 24 h). The concentration of 75 μM for each metabolite in the combined treatment was selected to achieve a balance between the responses in both cell lines, as it is the closest concentration to the midpoint between the IC50 values of cholestenone in Caco-2 (106.5 ± 1.4 μM) and CCD18Co cells (35.4 ± 0.4 μM). The data showed that reduction of Caco-2 cell viability by combined treatment was greater (p < 0.05) compared to individual metabolite (by 60 vs. 29–40%), indicating a potentiation in the cytotoxic effect. However, in the non-tumoral cell line, ethylcoprostanol protected from damage produced by cholestenone, as observed in the reduction of cell viability in the combined treatment and isolated cholestenone (by 24 vs. 63%, p < 0.05).
3.2 Cell death
The MTT assay served as a preliminary tool to evaluate a range of concentrations and determine the optimal concentration for subsequent mechanistic studies. After this, cell death was assessed by flow cytometry using Annexin V/PI staining. It is worth noting that the discrepancies observed in cell viability values between the two assays can be attributed to their different methodologies. The MTT assay primarily measures cellular metabolic activity as an estimate of cell viability, while the Annexin V/PI assay directly evaluates aspects related to cell viability and death.As observed in Fig. 2, tumor cell viability was significantly reduced (vs. control, p < 0.05) after exposition to cholestenone (by 71.1%) and ethylcoprostanol (by 85.3%), inducing cell apoptosis. The proportion of early apoptotic cells was higher (p < 0.05) after ethylcoprostanol exposure (74.9%) compared to cholestenone (60.9%), indicating that the apoptotic effect on cancer cells is greater by the PS metabolite.
 | ||
| Fig. 2 Cell death evaluation in Caco-2 and CCD-18Co cells after 24 h exposure to sterol metabolites and combined treatment with cholestenone (Ch-one) and ethylcoprostanol (Eth-ol) at 75 μM. Cp-ol: coprostanol; Ch-nol: cholestanol; Cp-one: coprostanone. Data are shown as mean ± standard deviation (n = 3). Different letters (a–d) indicate statistically significant differences (p < 0.05) between treatments in the same cell stage. | ||
In relation to the non-tumor cell line, all metabolites reduced the viability of CCD-18Co cells (p < 0.05), although coprostanone, followed by cholestenone, were the metabolites that caused the greatest reduction (by 57.0 and 41.1%, respectively) (Fig. 2). Thus, an increase (p < 0.05) in the early and late apoptotic cells was observed, again, predominantly by the hydrophobic cholesterol metabolites (coprostanone and cholestenone).
On the other hand, co-treatment with cholestenone and ethylcoprostanol showed a potentiation of the apoptotic effect in Caco-2 cells, as deduced from the greater (p < 0.05) late apoptosis cell (16.8%) in comparison to individual metabolites (13.7–13.9%). In turn, ethylcoprostanol protected CCD18-Co cells from the toxicity produced by cholestenone, since the co-treatment improved cell viability value and reduced the percentage of apoptotic cells (vs. individual cholestenone).
3.3 Effect on cell cycle progression
Until now, a clear apoptotic effect of sterol metabolites in colonic cells has been observed. However, when cells are exposed to cellular stress, other biological events occur in which alterations in the progression of the cell cycle can be found. In this sense, the exposure to sterol metabolites (except coprostanol) significantly increased (vs. control, p < 0.05) the subG1 cell population in the tumor cell line, mainly by cholestenone, followed by ethylcoprostanol (Fig. 3). In relation to the non-tumor cells, a slight increase (vs. control, p < 0.05) in the subG1 cell population after treatment with metabolites, except coprostanol and ethylcoprostanol, was observed. However, the main effect in this cell line was an increase (vs. control, p < 0.05) in the population of cells in the G0/G1 phase (i.e., G0/G1 phase arrest), accompanied by a reduction (vs. control, p < 0.05) in the cell population in S and G2/M phases (cholestenone being the metabolite that generates the greatest reduction in S phase).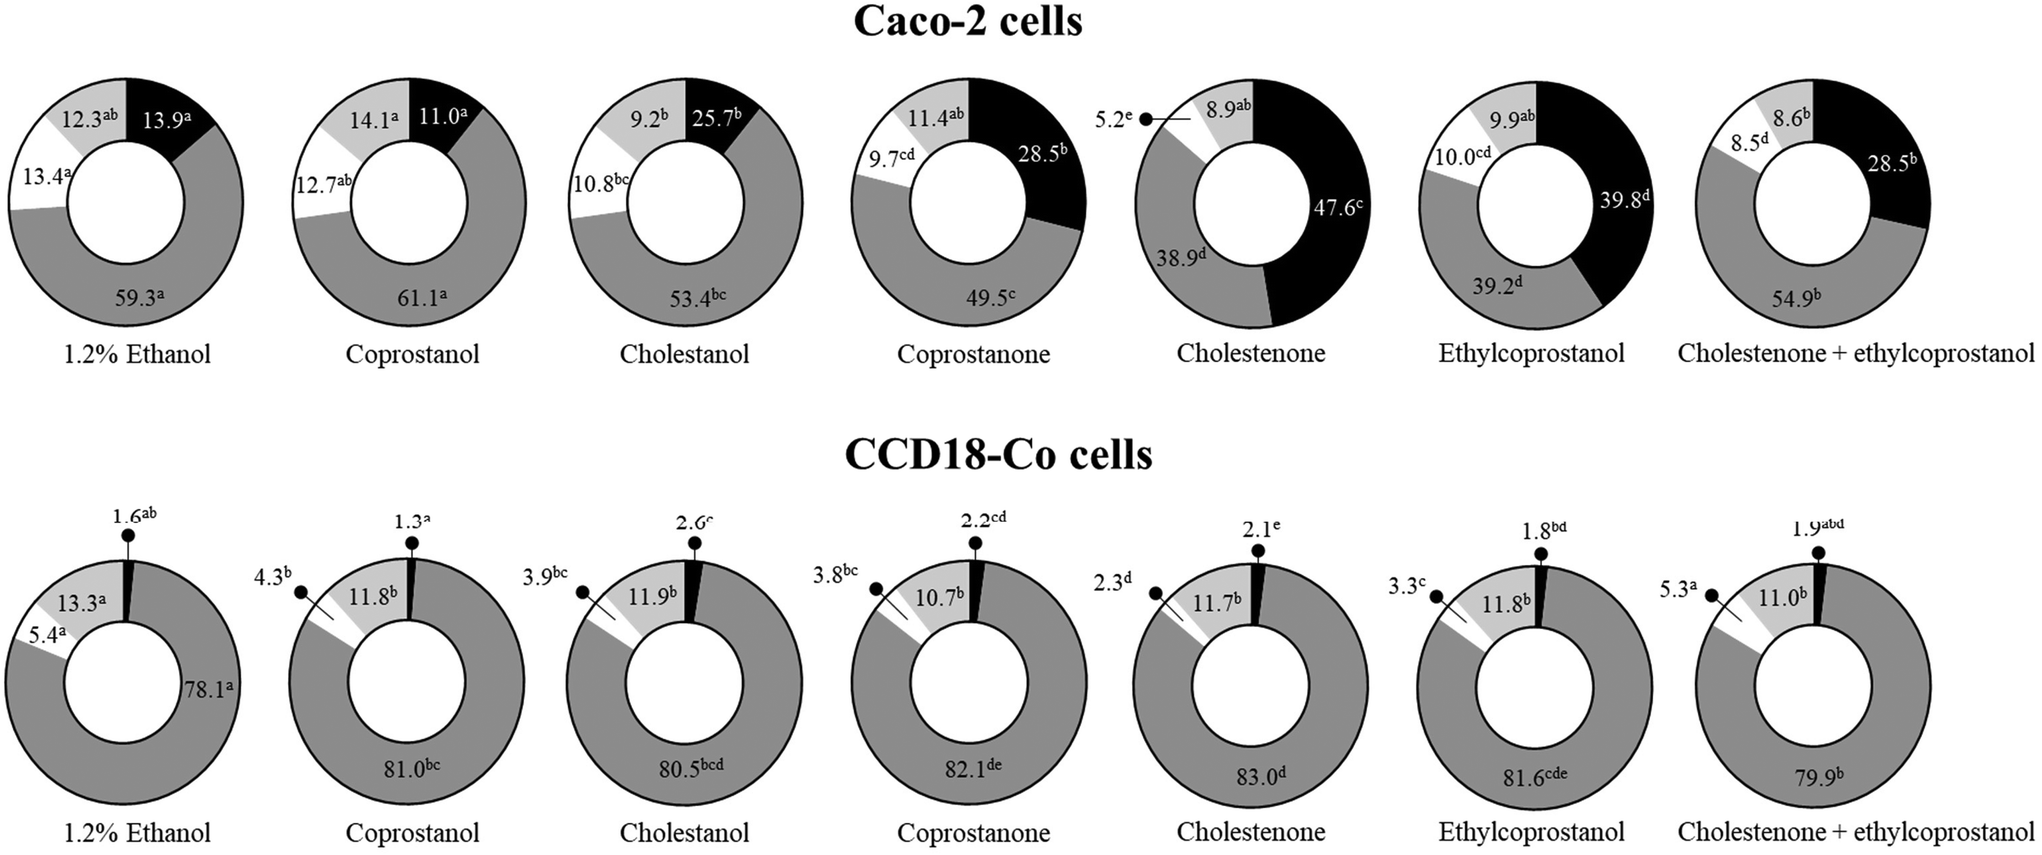 | ||
| Fig. 3 Distribution of cell cycle phases in Caco-2 and CCD-18Co cells after 24 h exposure to sterol metabolites and combined treatment with cholestenone and ethylcoprostanol at 75 μM. Data are shown as mean (n = 3). Different letters (a–d) indicate statistically significant differences (p < 0.05) between treatments in the same cell cycle phase. | ||
On the other hand, co-treatment of ethylcoprostanol and cholestenone in Caco-2 cells does not seem to potentiate the effect on cell cycle progression (vs. individual metabolites), as has been observed so far in the previous assays. However, in the non-tumor cell line, a protective effect of ethylcoprostanol against colonotoxicity induced by cholestenone was observed. In this sense, a lower percentage of cells in the G0/G1 phase (i.e., amelioration in cell cycle arrest) was observed compared to individual exposure to cholestenone (79.9 vs. 83.0%, p < 0.05). In addition, the co-treatment restored to normal values (untreated cells) the proportion of cells in subG1 and S phase (vs. individual cholestenone).
3.4 Ceramide mediation in metabolite-induced apoptosis
To analyse the signalling pathway involved in the apoptosis induced by the metabolites, the intracellular levels of ceramide were measured by flow cytometry. In relation to the tumor cell line, a significantly increase (vs. control, p < 0.05) in intracellular ceramide levels after treatment with cholestenone and ethylcoprostanol was observed (Fig. 4). On the other hand, co-treatment with cholestenone and ethylcoprostanol did not potentiate the increase in ceramide levels compared to the individual metabolites. This seems to indicate that ceramide does not mediate the potentiation of the cytotoxic effect between both metabolites, as previously observed with the MTT and apoptosis assays. In CCD-18Co cells, no increase in ceramide levels was observed after the treatments (data not shown), indicating that apoptosis occurs via a ceramide-independent pathway. | ||
| Fig. 4 Cellular levels of ceramide in Caco-2 cells after 24 h exposure to sterol metabolites and combined treatment with cholestenone and ethylcoprostanol at 75 μM. Data are shown as mean ± standard deviation (n = 3). This sign ⸸ indicates statistically significant differences (p < 0.05) between treatment and control (vehicle-treated cells). The asterisk (*) indicates statistically significant differences (p < 0.05) between treatments. | ||
3.5 Induction of reactive oxygen species
The intracellular levels of ROS were measured to determine their involvement in the activation of apoptosis signaling pathways. Regarding cholesterol metabolites, all of them, except cholestenone, induced a significant increase (vs. control, p < 0.05) in ROS levels in both cell lines. The effect of coprostanol and coprostanone was significantly higher (p < 0.05) in non-tumor cells compared to tumor cells. In contrast, ethylcoprostanol generated an increase in the cellular levels of ROS in Caco-2 cells, without affecting non-tumor cells (Fig. 5). On the other hand, reduction in ROS levels (vs. control, p < 0.05) was observed after treatment with cholestenone (in Caco-2 cells) and cholestenone combined with ethylcoprostanol (in both cell lines). In this case, this seems to indicate that the induced structural damage in the cells prevents the retention of the fluorescent probe inside the cell. For this reason, ROS levels were evaluated in Caco-2 cells reducing the incubation time to 6 h, showing increase in ROS levels by cholestenone (2.1-fold) and co-treatment (2.5-fold). In this regard, potentiation of the antiproliferative activity was observed compared to individual metabolites (2.5 vs. 1.2–2.1-fold, p < 0.05).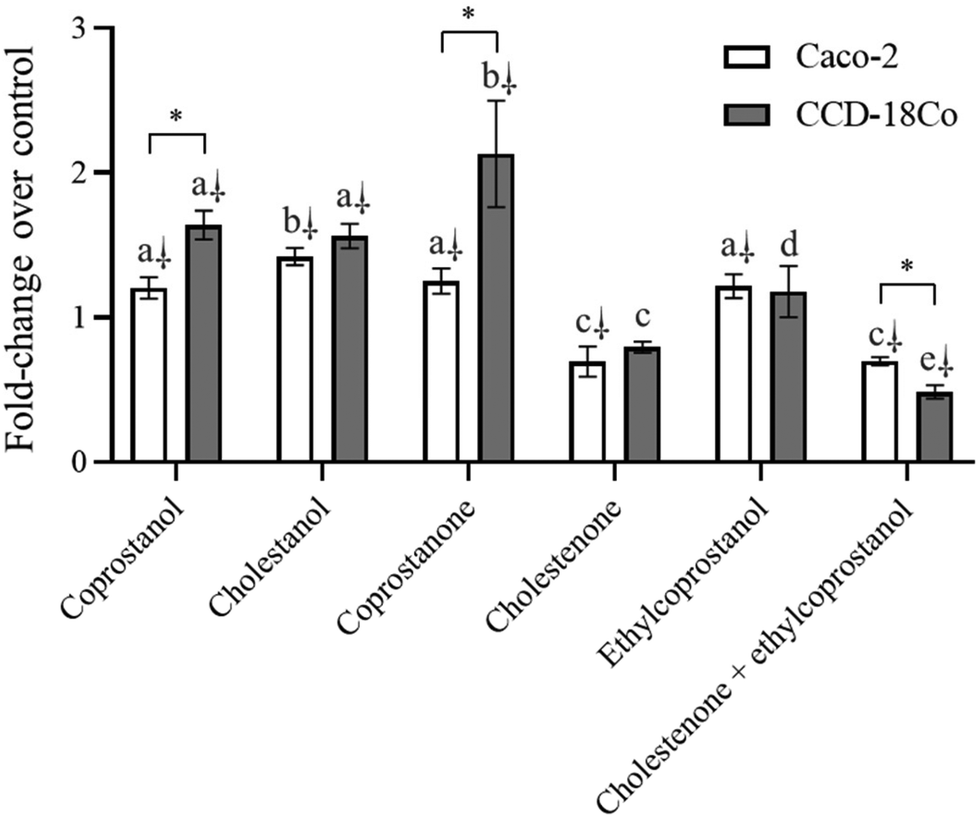 | ||
| Fig. 5 Cellular levels of reactive oxygen species in Caco-2 and CCD18-Co cells after 24 h exposure to sterol metabolites and combined treatment with cholestenone and ethylcoprostanol at 75 μM. Data are shown as mean ± standard deviation (n = 3). This sign ⸸ indicates statistically significant differences (p < 0.05) between treatment and control (vehicle-treated cells). The asterisk (*) indicates statistically significant differences (p < 0.05) between cell lines in the same treatment. Different letters (a–d) indicate statistically significant differences (p < 0.05) between treatment in the same cell line. | ||
3.6 Gene-expression changes induced by metabolite exposure
The evaluation of gene expression is a useful tool to understand the mechanism of action of a biological effect and to elucidate the pathway involved. In this sense, genes that regulate the cell apoptosis and cell cycle progression after exposure to the most cytotoxic cholesterol metabolites (coprostanone and cholestenone), ethylcoprostanol and co-treatment (cholestenone and ethylcoprostanol) have been evaluated. An increase (p < 0.05) of the BAX/BCL2 ratio in Caco-2 cells after exposure to metabolites compared to control was observed (Fig. 6). This indicates that the metabolites induce apoptosis via the intrinsic (or mitochondrial) pathway. This was confirmed by an increase (vs. control, p < 0.05) in the expression of the gene encoding caspase 9 (CASP9), except in the treatment with ethylcoprostanol. In turn, coprostanone also acts on Caco-2 cells through the extrinsic pathway, as deduced from the significant increase (p < 0.05) in the expression of the CASP8 gene (vs. control). | ||
| Fig. 6 Relative gene-expression in Caco-2 and CCD-18Co cells after 6 h exposure to sterol metabolites and combined treatment with cholestenone and ethylcoprostanol at 75 μM. Data are shown as mean ± standard deviation (n = 9). This sign ⸸ indicates statistically significant differences (p < 0.05) between treatment and control (vehicle-treated cells) in the same gene evaluated. The asterisk (*) indicates statistically significant differences (p < 0.05) between treatment in the same gene evaluated. | ||
On the other hand, no changes in the expression of the effector caspase 3 gene (p > 0.05) compared to the control were observed in Caco-2 cells. This could be due to its action in advanced phases of apoptosis. Thus, after 24 h exposure an increase (p < 0.05) in CASP3 gene expression (vs. control) was observed, significantly higher after treatment with ethylcoprostanol (3.00 vs. 2.38–2.47-fold, p < 0.05). The fact that CASP3 expression did not change after exposure to coprostanone and cholestenone, despite its cytotoxicity in previous assays, highlights the complexity in the regulation of gene expression during apoptosis. These effects on gene expression may not be evident within the specific time period evaluated in the present study.
On the other hand, gene expression of the p21 protein (CDKN1A) was reduced (p < 0.05) compared to control (except coprostanone) in the tumor cell line. In addition, the expression of the gene that encodes p53 protein (TP53) was not modified (vs. control). In relation to cyclin expression, a reduction (p < 0.05) in the expression of the genes that code for the cyclins D1 (CCND1) and E1 (CCNE1) was observed (vs. control).
Regarding CCD-18Co cells, it was observed that only cholesterol-derived metabolites increased (vs. control, p < 0.05) the BAX/BCL2 ratio and the expression of the CASP3, CASP8 and CASP9 genes. On the other hand, the expression of the genes that code for the p53, p21 and cyclin D1 proteins was not altered by the exposure to the metabolites, which indicates that it does not play a crucial role in the biological effects exerted by them. However, the reduction in CCNE1 gene expression after treatment with cholesterol metabolites (vs. control, p < 0.05) confirms the G0/G1 phase arrest observed in cell cycle progression assay. In addition, ethylcoprostanol prevented the increase in the BAX/BCL2 ratio and the expression of the CASP3 and CASP9 genes induced by cholestenone in non-tumor cells.
4. Discussion
According to global statistics, CRC was the third most common cancer in men and the second in women, contributing 11.4 and 9.9% of the total number of new cases diagnosed in 2020, respectively.1 Currently, the treatment in early stages is usually surgical resection, while chemotherapeutic agents such as 5-FU, capecitabine, oxaliplatin, and irinotecan are more commonly used in the advanced stage.26 Several neurotoxic and gastrointestinal side effects have been associated with anti-cancer chemotherapeutic agents used for the treatment of CRC, including diarrhoea, mucositis and neutropenia.27 Therefore, the research focuses its efforts on the development of novel therapeutic strategies based on the simultaneous administration of chemotherapy drugs together with natural bioactive compounds.13 This approach minimizes the doses of the chemotherapeutic drug, maintaining its therapeutic effect and reducing side effects. In this sense, PS have shown antiproliferative activity at colonic concentrations in Caco-2 cells, inducing apoptosis and arrest in the G0/G1 phase of the cell cycle.28 Besides, these bioactive compounds potentiate the effects of the chemotherapeutic drug 5-FU in human colon cancer cells (Caco-2 and HT-29), with an additive effect in the arrest of the cell cycle in the S phase, the induction of apoptosis and increased caspase activation.19 On the other hand, it is known that PS are capable of being metabolized by gut microbiota.3 In this sense, in vitro colonic fermentation studies29,30 and clinical trials31,32 with PS-enriched foods show that ethylcoprostanol is the major metabolite derived from colonic fermentation of β-sitosterol (the main dietary PS). However, the biological effects produced by this metabolite are unknown.The present study report for the first time the antiproliferative activity of ethylcoprostanol in colon cancer cells by inducing early and late apoptosis (with lower effect in non-tumor cell line). Treatments capable of restoring apoptotic signalling pathways to their normal state hold the potential to eliminate cancer cells, as a reduction in apoptosis contributes to carcinogenesis.33 In this sense, several plant-derived bioactive compounds have been shown to induce apoptosis in colon cancer cells, including phenolic compounds,34 alkaloids,35 oleanolic acid36 and PS.19,28 Currently, the association between PS intake and CRC has not been fully clarified, although a risk reduction of up to 50% has been observed in a case–control study.37 However, the findings of this study show that the reduction in the risk of CRC could not only be due to the action of PS, but also to the antiproliferative activity of its derived metabolites. Regarding the mechanism of action (represented graphically in Fig. 7), the apoptotic effect of ethylcoprostanol was accompanied by an increase in cellular levels of ROS and ceramide. It is well known that the overproduction of ROS is a key phenomenon in the induced intrinsic and extrinsic apoptosis by chemotherapeutic agents and bioactive compounds,38,39 including PS.19,28 On the other hand, it has been described that ceramide is a key mediator in the induction of apoptosis, both by intrinsic and extrinsic pathways, by regulation of target proteins via direct binding.40 In this regard, it has previously been described that β-sitosterol are capable of stimulating ceramide production in HT-29 tumor cells, which was associated with inhibition of cell growth and stimulation of apoptosis.41 Although hydrolysis of sphingomyelin has been postulated as ceramide production pathway after β-sitosterol treatment,41 the de novo synthesis route has also been observed in differentiated Caco-2 cells.42 In addition, it has been described that ceramide can act on the mitochondrial respiratory chain stimulating the ROS production, and ROS favours ceramide synthesis regulating proteins involved in its production.40 Therefore, oxidative stress and ceramide play a key role in ethylcoprostanol-induced apoptosis, and there may be interaction between both mediators.
 | ||
| Fig. 7 Molecular mechanism of the apoptotic effect of sterol metabolites on Caco-2 and CCD-18Co cells. Exposure of colon cells to metabolites results in an increase in cellular levels of reactive oxygen species (ROS) and ceramide, both mediators of apoptosis. The increase in the Bax/Bcl-2 ratio promotes the activation of caspase 9 and subsequently caspase 3 to execute the apoptosis process (intrinsic pathway). Furthermore, expression of the gene encoding p21 (which inhibits procaspase 3) is reduced as a result of treatment with the metabolites. With the extrinsic apoptosis pathway, the execution phase of apoptosis is activated by caspase 8. In addition, there is a reduction in the gene expression of cyclins D1 and E1, which lead to G0/G1 phase arrest. Bax: Bcl-2 associated X-protein; Bcl-2: B-cell lymphoma. | ||
On the other hand, changes in gene expression showed that ethylcoprostanol exerted its antiproliferative effect through the intrinsic pathway (increased expression of BAX/BCL-2 ratio and CASP9). Bax and Bcl-2 regulate the cell death by modulating mitochondrial membrane permeabilization.43 The Bcl-2 protein inhibits apoptosis by blocking the mitochondrial release of cytochrome c, while Bax favours the release of cytochrome c from the intermembrane space into the cytosol. However, it is not the amount of each of them, but the ratio (Bax/Bcl-2) determines the regulation of apoptosis. Therefore, in the presence of an apoptotic stimulus, the Bax/Bcl-2 ratio increases, thus favouring the release of cytochrome c and activating procaspase 9, which initiates the execution phase by activating procaspase 3. In addition, it was observed that ethylcoprostanol-induced apoptosis is accompanied by a reduction in the gene expression of the p21, a protein that has been shown to inhibit apoptosis by blocking pro-apoptotic proteins (e.g., procaspase-3, caspase-8).44 Other authors have described that suppression of p21 expression in Caco-2 cells contributes to polyphenol-induced mediated apoptosis.45 However, the reduction in p21 gene expression was not related with modifications in the expression of the p53 gene, the main transcription factor of the p21.46 On the other hand, the reduction in the expression of genes that code for cyclins D1 and E1 was observed. The cyclins D1 and E1 regulates the transition from G1 through S phase activating the cyclin-dependent kinase 4/6 or 2 in early or late phase of G1, respectively.47 In this sense, the cellular stress induced by the ethylcoprostanol would translate into a reduction in the expression of cyclin-encoding genes to repair the damage produced. These results were consistent with previous studies in which β-sitosterol reduced cyclin D1 gene expression and induced a concomitant increase in the subG1 cell population in human alveolar basal epithelial adenocarcinoma cells.48 The changes observed on gene expression reveal the activation of the transcriptional mechanisms of apoptosis regulation. Multiple pathways can be involved in this process, with the p53 protein being the main transcriptional regulator of apoptosis.49 The control of the stability of the p53 protein is the main mechanism of regulation of its function, and to a lesser extent at the transcriptional level. In this sense, ROS can induce post-translational modifications in p53 and its negative regulators, leading to p53 activation.50 Therefore, the involvement of p53 in the apoptosis induced by ethylcoprostanol is not ruled out despite not observing changes in the expression of the gene that encodes it, although p53 activity assays are necessary to confirm this hypothesis.
On the other hand, some authors propose that diets rich in fats and proteins of animal origin are positively associated with CRC through an increase in the production of cholesterol-derived metabolites by the intestinal microbiota.4,5 In this regard, diverse case-control studies found that subjects with CRC or precancerous lesions (ulcerative colitis and adenomatous polyps) present (vs. healthy control) a significantly higher fecal concentration (expressed as mg g−1 dry feces) of cholestanol (0.6 vs. 0.4),51 coprostanol (14.2–26.6 vs. 6.7–14.7)5,52–56 and coprostanone (2.1–3.6 vs. 2.0–4.2).5,54,56 The authors suggest that the higher fecal concentration of cholesterol metabolites is due to the abundance of anaerobic bacteria capable of metabolizing cholesterol to possible promoters of CRC. In addition, rectal instillation of cholestanone and cholestenone induces nuclear aberrations in the colonic epithelium of mice,6 whereas cholestenone, but not cholestanone, causes sister chromatid exchange.7 Recently, cholestenone was shown to attenuate TGF-β responsiveness in mink lung epithelial cells (Mv1Lu) and HT-29, a phenomenon closely related to neoplastic cell transformation in many human cancers.8 In this regard, the present study showed that cholesterol metabolites, mainly those of a hydrophobic nature (cholestenone and coprostanone), exert a cytotoxic effect on non-tumor colon cells, reflecting a possible relationship between hydrophobicity and cytotoxicity, as observed in stilbenes metabolites57 and secondary bile acids in colon cancer cells (HT-29 and Caco-2).58 The toxicity of cholesterol metabolites, mediated by the overproduction of ROS, generated cell cycle arrest in G0/G1 phase and apoptosis. In relation to cell cycle, the arrest was related to reduced expression of the cyclin E1 gene. It has been reported that oxidative stress can repress cell cycle progression by dephosphorylating retinoblastoma protein (pRb).59 The hypophosphorylated state of pRb favours repression of E2-family protein, which down-regulates the expression of genes that induce cell entry into S phase (e.g., the gene encoding cyclin E1).47 This molecular mechanism is plausible in the cell cycle arrest observed in non-tumor cells after treatment with cholesterol metabolites. On the other hand, apoptosis via intrinsic (increased expression of BAX/BCL-2 ratio and CASP9) and extrinsic pathways (increased expression of CASP8) was observed. The extrinsic pathway of apoptosis begins with the binding of transmembrane death receptors with their ligands, activating caspases 8, ultimately responsible for activating effector caspases.43 Taken together, the data indicate that the metabolites produced by gut microbiota from cholesterol could be involved in colorectal carcinogenesis through their cytotoxic activity. Similarly, it has been shown that the regulated exposure of intestinal cells to high levels of secondary bile acids is a risk factor for gastrointestinal cancers, through overproduction of ROS and apoptosis induction.60 On the other hand, the cytotoxicity induced by cholestenone can be alleviated by ethylcoprostanol, suggesting that PS not only reduce the production of cholesterol metabolites by the microbiota,3 but that its metabolites counteract the damage caused by cholesterol derivatives in non-tumor cells.
5. Conclusions
The present work provides the first knowledge regarding the antiproliferative effect of ethylcoprostanol and the molecular and biological mechanism of action behind it. On the contrary, the effect on non-tumor cells of cholesterol metabolites may be related to their possible activity as promoters of colorectal carcinogenesis, although their deleterious activity can be attenuated by the action of ethylcoprostanol. However, the in vitro design of this study may limit the ability to fully replicate tumor responses to metabolites, as cell cultures do not represent the complexity of tumor microenvironments. Likewise, the use of individual cells does not allow studying the cellular interactions present in a complex organism, and the exposure periods are limited compared to the possible chronic effects in clinical settings. Given due to these limitations, it is necessary to confirm our observations in more complex biological models to provide additional insights into the potential role of ethylcoprostanol as a therapeutic adjuvant in CRC.Furthermore, while this study provides valuable initial insight into the potential mechanisms of action of sterol metabolites, further analysis of these mechanisms is essential in future research. In addition, to contemplate the diverse landscape of colon cancer and gain a more complete understanding of the effects of sterol metabolites, future research should incorporate other colon cancer cell lines with different mutations (e.g., HT-29, SW480, LoVo or HCT116 cells). This approach will provide a broader perspective and improve the generalizability of our findings.
Author contributions
Mussa Makran: investigation, formal analysis, writing – original draft; Guadalupe Garcia-Llatas, Amparo Alegría and Antonio Cilla: conceptualization, funding acquisition, project administration, supervision, writing – original draft, review & editing.Conflicts of interest
There are no conflicts to declare.Acknowledgements
This publication is part of the project PID2019-104167RB-I00 funded by MCIN/AEI/10.13039/501100011033. Mussa Makran holds an FPU19/00156 grant from the Ministry of Universities (Spain).Notes and references
- Y. Xi and P. Xu, Global colorectal cancer burden in 2020 and projections to 2040, Transl. Oncol., 2021, 14, 101174 CrossRef PubMed.
- H. Tilg, T. E. Adolph, R. R. Gerner and A. R. Moschen, The intestinal microbiota in colorectal cancer, Cancer Cell, 2018, 33, 954–964 CrossRef CAS PubMed.
- M. Cuevas-Tena, A. Alegría and M. J. Lagarda, Relationship between dietary sterols and gut microbiota: A review, Eur. J. Lipid Sci. Technol., 2018, 120, 1800054 CrossRef.
- M. J. Hill, B. S. Drasar, V. Aries, J. S. Crowther, G. Hawksworth and R. E. O. Williams, Bacteria and aetiology of cancer of large bowel, Lancet, 1971, 297, 95–100 CrossRef PubMed.
- B. S. Reddy and E. L. Wynder, Metabolic epidemiology of colon cancer: fecal bile acids and neutral sterols in colon cancer patients and patients with adenomatous polyps, Cancer, 1977, 39, 2533–2539 CrossRef CAS PubMed.
- K. Suzuki, W. R. Bruce, J. Baptista, R. Furrer, D. J. Vaughan and J. J. Krepinsky, Characterization of cytotoxic steroids in human faeces and their putative role in the etiology of human colonic cancer, Cancer Lett., 1986, 33, 307–316 CrossRef CAS PubMed.
- H. K. Kaul, D. B. Couch, J. D. Gingerich, W. R. Bruce and J. A. Heddle, Genotoxicity of two fecal steroids in murine colonic epithelium assessed by the sister chromatid exchange technique, Mutagenesis, 1987, 2, 441–444 CrossRef CAS PubMed.
- C. L. Chen, D. C. Wu, M. Y. Liu, M. W. Lin, H. T. Huang, Y. B. Huang, L. C. Chen, Y. Y. Chen, P. H. Chen, Y. C. Yang, P. Y. Kao and P. Y. Chen, Cholest-4-en-3-one attenuates TGF-β responsiveness by inducing TGF-β receptors degradation in Mv1Lu cells and colorectal adenocarcinoma cells, J. Recept. Signal Transduction Res., 2017, 37, 189–199 CrossRef CAS PubMed.
- J. Kobayashi, M. Kawakubo, C. Fujii, N. Arisaka, M. Miyashita, Y. Sato, H. Komura, H. Matoba and J. Nakayama, Cholestenone functions as an antibiotic against Helicobacter pylori by inhibiting biosynthesis of the cell wall component CGL, Proc. Natl. Acad. Sci. U. S. A., 2021, 118, e2016469118 CrossRef CAS PubMed.
- K. Suzuki, Anti-obesity effect of cholest-4-en-3-one, an intestinal catabolite of cholesterol, on mice, J. Nutr. Sci. Vitaminol., 1993, 39, 537–543 CrossRef CAS PubMed.
- K. Nagao, N. Inoue, K. Suzuki, T. Shimizu and T. Yanagita, The cholesterol metabolite cholest-5-en-3-one alleviates hyperglycemia and hyperinsulinemia in obese (db/db) mice, Metabolites, 2021, 12, 26 CrossRef PubMed.
- X. M. Huang, Z. J. Yang, Q. Xie, Z. K. Zhang, H. Zhang and J. Y. Ma, Natural products for treating colorectal cancer: A mechanistic review, Biomed. Pharmacother., 2019, 117, 109142 CrossRef CAS PubMed.
- S. Redondo-Blanco, J. Fernández, I. Gutiérrez-del-Río, C. J. Villar and F. Lombó, New insights toward colorectal cancer chemotherapy using natural bioactive compounds, Front. Pharmacol., 2017, 8, 109 Search PubMed.
- X. Bao, Y. Zhang, H. Zhang and L. Xia, Molecular Mechanism of β-Sitosterol and its Derivatives in Tumor Progression, Front. Oncol., 2022, 12, 926975 CrossRef CAS PubMed.
- G. Cioccoloni, C. Soteriou, A. Websdale, L. Wallis, M. A. Zulyniak and J. L. Thorne, Phytosterols and phytostanols and the hallmarks of cancer in model organisms: A systematic review and meta-analysis, Crit. Rev. Food Sci. Nutr., 2022, 62, 1145–1165 CrossRef CAS PubMed.
- R. Penn, B. J. Ward, L. Strande and M. Maurer, Review of synthetic human faeces and faecal sludge for sanitation and wastewater research, Water Res., 2018, 132, 222–240 CrossRef CAS PubMed.
- K. Vejdovszky, B. Warth, M. Sulyok and D. Marko, Non-synergistic cytotoxic effects of Fusarium and Alternaria toxin combinations in Caco-2 cells, Toxicol. Lett., 2016, 241, 1–8 CrossRef CAS PubMed.
- T. Mitupatum, K. Aree, S. Kittisenachai, S. Roytrakul, S. Puthong, S. Kangsadalampai and P. Rojpibulstit, mRNA expression of Bax, Bcl-2, p53, cathepsin B, caspase-3 and caspase-9 in the HepG2 cell line following induction by a novel monoclonal Ab Hep88 mAb: cross-talk for paraptosis and apoptosis, Asian Pac. J. Cancer Prev., 2016, 17, 703–712 CrossRef PubMed.
- A. Álvarez-Sala, M. Á. Ávila-Gálvez, A. Cilla, R. Barberá, G. Garcia-Llatas, J. C. Espín and A. González-Sarrías, Physiological concentrations of phytosterols enhance the apoptotic effects of 5-fluorouracil in colon cancer cells, J. Funct. Foods, 2018, 49, 52–60 CrossRef.
- D. Gerlier and N. Thomasset, Use of MTT colorimetric assay to measure cell activation, J. Immunol. Methods, 1986, 94, 57–63 CrossRef CAS PubMed.
- Z. Darzynkiewicz, E. Bedner and P. Smolewski, Flow cytometry in analysis of cell cycle and apoptosis, Semin. Hematol., 2001, 38, 179–193 CrossRef CAS PubMed.
- C. P. LeBel, H. Ischiropoulos and S. C. Bondy, Evaluation of the probe 2′,7′-dichlorofluorescin as an indicator of reactive oxygen species formation and oxidative stress, Chem. Res. Toxicol., 1992, 5, 227–231 Search PubMed.
- I. Restivo, A. Attanzio, I. C. Giardina, F. Di Gaudio, L. Tesoriere and M. Allegra, Cigarette Smoke Extract Induces p38 MAPK-Initiated, Fas-Mediated Eryptosis, Int. J. Mol. Sci., 2022, 23, 14730 Search PubMed.
- A. Cimbalo, M. Alonso-Garrido, G. Font, M. Frangiamone and L. Manyes, Transcriptional changes after enniatins A, A1, B and B1 ingestion in rat stomach, liver, kidney and lower intestine, Foods, 2021, 10, 1630 Search PubMed.
- K. J. Livak and T. D. Schmittgen, Analysis of relative gene expression data using real-time quantitative PCR and the 2−ΔΔCT method, Methods, 2001, 25, 402–408 CrossRef CAS PubMed.
- S. Stintzing, Management of colorectal cancer, F1000Prime Rep., 2014, 6, 108 Search PubMed.
- I. Chau and D. Cunningham, Chemotherapy in colorectal cancer: new options and new challenges, Br. Med. Bull., 2002, 64, 159–180 CrossRef CAS PubMed.
- G. López-García, A. Cilla, R. Barberá and A. Alegría, Antiproliferative effect of plant sterols at colonic concentrations on Caco-2 cells, J. Funct. Foods, 2017, 39, 84–90 CrossRef.
- M. Cuevas-Tena, E. M. G. del Pulgar, A. Benitez-Paez, Y. Sanz, A. Alegría and M. J. Lagarda, Plant sterols and human gut microbiota relationship: An in vitro colonic fermentation study, J. Funct. Foods, 2018, 44, 322–329 CrossRef CAS.
- V. Blanco-Morales, G. Garcia-Llatas, M. J. Yebra, V. Sentandreu and A. Alegría, In vitro colonic fermentation of a plant sterol-enriched beverage in a dynamic-colonic gastrointestinal digester, LWT – Food Sci. Technol., 2021, 145, 111273 CrossRef CAS.
- M. Cuevas-Tena, J. D. Bermúdez, R. de los Ángeles Silvestre, A. Alegría and M. J. Lagarda, Impact of colonic fermentation on sterols after the intake of a plant sterol-enriched beverage: A randomized, double-blind crossover trial, Clin. Nutr., 2019, 38, 1549–1560 CrossRef CAS PubMed.
- V. Blanco-Morales, R. D. L. A. Silvestre, E. Hernandez-Alvarez, E. Donoso-Navarro, A. Alegría and G. Garcia-Llatas, Influence of galactooligosaccharides on the positive effect of plant sterol-enriched beverages on cardiovascular risk and sterol colon metabolism, J. Agric. Food Chem., 2022, 70, 532–542 CrossRef CAS PubMed.
- R. S. Wong, Apoptosis in cancer: from pathogenesis to treatment, J. Exp. Clin. Cancer Res., 2011, 30, 87 CrossRef CAS PubMed.
- L. D. S. Rosa, N. A. Jordão, N. D. C. P. Soares, J. F. D. Mesquita, M. Monteiro and A. J. Teodoro, Pharmacokinetic, antiproliferative and apoptotic effects of phenolic acids in human colon adenocarcinoma cells using in vitro and in silico approaches, Molecules, 2018, 23, 2569 CrossRef PubMed.
- T. A. Mansoor, P. M. Borralho, X. Luo, S. Mulhovo, C. M. Rodrigues and M. J. U. Ferreira, Apoptosis inducing activity of benzophenanthridine-type alkaloids and 2-arylbenzofuran neolignans in HCT116 colon carcinoma cells, Phytomedicine, 2013, 20, 923–929 CrossRef CAS PubMed.
- M. E. Juan, J. M. Planas, V. Ruiz-Gutierrez, H. Daniel and U. Wenzel, Antiproliferative and apoptosis-inducing effects of maslinic and oleanolic acids, two pentacyclic triterpenes from olives, on HT-29 colon cancer cells, Br. J. Nutr., 2008, 100, 36–43 CrossRef CAS PubMed.
- J. Huang, M. Xu, Y. J. Fang, M. S. Lu, Z. Z. Pan, W. Q. Huang, Y. M. Chen and C. X. Zhang, Association between phytosterol intake and colorectal cancer risk: a case–control study, Br. J. Nutr., 2017, 117, 839–850 CrossRef CAS PubMed.
- Z. Zou, H. Chang, H. Li and S. Wang, Induction of reactive oxygen species: an emerging approach for cancer therapy, Apoptosis, 2017, 22, 1321–1335 CrossRef CAS PubMed.
- M. Redza-Dutordoir and D. A. Averill-Bates, Activation of apoptosis signalling pathways by reactive oxygen species, Biochim. Biophys. Acta, 2016, 1863, 2977–2992 CrossRef CAS PubMed.
- N. Andrieu-Abadie, V. Gouazé, R. Salvayre and T. Levade, Ceramide in apoptosis signaling: relationship with oxidative stress, Free Radicals Biol. Med., 2001, 31, 717–728 CrossRef CAS PubMed.
- A. B. Awad, R. L. Von Holtz, J. P. Cone, C. S. Fink and Y. C. Chen, beta-Sitosterol inhibits growth of HT-29 human colon cancer cells by activating the sphingomyelin cycle, Anticancer Res., 1998, 18, 471–473 CAS.
- A. B. Awad, C. S. Fink, E. A. Trautwein and F. Y. Ntanios, β-Sitosterol stimulates ceramide metabolism in differentiated Caco2 cells, J. Nutr. Biochem., 2005, 16, 650–655 CrossRef CAS PubMed.
- C. Wang and R. J. Youle, The role of mitochondria in apoptosis, Annu. Rev. Genet., 2009, 43, 95–118 CrossRef CAS PubMed.
- A. L. Gartel and A. L. Tyner, The role of the cyclin-dependent kinase inhibitor p21 in apoptosis, Mol. Cancer Ther., 2002, 1, 639–649 CAS.
- M. Chen, Z. Zhao and S. Yu, Cytotoxicity and apoptotic effects of polyphenols from sugar beet molasses on colon carcinoma cells in vitro, Int. J. Mol. Sci., 2016, 17, 993 CrossRef PubMed.
- K. Engeland, Cell cycle regulation: p53-p21-RB signaling, Cell Death Differ., 2022, 29, 946–960 CrossRef CAS PubMed.
- M. Fischer, A. E. Schade, T. B. Branigan, G. A. Müller and J. A. DeCaprio, Coordinating gene expression during the cell cycle, Trends Biochem. Sci., 2022, 47, 1009–1022 CrossRef CAS PubMed.
- T. Rajavel, P. Packiyaraj, V. Suryanarayanan, S. K. Singh, K. Ruckmani and K. P. Devi, β-Sitosterol targets Trx/Trx1 reductase to induce apoptosis in A549 cells via ROS mediated mitochondrial dysregulation and p53 activation, Sci. Rep., 2018, 8, 2071 CrossRef PubMed.
- J. D. Amaral, J. M. Xavier, C. J. Steer and C. M. Rodrigues, The role of p53 in apoptosis, Discov. Med., 2010, 9, 145–152 Search PubMed.
- D. Liu and Y. Xu, p53, oxidative stress, and aging, Antioxid. Redox Signaling, 2011, 15, 1669–1678 CrossRef CAS PubMed.
- K. Kanazawa, F. Konishi, T. Mitsuoka, A. Terada, K. Itoh, S. Narushima, S. Kumemura and H. Kimura, Factors influencing the development of sigmoid colon cancer: Bacteriologic and biochemical studies, Cancer, 1996, 77, 1701–1706 CrossRef CAS PubMed.
- B. S. Reddy, A. Mastromarino and E. L. Wynder, Further leads on metabolic epidemiology of large bowel cancer, Cancer Res., 1975, 35, 3403–3406 CAS.
- B. S. Reddy, A. Mastromarino and E. Wynder, Diet and metabolism: Large-bowel cancer, Cancer, 1977, 39, 1815–1819 CrossRef CAS PubMed.
- E. Peuchant, G. Covi and R. Jensen, Fecal lipid chromatography—identification of an unusual fraction in relation to colon cancer, Clin. Chim. Acta, 1984, 141, 151–168 CrossRef CAS PubMed.
- B. S. Reddy, C. W. Martin and E. L. Wynder, Fecal bile acids and cholesterol metabolites of patients with ulcerative colitis, a high-risk group for development of colon cancer, Cancer Res., 1977, 37, 1697–1701 CAS.
- B. S. Reddy and E. L. Wynder, Large-bowel carcinogenesis: fecal constituents of populations with diverse incidence rates of colon cancer, J. Natl. Cancer Inst., 1973, 50, 1437–1442 CrossRef CAS PubMed.
- A. González-Sarrías, J. C. Espín-Aguilar, S. Romero-Reyes, J. Puigcerver, M. Alajarín, J. Berná, M. V. Selma and J. C. Espín, Main Determinants Affecting the Antiproliferative Activity of Stilbenes and Their Gut Microbiota Metabolites in Colon Cancer Cells: A Structure–Activity Relationship Study, Int. J. Mol. Sci., 2022, 23, 15102 CrossRef PubMed.
- Y. Araki, A. Andoh, H. Bamba, K. Yoshikawa, Y. Komai, A. Higuchi and Y. Fujiyama, The cytotoxicity of hydrophobic bile acids is ameliorated by more hydrophilic bile acids in intestinal cell lines IEC-6 and Caco-2, Oncol. Rep., 2003, 10, 1931–1936 CAS.
- L. Cicchillitti, P. Fasanaro, P. Biglioli, M. C. Capogrossi and F. Martelli, Oxidative stress induces protein phosphatase 2A-dependent dephosphorylation of the pocket proteins pRb, p107, and p130, J. Biol. Chem., 2003, 278, 19509–19517 CrossRef CAS PubMed.
- H. Ajouz, D. Mukherji and A. Shamseddine, Secondary bile acids: an underrecognized cause of colon cancer, World J. Surg. Oncol., 2014, 12, 1 CrossRef PubMed.
Footnote |
| † Electronic supplementary information (ESI) available. See DOI: https://doi.org/10.1039/d3fo01868g |
| This journal is © The Royal Society of Chemistry 2023 |